 Janne Hakkarainen1*
 Iolanda Ialongo1
 Erik Koene2
 Monika E. Szeląg1
 Johanna Tamminen1
 Gerrit Kuhlmann2
 Dominik Brunner2
- 1Earth Observation Research, Finnish Meteorological Institute, Helsinki, Finland
- 2Laboratory for Air Pollution/Environmental Technology, Swiss Federal Laboratories for Materials Science and Technology (Empa), Dübendorf, Switzerland
Since the Paris Agreement was adopted in 2015, the role of space-based observations for monitoring anthropogenic greenhouse gas (GHG) emissions has increased. To meet the requirements for monitoring carbon dioxide (CO2) emissions, the European Copernicus programme is preparing a dedicated CO2 Monitoring (CO2M) satellite constellation that will provide CO2 and nitrogen dioxide (NO2) observations at 4 km2 resolution along a 250 km wide swath. In this paper, we adapt the recently developed divergence method to derive both CO2 and nitrogen oxide (NOx) emissions of cities and power plants from a CO2M satellite constellation by using synthetic observations from the COSMO-GHG model. Due to its long lifetime, the large CO2 atmospheric background needs to be removed to highlight the anthropogenic enhancements before calculating the divergence. Since the CO2 noise levels are large compared to the anthropogenic enhancements, we apply different denoising methods and compare the effect on the CO2 emission estimates. The annual NOx and CO2 emissions estimated from the divergence maps using the peak fitting approach are in agreement with the expected values, although with larger uncertainties for CO2. We also consider the possibility to use co-emitted NOx emission estimates for quantifying the CO2 emissions, by using source-specific NOx-to-CO2 emission ratios derived directly from satellite observations. In general, we find that the divergence method provides a promising tool for estimating CO2 emissions, alternative to typical methods based on inverse modeling or on the analysis of individual CO2 plumes.
1 Introduction
Using satellite data for estimating carbon dioxide (CO2) emissions from anthropogenic sources has become increasingly important since the Paris Agreement was adopted in 2015, as satellites provide consistent observations with global coverage. The very first study that estimated CO2 emissions from individual power plants using satellite data was published in 2017 (Nassar et al., 2017). Before that, Bovensmann et al. (2010) provided the first theoretical study on monitoring power plant CO2 emissions from space. In recent years, the literature has been rapidly expanding with several new approaches and case studies (e.g., Reuter et al., 2019; Wu et al., 2020; Hakkarainen et al., 2021). One key success element has been the launch of NASA’s CO2 mission, Orbiting Carbon Observatory-2 (OCO-2), in 2014 that has enabled many of these studies, even if its narrow swath (less than 10 km wide) is not optimal for the analysis of anthropogenic signals. Recently, NASA’s OCO-3 instrument, operating on the International Space Station, has been providing Snapshot Area Map (SAM) and target mode measurements for the analysis of emission hot spots like cities and power plants (Kiel et al., 2021).
In Europe, one of the key activities responding to the needs of the Paris Agreement to monitor anthropogenic CO2, is the Copernicus CO2 Monitoring (CO2M) mission (Janssens-Maenhout et al., 2020; Meijer et al., 2020). Currently, a two-to-three-satellite constellation is planned. The first two satellites are to be delivered in October 2025, with the first launch scheduled at the end of 2025. In addition to CO2, the CO2M instrument will measure nitrogen dioxide (NO2) and methane (CH4). The requirement for the spatial resolution is 4 km2 and for the imaging swath larger than 250 km. To support achieving the strict accuracy requirements of the GHG measurements, dedicated aerosol and cloud instruments are added to the payload.
Many of the proposed techniques for estimating CO2 emissions from local sources are based on single satellite overpasses (e.g., Varon et al., 2018). Observations of NO2, co-emitted with CO2, are often used for detecting the emission plume and its shape (e.g., Kuhlmann et al., 2019; Reuter et al., 2019; Hakkarainen et al., 2021). The NO2 signal-to-noise ratio is generally higher compared to CO2 and the NO2 plumes are easier to detect with current satellite instruments owing to their wider satellite swaths. Since the launch of TROPOMI/Sentinel 5p (S5p) in 2017, it has been possible to observe individual NO2 emission plumes from single satellite overpasses (unlike its predecessors).
In comparison to CO2, the lifetime of NO2 is very short (only a few hours) and the signal-to-noise is higher. For these reasons, nitrogen oxide (NOx = NO+NO2) emission areas can be easily identified by averaging satellite NO2 concentrations over a sufficiently long period of time. To estimate NOx emissions from averaged NO2 columns, methods based on the temporal averages of spatially co-located observations are often applied (Fioletov et al., 2015; Beirle et al., 2011, 2019; de Foy et al., 2014). The advantage of these methods is that they do not require complex atmospheric modeling and that they generally provide more robust emission estimates compared to individual satellite overpasses. In addition, these approaches have been successfully applied to instruments and locations, where the individual plumes are not detectable, but the emission signal becomes visible when multiple scenes are averaged (e.g., Ialongo et al., 2021).
Conversely, emission estimation methods based on temporal averaging have not yet been successfully applied to satellite-based observations of column-averaged CO2 dry air mole fraction (XCO2), although this option has been discussed by Hakkarainen et al. (2016) and Hill and Nassar (2019). The main challenges are related to the scarce coverage of current CO2 measurement systems as well as the large background signal. To link the satellite XCO2 observations to anthropogenic sources, we must define the XCO2 anomalies as the difference to a regional background that accounts for the increasing CO2 levels in the atmosphere and its spatio-temporal variability (Hakkarainen et al., 2016, 2019).
In this paper, we discuss the use of methods based on temporal averaging for estimating the CO2 and NOx emissions from satellite observations. In particular, we adapt the divergence method, developed originally for NO2 (Beirle et al., 2019, 2021) to estimate CO2 emissions. The method is applied to the SMARTCARB dataset of synthetic satellite observations, which was produced to closely mimic the CO2 and NO2 observations of the upcoming CO2M mission (Kuhlmann et al., 2020b). In addition, we estimate source-specific NOx-to-CO2 emission ratios for converting the satellite-based estimates of NOx emissions into CO2 emissions.
The paper is organized as follows. Section 2 describes the SMARTCARB dataset and the different emission estimation techniques. In Section 3 we apply the proposed emission estimation methods to the SMARTCARB dataset. We discuss the results in Section 4 and Section 5 concludes the paper.
2 Data and Methods
2.1 SMARTCARB Dataset
The synthetic observations used in this study were created within the ESA-funded SMARTCARB project to prepare for the upcoming CO2M mission. The dataset has been extensively described and used in previous works (Brunner et al., 2019; Kuhlmann et al., 2019, 2020a, 2021), and is openly available (Kuhlmann et al., 2020b).
The synthetic NO2 and CO2 vertical columns are based on atmospheric transport model simulations obtained with the COSMO-GHG model at 1 km by 1 km resolution. The model domain covers parts of Germany, Poland and Czechia for the year 2015. The synthetic data were further averaged to 2 km by 2 km satellite pixels along the 250 km wide swath of simulated CO2M satellite orbits. In this study, we mainly use a constellation setup with two satellites, but we carry out additional tests with one to six satellites. Furthermore, we apply a Gaussian random noise with standard deviation of 1.5 × 10¹⁵ molec./cm2 to the NO2 simulations and 0.5 ppm to the XCO2 simulations. The CO2M mission requirements indicate that the CO2 precision shall be better than 0.7 ppm for vegetation scenario at solar zenith angle of 50 degrees and the NO2 precision better than 1.5 × 10¹⁵ molec./cm2 (Meijer et al., 2020). Figure 1 shows an example of XCO2 observations on a 250 km wide CO2M orbit overlaid with the simulated XCO2 field. The NOx and CO2 emissions used as input in the simulations are summarized in Table 1 for six large point sources and the city of Berlin (Figure 1). Table 1 includes also the annual emissions at 11 UTC, which approximately corresponds to the foreseen satellite overpass time of CO2M over Central Europe.
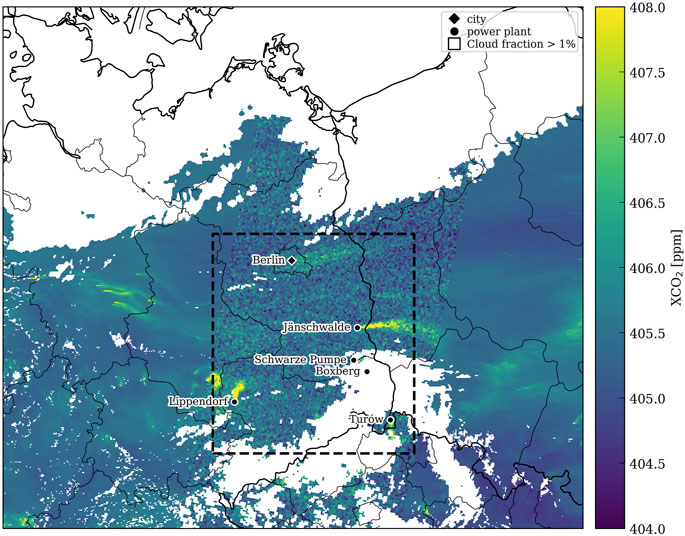
FIGURE 1. Synthetic XCO2 observations on 23 April 2015 over a 250 km wide swath of the planned CO2M instrument (low-noise scenario). Simulated SMARTCARB XCO2 field is illustrated on the background. Missing CO2 measurements (cloud fraction larger than 1%) are shown in white. The black rectangle indicates the study area. The emission sources considered in the analysis (Berlin, Boxberg, Jänschwalde, Lippendorf, Schwarze Pumpe, and Turów) are highlighted.
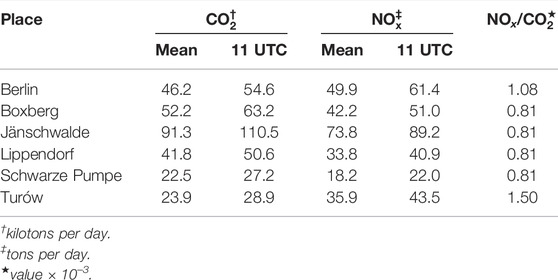
TABLE 1. Summary of the emissions used in the SMARTCARB dataset.
2.2 Divergence Method
Beirle et al. (2019), Beirle et al. (2021) introduced the divergence method to estimate the NOx emissions from TROPOMI NO2 retrievals. Here we provide an overview of the method applied to synthetic CO2M satellite retrievals of both NO2 and CO2 vertical columns. A more comprehensive theoretical discussion is given in the supplementary material, including more details on the different assumptions. The divergence method is based on the continuity equation (Jacob, 1999) at the steady state, where the divergence of vector field F (flux) is defined as the difference between emissions E and sinks S:
The flux F is defined as F = (Fx, Fy) = (V ⋅ u, V ⋅ v), where V is the vertical column density observed by satellite, and u and v are the eastward and northward winds, respectively, at the level of the enhanced concentrations. As discussed by Beirle et al. (2019), the NOx sink can be calculated from the NO2 columns as S = LV/τ, where τ is the NOx lifetime generally assumed as 4 hours (as used also in the SMARTCARB simulations) and L is the constant NOx-to-NO2 ratio (typically assumed as 1.32 as in Beirle et al., 2011, 2019). In the follow-up paper by Beirle et al. (2021), the sink term is neglected due to the uncertainties in the assumed NOx lifetime and only the divergence is analyzed. The divergence method can also be applied to CO2 but since its lifetime is extremely long (in the order of centuries) as compared to NOx, the sink term can be neglected as well.
For the flux calculation we use the wind information from the European Centre for Medium-Range Weather Forecasts (ECMWF) next-generation reanalysis ERA5 dataset (Hoffmann et al., 2019) given at 0.1° ×0.1° grid size resolution. Following the approach by Fioletov et al. (2015), we use the mean value from the layers at 900, 950 and 1000 hPa. For each satellite pixel, we take the closest point from the wind grid and then temporally interpolate the wind values to the measurement time.
As the divergence operator is linear, the divergence can be calculated from the mean Fx and Fy fields as reported by Beirle et al. (2019, 2021). However, due to missing values in the data, the averaging and divergence operators are not entirely commutative. In our analysis, we found that the divergence fields are less affected by missing data if the divergence operator is calculated before averaging, and thus this option was used throughout the paper. Supplementary Figure S1 in the supplement shows an example of the CO2 divergence maps calculated before and after the temporal averaging, with the former option showing less noisy patterns.
The partial derivatives, needed for the divergence ∇ ⋅ F = (∂Fx/∂x, ∂Fy/∂y), are calculated using second-order central differences. For data points along the edges, the partial derivatives are calculated using single-sided differences. To adapt the original divergence approach (Beirle et al., 2019) to long-lived gases, such as CO2, we remove the atmospheric background (e.g., as in Hakkarainen et al., 2016) before calculating the divergence as the flux is not linear with the column V due to the changing wind speed. Thus, before the calculation of the divergence, we derive the XCO2 anomaly
Here we define the background
2.3 Peak Fitting
In order to calculate source-specific emissions from the enhancements in the averaged divergence/emission fields, the peak fitting approach (as in Beirle et al., 2021) can be applied by fitting the following function, including a Gaussian and a linear term:
where A is the estimated source-specific flux. The variables σx and σy describe the width of the two-dimentional Gaussian function, and x0 and y0 indicate the location of the source. The terms mx, my and b define the linear background field. Here we estimate all of the variables mentioned above using the Markov chain Monte Carlo (MCMC) toolbox developed by Laine (2008) (available online at https://mjlaine.github.io/mcmcstat/) using an adaptive Metropolis algorithm (Haario et al., 2001). We also estimate the statistical noise of the averaged divergence field using MCMC. The fitted parameters are estimated as the mean values of the posterior distribution and the fitting uncertainties as the standard deviation.
2.4 Exponentially-Modified Gaussian Method
As an alternative to the divergence method, we estimate the NOx emissions also by fitting the synthetic observations with the exponentially-modified Gaussian (EMG) function (Beirle et al., 2011). Before fitting, we apply the wind rotation technique (Fioletov et al., 2015) by rotating each pixel around the point source according to the wind direction so that all scenes have wind direction from west to east. The resulting rotated mean field is then integrated along the latitudinal dimension to derive the NO2 line densities. Those are then fitted with a 1D EMG model M (as in Beirle et al., 2011) as follows:
Here Q is the emission factor (E = Q × u), B is the background (both given in molec./m), u is the effective wind speed, and (e*G)(x) is the convolution between the Gaussian function G and the exponential decay
The variable X is the distance along the wind direction between the line density peak and the point source. The NOx lifetime can be obtained by dividing the e-folding distance d with the mean wind speed as τ = d/u. We estimate all together five parameters: Q, B, X, d, and the width of the Gaussian function. For the estimation of the parameters, we use the MCMC approach described in Section 2.3. The uncertainties related to this method have been discussed extensively in the literature (e.g., Beirle et al., 2011; Fioletov et al., 2015; Goldberg et al., 2019).
2.5 Source-Specific NOx-to-CO2 Emission Ratios
Since the signal-to-noise ratio for NO2 is higher than that for CO2, it is generally easier to estimate NOx emissions than CO2 emissions from satellite observations. In addition, NO2 retrievals are less affected by the presence of clouds and more observations can be acquired. Thus, the CO2 emissions can also be estimated by scaling the NOx emissions obtained using the divergence method or the EMG fitting with a source-specific NOx-to-CO2 ratio. On the other hand, NOx emissions depend on assumptions on the lifetime and the conversion from NO2 to NOx, that are not needed for CO2.
Here we derive the NOx-to-CO2 emission ratio by calculating the NO2-to-CO2 ratios r(x) at multiple transects along matching NO2 and CO2 plumes (see Section 3.3). We calculate r(x) using linear fit between NO2 and CO2 columns at each transect. We then fit an exponential decay function (similarly to Kuhlmann et al., 2021):
where r0 is the estimated NOx-to-CO2 emission ratio, u is the mean wind speed and τ is the lifetime. As noted by Kuhlmann et al. (2021), it is not always feasible to fit the exponential decay to the data if the number of transect is too small. In those cases, we take into account the value of the ratio at the transects near the source. This method is adapted from the approach proposed by Hakkarainen et al. (2021), where the NOx-to-CO2 emission ratios were derived from TROPOMI NO2 and OCO-2 CO2 observations at Matimba Power Station in South Africa. In that case, due to the narrow swath of OCO-2 observations, one cross-section per plume was used. If the entire plume is visible from the satellite observations, as for several orbits in the synthetic CO2M observations, we can calculate the ratios at multiple transects along the plume.
2.6 Denoising
The computation of the divergence is sensitive to systematic and random errors (see, e.g., Beirle et al., 2021). In this synthetic case study, particular errors are the single-sounding precision errors added to the data (see Section 2.1), and errors in the estimated effective wind fields. The temporal averaging of the divergence computations partially overcomes the influence of random errors, and the averaging increases the signal-to-noise ratio of the divergence map. However, we can additionally “denoise” the total vertical column density fields using computer vision techniques (Koene et al., 2021). In this study we analyse two denoising methods that are described shortly below.
A relatively simple technique for denoising is a mean filter. Here, we spatially convolve a gridded total vertical column density image V(x, y, t) with an N × N kernel
effectively computes a filtered image based on the average of 3 × 3 regions in V(x, y, t). The expectation is that the mean filter suppresses random noise, varying from pixel to pixel. On the other hand, some signal will be lost in the process. In this paper, we refer to the filter of Eq. 7 as “mean filter 9.” We additionally considered the 5 × 5 kernel K25 as “mean filter 25.”
An alternative denoising technique we applied exploits the colocated CO2 and NO2 observations in the synthetic CO2 images. It is based on a method called block-matching and 3D filtering, or BM3D (Dabov et al., 2007), which performs around the upper bound of possible performance that a denoising technique can achieve (Levin and Nadler, 2011). In short, BM3D works by denoising an image patch-wise in two steps. First, 3D blocks are formed of similar-looking patches, which are collaboratively denoised using a hard thresholding step, and the collaboratively denoised patches are re-aggregated into an initial estimate of the denoised image. The second step takes place the same way, except that the hard thresholding is replaced with a Wiener filter based on the initially denoised image, with respect to a user-specified denoising level σBM3D. We refer to Dabov et al. (2007) and Lebrun (2012) for further details. A notable extension is that we set up BM3D to consider the joint information present in CO2 and NO2 images, by normalizing the two images to the same dynamic range and then linearly adding 0.75 times the scaled CO2 image with 0.25 times the scaled NO2 image, to form a joint image. The locations of the selected similar-looking patches were established in this joint image; while the denoising took place for both this joint image and an image consisting of 0.75 times the CO2 image minus 0.25 times the scaled NO2 image. After adding the two denoised images and rescaling, we obtain a new CO2 image, while the filtering was helped by the higher signal-to-noise ratio of the NO2 images during the patch selection and denoising steps. In this paper, we refer to “BM3D σBM3D,” for example “BM3D 5,” to indicate denoised images using a specified noise level in the Wiener filter.
3 Results
3.1 Divergence Method
Figure 2 illustrates the CO2 divergence calculated from the CO2 synthetic observations for the year 2015 simulated by the COSMO-GHG model in an optimal case without presence of noise or background field. We consider model simulations at 11:00 UTC assuming clear-sky conditions gridded at 0.05°×0.05° resolution. The largest point sources (Table 1), such as the individual power stations (Boxberg, Jänschwalde, Lippendorf, Schwarze Pumpe, and Turów) and the city of Berlin are visible as enhancements in the divergence map.
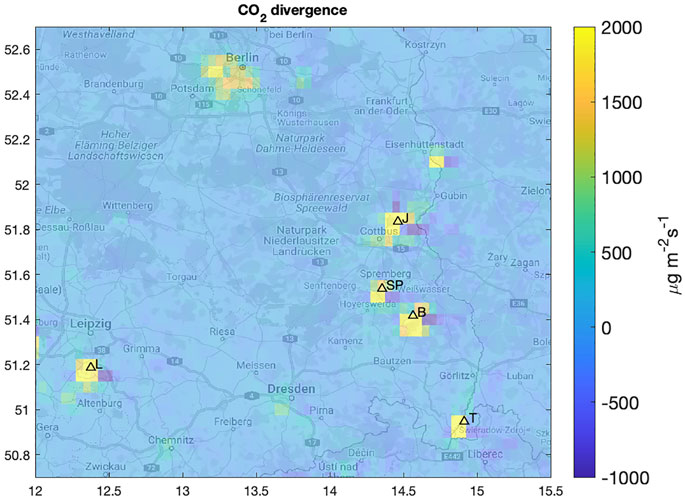
FIGURE 2. CO2 divergence calculated from the COSMO-GHG model simulations. Only anthropogenic enhancements are considered. Positive values correspond to strong emissions sources such as power stations (Boxberg, Jänschwalde, Lippendorf, Schwarze Pumpe, and Turów marked with B, J, L, SP, and T, respectively) and the city of Berlin.
In practice, the situation is more complicated than illustrated in Figure 2 as several aspects affect the divergence calculation. For example, the amount of available data can be reduced due to the limited coverage of satellite observations and the persistence of cloudy conditions. The effect of clouds is more restricting for CO2, as compared to NOx, since almost completely clear sky conditions are needed for a successful CO2 retrieval, while partially cloudy conditions (cloud fraction smaller than 30%) are considered suitable for reliable NO2 retrievals. In addition, the calculation of the CO2 divergence requires removing the background (about 400 ppm), with the anthropogenic enhancements in the order of 1 ppm. The highest challenge is posed by the instrument noise.
To mimic the analysis of satellite observations we consider different constellation options from the SMARTCARB dataset. The divergence is calculated for the full year 2015 with data filtering for cloud free conditions. Supplementary Figure S2 in the supplement shows the CO2 divergence calculated for constellations with one up to six satellites. For the remaining part of this paper, we will use the setup with two satellites shown in Supplementary Figure S2B.
Figure 3 illustrates the divergence calculated with different model setups. Figure 3A shows the NOx divergence calculated from simulations with added noise (standard deviation 1.5 × 10¹⁵ molec./cm2), without any background removal and with cloud fraction smaller than 0.3. Figure 3B shows the CO2 divergence based on simulations without presence of background or noise, and with cloud fraction limit 0.01. Both NOx and CO2 divergence maps have similar spatial features, with enhancements close to the main emission sources, but the CO2 fields are noisier and less sharp, as expected due to the longer lifetime and the more restrictive cloud fraction limit which reduces the number of available observations (Supplementary Figure S3 in the supplement). Figure 3C shows the CO2 divergence map after adding artificial noise (standard deviation 0.5 ppm) to the simulations. Figure 3D shows the CO2 divergence after adding the simulated background and subsequently removing it by calculating the anomaly as the difference from the background (i.e. the median for each orbit over the area covered in Figure 3). The noise addition has much larger effect to the divergence patterns than the background addition (and removal). Figure 3E combines Figures 3C,D, including both the noise and the background (and its removal). Finally, in Figure 3F the XCO2 data are denoised by using a mean filter with constant 5-by-5 kernel before removing the background and calculating the CO2 divergence. After denoising the data, the CO2 divergence patterns in Figure 3F are similar to Figure 3B and Figure 3D. The effect of denoising is further discussed in Section 3.2. To calculate emission estimates for individual point sources we apply the peak fitting approach described in Section 2.3. For CO2 we use the divergence map shown in Figure 3F, that includes the denoised data (with background removed) that would be available from a two-satellite constellation. We are able to calculate the CO2 emission values for all the major sources in the area except for Turów Power Station, which does not appear as a point source in Figure 3F. For NOx we fit the peaks from the emission map given as the sum of the divergence and the sink terms (Supplementary Figure S4).
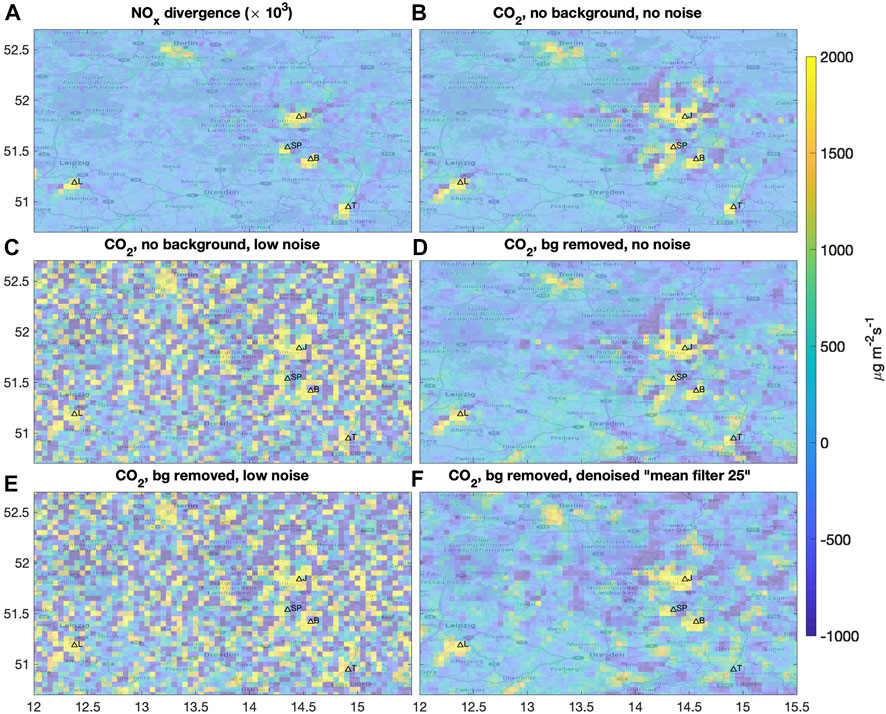
FIGURE 3. Divergence calculated with various setups. (A) shows the NOx divergence and (B–F) the CO2 divergence. The different setups are indicated in the title of each panel.
Figure 4 shows the comparison between the NOx and CO2 emissions estimates derived using peak fitting and the annual mean of the emissions at 11 UTC used as input in the model simulations for each source (orange symbols). The emission estimates are also presented in Table 2. The emission values sit generally close to the 1:1 line, with high correlation (correlation coefficients R = 0.94 and R = 0.97 for NOx and CO2, respectively) between our estimates and the 11 UTC emissions used as model input. Some differences can be related to the differences in emissions during different seasons which might be not homogeneously sampled.
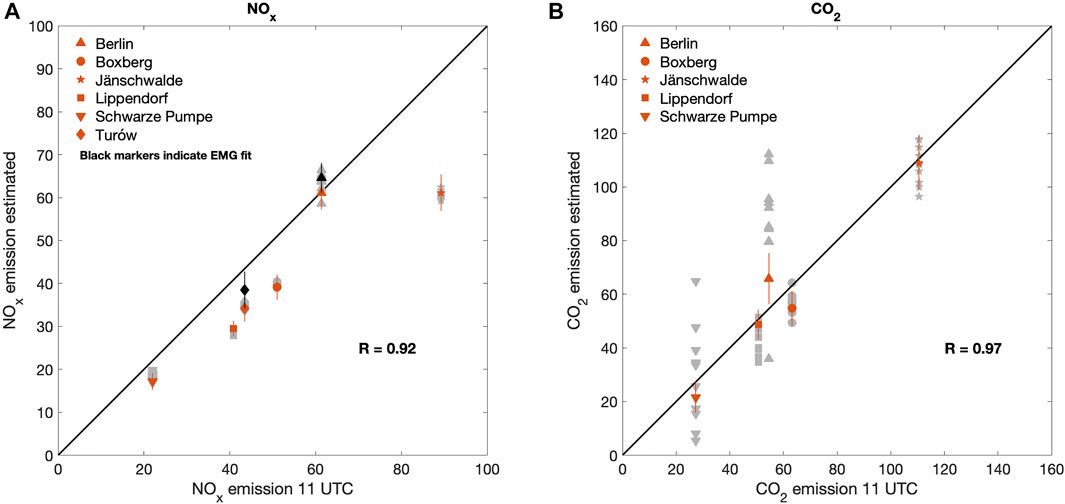
FIGURE 4. Source-specific emissions for NOx (A) and CO2 (B). Orange symbols indicate the emissions calculated from the CO2 divergence map shown in Figure 3F (denoised and with background removed) and from the NOx emission map shown in the Supplement (Supplementary Figure S4) using peak fitting. Grey symbols indicate emission values calculated with different realization of the measurement noise. Black markers show the NOx emissions derived from the EMG fit for the Turów power station and the city of Berlin.

TABLE 2. Summary of the estimated emissions.
To study the effect of the instrumental noise on the emission estimates, we sampled different realisations of the random noise for creating the observation error. The effect of the noise is rather small for the NOx emission estimates, while it is more pronounced for CO2, as shown in Figure 3. The different emission estimates (after denoising) are presented as grey symbols in Figure 4. The largest variability due to different random noise can be found for the city of Berlin (emission estimates ranging from 36 to 112 kton/day) and for Schwarze Pumpe power station (5–65 kton/day). Supplementary Figure S5 in the supplement shows two examples of the CO2 divergence map with two different sets of random noise corresponding to very different outcomes in terms of emission estimates. Supplementary Figure S5A corresponds to CO2 emission estimates of 36 kton/day for Berlin and 65 kton/day for Schwarze Pumpe, while in Supplementary Figure S5B Schwarze Pumpe CO2 emissions are much smaller (5 kton/day) and the Berlin CO2 emissions are about 85 kton/day.
The error bars in Figure 4 correspond to the fitting error (standard deviation of the posterior distribution) calculated using the MCMC sampling. This fitting error is only a statistical error estimate that describes how well the 2D Gaussian model fits the divergence/emission fields. Thus, the fitting error is likely to underestimate the true error as it does not include any systematic component.
The NOx emissions can be also estimated by using the EMG method described in Section 2.4. This method is suitable for relatively isolated sources and it can be challenging to apply in the presence of strong neighboring sources. Dedicated algorithms have been developed to deal with this issue (Fioletov et al., 2017; Verstraeten et al., 2018; Liu et al., 2022). Here we apply the wind rotation technique around each source (Fioletov et al., 2015) and calculate the NOx line densities. We obtain a successful fit to estimate the emissions only for the city of Berlin and Turów Power Station, which are both relatively distant from the other sources in the area of study. The resulting NOx emission estimates for Berlin and Turów are 64.6 ± 3.5 ton/day and 38.5 ± 4.3 ton/day, respectively (Figure 4, black symbols). The estimates based on EMG fitting agree within the uncertainties with the emission estimates obtained from peak fitting from the emission maps. We also estimate the NOx lifetime for Berlin and Turów as 1.9 ± 0.2 h and 1.7 ± 0.3 h, respectively. These values are about 50% lower than the lifetime used in the SMARTCARB simulations (4 h). The underestimation of NOx lifetime using the wind rotation and EMG approach was also found by de Foy et al. (2014).
3.2 Effect of Denoising
As shown in Figure 3, denoising is an essential step when estimating the emissions from the CO2 divergence fields. In Figure 4, we used a simple denoising based on a mean filter with constant 5-by-5 kernel. To further analyze the effect of denoising, we test also the BM3D method with various denoising parameters (σBM3D = 4, 8, 10, 15, 30) as well as the mean filter with 3-by-3 kernel before the calculation of the CO2 divergence (Figure 5). As expected, increasing the denoising parameter σBM3D in the BM3D method leads to increasingly smoother divergence fields. Overall, the denoising with σBM3D = 15 (Figure 5D) produces similar patterns than the mean filter 25 (Figure 3F). The mean filter 9 (with 3-by-3 kernel, Figure 5F) remains quite noisy.
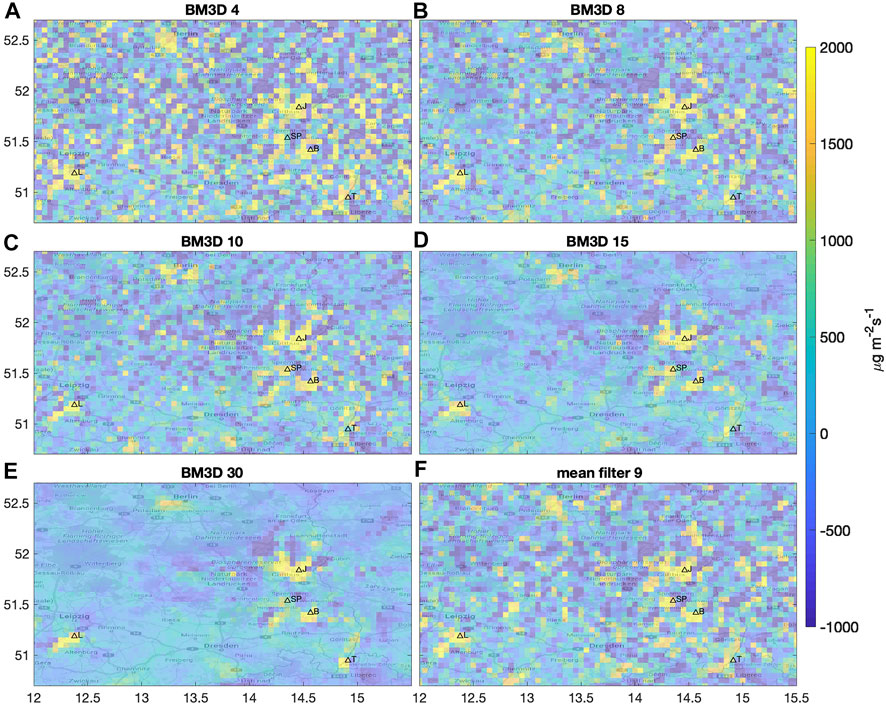
FIGURE 5. CO2 divergence calculated with different denoising methods. The different setups are indicated in the title of each panel. We tested the BM3D method with various denoising parameters (σBM3D = 4, 8, 10, 15, 30) as well as the mean filter with 3-by-3 kernel. See also Figure 3 for comparison.
Figure 6 shows the comparison between the CO2 emission estimates from peak fitting and the emissions at 11 UTC used as input in the model simulations with different setups for denoising. Here we use the same realization of the instrumental noise to test the effect of different denoising approaches. The emission estimates for Berlin show quite a large spread, while for the Schwarze Pumpe power station the spread is relatively smaller excluding one outlier (BM3D with σBM3D = 30). The correlation between the CO2 emissions estimates from peak fitting and the assumed emissions is generally high, but the overestimation of the emissions for Berlin causes the correlation coefficients to become lower when the BM3D denoising method is applied. Figure 6 also show the CO2 emission estimates in the cases where no noise and no CO2 background are considered as well as the case where no denoising is applied.
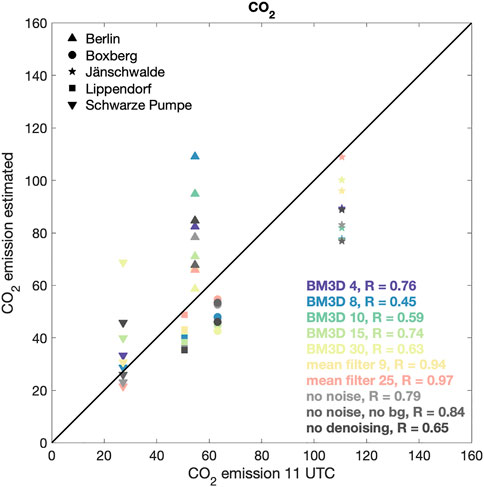
FIGURE 6. Source-specific CO2 emissions calculated with different denoising methods (shown as different colors). See Figures 3, 5 for the corresponding divergence maps.
3.3 Source-Specific Emission Ratios
As alternative to the divergence approach, we also derive the CO2 emissions by converting NOx into CO2 emissions, using a source-specific NOx-to-CO2 emission ratio calculated as described in Section 2.5. For each emission source listed in Table 1 we plot all the available overpasses from the SMARTCARB dataset and calculate the cross-sectional NO2-to-CO2 ratios along each observable plume (Hakkarainen et al., 2019, 2021). The ratios are calculated over several (0.1 degrees wide) transects perpendicular to the plume direction (white lines in Figure 7), located at regular distance downwind from the source (0.025 degrees intervals starting at 0.05 degrees from the source). We then fit the NO2-to-CO2 ratios using the exponential decay function (Eq. 6) to derive the NOx-to-CO2 emission ratio at the source as described in Section 2.5. Figure 7 shows an example of this approach for the Jänschwalde power station. In general, fitting an exponential decay to noisy data is challenging, and the estimates are highly influenced by the values near the emission source. This could potentially be an issue with real NO2 satellite observations, if the NO emissions are not yet fully oxidised near the source.
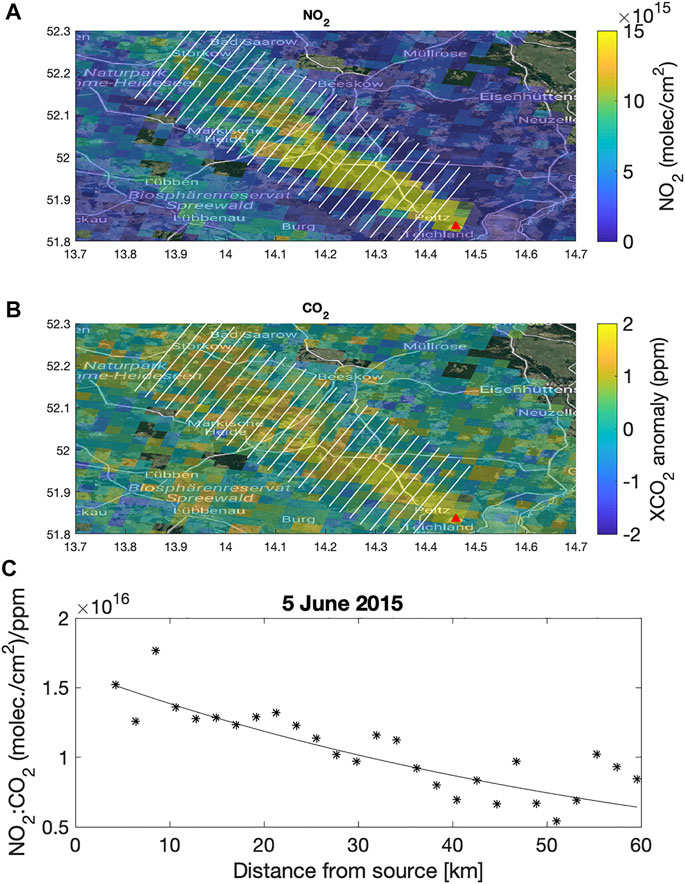
FIGURE 7. Example of the calculation of source-specific NOx-to-CO2 emission ratio for Jänschwalde power station on 5 June 2015. Panel (A) and (B) show the NO2 and CO2 plumes. Panel (C) shows the cross-sectional NO2-to-CO2 ratio calculated over several transects [white lines in panels (A) and (B)], located at regular distance downwind from the source. Black symbols and line indicate the ratios and the corresponding exponential decay, respectively.
Figure 8 includes the mean NOx-to-CO2 emission ratios obtained averaging the results from multiple plumes for each power station. In all cases, the true emission value is within the one-sigma error. The main challenge of this approach is the limited number of plumes available to derive the ratios. The estimation process was the most robust for the Jänschwalde power station, which has the largest CO2 emissions in the area of study and several (13) detectable plumes available for the calculation of the ratios. On the other hand, we were able to identify only four plumes for Turów power station, which showed large variability, especially due to the low CO2 signal compared to NO2. Turów has the largest NOx-to-CO2 emission ratio, which appears to be captured by our estimates despite the large variability. We attempted a similar approach also for the city of Berlin, but it was difficult do identify clear CO2 emission plumes from noisy simulations mainly because Berlin has to be considered as an area source, rather than a point source, and our results remained inconclusive.
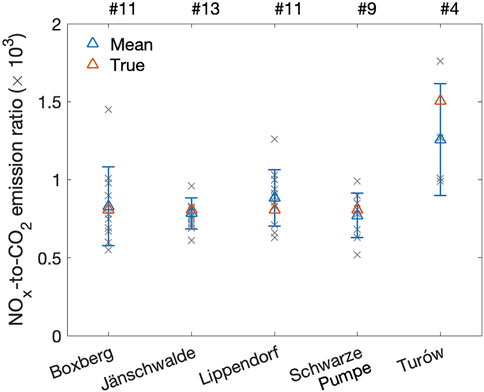
FIGURE 8. Source-specific NOx-to-CO2 emission ratios for each power station. Grey symbols indicate estimates from individual plumes while blue symbols show the mean value and the standard deviation. Orange symbols indicate the true emission ratio. The number of plumes analyzed are indicated above the figure.
Table 2 summarizes the NOx and CO2 emission values presented in Figure 3 and the mean NOx-to-CO2 emission ratios from Figure 8. The last column, includes the CO2 emissions when the NOx emissions obtained from peak fitting are converted into CO2 emissions using the source-specific NOx-to-CO2 emission ratios. Overall, the results showed in Table 2 are mostly in agreement (within the uncertainties) with the emission values used as input in the simulations (Table 1). We note that systematic errors are not taken into account in the uncertainties. If the source-specific NOx-to-CO2 emission ratios are obtained with the same dataset as the NOx emissions, possible biases in the NO2 observations or the assumed constant NOx-to-NO2 ratio cancels out when the estimated ratios are applied to convert the NOx emissions to CO2 emissions.
4 Discussion
We showed how the divergence method developed for estimating NOx emissions from satellite observations can be applied to CO2 retrievals that will become available from the upcoming CO2M mission. There are several aspects that make the analysis of the CO2 divergence more difficult than for NOx. For example:
1) CO2 has a long atmospheric lifetime which complicates the analysis and makes the divergence fields more blurry and causes mixing of the plume signal;
2) CO2 has a large atmospheric background (of about 400 ppm, compared to the enhancements of about 1–3 ppm) that has to be removed before the divergence method can be applied;
3) CO2 has a larger variety of sources and sinks;
4) The effect of clouds is more restricting for CO2, as compared to NOx, since almost completely clear sky conditions are needed for a successful CO2 retrieval;
5) The CO2 noise levels are large (0.5–1 ppm) compared to the anthropogenic enhancements and a denoising method has to be applied before the divergence can be calculated.
On the other hand, due to the long lifetime of CO2, the sink term in Eq. 1 does not need to be accounted for and no assumptions on the lifetime need to be made.
The approach presented here can be extended to other regions or at global scale, which would require different considerations for the choice of the background. The source identification and peak fitting procedure can also be automated as described in previous studies (Fioletov et al., 2016; Beirle et al., 2021; Finch et al., 2022; Lauvaux et al., 2022). A different formulation of the divergence method has been also applied to TROPOMI methane observations (Liu et al., 2021). In principle, the divergence method could be applied to high-resolution retrievals that will become available from the upcoming MethaneSat and CarbonMapper instruments, assuming persistent emissions and sufficient spatio-temporal coverage. On the other hand, such high-resolution observations already have the capability to detect anthropogenic enhancements and methods based on the analysis of individual plumes might be more suitable for estimating emissions.
Several studies in the literature have suggested the use of co-emitted NO2 observations to guide the detection of CO2 emission plumes (e.g., Reuter et al., 2019; Kuhlmann et al., 2021) or to convert NOx to CO2 emissions using NOx-to-CO2 emission ratios (e.g., Liu et al., 2020; Hakkarainen et al., 2021). In this work we tested the latter approach and we were able to compute the source-specific NOx-to-CO2 emission ratio for all the power stations analyzed, but not for the city of Berlin. This allowed us to estimate CO2 emissions also for the Turów power station, while it was not possible with the divergence method and peak fitting. In the case of Turów, the NOx-to-CO2 emission ratio was however based on a limited number (4) of plumes which produces a larger statistical uncertainty. In general, analysing NOx-to-CO2 emission ratios is quite challenging due to the large uncertainties, as also noted by Kuhlmann et al. (2021). Additional challenges are posed by the fact that the NOx-to-CO2 emission ratios might not be constant in time. In general, the NOx emissions are decreasing faster than the CO2 emissions due to the implementation of cleaner technologies (in terms of NOx emissions), corresponding to decreasing NOx-to-CO2 emission ratios. This can be an issue also when considering emission ratios from slowly updating emission inventories. Furthermore, even when the NOx emissions can be successfully estimated from (also quite small) emission sources, it can be challenging to obtain the NOx-to-CO2 emission ratios from the same space-based observations due to lack of detectable matching NO2 and CO2 plumes.
The emissions estimated from individual plumes correspond to the specific time at which the plume is observed and a factor accounting for changing conditions (such as the seasonal cycle) should be taken into account to derive annual values (Kuhlmann et al., 2020a, 2021). In principle, approaches based on temporal averaging like the divergence method do represent the mean conditions over a defined period of time, but the available observations might be scarce or unevenly distributed temporally and spatially. In any case, satellite observations from passive instruments will correspond to clear-sky conditions at the time of the satellite overpass, which means that few observations will be available under persistent cloudy conditions (e.g., in the winter), and no observations will be available during night-time.
An advantage of the divergence method is that it enables the detection of relatively small emission sources that could not be easily detected using individual plumes. In addition, the divergence method allows us to distinguish nearby sources that would be challenging to analyse using a simple method based on EMG fitting. On the other hand, a longer averaging period is required to detect a clear enhancement and to obtain a successful emission estimate from the divergence mean fields, as compared to the EMG fitting.
5 Summary
In this paper we demonstrated how anthropogenic CO2 emissions may be estimated from (synthetic) satellite observations using the divergence method, originally developed for short-lived gases. We found that the divergence method applied to the CO2M synthetic observations provided robust estimates of the NOx emissions for non-isolated sources (as highlighted by Beirle et al., 2019, 2021), even though the swath of the upcoming CO2M satellites will be much narrower (∼250 km) than the current TROPOMI swath (∼2,400 km). In general, the CO2M mission requirements are not dictated by applications based on temporal averaging, but are mostly designed to detect individual emission plumes. We found that the estimated CO2 emissions are in agreement with the expected values, although with larger uncertainties compared to NOx.
From a technical point of view, denoising the CO2 observations before calculating the divergence is necessary to identify the emission sources from the divergence maps. The source-specific CO2 emission estimates can vary depending on the denoising method applied. We noted that calculating the divergence before averaging rather than the reverse (as done in previous studies), reduces the effect of missing data and produces less noisy spatial patterns. The NOx emission estimates derived by fitting the exponentially-modified Gaussian function are in excellent agreement with the divergence method, although the NOx lifetime is underestimated (about 50% lower) as compared to the expected lifetime of 4 hours used in the SMARTCARB simulations. Overall, the divergence method offers a valuable tool for estimating CO2 emissions from point sources, along with approaches based on inverse modeling and individual plume analysis (e.g., mass balance).
Data Availability Statement
Publicly available datasets were analyzed in the study. This data can be found here: https://doi.org/10.5281/zenodo.4048228.
Author Contributions
JH and II conducted the analysis and wrote the first draft. EK assisted in the analysis, provided the denoising algorithm and texts related to denoising and divergence method theory. MS provided input for analysing the NOx-to-CO2 emission ratios. JT coordinated the work in the CoCO2 project (Task 4.2). GK and DB provided critical expertise on the SMARTCARB dataset. All authors provided comments and input to the final version of the manuscript.
Funding
The team acknowledge funding from the H2020 project CoCO2 (grant no. 958927). The FMI team also acknowledge the funding and support from the ESA-funded DACES project. The synthetic dataset used in this study was created in the ESA-funded SMARTCARB project. Funding from the Academy of Finland is also acknowledged (grant numbers 336798, 337552 and 331829).
Conflict of Interest
The authors declare that the research was conducted in the absence of any commercial or financial relationships that could be construed as a potential conflict of interest.
Publisher’s Note
All claims expressed in this article are solely those of the authors and do not necessarily represent those of their affiliated organizations, or those of the publisher, the editors and the reviewers. Any product that may be evaluated in this article, or claim that may be made by its manufacturer, is not guaranteed or endorsed by the publisher.
Supplementary Material
The Supplementary Material for this article can be found online at: https://www.frontiersin.org/articles/10.3389/frsen.2022.878731/full#supplementary-material
References
Beirle, S., Boersma, K. F., Platt, U., Lawrence, M. G., and Wagner, T. (2011). Megacity Emissions and Lifetimes of Nitrogen Oxides Probed from Space. Science 333, 1737–1739. doi:10.1126/science.1207824
Beirle, S., Borger, C., Dörner, S., Eskes, H., Kumar, V., de Laat, A., et al. (2021). Catalog of NOx Emissions from Point Sources as Derived from the Divergence of the NO2 Flux for TROPOMI. Earth Syst. Sci. Data 13, 2995–3012. doi:10.5194/essd-13-2995-2021
Beirle, S., Borger, C., Dörner, S., Li, A., Hu, Z., Liu, F., et al. (2019). Pinpointing Nitrogen Oxide Emissions from Space. Sci. Adv. 5. doi:10.1126/sciadv.aax9800
Bovensmann, H., Buchwitz, M., Burrows, J. P., Reuter, M., Krings, T., Gerilowski, K., et al. (2010). A Remote Sensing Technique for Global Monitoring of Power Plant CO2 Emissions from Space and Related Applications. Atmos. Meas. Tech. 3, 781–811. doi:10.5194/amt-3-781-2010
Brunner, D., Kuhlmann, G., Marshall, J., Clément, V., Fuhrer, O., Broquet, G., et al. (2019). Accounting for the Vertical Distribution of Emissions in Atmospheric CO2 Simulations. Atmos. Chem. Phys. 19, 4541–4559. doi:10.5194/acp-19-4541-2019
Dabov, K., Foi, A., Katkovnik, V., and Egiazarian, K. (2007). Image Denoising by Sparse 3-D Transform-Domain Collaborative Filtering. IEEE Trans. Image Process. 16, 2080–2095. doi:10.1109/TIP.2007.901238
de Foy, B., Wilkins, J. L., Lu, Z., Streets, D. G., and Duncan, B. N. (2014). Model Evaluation of Methods for Estimating Surface Emissions and Chemical Lifetimes from Satellite Data. Atmos. Environ. 98, 66–77. doi:10.1016/j.atmosenv.2014.08.051
Finch, D. P., Palmer, P. I., and Zhang, T. (2022). Automated Detection of Atmospheric NO2 Plumes from Satellite Data: A Tool to Help Infer Anthropogenic Combustion Emissions. Atmos. Meas. Tech. 15, 721–733. doi:10.5194/amt-15-721-2022
Fioletov, V. E., McLinden, C. A., Krotkov, N., Li, C., Joiner, J., Theys, N., et al. (2016). A Global Catalogue of Large SO2 Sources and Emissions Derived from the Ozone Monitoring Instrument. Atmos. Chem. Phys. 16, 11497–11519. doi:10.5194/acp-16-11497-2016
Fioletov, V. E., McLinden, C. A., Krotkov, N., and Li, C. (2015). Lifetimes and Emissions of SO2 from Point Sources Estimated from OMI. Geophys. Res. Lett. 42, 1969–1976. doi:10.1002/2015GL063148
Fioletov, V., McLinden, C. A., Kharol, S. K., Krotkov, N. A., Li, C., Joiner, J., et al. (2017). Multi-Source SO2 Emission Retrievals and Consistency of Satellite and Surface Measurements with Reported Emissions. Atmos. Chem. Phys. 17, 12597–12616. doi:10.5194/acp-17-12597-2017
Goldberg, D. L., Lu, Z., Streets, D. G., de Foy, B., Griffin, D., McLinden, C. A., et al. (2019). Enhanced Capabilities of TROPOMI NO2: Estimating NOX from North American Cities and Power Plants. Environ. Sci. Technol. 53, 12594–12601. doi:10.1021/acs.est.9b04488
Haario, H., Saksman, E., and Tamminen, J. (2001). An Adaptive Metropolis Algorithm. Bernoulli 7, 223. doi:10.2307/3318737
Hakkarainen, J., Ialongo, I., Maksyutov, S., and Crisp, D. (2019). Analysis of Four Years of Global XCO2 Anomalies as Seen by Orbiting Carbon Observatory-2. Remote Sens. 11, 850. doi:10.3390/rs11070850
Hakkarainen, J., Ialongo, I., and Tamminen, J. (2016). Direct Space‐Based Observations of Anthropogenic CO2 Emission Areas from OCO‐2. Geophys. Res. Lett. 43, 11,400–11,406. doi:10.1002/2016GL070885
Hakkarainen, J., Szeląg, M. E., Ialongo, I., Retscher, C., Oda, T., and Crisp, D. (2021). Analyzing Nitrogen Oxides to Carbon Dioxide Emission Ratios from Space: A Case Study of Matimba Power Station in South Africa. Atmos. Environ. X 10, 100110. doi:10.1016/j.aeaoa.2021.100110
Hill, T., and Nassar, R. (2019). Pixel Size and Revisit Rate Requirements for Monitoring Power Plant CO2 Emissions from Space. Remote Sens. 11, 1608. doi:10.3390/rs11131608
Hoffmann, L., Günther, G., Li, D., Stein, O., Wu, X., Griessbach, S., et al. (2019). From ERA-Interim to ERA5: The Considerable Impact of ECMWF's Next-Generation Reanalysis on Lagrangian Transport Simulations. Atmos. Chem. Phys. 19, 3097–3124. doi:10.5194/acp-19-3097-2019
Ialongo, I., Stepanova, N., Hakkarainen, J., Virta, H., and Gritsenko, D. (2021). Satellite-Based Estimates of Nitrogen Oxide and Methane Emissions from Gas Flaring and Oil Production Activities in Sakha Republic, Russia. Atmos. Environ. X 11, 100114. doi:10.1016/j.aeaoa.2021.100114
Jacob, D. J. (1999). Introduction to Atmospheric Chemistry. Princeton, New Jersey: Princeton University Press.
Janssens-Maenhout, G., Pinty, B., Dowell, M., Zunker, H., Andersson, E., Balsamo, G., et al. (2020). Toward an Operational Anthropogenic CO2 Emissions Monitoring and Verification Support Capacity. Bull. Am. Meteorological Soc. 101, E1439–E1451. doi:10.1175/BAMS-D-19-0017.1
Kiel, M., Eldering, A., Roten, D. D., Lin, J. C., Feng, S., Lei, R., et al. (2021). Urban-Focused Satellite CO2 Observations from the Orbiting Carbon Observatory-3: A First Look at the Los Angeles Megacity. Remote Sens. Environ. 258, 112314. doi:10.1016/j.rse.2021.112314
Koene, E., Brunner, D., Kuhlmann, G., Hakkkarainen, J., Le Brazidec, J. D., and Broque, G. (2021). Documentation of Plume Detection and Quantification Methods. Tech. Rep., Empa. CoCO2: Prototype System for a Copernicus CO2 Service. ECMWF. Available on https://www.coco2-project.eu/sites/default/files/2022-03/CoCO2-D4-3-V1-0.pdf.
Kuhlmann, G., Broquet, G., Marshall, J., Clément, V., Löscher, A., Meijer, Y., et al. (2019). Detectability of CO2 Emission Plumes of Cities and Power Plants with the Copernicus Anthropogenic CO2 Monitoring (CO2M) Mission. Atmos. Meas. Tech. 12, 6695–6719. doi:10.5194/amt-12-6695-2019
Kuhlmann, G., Brunner, D., Broquet, G., and Meijer, Y. (2020a). Quantifying CO2 Emissions of a City with the Copernicus Anthropogenic CO2 Monitoring Satellite Mission. Atmos. Meas. Tech. 13, 6733–6754. doi:10.5194/amt-13-6733-2020
[Dataset] Kuhlmann, G., Clément, V., Marshall, J., Fuhrer, O., Broquet, G., Schnadt-Poberaj, C., et al. (2020b). Synthetic XCO2, CO and NO2 Observations for the CO2M and Sentinel-5 Satellites. Zenodo. doi:10.5281/zenodo.4048228
Kuhlmann, G., Henne, S., Meijer, Y., and Brunner, D. (2021). Quantifying CO2 Emissions of Power Plants with CO2 and NO2 Imaging Satellites. Front. Remote Sens. 2, 14. doi:10.3389/frsen.2021.689838
Laine, M. (2008). Adaptive MCMC Methods with Applications in Environmental and Geophysical Models. Helsinki, Finland: Finnish Meteorological Institute Contributions.
Lauvaux, T., Giron, C., Mazzolini, M., d’Aspremont, A., Duren, R., Cusworth, D., et al. (2022). Global Assessment of Oil and Gas Methane Ultra-Emitters. Science 375, 557–561. doi:10.1126/science.abj4351
Lebrun, M. (2012). An Analysis and Implementation of the BM3D Image Denoising Method. Image Process. Line 2, 175–213. doi:10.5201/ipol.2012.l-bm3d
Levin, A., and Nadler, B. (2011). “Natural Image Denoising: Optimality and Inherent Bounds,” in CVPR 2011, Colorado Springs, CO, USA, 20-25 June 2011 (Piscataway, New Jersey: IEEE), 2833–2840. doi:10.1109/cvpr.2011.5995309
Liu, F., Duncan, B. N., Krotkov, N. A., Lamsal, L. N., Beirle, S., Griffin, D., et al. (2020). A Methodology to Constrain Carbon Dioxide Emissions from Coal-Fired Power Plants Using Satellite Observations of Co-Emitted Nitrogen Dioxide. Atmos. Chem. Phys. 20, 99–116. doi:10.5194/acp-20-99-2020
Liu, F., Tao, Z., Beirle, S., Joiner, J., Yoshida, Y., Smith, S. J., et al. (2022). A New Method for Inferring City Emissions and Lifetimes of Nitrogen Oxides from High-Resolution Nitrogen Dioxide Observations: A Model Study. Atmos. Chem. Phys. 22, 1333–1349. doi:10.5194/acp-22-1333-2022
Liu, M., van der A, R., van Weele, M., Eskes, H., Lu, X., Veefkind, P., et al. (2021). A New Divergence Method to Quantify Methane Emissions Using Observations of Sentinel‐5P TROPOMI. Geophys. Res. Lett. 48, e2021GL094151. doi:10.1029/2021GL094151
Meijer, Y., Boesch, H., Bombelli, A., Brunner, D., Buchwitz, M., Ciais, P., et al. (2020). Copernicus CO2 Monitoring Mission Requirements Document. Tech. Rep., European Space Agency. Issue 3.0, EOP-SM/3088/YM-ym. ESA. Available at: https://esamultimedia.esa.int/docs/EarthObservation/CO2M_MRD_v3.0_20201001_Issued.pdf.
Nassar, R., Hill, T. G., McLinden, C. A., Wunch, D., Jones, D. B. A., and Crisp, D. (2017). Quantifying CO2 Emissions from Individual Power Plants from Space. Geophys. Res. Lett. 44, 10,045–10,053. doi:10.1002/2017GL074702
Reuter, M., Buchwitz, M., Schneising, O., Krautwurst, S., O'Dell, C. W., Richter, A., et al. (2019). Towards Monitoring Localized CO2 Emissions from Space: Co-Located Regional CO2 and NO2 Enhancements Observed by the OCO-2 and S5P Satellites. Atmos. Chem. Phys. 19, 9371–9383. doi:10.5194/acp-19-9371-2019
Varon, D. J., Jacob, D. J., McKeever, J., Jervis, D., Durak, B. O. A., Xia, Y., et al. (2018). Quantifying Methane Point Sources from Fine-Scale Satellite Observations of Atmospheric Methane Plumes. Atmos. Meas. Tech. 11, 5673–5686. doi:10.5194/amt-11-5673-2018
Verstraeten, W. W., Boersma, K. F., Douros, J., Williams, J. E., Eskes, H., Liu, F., et al. (2018). Top-Down NOX Emissions of European Cities Based on the Downwind Plume of Modelled and Space-Borne Tropospheric NO2 Columns. Sensors 18, 2893. doi:10.3390/s18092893
Keywords: carbon dioxide, nitrogen oxides, anthropogenic emissions, SMARTCARB, CO2M, divergence method, emission ratio
Citation: Hakkarainen J, Ialongo I, Koene E, Szeląg ME, Tamminen J, Kuhlmann G and Brunner D (2022) Analyzing Local Carbon Dioxide and Nitrogen Oxide Emissions From Space Using the Divergence Method: An Application to the Synthetic SMARTCARB Dataset. Front. Remote Sens. 3:878731. doi: 10.3389/frsen.2022.878731
Received: 18 February 2022; Accepted: 09 June 2022;
Published: 08 July 2022.
Edited by:
Yasjka Meijer, European Space Research and Technology Centre (ESTEC), NetherlandsReviewed by:
Zhao-Cheng Zeng, Peking University, ChinaOleg Dubovik, UMR8518 Laboratoire d’optique Atmosphèrique (LOA), France
Copyright © 2022 Hakkarainen, Ialongo, Koene, Szeląg, Tamminen, Kuhlmann and Brunner. This is an open-access article distributed under the terms of the Creative Commons Attribution License (CC BY). The use, distribution or reproduction in other forums is permitted, provided the original author(s) and the copyright owner(s) are credited and that the original publication in this journal is cited, in accordance with accepted academic practice. No use, distribution or reproduction is permitted which does not comply with these terms.
*Correspondence: Janne Hakkarainen, amFubmUuaGFra2FyYWluZW5AZm1pLmZp