 Sandeep Kumar1
 Swarnendu Sekhar Ghosh1
 Dipankar Mandal2,3
 Avik Bhattacharya1
 Alok Porwal4
 L. Karthikeyan4,5*
- 1Microwave Remote Sensing Lab, Centre of Studies in Resources Engineering, Indian Institute of Technology Bombay, Mumbai, India
- 2Agro-geoinformatics Lab, School of Agro and Rural Technology, Indian Institute of Technology Guwahati, Guwahati, Assam, India
- 3Department of Agronomy, Kansas State University, Manhattan, KS, United States
- 4Centre of Studies in Resources Engineering, Indian Institute of Technology Bombay, Mumbai, India
- 5Centre for Climate Studies, Indian Institute of Technology Bombay, Mumbai, India
Vegetation serves as a vital carbon sink, crucial for regulating
1 Introduction
Plant stress is defined as any adverse condition or substance that hinders or disrupts its metabolism, growth, or development (Lichtenthaler, 1998). Plant stress can be classified into two distinct types: biotic and abiotic stress. Any living organism, such as insects, pathogens, and other herbivores, causes biotic stress. Abiotic stress is instigated by external non-biological factors in the plant’s environment, encompassing water availability, temperature fluctuations, salinity levels, and other pertinent factors. As noted by Sharma et al. (2012), abiotic stress caused by limiting photosynthesis leads to increased Reactive Oxygen Species (ROS) production. This heightened ROS presence can diminish the protein levels within plants (Dumanović et al., 2021). Abiotic stresses in plants can cause damage and reduced growth and sometimes may lead to the death of plant tissues (Coatsworth et al., 2023). These stresses occur on molecular and cellular levels, but the changes derived in plants can appear over an extensive range of spatio-temporal scales (Coatsworth et al., 2023).
Under normal physiological conditions, a significant portion (approximately
The alteration of absorbed energy pathways during abiotic stress conditions leads to stress-induced damage to the plant’s photosynthetic apparatus (Lang et al., 1996). Monitoring these changes allows researchers to assess the impact of stress on plants and better understand how they respond to adverse environmental conditions. For instance, water stress negatively affects various physiological functions in plants, particularly their photosynthetic capacity (Osakabe et al., 2014). Prolonged water stress significantly reduces plant growth and productivity. This stress directly impacts photosynthesis by causing stomatal closure, which decreases the availability of
Remote sensing satellite images are valuable tools for detecting vegetation stress, as each vegetation element absorbs energy at different wavelengths. Researchers can assess vegetation health by monitoring the absorption features of key leaf components, such as chlorophyll and water. Optical remote sensing in the visible near-infrared (VNIR) and shortwave infrared (SWIR) regions has been extensively used to detect these absorption features, particularly those related to chlorophyll and leaf water content. Spectral features like the red edge are also crucial for tracking changes in the biochemical properties of plants. Physiological stressors often simultaneously affect both chlorophyll and water content in leaf tissue, making it challenging to disentangle these two interdependent factors (Hazrati et al., 2016). Several studies have documented significantly reduced chlorophyll content across various crops under drought stress conditions (Gholamin and Khayatnezhad, 2011; Farooq et al., 2009).
2 Previous work
In recent decades, numerous vegetation indices have been developed using spectral absorbance information to serve specific purposes (Gao, 1996; Huete, 1988; Gitelson, 2004). However, these indices have been applied in many different contexts due to their sensitivity to various vegetation parameters. For instance, several indices used to monitor vegetation stress or health, such as the Normalized Difference Vegetation Index (NDVI) (Wen et al., 2017; Fokeng and Fogwe, 2022; Pettorelli et al., 2005; Roerink et al., 2003), the Normalized Difference Moisture Index (NDMI) (Wilson and Norman, 2018; Gu et al., 2008), the Global Vegetation Moisture Index (GVMI) (Swathandran and Aslam, 2019), and the Enhanced Vegetation Index (EVI) (Paliwal et al., 2019; Samanta et al., 2010), are predominantly sensitive to a single leaf parameter. A single leaf parameter typically refers to a specific attribute or characteristic of a leaf that can be measured or modeled, such as leaf chlorophyll content or leaf water content. However, the best indicator of vegetation health would be the one that is sensitive to multiple parameters simultaneously (Wang et al., 2019).
For instance, the NDMI correlates with canopy water content and is particularly useful for detecting vegetation moisture stress in vegetation (Hardisky et al., 1983). It is important to note that high NDMI values may result from water bodies or vegetation with high moisture concentrations. According to Wilson and Sader (2002), NDMI is more effective than NDVI in detecting subtle disturbances in vegetation. Based on radiative transfer theory, canopy reflectance in the NIR and red bands can be used to estimate the Leaf Area Index (LAI) (Knyazikhin et al., 1998). Since NDVI also uses bands in the NIR and red regions, there is a direct relationship between NDVI and LAI. However, NDVI tends to saturate at higher LAI values (dense vegetation canopies) (Tao et al., 2021; Wang et al., 2025).
According to Zhao et al. (2024), drought conditions diminish the effectiveness of NDVI in monitoring gross primary productivity (GPP). Additionally, the performance of NDVI is influenced by factors such as moisture availability, soil background, and surface texture (Huete et al., 1985). While NDVI can capture variations in LAI across time and space (Wang et al., 2019), it does not fully represent the overall health of the vegetation.
A study by Crespo et al. (2025) highlighted that in Mediterranean olive orchards, NDMI alone was insufficient to fully characterize vegetation stress under prolonged drought conditions, suggesting the need for integrating additional indices for comprehensive monitoring. Vegetation indices are commonly used in two major applications: (1) estimating biochemical and biophysical parameters and (2) serving as proxies for vegetation traits. When estimating or retrieving biochemical and biophysical parameters, the vegetation index should be susceptible to the specific parameter of interest. Any additional sensitivity to other parameters can introduce uncertainties into the results (Wang et al., 2019). Conversely, when monitoring vegetation health or stress, selecting an index that is not limited to a single parameter but sensitive to a combination of factors (Zhang et al., 2017) is essential. The limitations of commonly used vegetation indices for health monitoring highlight the need to develop a more robust indicator for vegetation health.
In this contribution, we introduce a novel vegetation health indicator that is sensitive to vegetation chlorophyll, vegetation water content, and leaf protein content. The proposed indicator offers valuable insights into assessing overall vegetation stress. It leverages the spectral absorption features used in the widely adopted NDVI and NDMI indices, which are sensitive to leaf chlorophyll and water content, respectively. Additionally, it incorporates reflectance near 700 nm, associated with the red edge, which is known to be sensitive to plant chlorophyll stress (Collins 1978). The objectives of this study are threefold: (1) to introduce a novel parameter for monitoring vegetation health; (2) to validate the proposed index using lab-based spectroscopy experiment on the leaves of Saraca asoca and physical model-based Global Sensitivity Analysis (GSA) utilizing the PROSPECT-leaf model, SAIL homogeneous canopy model, and INFORM heterogeneous canopy model; and (3) to evaluate the capability of the index for spatio-temporal analysis of corn crops during the growing season. We utilize Sentinel-2 satellite data, which provide global reflectance images across multiple bands in the VNIR and SWIR channels at spatial resolutions of 10, 20, and 60 m. The combined datasets from Sentinel-2A and 2B further enhance the temporal resolution to 5 days, offering a vast archive of imagery for global vegetation health monitoring.
3 Methodology
This section outlines the formulation of the proposed index, followed by a detailed description of the approach used for its validation.
3.1 Proposed algorithm
This section is divided into two parts: the first part explains the theoretical foundation for developing the new index, while the second part provides details on its formulation.
3.1.1 Theoretical basis of the index
Absorption, reflection, and transmission are the three primary phenomena that occur when electromagnetic radiation (EMR) interacts with vegetation. In optical satellite remote sensing, most of the EMR interacts with vegetation canopies composed mainly of leaves. The biochemical pigments and internal structure of the leaves influence how different wavelengths of EMR are affected. Chlorophyll pigments absorb the blue and red regions of the EM spectrum in the leaves, and this absorbed energy is used for photosynthesis. The amount of chlorophyll also regulates the position of the red edge on the electromagnetic spectrum (Gates et al., 1965). In stressed plants, chlorophyll content is reduced, causing the red edge to shift toward shorter wavelengths (Rock et al., 1988). This shift has also been linked to stress induced by heavy metals (Horler et al., 1980; 1983). A study by Gitelson et al. (1996) has shown that reflectance near 700 nm is a sensitive indicator of both the red edge position and chlorophyll concentration. Therefore, the band centered at 700 nm is particularly useful for detecting changes in chlorophyll content.
Leaves are composed of multiple layers of different cells, including the upper epidermis, palisade mesophyll, spongy mesophyll, and lower epidermis (Mader, 2014). Blue and red wavelengths are absorbed by chlorophyll in the palisade mesophyll layer. In contrast, Near-Infrared (NIR) electromagnetic radiation penetrates the palisade mesophyll and interacts with the spongy mesophyll. The spongy mesophyll consists of loosely packed, irregularly shaped cells that contain air spaces. The scattering of NIR radiation between the cell walls and these air spaces results in high NIR reflectance in healthy leaves (Kupfer and Emerson, 2005). However, when leaves experience stress, the mesophyll cells may absorb a portion of the incoming NIR radiation, decreasing NIR reflectance.
In addition to other pigments, leaves contain a significant amount of water. This water absorbs most of the energy in the shortwave-infrared (SWIR) region of the electromagnetic spectrum, effectively stretching the O-H bond. The specific absorption coefficients of pure liquid water at 1.6 µm and 2.2 µm are notably high. According to Jacquemoud and Ustin (2019), the absorption spectra of leaf water and pure liquid water are very similar in the near-infrared (NIR) and SWIR regions. At 2.2 µm, the electromagnetic radiation is not only absorbed by the water in the leaves but also strongly absorbed by the proteins present within them (Jacquemoud and Ustin, 2019). Factors such as heat, drought, salinity, and water stress can induce oxidative stress, increasing ROS (Chauhan et al., 2023). This increase in ROS can damage plant proteins (Sharma et al., 2012). Consequently, energy absorption at 2.2 µm will decrease under these stressed conditions.
3.1.2 Sentinel-2 based vegetation health index (SVHI)
The significant absorption of the EMR at specific wavelengths reveals the availability and quantity of essential pigments, such as chlorophyll, carotenoids, and water content, which are critical to governing photosynthesis in plants. The presence of these pigments offers valuable insights into vegetation health. A wide range of vegetation indices have been developed based on these absorption characteristics. Some of the most commonly used indices include the NDVI (Rouse Jr et al., 1974), EVI (Liu and Huete, 1995), Ratio Vegetation Index (RVI) (Pearson and Miller, 1972), Soil Adjusted Vegetation Index (SAVI) (Huete, 1988), and NDMI (Gao, 1996), among others. These indices primarily leverage either chlorophyll-related or leaf water-related absorption features.
As discussed in section 2, NDVI and NDMI have limitations in comprehensively detecting vegetation stress due to their primary emphasis on specific aspects of vegetation. To overcome this constraint, we propose a novel indicator in this study incorporating chlorophyll absorption features, leaf water content, and leaf protein content. By integrating these features, we aim to make the index more efficient at detecting vegetation stress. The proposed index, SVHI, is formulated as the normalized difference of
In this formulation,
Based on the sensitivity of vegetation to different wavelengths, and considering the availability of these wavelength bands in multispectral satellite systems,
In this study, we utilize Sentinel-2 data, as it is the only operational multispectral satellite that provides all the required bands in the necessary wavelength regions for formulating the proposed index. Hence, we have termed this index the Sentinel-2 based Vegetation Health Index (SVHI), which can be expressed as: provided in Equation 3.
This index utilizes the reflectance from five bands of Sentinel-2:
3.2 Physical model-based validation
This section presents an overview of the radiative transfer models employed in this study, followed by a detailed explanation of the procedure used to conduct a global sensitivity analysis of the vegetation indices.
3.2.1 PROSAIL and PROINFORM
The PROSAIL (Jacquemoud et al., 2009) and PROINFORM models combine the PROSPECT (leaf optical properties model) (Jacquemoud and Baret, 1990) with SAIL (canopy reflectance model) (Verhoef, 1984; 1985) and INFORM (INvertible FOrest Reflectance Model) (Atzberger, 2000; Schlerf and Atzberger, 2006), respectively.
The PROSPECT-4 model simulates leaf reflectance and hemispherical transmittance based on leaf biochemical and structural parameters. It consists of four key parameters: chlorophyll a+b content (Cab), dry matter content (Cm), equivalent water thickness (Cw), and leaf structure (N). The PROSPECT-5 model extends this by adding two parameters: Carotenoids (Car) and brown pigments (Cbrown). The outputs from the PROSPECT model serve as inputs for the SAIL and INFORM models.
The SAIL model simulates canopy reflectance based on eight parameters: Leaf Area Index (LAI), leaf angle distribution (LAD) (Campbell, 1990), soil coefficient, the ratio of diffuse to direct solar radiation, hot-spot size (Kuusk, 1995), solar zenith angle (SZA), sensor viewing angle, and relative azimuth angle. Since LAI and LAD are the only two parameters defining canopy structure, SAIL is limited to simulating the reflectance of homogeneous canopies (Morcillo-Pallarés et al., 2019).
The hybrid radiative transfer model INFORM integrates the strengths of geometric-optical radiative transfer and turbid-medium models. In this model, geometric shapes, such as tree crowns, are treated not as opaque entities but as a turbid medium. While this model is more complex, it offers a more realistic representation of forest canopies (Schlerf and Atzberger, 2006).
INFORM combines the SAILH (Verhoef, 1984) model, which simulates radiative transfer in the canopy layer of turbid mediums, with the FLIM (Rosema et al., 1992) model to account for geometric factors such as leaf clumping, tree crowns, and crown geometry. When used with PROSPECT (PROINFORM), the model effectively simulates forest dynamics by incorporating leaf-level and canopy-level variables. The canopy-level variables include crown diameter (CD), tree height (H), stem density (SD), leaf angle distribution (LAD), understory leaf area index
3.2.2 Global sensitivity analysis
Evaluating the sensitivity of vegetation indices to various plant properties is essential for relative comparisons. In this study, we utilized physics-based canopy reflectance models, specifically, PROSPECT-4 and PROSPECT-5 combined with SAIL (PROSAIL) and INFORM (PROINFORM) to generate theoretical reflectance values by varying different vegetation properties (Table 1).
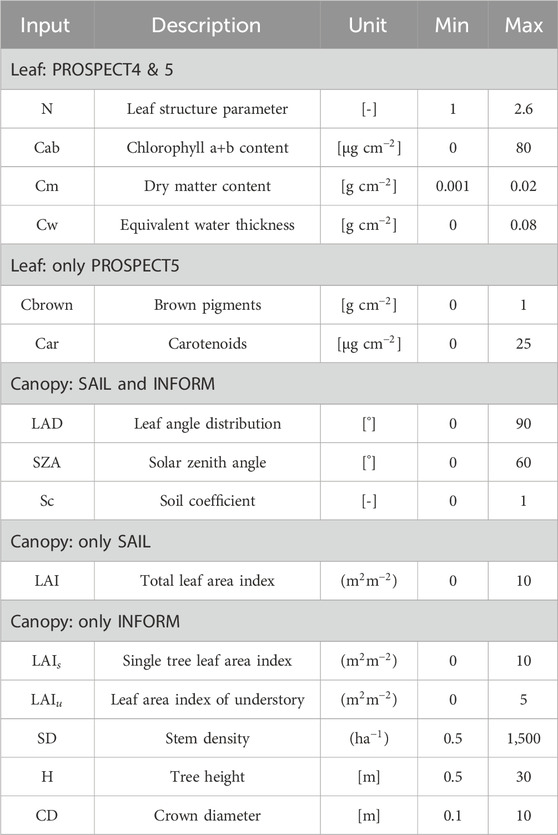
Table 1. Parameters considered in the reflectance simulation from PROSAIL and PROINFORM are listed here. The default values were selected for the parameters not listed in the table.
Global Sensitivity Analysis (GSA) (Sobol’, 1990; Saltelli et al., 2008) was performed using the Automated Radiative Transfer Models Operator (ARTMO) (Verrelst et al., 2011). The GSA toolbox in ARTMO operates on input variables of Radiative Transfer Models (RTM) using Sobol’s first-order and total-order sensitivity indices. We employed default Sobol sampling (Sobol’, 1967; Sobol and Levitan, 1999) for the input variable space of the RTM. After conducting 2000 simulations per variable (Morcillo-Pallarés et al., 2019), no significant fluctuations were observed. Therefore, we selected 2000 samples per variable, resulting in a total of 12,000, 16,000, 20,000, 24,000, 28,000, and 32,000 simulations for PROSPECT-4, PROSPECT-5, PROSPECT4+SAIL, PROSPECT5+SAIL, PROSPECT4+INFORM, and PROSPECT5+INFORM, respectively (Saltelli, 2002). The total number of parameters selected for the analysis was based on the criteria established by Morcillo-Pallarés et al. (2019).
During the simulations, we provided the minimum and maximum possible values for each parameter in the models, as detailed in Table 1. Additionally, we conducted simulations by varying the maximum value of a parameter while keeping the other parameters constant. These simulated reflectances were first converted to the spectral resolution of Sentinel-2 using the sensor-specific band settings. Following this conversion, vegetation indices such as the SVHI, NDVI, and NDMI were calculated, followed by the execution of GSA.
This analysis aimed to compare the sensitivity of the vegetation indices to different vegetation parameters and to understand the behavior of SVHI concerning variations in chlorophyll a+b content (Cab) and equivalent water thickness (Cw) at different levels.
3.3 Experimental validation of SVHI
We conducted a lab-based spectroscopy experiment to validate our proposed index, which was carried out in two parts: (a) analysis of the effect of water content and (b) analysis of the effect of chlorophyll content. The instrument used for this experiment was an ASD FieldSpec3 spectroradiometer, which measures contiguous reflectance across the wavelength range of
In the first experiment, 15 fresh, green, mature leaves of the Saraca asoca (Ashoka tree) were collected. Spectroscopic measurements and fresh weights were recorded for each leaf. Reflectance was measured at five distinct locations on each leaf simultaneously. The leaves were then placed in a dark room for the next 4 days, during which the measurements of weights and reflectances were repeated at the same time each day. After 4 days, the leaves were exposed to direct sunlight for 1 week until no weight loss was observed. Following this period, the dry weight of the leaves was measured. The measured dry weights were subsequently used to calculate the % leaf water content during each observation. The % LWC is expressed as provided in Equation 4.
where
In the second experiment, green healthy, stressed, and dead leaves from the same tree were collected. Five spectra were measured from different parts of each leaf. All measured spectra from both experiments were resampled to Sentinel-2 resolution using ENVI 5.6 software. These resampled spectra were then utilized to calculate SVHI, NDVI, and NDMI. To enhance the absorption features associated with different leaf conditions, we removed the continuum lines from all spectra using the method described by Dhoundiyal et al. (2023). These spectra have been generated to illustrate the change in absorption characteristics for different conditions of leaves, including healthy, water-stressed, chlorophyll-stressed, and dead/dry leaves.
3.4 Spatio-temporal estimation of SVHI using Sentinel-2
To assess the spatio-temporal evolution of SVHI, we conducted on-field tests across different growth periods of corn during a crop season. The study area is located between Webster and Boone cities in the state of Iowa, USA, which is predominantly used for agricultural practices. Corn is the most cultivated crop in this region, followed by soybeans, as indicated by the Crop Data Layer (CDL) (CroplandCROS, 2024). The study area also features various land use and land cover (LULC) types, including natural vegetation (predominantly found along riverbanks), water bodies, and developed structures such as roads and settlements. Like much of the American Midwest, Iowa has a typical humid continental climate. It experiences long, humid, and warm summers, while winters are windy, cold, and snowy. The region has a fairly consistent precipitation pattern throughout the year.
This study focused on the phenological stages of corn, explicitly spanning from May to October 2021. We used the Sentinel-2 surface reflectance product to calculate vegetation indices during corn phenology. The Sentinel-2 Level 2A product, which provides surface reflectance data, is open access and globally available through platforms like Planetary Computer (2024) and Google Earth Engine (2024). Before conducting the analysis, all cloudy pixels in the selected scenes were masked out. To map the corn fields in the study area, we used the CDL, accessible at CroplandCROS (2024). Figure 1 presents the study area map, illustrating the extent of corn cultivation. Additionally, we prepared the phenology chart of the corn crop for Webster City based on the Iowa Crop Weekly Progress Report for 2021 (USDA, 2021), shown in Figure 2.
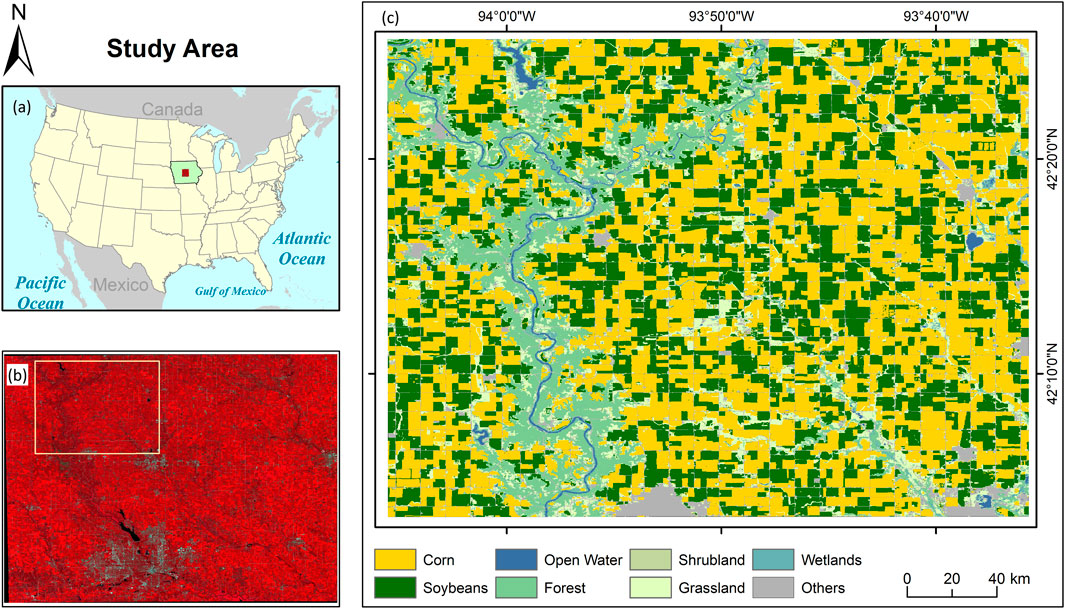
Figure 1. (a) The administrative boundary of USA with highlighting IOWA state, (b) False Colour Composite (R-NIR, G-Red, B-Green) Map of parts of Iowa state, and (c) LULC map of the study area.
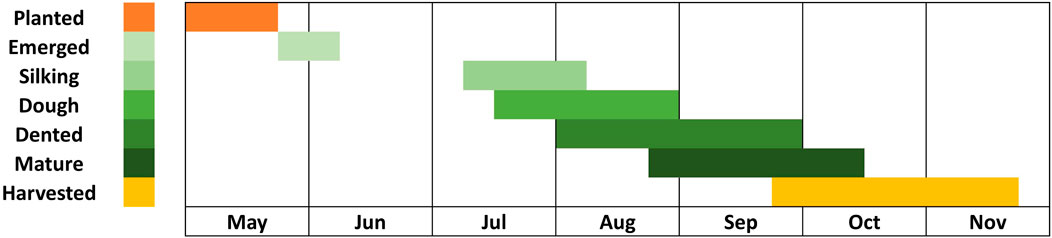
Figure 2. This figure shows phenology of Corn crop in Webster city, Iowa, USA.
4 Results and discussions
In this section, we present an analysis of the sensitivity of the proposed index using physics-based models. Additionally, we describe the results of a lab-based spectroscopy experiment conducted with the leaves of Saraca asoca, which investigates the impact of chlorophyll and water content on SVHI. Finally, the utility of the proposed index is demonstrated through its application in analysing the phenology of corn crops using Sentinel-2 satellite imagery.
4.1 Physical model-based GSA
Figure 3 highlights the varying sensitivities of NDVI, NDMI, and SVHI at both leaf and canopy scales. As shown, NDVI exhibits zero sensitivity towards Cw, while NDMI shows zero sensitivity to Cab. SVHI demonstrates substantial sensitivity to both chlorophyll content (Cab) and leaf water content (Cw), with contributions of approximately 40%–55% and 55%–40%, respectively, as indicated by the leaf-level model. This makes SVHI particularly responsive to variations in these parameters.
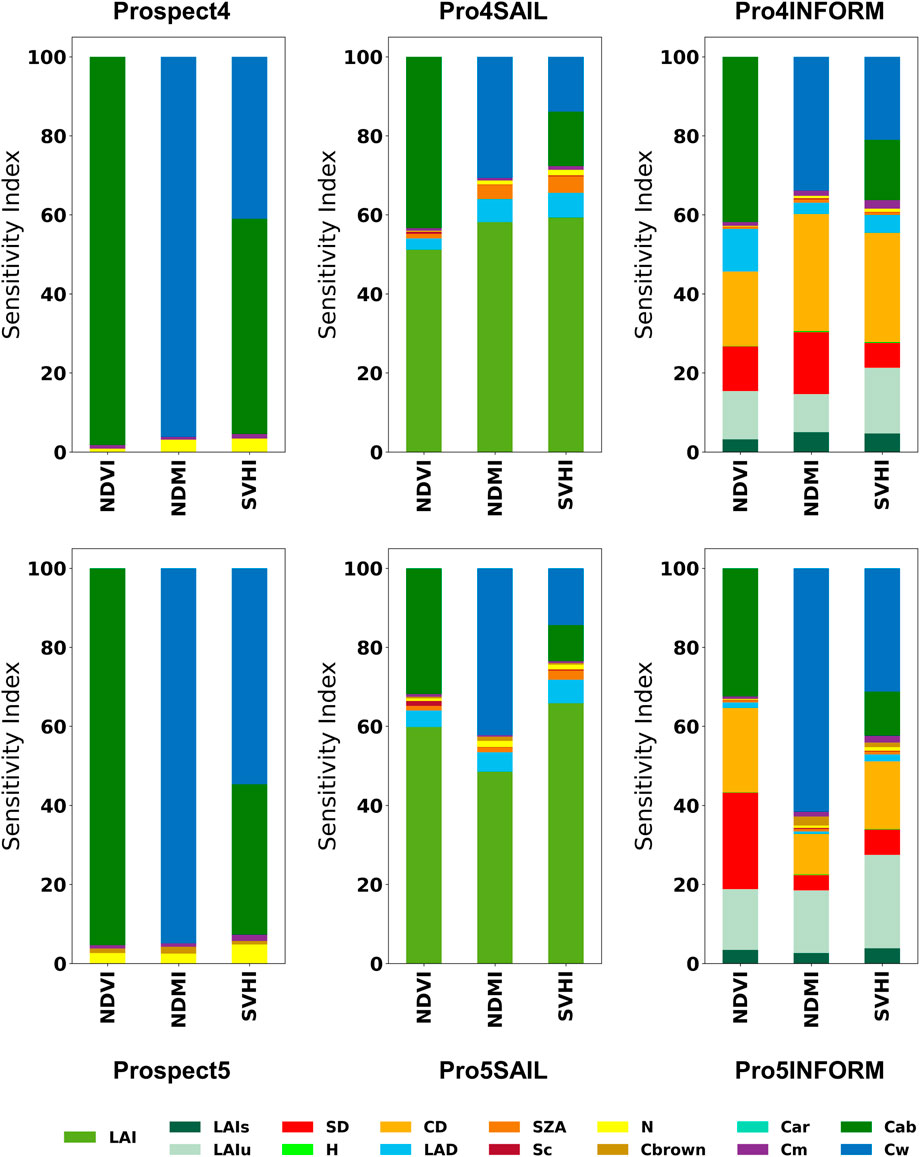
Figure 3. Global sensitivity analysis of NDVI, NDMI, and SVHI using leaf and canopy models.
When considering the canopy reflectance, LAI is the most influential parameter for all indices. In homogeneous canopies, LAI primarily defines canopy structure, with higher LAI resulting in greater absorption in the visible and SWIR bands, leading to reduced canopy reflectance. In contrast, in heterogeneous canopies like forests, vegetation indices display additional sensitivity to structural parameters such as crown density, stem density, and leaf angle distribution, which intensifies anisotropy (Wang et al., 2019).
At the canopy scale, we focus on Canopy Chlorophyll Content (CCC) and Canopy Water Content (CWC) rather than individual leaf-level parameters such as Cab and Cw. CCC is computed as the product of Cab and LAI, expressed as provided in Equation 5.
Similarly, CWC is expressed as the product of Cw and LAI as provided in Equation 6.
As observed in previous sections, SVHI is sensitive to leaf water and chlorophyll content, so we expect it to exhibit high sensitivity to changes in CCC and CWC. These canopy-level variables represent a combined sensitivity of Cab and Cw with LAI, respectively. Therefore, any variations in CCC and CWC, which reflect the overall chlorophyll and water status of the entire canopy, should be effectively captured by SVHI.
Figures 4, 5 illustrates the change in sensitivity of SVHI at both the leaf and canopy scales for varying levels of Cab and Cw. At the leaf scale, SVHI is primarily sensitive to Cab, Cw, Cm, and Cbrown. Notably, the sensitivity to Cm increases (from 0% to 30% in case of Prospect4 and 0%–50% in case of Prospect5) as Cw decreases, indicating that SVHI becomes more responsive to dry matter content as leaves dry out.
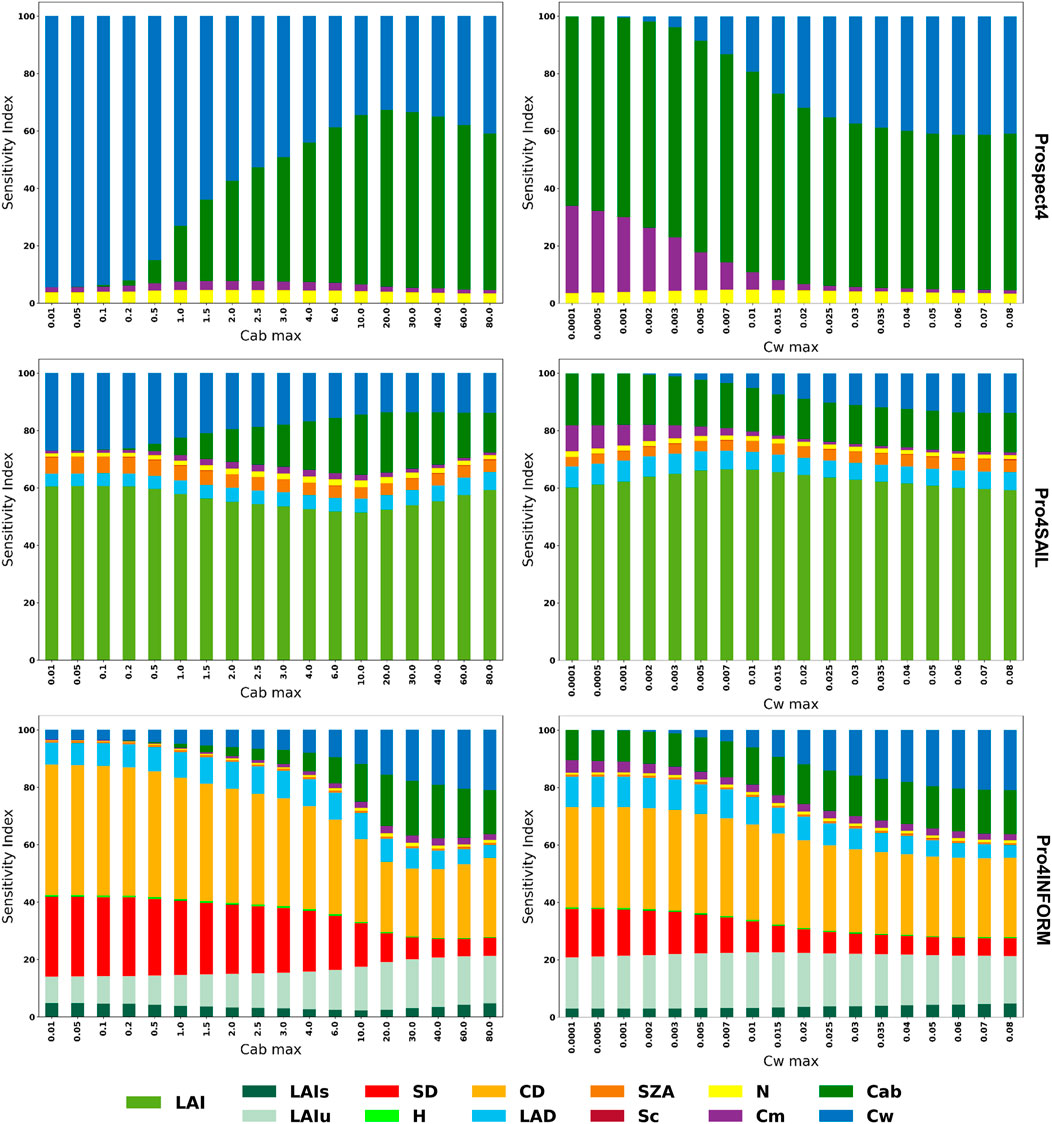
Figure 4. Global sensitivity analysis of SVHI using Prospect4, Prospect4SAIL, and Prospect4INFORM models at varying level of Cab and Cw.
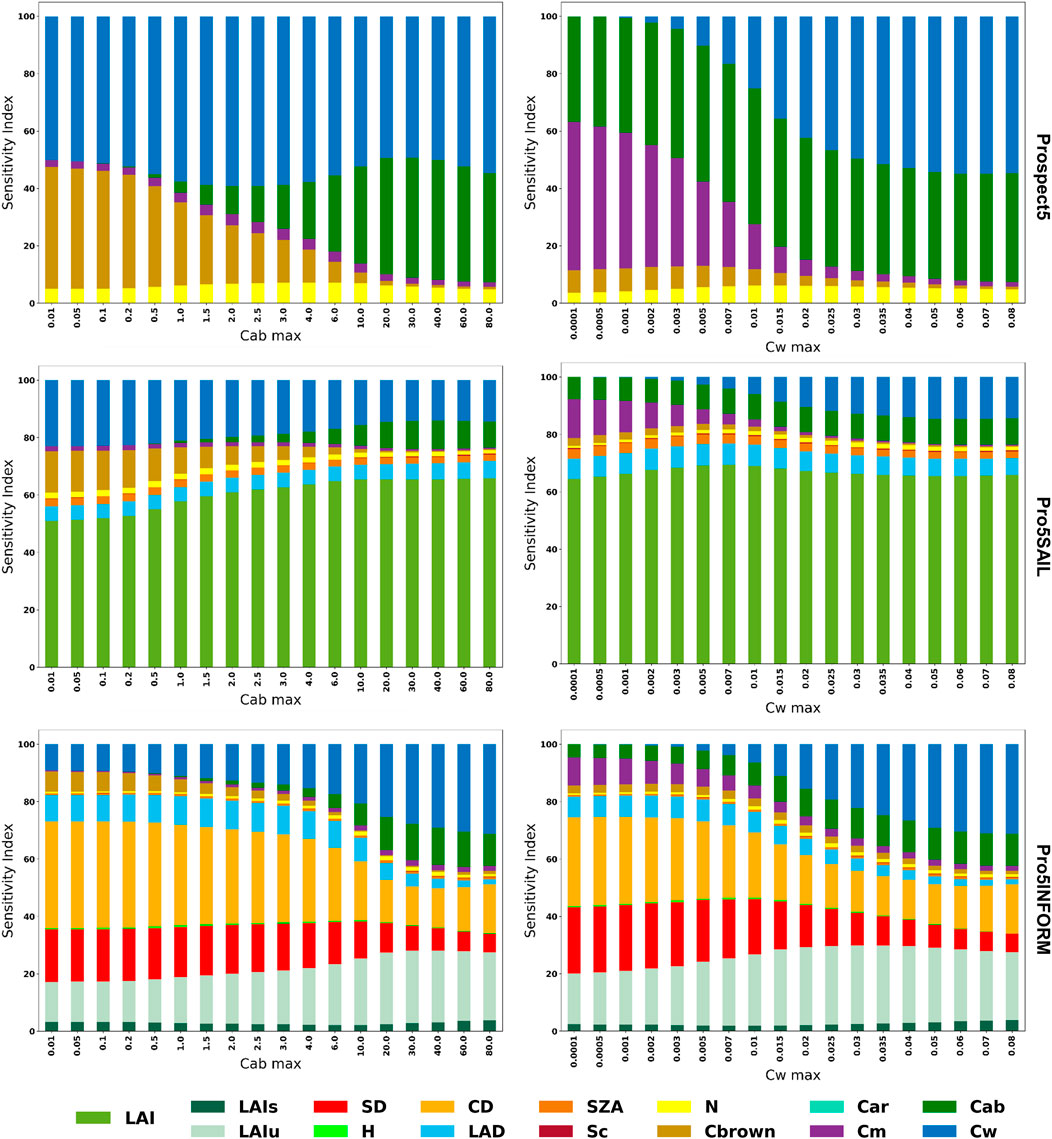
Figure 5. Global sensitivity analysis of SVHI using Prospect5, Prospect5SAIL, and Prospect5INFORM models at varying level of Cab and Cw.
Similarly, SVHI becomes more sensitive to Cbrown (upto 30%) as Cab levels decline. A similar pattern was observed in homogeneous canopy models, with SVHI showing heightened sensitivity towards LAI (about 50%–70%). However, in heterogeneous canopy models, as Cab and Cw decrease, the sensitivity of SVHI shifts further towards structural parameters such as crown density (about 30%–45%), stem density (about 20%–30%), and leaf angle distribution (about 8%–12%). This increased sensitivity to structural components indicates that SVHI becomes more responsive to vegetation structure, particularly under conditions where vegetation is dry and non-green.
4.2 Influence of water content and chlorophyll on VI
This section presents the results from the lab-based spectroscopy experiments conducted on the leaves of Saraca asoca. It is divided into two subsections: in the first part, we examine the effect of water content, and in the second, we investigate the impact of chlorophyll content.
4.2.1 Analysis of the effect of water content
The indices NDVI, NDMI, and SVHI were calculated by averaging the resampled spectra from 75 observations of 15 green leaves on a daily basis. The resulting box plot, shown in Figure 6, displays these indices alongside their corresponding daily mean % LWC. All three indices demonstrate a decrease in value as the % LWC declines. Notably, the rate of decrease is more pronounced for SVHI (0.10) and NDMI (0.09) compared to NDVI (0.02) during the initial reduction in water content (refer to Table 2).
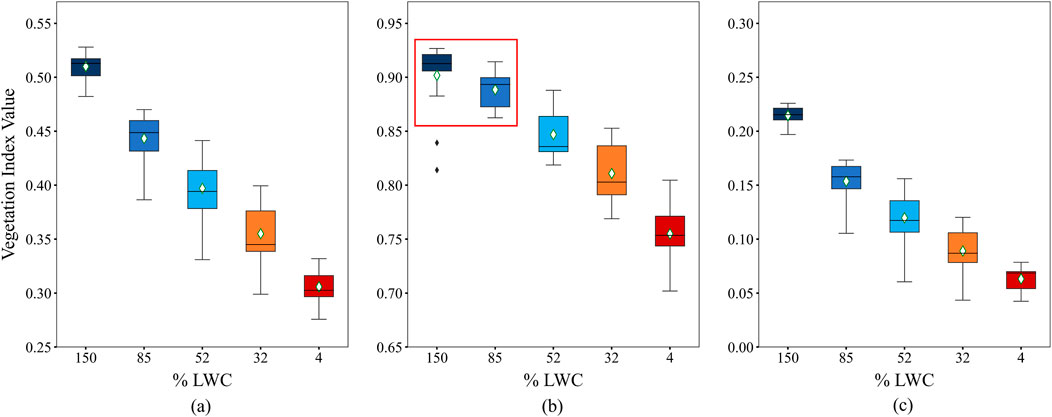
Figure 6. Response of (a) SVHI, (b) NDVI, and (c) NDMI towards leaf water content. The red box shows the two observations are statistically similar according to Tukey’s HSD test at p-value
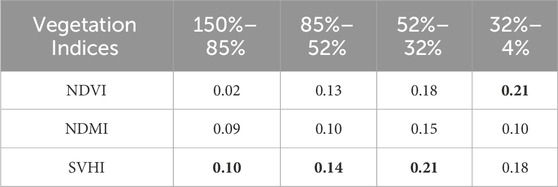
Table 2. The Slope
In our observations, the rate of decrease in the index value is highest for the SVHI within the % LWC ranges of 150 to 85, 85 to 52, and 52 to 32 (highlighted in bold in Table 2). Conversely, within the % LWC range of 32 to 4, the NDVI exhibits the steepest reduction in values, while the NDMI shows the lowest rate of decrease. This pronounced reduction in NDVI values within the % LWC ranges of 32 to 4 can be attributed to chlorosis, a process resulting from chlorophyll breakdown during the complete dehydration of the leaf (Seelig et al., 2008).
In this setup, the effectiveness of an index is evaluated based on its sensitivity to variations in LWC. To assess whether the indices show significant differences with changes in LWC, we conducted Tukey’s HSD test on the indices calculated under consecutive LWC conditions. This test analyses pairwise significant differences using a pairwise p-value threshold of
According to Tukey’s HSD test, SVHI and NDMI exhibit significantly different means, with p-values substantially lower than 0.05 for all pairs of % LWC (refer to Supplementary Figure S1; Supplementary Table S1 in the supplementary document). In contrast, NDVI shows a mean difference that is considerably less than the critical mean, with a p-value of
As noted in previous literature (Chuvieco et al., 2002), we also observed that NDVI is indirectly correlated with leaf water content. However, our experiment demonstrates that NDVI exhibits an insignificant response during the early stages of water stress, particularly when LWC decreases from 150% to 85%. This suggests that NDVI can only detect water stress when there is a substantial reduction in water content within the vegetation. In contrast, our findings indicate that both SVHI and NDMI effectively identify initial water stress conditions.
Figure 7 displays the reflectance spectra of leaves at various levels of % LWC, with the continuum removed. The red line representing 4% LWC exhibits minimal absorption features in the SWIR region. However, as the % LWC increases (indicated by lines in shades of blue), the depth of these absorption features in the SWIR region becomes significantly more pronounced. This illustrates the relationship between leaf water stress and absorption characteristics in the SWIR region. In contrast, the continuous changes in reflectance and absorption in the visible and near-infrared (VNIR) wavelength region are less pronounced than those in the shortwave infrared (SWIR) region. A slight linear increase in reflectance is observed in the red band, which appears to be absent in the blue and green wavelength regions.
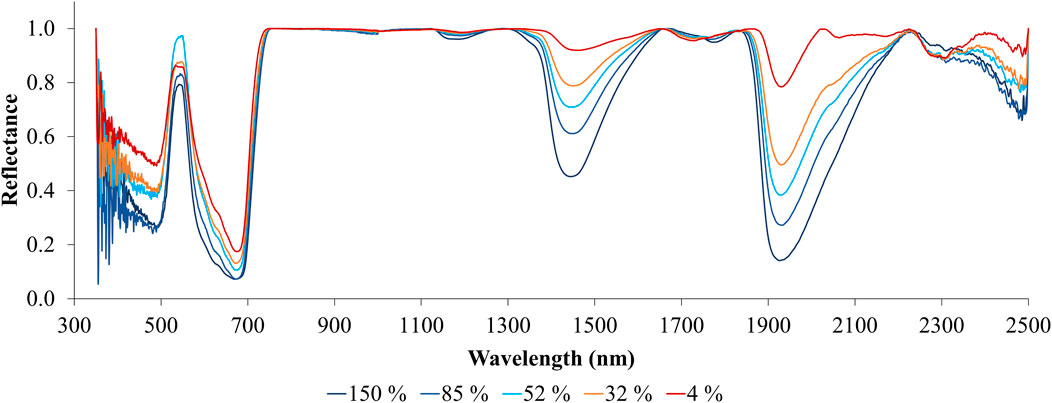
Figure 7. Continuum removed spectra of leaves at different % LWC.
To investigate the relationship between % LWC and the reflectance of B11 and B12 of Sentinel-2, we created a scatter plot comparing % LWC with the % change in SWIR reflectance relative to NIR and is provided in Figure 8. The percentage change can be estimated as follows provided in Equation 7.
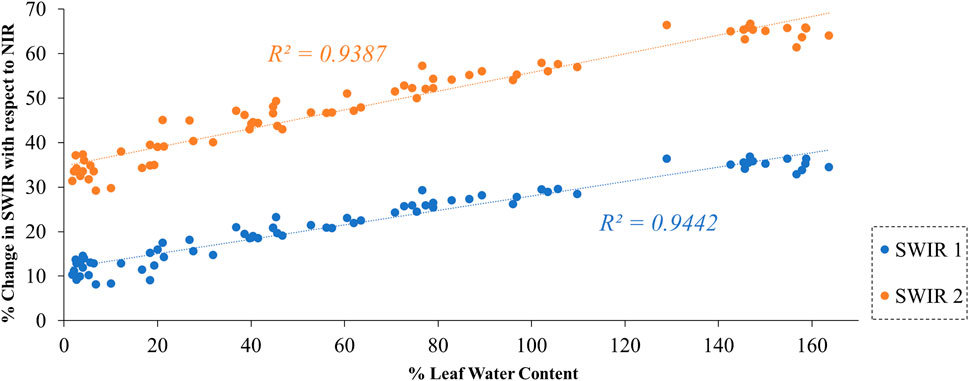
Figure 8. Relationship between Sentinel-2 SWIR bands and % LWC.
Instead of directly utilizing SWIR reflectance, we have employed relative absorption in SWIR with respect to NIR. This approach minimizes the potential errors introduced by variations in leaf angle in the reflectance during laboratory measurements. The results of our experiment demonstrated a strong correlation between % LWC and the changes in reflectance in B11 and B12, relative to B8 of Sentinel-2 (see Figure 8). The Pearson correlation coefficient was approximately 0.97, indicating a strong relationship between the changes in reflectance in B11 and B12 and the water content in the leaves. This suggests that B11 and B12 can be effectively utilized to detect changes in vegetation water stress.
4.2.2 Analysis of the effect of chlorophyll
In this experiment, NDVI, NDMI, and SVHI were calculated using the average spectra of leaves in different conditions, including healthy, stressed, and dead/dry leaves. Figure 9 presents a comparative plot for all three indices. These indices were computed based on reflectances measured during a lab experiment in a dark room with a controlled source of illumination. The distance between the sensor and the leaf was 4 cm, minimizing the absorption of SWIR radiance by atmospheric water vapor. However, this absorption effect is present in satellite-based SWIR reflectance measurements. As a result, NDMI and SVHI values tend to be lower in lab experiments than in satellite measurements. NDVI is unaffected by this issue since it does not use the SWIR band.
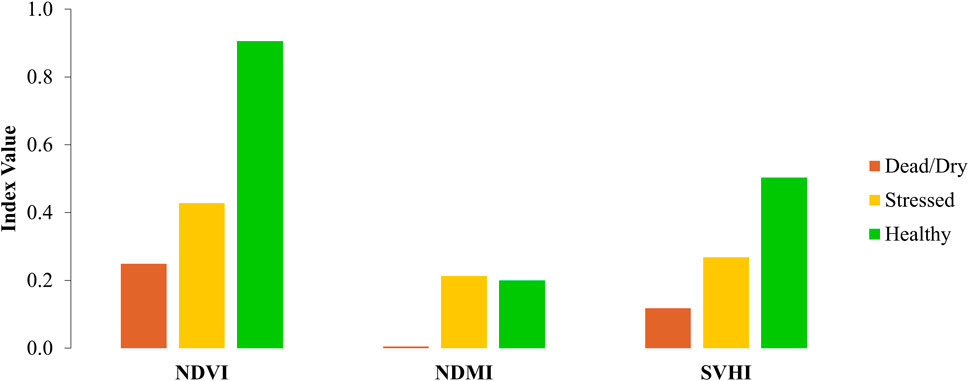
Figure 9. Response of NDVI, NDMI, and SVHI towards stressed leaves.
In terms of behavior, both SVHI and NDVI show a gradual decrease as leaves transition from healthy to stressed and eventually to dead states. In contrast, NDMI exhibits no significant change between healthy and stressed leaves, only showing differences in dead/dry leaves due to their notably lower % LWC.
Figure 10 displays reflectance curves (with continuum removed) for leaves under various stress conditions. This figure clearly illustrates the red-edge position shifting toward shorter wavelengths as the leaves experience stress. The depth of the curve at the red wavelength is highest for healthy leaves and decreases progressively as the leaves become stressed and eventually dead. Additionally, absorption features are visible in the SWIR regions, but the depth of these absorptions diminishes when the leaves dry out and die.
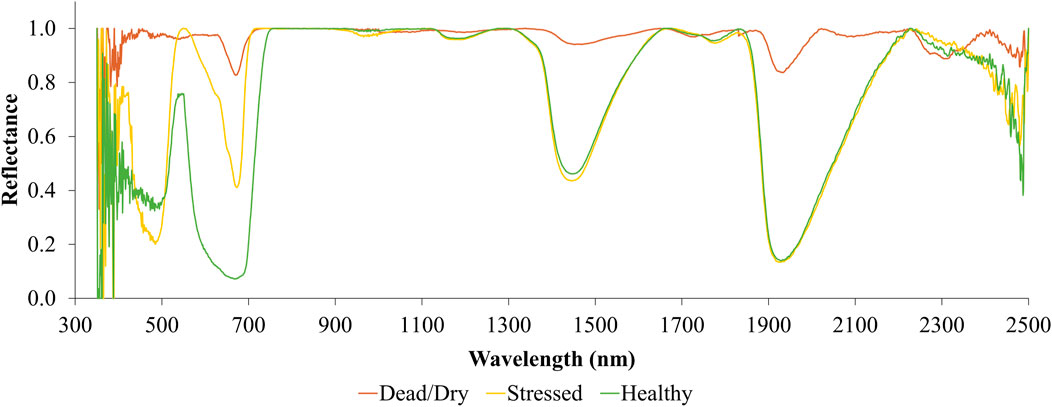
Figure 10. Continuum removed spectra of different stress conditions of leaves.
Interestingly, this curve does not show distinguishable absorption features in the SWIR region that can be used to detect chlorophyll stress in the leaves. This indicates that chlorophyll-related stresses cannot be observed using SWIR reflectance alone. Instead, chlorophyll stress is best monitored using reflectance in the red and red-edge channels. NDMI, which does not use bands in the visible range of the electromagnetic spectrum, is, therefore, unable to detect chlorophyll stress, as demonstrated in Figure 9.
On the other hand, NDVI and the proposed SVHI make use of reflectance from the red and red-edge parts of the spectrum, enabling them to detect chlorophyll stress effectively. From the analysis of leaf water content and chlorophyll stress, it becomes clear that SVHI, unlike NDVI and NDMI, is sensitive to variations in both leaf water content and chlorophyll content.
In plants, ROS are consistently produced, primarily within chloroplasts, mitochondria, and peroxisomes (Apel and Hirt, 2004). The regulation of ROS production and removal is critical for maintaining cellular homeostasis (Sahu et al., 2022). However, several abiotic stress factors, including intense light, drought, extreme temperatures (both high and low), and mechanical stress, can disturb the delicate balance between ROS generation and scavenging mechanisms (Prasad et al., 1994).
Typically, ROS production increases linearly with the severity of stress conditions (Hussain et al., 2018). Under stress, the disruption of cellular homeostasis leads to enhanced production of ROS, such as hydrogen peroxide
Proteins in plants exhibit significant absorption of electromagnetic radiation at 2.2 µm (Jacquemoud and Ustin, 2019). Under stress, a reduction in protein content leads to decreased absorption and increased reflectance at this wavelength. Since SVHI incorporates this wavelength in its formulation, it is sensitive to reductions in leaf protein content under stressful environmental conditions. Higher leaf protein content will result in increased SVHI values, whereas a decline in protein content will cause a corresponding decrease in SVHI.
Establishing a direct relationship between SVHI and changes in leaf protein content would require extensive chemical and cellular analyses, which are beyond the scope of this study. Therefore, we approach this relationship from a theoretical perspective rather than through direct experimental validation, as was done for leaf water and chlorophyll content.
4.3 Spatio-temporal analysis over corn crop
In the following section, we will explore the use of SVHI in monitoring crop phenology.
4.3.1 Analysis over phenology of corn crop
This study analysed the phenology of a corn-dominated region in Iowa. The three indices SVHI, NDVI, and NDMI were computed for six distinct dates, capturing the entire growing season of the corn crop as shown in Figure 11.
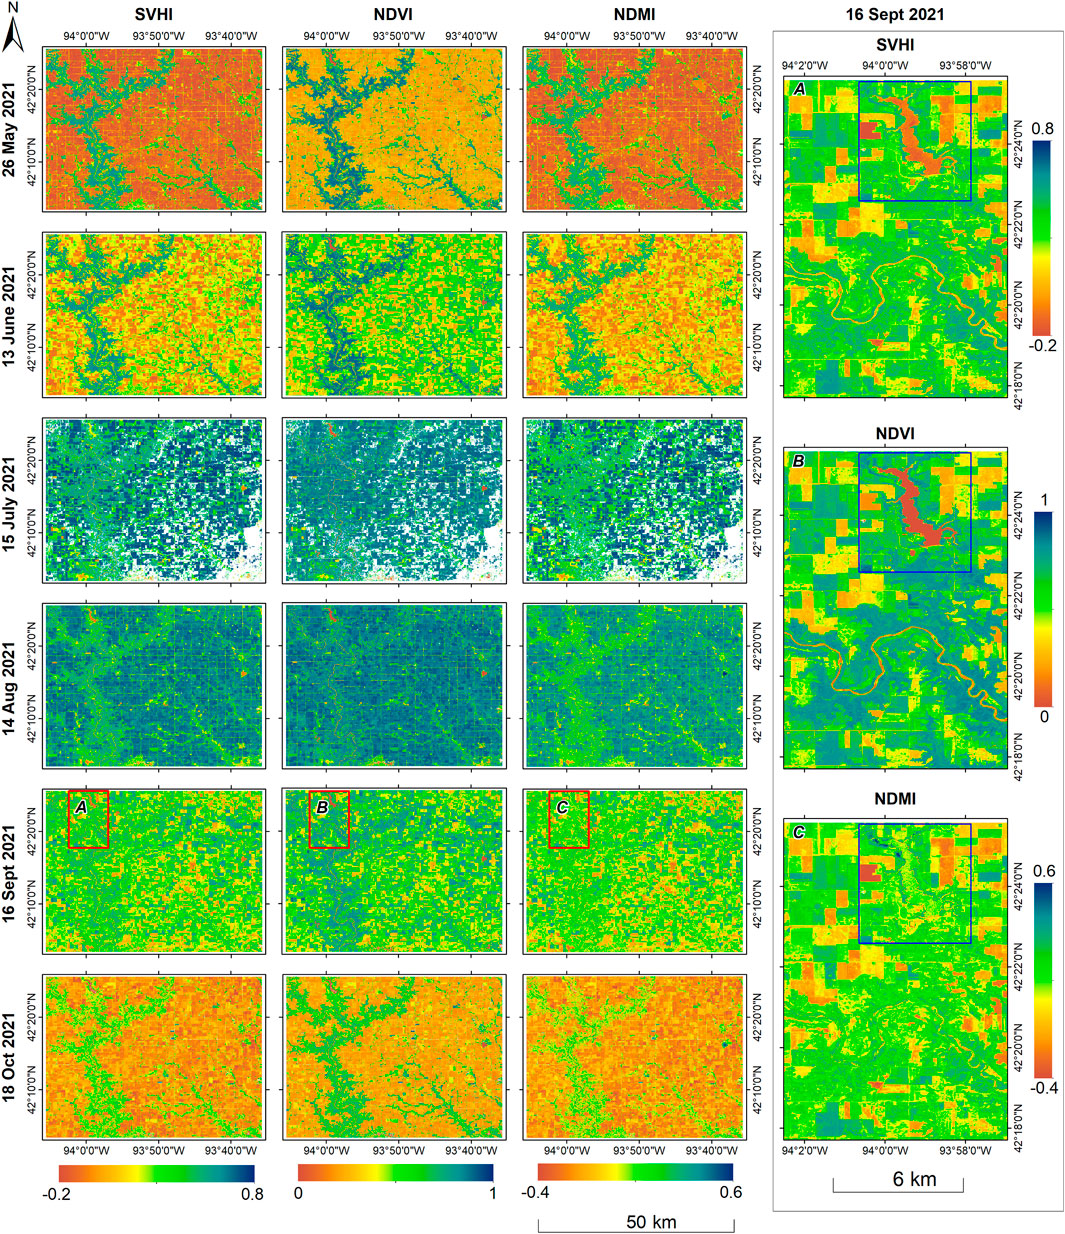
Figure 11. Spatio-temporal variability of SVHI, NDVI, and NDMI over an agricultural region in Iowa, USA for 2021 crop season. The right side image as labeled by (A-C) are zoomed view of the 16 September 2021 image of region marked within red boxes. The blue box highlights the lake, which is apparently differentiable in both the SVHI, and NDVI but not in NDMI.
On 26 May 2021, the corn crop was in the planting stage, and the reflectance measurements were predominantly from bare soil. By 18 October 2021, the corn had reached the harvesting stage, with reflectances measured either from bare soil, where harvesting had already occurred or from dried, non-green corn plants that were ready for harvest. Consequently, the vegetation index values were notably low in both images.
On June 13, the corn crop entered the emerging stage, resulting in an increase in the values of all indices. The images acquired on July 15 and August 14 showed the corn in the silking and doughing stages, respectively, corresponding to a further rise in index values. However, by September 16, as the corn reached the mature stage, there was a reduction in the values of all indices.
We found that all three vegetation indices are capable of characterizing the phenological stages of corn. However, upon analysing the indices for August 14, we observed that NDVI exhibits similar values for both natural vegetation and corn. In contrast, SVHI and NDMI clearly differentiate between the two. This discrepancy arises because, at this stage, the greenness and chlorophyll content of corn are comparable to that of natural vegetation. However, the plant water content in corn at this mature stage is significantly higher than that in natural vegetation. Consequently, SVHI and NDMI yield higher values for corn crops than for natural vegetation at this stage, while NDVI fails to capture this distinction.
Interestingly, the zoomed image on the right side of Figure 11 from 16 September 2021, illustrates that the lake (highlighted in the blue box) and the river are not discernible in the NDMI. In contrast, these features remain clearly distinguishable in both SVHI and NDVI. This phenomenon occurs because NDMI captures higher values for moisture concentration in both surface water bodies and vegetation moisture content. Consequently, NDMI exhibits similar values for healthy vegetation and water bodies, indicating that it cannot be used alone to define the moisture status and health of vegetation accurately. Conversely, SVHI and NDVI show lower values for water bodies, allowing them to differentiate healthy vegetation from surface water effectively.
4.3.2 Temporal analysis of SVHI over corn crop
Three temporal scatterplots comparing NDVI, NDMI, and SVHI for the period from May to October 2021 are presented in Figure 12. Each point in the graph represents the mean value of the corresponding vegetation index across all corn fields in the study area for a given image. A strong correlation is observed between SVHI and both NDVI
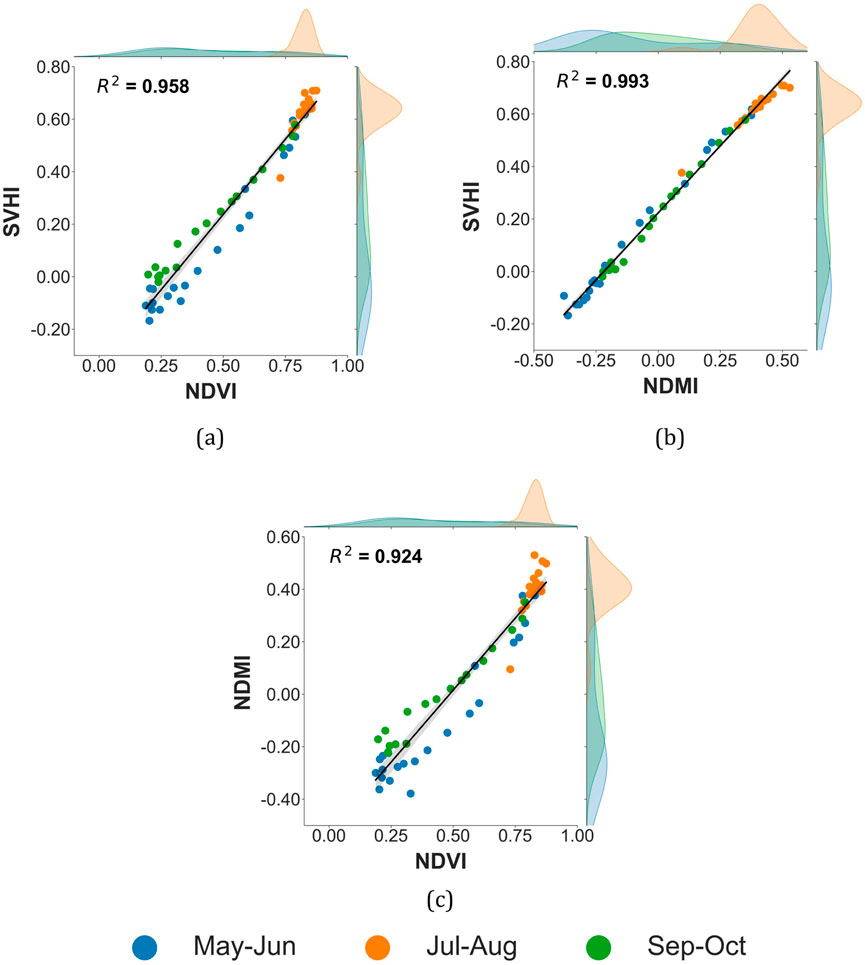
Figure 12. Temporal scatterplot of different vegetation indices over corn crop, (a) SVHI vs. NDVI, (b) SVHI vs. NDMI, and (c) NDMI vs. NDVI.
In numerous experiments, vegetation indices have typically been selected to represent either vegetative greenness, such as NDVI or EVI (Enhanced Vegetation Index), or water sensitivity, such as NDMI or NDWI (Normalized Difference Water Index). In certain instances, NDVI has been used in conjunction with canopy temperature. However, given the varying sensitivities of these indices to greenness and water content in plants, our findings indicate that SVHI serves as a more reliable indicator of vegetation health.
5 Conclusion
In this study, we propose a vegetation health index, the Sentinel Vegetation Health Index (SVHI), which effectively accounts for the sensitivity of vegetation chlorophyll concentration and moisture content. SVHI also incorporates the shift in the red edge position due to vegetation stress and leaf protein content variations. To assess the robustness of SVHI, we conducted three types of investigations: 1) validation through lab-based spectroscopy measurements, 2) validation using physical model-based global sensitivity analysis, and 3) spatio-temporal analysis over corn crops.
The spectroscopy experiment conducted on the leaves of Saraca asoca demonstrates that chlorophyll-related stress is not distinguishable using NDMI. Conversely, early stress associated with leaf water content is insignificant in NDVI. However, the proposed SVHI effectively captures these stresses. Global sensitivity analysis reveals a strong dependency of SVHI on both chlorophyll and water content in leaves. Additionally, a study of corn crop phenology indicates that SVHI can more effectively differentiate characteristic changes in vegetation, distinctly separating vegetated areas from non-vegetated ones, such as water bodies. The temporal scatterplot over corn crops reveals that SVHI is highly correlated with NDVI and NDMI.
We conclude that the specific bands B11 and B12 in Sentinel-2 imagery can reliably detect changes in vegetation water stress. The high correlation with % LWC suggests that monitoring the changes in these bands can provide valuable insights into the water status of vegetation, which is crucial for assessing plant health and water stress. This novel vegetation index has significant potential for global application in mapping and monitoring various vegetation types, including crops and forests. With the extensive archives of global open-access datasets from Sentinel-2, there is a remarkable opportunity to monitor the health of global vegetation at high resolution. The upcoming Sentinel-2C and 2D satellites are set to succeed the currently operational Sentinel-2A and 2B satellites, ensuring the continuous availability of Sentinel-2 datasets well into the future.
The Sentinel-2 Based Vegetation Health Index (SVHI) proposed in this study offers a promising approach for assessing vegetation health and stress by leveraging the spectral sensitivity of specific Sentinel-2 bands to chlorophyll, moisture, and protein-related features. However, certain limitations must be acknowledged to provide a comprehensive understanding of its applicability. Firstly, SVHI is dependent on optical data from the Sentinel-2 satellite constellation, rendering it sensitive to atmospheric conditions. Persistent cloud cover, particularly in tropical and monsoon-prone regions, can limit the availability of usable observations and hinder consistent monitoring. Moreover, the temporal resolution of Sentinel-2 (5–10 days) restricts the index’s ability to capture rapid vegetation changes, making it less suitable for applications requiring high-frequency data, such as early-stage stress detection or daily crop monitoring.
Secondly, although SVHI effectively integrates multiple stress-related spectral signals, it is not designed for the direct retrieval of biophysical or biochemical vegetation parameters, such as leaf area index (LAI), chlorophyll content, or vegetation water content. For applications necessitating quantitative estimates of these parameters, more specialized inversion models or empirical methods would be required. Furthermore, in areas with sparse vegetation or at early growth stages (where the canopy cover is low), the influence of soil background can significantly affect the spectral signal, leading to reduced accuracy of SVHI in such conditions. This is particularly relevant in semi-arid regions or during early phenological stages.
Despite these limitations, SVHI demonstrates considerable potential for a range of large-scale environmental applications, including vegetation health assessment, drought monitoring, forest disturbance detection, and crop phenology mapping. Future research will explore the integration of SVHI with data from high-temporal-resolution sensors and Synthetic Aperture Radar (SAR) systems to overcome the constraints associated with cloud cover and to improve temporal continuity. These enhancements will further support the operational deployment of SVHI for regional and global vegetation monitoring.
Data availability statement
The raw data supporting the conclusions of this article will be made available by the authors, without undue reservation. The JavaScript code to calculate SVHI on the Google Earth Engine platform can be accessed through https://github.com/SandeepKr5/SVHI.
Author contributions
SK: Conceptualization, Investigation, Methodology, Software, Validation, Writing – original draft, Writing – review and editing. SG: Conceptualization, Investigation, Methodology, Validation, Writing – original draft, Writing – review and editing. DM: Investigation, Validation, Writing – original draft, Writing – review and editing. AB: Investigation, Supervision, Writing – original draft, Writing – review and editing. AP: Investigation, Supervision, Writing – original draft, Writing – review and editing. LK: Investigation, Supervision, Writing – original draft, Writing – review and editing.
Funding
The author(s) declare that financial support was received for the research and/or publication of this article. This research was conducted as part of the funded project titled “Modeling of Forest Disturbances Using Multi-Sensor Remote Sensing Data and GIS,” under Grant Number : 00000000000010016660 supported by the DST-sponsored Geospatial Information Science and Engineering (GISE) Hub at IIT Bombay.
Acknowledgments
The authors would like to express their gratitude to Dr. Bo-Cai Gao from the Remote Sensing Division of the Naval Research Laboratory, Washington, DC, USA, for the fruitful discussions.
Conflict of interest
The authors declare that the research was conducted in the absence of any commercial or financial relationships that could be construed as a potential conflict of interest.
The author(s) declared that they were an editorial board member of Frontiers, at the time of submission. This had no impact on the peer review process and the final decision.
Generative AI statement
The author(s) declare that no Generative AI was used in the creation of this manuscript.
Publisher’s note
All claims expressed in this article are solely those of the authors and do not necessarily represent those of their affiliated organizations, or those of the publisher, the editors and the reviewers. Any product that may be evaluated in this article, or claim that may be made by its manufacturer, is not guaranteed or endorsed by the publisher.
Supplementary material
The Supplementary Material for this article can be found online at: https://www.frontiersin.org/articles/10.3389/frsen.2025.1581355/full#supplementary-material
References
Abdi, H., and Williams, L. J. (2010). Tukey’s honestly significant difference (hsd) test. Encycl. Res. Des. 3, 1–5.
Apel, K., and Hirt, H. (2004). Reactive oxygen species: metabolism, oxidative stress, and signal transduction. Annu. Rev. Plant Biol. 55, 373–399. doi:10.1146/annurev.arplant.55.031903.141701
Atzberger, C. (2000). Development of an invertible forest reflectance model: the infor-model. In A decade of trans-european remote sensing cooperation. Proceedings of the 20th EARSeL Symposium Dresden, Germany. vol. 14, 39–44.
Campbell, G. (1990). Derivation of an angle density function for canopies with ellipsoidal leaf angle distributions. Agric. For. meteorology 49, 173–176. doi:10.1016/0168-1923(90)90030-A
Chauhan, J., Singh, P., Choyal, P., Mishra, U. N., Saha, D., Kumar, R., et al. (2023). Plant photosynthesis under abiotic stresses: damages, adaptive, and signaling mechanisms. Plant Stress 100296doi. doi:10.1016/j.stress.2023.100296
Chaves, M. M., Flexas, J., and Pinheiro, C. (2009). Photosynthesis under drought and salt stress: regulation mechanisms from whole plant to cell. Ann. Bot. 103, 551–560. doi:10.1093/aob/mcn125
Chuvieco, E., Riaño, D., Aguado, I., and Cocero, D. (2002). Estimation of fuel moisture content from multitemporal analysis of landsat thematic mapper reflectance data: applications in fire danger assessment. Int. J. remote Sens. 23, 2145–2162. doi:10.1080/01431160110069818
Coatsworth, P., Gonzalez-Macia, L., Collins, A. S. P., Bozkurt, T., and Güder, F. (2023). Continuous monitoring of chemical signals in plants under stress. Nat. Rev. Chem. 7, 7–25. doi:10.1038/s41570-022-00443-0
Collins, W. (1978). Remote sensing of crop type and maturity. Photogrammetric Eng. Remote Sens. 44, 43–55.
Crespo, N., Pádua, L., Paredes, P., Rebollo, F. J., Moral, F. J., Santos, J. A., et al. (2025). Spatial–temporal dynamics of vegetation indices in response to drought across two traditional olive orchard regions in the iberian peninsula. Sensors Basel, Switz. 25, 1894. doi:10.3390/s25061894
Dhoundiyal, S., Porwal, A., Niveditha, C., Thangjam, G., Aranha, M., Kumar, S., et al. (2023). A novel algorithm for mapping carbonates using crism hyperspectral data. Icarus 397, 115504. doi:10.1016/j.icarus.2023.115504
Dumanović, J., Nepovimova, E., Natić, M., Kuča, K., and Jaćević, V. (2021). The significance of reactive oxygen species and antioxidant defense system in plants: a concise overview. Front. plant Sci. 11, 552969. doi:10.3389/fpls.2020.552969
Farooq, M., Wahid, A., Kobayashi, N., Fujita, D., and Basra, S. (2009). Plant drought stress: effects, mechanisms and management. Sustain. Agric., 153–188. doi:10.1007/978-90-481-2666-8_12
Flexas, J., Bota, J., Galmés, J., Medrano, H., and Ribas-Carbó, M. (2006). Keeping a positive carbon balance under adverse conditions: responses of photosynthesis and respiration to water stress. Physiol. Plant. 127, 343–352. doi:10.1111/j.1399-3054.2006.00621.x
Fokeng, R. M., and Fogwe, Z. N. (2022). Landsat ndvi-based vegetation degradation dynamics and its response to rainfall variability and anthropogenic stressors in southern bui plateau, Cameroon. Geosystems Geoenvironment 1, 100075. doi:10.1016/j.geogeo.2022.100075
Gao, B.-C. (1996). Ndwi—a normalized difference water index for remote sensing of vegetation liquid water from space. Remote Sens. Environ. 58, 257–266. doi:10.1016/S0034-4257(96)00067-3
Gates, D. M., Keegan, H. J., Schleter, J. C., and Weidner, V. R. (1965). Spectral properties of plants. Appl. Opt. 4, 11–20. doi:10.1364/AO.4.000011
Gholamin, R., and Khayatnezhad, M. (2011). The effect of end season drought stress on the chlorophyll content, chlorophyll fluorescence parameters and yield in maize cultivars. Sci. Res. Essays 6, 5351–5357.
Gitelson, A. A. (2004). Wide dynamic range vegetation index for remote quantification of biophysical characteristics of vegetation. J. plant physiology 161, 165–173. doi:10.1078/0176-1617-01176
Gitelson, A. A., Merzlyak, M. N., and Lichtenthaler, H. K. (1996). Detection of red edge position and chlorophyll content by reflectance measurements near 700 nm. J. plant physiology 148, 501–508. doi:10.1016/s0176-1617(96)80285-9
Gu, Y., Hunt, E., Wardlow, B., Basara, J. B., Brown, J. F., and Verdin, J. P. (2008). Evaluation of modis ndvi and ndwi for vegetation drought monitoring using Oklahoma mesonet soil moisture data. Geophys. Res. Lett. 35. doi:10.1029/2008GL035772
Guha, A., Vinod Kumar, K., Porwal, A., Rani, K., Sahoo, K., Aneesh Kumar, S., et al. (2019). Reflectance spectroscopy and aster based mapping of rock-phosphate in parts of paleoproterozoic sequences of aravalli group of rocks, Rajasthan, India. Ore Geol. Rev. 108, 73–87. doi:10.1016/j.oregeorev.2018.02.021
Hardisky, M. A., Klemas, V., and Smart, R. (1983). The influence of soil salinity, growth form, and leaf moisture on-the spectral radiance of spartina alterniflora canopies. Photogrammetric Eng. Remote Sens. 49, 77–83.
Hazrati, S., Tahmasebi-Sarvestani, Z., Modarres-Sanavy, S. A. M., Mokhtassi-Bidgoli, A., and Nicola, S. (2016). Effects of water stress and light intensity on chlorophyll fluorescence parameters and pigments of aloe vera l. Plant Physiology Biochem. 106, 141–148. doi:10.1016/j.plaphy.2016.04.046
Horler, D., Barber, J., and Barringer, A. (1980). Effects of heavy metals on the absorbance and reflectance spectra of plants. Int. J. Remote Sens. 1, 121–136. doi:10.1080/01431168008547550
Horler, D., Dockray, M., Barber, J., and Barringer, A. (1983). Red edge measurements for remotely sensing plant chlorophyll content. Adv. Space Res. 3, 273–277. doi:10.1016/0273-1177(83)90130-8
Huete, A. R. (1988). A soil-adjusted vegetation index (savi). Remote Sens. Environ. 25, 295–309. doi:10.1016/0034-4257(88)90106-X
Huete, A. R., Jackson, R. D., and Post, D. (1985). Spectral response of a plant canopy with different soil backgrounds. Remote Sens. Environ. 17, 37–53. doi:10.1016/0034-4257(85)90111-7
Hussain, H. A., Hussain, S., Khaliq, A., Ashraf, U., Anjum, S. A., Men, S., et al. (2018). Chilling and drought stresses in crop plants: implications, cross talk, and potential management opportunities. Front. plant Sci. 9, 393. doi:10.3389/fpls.2018.00393
Jacquemoud, S., and Baret, F. (1990). Prospect: a model of leaf optical properties spectra. Remote Sens. Environ. 34, 75–91. doi:10.1016/0034-4257(90)90100-Z
Jacquemoud, S., and Ustin, S. (2019). “Spectroscopy of leaf molecules,” in Leaf optical properties (Cambridge University Press), 48–73. doi:10.1017/9781108686457.003
Jacquemoud, S., Verhoef, W., Baret, F., Bacour, C., Zarco-Tejada, P. J., Asner, G. P., et al. (2009). Prospect+ sail models: a review of use for vegetation characterization. Remote Sens. Environ. 113, S56–S66. doi:10.1016/j.rse.2008.01.026
Knyazikhin, Y., Martonchik, J., Diner, D., Myneni, R., Verstraete, M., Pinty, B., et al. (1998). Estimation of vegetation canopy leaf area index and fraction of absorbed photosynthetically active radiation from atmosphere-corrected misr data. J. Geophys. Res. Atmos. 103, 32239–32256. doi:10.1029/98JD02461
Kumar, S., Ghosh, S. S., Mandal, D., Porwal, A., and Bhattacharya, A. (2023). “A sentinel-2 vegetation health index,” in 2023 IEEE India geoscience and remote sensing symposium (InGARSS) (IEEE), 1–4.
Kumar, S., Nihar, A., Verma, A., Ghosh, S. S., and Bhattacharya, A. (2024). “Crop residue burning and its impact on air quality: a case study on northern India,” in IGARSS 2024-2024 IEEE international geoscience and remote sensing symposium (IEEE), 863–866.
Kupfer, J. A., and Emerson, C. W. (2005). “Remote sensing,” in Encyclopedia of social measurement. Editor K. Kempf-Leonard (New York: Elsevier), 377–383. doi:10.1016/B0-12-369398-5/00340-6
Kuusk, A. (1995). A fast, invertible canopy reflectance model. Remote Sens. Environ. 51, 342–350. doi:10.1016/0034-4257(94)00059-V
Lang, M., Lichtenthaler, H. K., Sowinska, M., Heisel, F., and Miehé, J. A. (1996). Fluorescence imaging of water and temperature stress in plant leaves. J. plant physiology 148, 613–621. doi:10.1016/S0176-1617(96)80082-4
Lawlor, D. W., and Cornic, G. (2002). Photosynthetic carbon assimilation and associated metabolism in relation to water deficits in higher plants. Plant, cell & Environ. 25, 275–294. doi:10.1046/j.0016-8025.2001.00814.x
Lichtenthaler, H. K. (1996). Vegetation stress: an introduction to the stress concept in plants. J. plant physiology 148, 4–14. doi:10.1016/S0176-1617(96)80287-2
Lichtenthaler, H. K. (1998). The stress concept in plants: an introduction. Ann. N. Y. Acad. Sci. 851, 187–198. doi:10.1111/j.1749-6632.1998.tb08993.x
Lichtenthaler, H. K., and Rinderle, U. (1988). The role of chlorophyll fluorescence in the detection of stress conditions in plants. CRC Crit. Rev. Anal. Chem. 19, S29–S85. doi:10.1080/15476510.1988.10401466
Liu, H. Q., and Huete, A. (1995). A feedback based modification of the ndvi to minimize canopy background and atmospheric noise. IEEE Trans. geoscience remote Sens. 33, 457–465. doi:10.1109/36.377946
Matsushita, B., Yang, W., Chen, J., Onda, Y., and Qiu, G. (2007). Sensitivity of the enhanced vegetation index (evi) and normalized difference vegetation index (ndvi) to topographic effects: a case study in high-density cypress forest. Sensors 7, 2636–2651. doi:10.3390/s7112636
Morcillo-Pallarés, P., Rivera-Caicedo, J. P., Belda, S., De Grave, C., Burriel, H., Moreno, J., et al. (2019). Quantifying the robustness of vegetation indices through global sensitivity analysis of homogeneous and forest leaf-canopy radiative transfer models. Remote Sens. 11, 2418. doi:10.3390/rs11202418
Osakabe, Y., Osakabe, K., Shinozaki, K., and Tran, L.-S. P. (2014). Response of plants to water stress. Front. plant Sci. 5, 86. doi:10.3389/fpls.2014.00086
Paliwal, A., Laborte, A., Nelson, A., and Singh, R. (2019). Salinity stress detection in rice crops using time series modis vi data. Int. J. remote Sens. 40, 8186–8202. doi:10.1080/01431161.2018.1513667
Pearson, R. L., and Miller, L. D. (1972). Remote mapping of standing crop biomass for estimation of the productivity of the shortgrass prairie. Remote Sens. Environ. VIII, 1355.
Pettorelli, N., Vik, J. O., Mysterud, A., Gaillard, J.-M., Tucker, C. J., and Stenseth, N. C. (2005). Using the satellite-derived ndvi to assess ecological responses to environmental change. Trends Ecol. & Evol. 20, 503–510. doi:10.1016/j.tree.2005.05.011
Prasad, T. K., Anderson, M. D., Martin, B. A., and Stewart, C. R. (1994). Evidence for chilling-induced oxidative stress in maize seedlings and a regulatory role for hydrogen peroxide. Plant Cell 6, 65–74. doi:10.1105/tpc.6.1.65
Rock, B., Hoshizaki, T., and Miller, J. (1988). Comparison of in situ and airborne spectral measurements of the blue shift associated with forest decline. Remote Sens. Environ. 24, 109–127. doi:10.1016/0034-4257(88)90008-9
Roerink, G. J., Menenti, M., Soepboer, W., and Su, Z. (2003). Assessment of climate impact on vegetation dynamics by using remote sensing. Phys. Chem. Earth, Parts A/B/C 28 28, 103–109. doi:10.1016/S1474-7065(03)00011-1
Rosema, A., Verhoef, W., Noorbergen, H., and Borgesius, J. (1992). A new forest light interaction model in support of forest monitoring. Remote Sens. Environ. 42, 23–41. doi:10.1016/0034-4257(92)90065-R
Rouse Jr, J. W., Haas, R. H., Deering, D., Schell, J., and Harlan, J. C. (1974). Monitoring the vernal advancement and retrogradation (green wave effect) of natural vegetation. Tech. Rep.
Sahu, P. K., Jayalakshmi, K., Tilgam, J., Gupta, A., Nagaraju, Y., Kumar, A., et al. (2022). Ros generated from biotic stress: effects on plants and alleviation by endophytic microbes. Front. Plant Sci. 13, 1042936. doi:10.3389/fpls.2022.1042936
Saltelli, A. (2002). Making best use of model evaluations to compute sensitivity indices. Comput. Phys. Commun. 145, 280–297. doi:10.1016/S0010-4655(02)00280-1
Saltelli, A., Ratto, M., Andres, T., Campolongo, F., Cariboni, J., Gatelli, D., et al. (2008). Global sensitivity analysis: the primer. John Wiley & Sons. doi:10.1002/9780470725184
Samanta, A., Ganguly, S., Hashimoto, H., Devadiga, S., Vermote, E., Knyazikhin, Y., et al. (2010). Amazon forests did not green-up during the 2005 drought. Geophys. Res. Lett. 37. doi:10.1029/2009GL042154
Schlerf, M., and Atzberger, C. (2006). Inversion of a forest reflectance model to estimate structural canopy variables from hyperspectral remote sensing data. Remote Sens. Environ. 100, 281–294. doi:10.1016/j.rse.2005.10.006
Schweiger, J., Lang, M., and Lichtenthaler, H. K. (1996). Differences in fluorescence excitation spectra of leaves between stressed and non-stressed plants. J. Plant Physiology 148, 536–547. doi:10.1016/S0176-1617(96)80073-3
Seelig, H.-D., Hoehn, A., Stodieck, L., Klaus, D., Adams Iii, W., and Emery, W. (2008). The assessment of leaf water content using leaf reflectance ratios in the visible, near-and short-wave-infrared. Int. J. Remote Sens. 29, 3701–3713. doi:10.1080/01431160701772500
Sharma, P., Jha, A. B., Dubey, R. S., and Pessarakli, M. (2012). Reactive oxygen species, oxidative damage, and antioxidative defense mechanism in plants under stressful conditions. J. Bot. 2012, 1–26. doi:10.1155/2012/217037
Sobol, I., and Levitan, Y. L. (1999). A pseudo-random number generator for personal computers. Comput. & Math. Appl. 37, 33–40. doi:10.1016/S0898-1221(99)00057-7
Sobol’, I. M. (1967). On the distribution of points in a cube and the approximate evaluation of integrals. USSR Comput. Math. Math. Phys. 7, 86–112. doi:10.1016/0041-5553(67)90144-9
Sobol’, I. M. (1990). On sensitivity estimation for nonlinear mathematical models. Mat. Model. 2, 112–118.
Swathandran, S., and Aslam, M. M. (2019). Assessing the role of swir band in detecting agricultural crop stress: a case study of raichur district, Karnataka, India. Environ. Monit. Assess. 191, 442. doi:10.1007/s10661-019-7566-1
Tao, Z., Shi, R., Gastellu-Etchegorry, J.-P., Shi, J., Wu, N., Tian, B., et al. (2021). Effects of plant and scene modeling on canopy ndvi simulation: a case study on phragmites australis and spartina alterniflora. IEEE J. Sel. Top. Appl. Earth Observations Remote Sens. 14, 6451–6466. doi:10.1109/jstars.2021.3088580
Verhoef, W. (1984). Light scattering by leaf layers with application to canopy reflectance modeling: the sail model. Remote Sens. Environ. 16, 125–141. doi:10.1016/0034-4257(84)90057-9
Verhoef, W. (1985). Earth observation modeling based on layer scattering matrices. Remote Sens. Environ. 17, 165–178. doi:10.1016/0034-4257(85)90072-0
Verrelst, J., Rivera, J., Alonso, L., and Moreno, J. (2011). “Artmo: an automated radiative transfer models operator toolbox for automated retrieval of biophysical parameters through model inversion,” in Proceedings of the EARSeL 7th SIG-imaging spectroscopy workshop (Edinburgh, UK), 11–13.
Wang, S., Yang, D., Li, Z., Liu, L., Huang, C., and Zhang, L. (2019). A global sensitivity analysis of commonly used satellite-derived vegetation indices for homogeneous canopies based on model simulation and random forest learning. Remote Sens. 11, 2547. doi:10.3390/rs11212547
Wang, X., Gan, Y., Iio, A., and Wang, Q. (2025). Using vegetation indices developed for sentinel-2 multispectral data to track spatiotemporal changes in the leaf area index of temperate deciduous forests. Geomatics 5, 11. doi:10.3390/geomatics5010011
Wen, Z., Wu, S., Chen, J., and Lü, M. (2017). Ndvi indicated long-term interannual changes in vegetation activities and their responses to climatic and anthropogenic factors in the three gorges reservoir region, China. Sci. Total Environ. 574, 947–959. doi:10.1016/j.scitotenv.2016.09.049
Wilson, E. H., and Sader, S. A. (2002). Detection of forest harvest type using multiple dates of landsat tm imagery. Remote Sens. Environ. 80, 385–396. doi:10.1016/S0034-4257(01)00318-2
Wilson, N. R., and Norman, L. M. (2018). Analysis of vegetation recovery surrounding a restored wetland using the normalized difference infrared index (ndii) and normalized difference vegetation index (ndvi). Int. J. Remote Sens. 39, 3243–3274. doi:10.1080/01431161.2018.1437297
Zhang, L., Jiao, W., Zhang, H., Huang, C., and Tong, Q. (2017). Studying drought phenomena in the continental United States in 2011 and 2012 using various drought indices. Remote Sens. Environ. 190, 96–106. doi:10.1016/j.rse.2016.12.010
Keywords: vegetation health index, vegetation index, global sensitivity analysis, radiative transfer model, spectroscopy, leaf water content
Citation: Kumar S, Ghosh SS, Mandal D, Bhattacharya A, Porwal A and Karthikeyan L (2025) Enhancing vegetation monitoring: a proposal for a Sentinel-2 based vegetation health index. Front. Remote Sens. 6:1581355. doi: 10.3389/frsen.2025.1581355
Received: 22 February 2025; Accepted: 09 June 2025;
Published: 30 June 2025.
Edited by:
Margaret Kalacska, McGill University, CanadaReviewed by:
Peilin Song, Xi’an Jiaotong University, ChinaRicky Anak Kemarau, National University of Malaysia, Malaysia
Copyright © 2025 Kumar, Ghosh, Mandal, Bhattacharya, Porwal and Karthikeyan. This is an open-access article distributed under the terms of the Creative Commons Attribution License (CC BY). The use, distribution or reproduction in other forums is permitted, provided the original author(s) and the copyright owner(s) are credited and that the original publication in this journal is cited, in accordance with accepted academic practice. No use, distribution or reproduction is permitted which does not comply with these terms.
*Correspondence: L. Karthikeyan , a2FydGhpa2xAaWl0Yi5hYy5pbg==