 Andrew Yoshimura
 Christoph W. Borst
- Center for Advanced Computer Studies, University of Louisiana at Lafayette, Lafayette, LA, United States
We study student experiences of social VR for remote instruction, with students attending class from home. The study evaluates student experiences when: (1) viewing remote lectures with VR headsets, (2) viewing with desktop displays, (3) presenting with VR headsets, and (4) reflecting on several weeks of VR-based class attendance. Students rated factors such as presence, social presence, simulator sickness, communication methods, avatar and application features, and tradeoffs with other remote approaches. Headset-based viewing and presenting produced higher presence than desktop viewing, but had less-clear impact on overall experience and on most social presence measures. We observed higher attentional allocation scores for headset-based presenting than for both viewing methods. For headset VR, there were strong negative correlations between simulator sickness (primarily reported as general discomfort) and ratings of co-presence, overall experience, and some other factors. This suggests that comfortable users experienced substantial benefits of headset viewing and presenting, but others did not. Based on the type of virtual environment, student ratings, and comments, reported discomfort appears related to physical ergonomic factors or technical problems. Desktop VR appears to be a good alternative for uncomfortable students, and students report that they prefer a mix of headset and desktop viewing. We additionally provide insight from students and a teacher about possible improvements for VR class technology, and we summarize student opinions comparing viewing and presenting in VR to other remote class technologies.
1. Introduction
Many universities recently switched in-person classes to remote classes to provide safe instruction during the spread of the SARS-CoV-2 virus. Remote classes also have various motivations such as those related to reducing travel: reduced carbon use (Le et al., 2020), saved time, and removing geographic constraints. Remote classes possibly reduce social stress, for example, by not requiring students to be seen physically.
Remote classes are commonly delivered with video tools such as Zoom or Skype. These may lack some interactivity or quality of in-person lectures. Networked VR offers an alternative that may provide benefits from increased presence (general and social) and social interactions. Educational VR may be best-suited to environments that emphasize spatial learning. But, it is studied less often for lecture-style classes. Although there is substantial prior work considering VR for education (Radianti et al., 2019), there is minimal published work on students attending class using headset VR in homes, or on such students presenting class assignments with VR headsets.
We present a study of a class that was delivered remotely using a social VR platform (Mozilla Hubs). The study considered a natural “real-world” setting in that students were at home, using various consumer devices, and the study did not change course content or delivery methods (which resulted from a VR class using remote instruction during the spread of SARS-CoV-2). The study evaluated student experiences viewing lectures in both VR headsets and on desktop monitors. We additionally evaluated student experiences presenting project updates in VR headsets. Class content (lecture content and project updates) was presented by both a teacher and students using VR headsets and tracked controllers, during 7 weeks of remote class.
We previously reported the resulting higher presence for headset viewing overall (Yoshimura and Borst, 2020a,b). Strong negative correlations of headset simulator sickness and various rating subscales suggested that comfortable users (not experiencing discomfort-based sickness) experienced additional benefits of headset VR, but others did not. This paper substantially extends the prior results. It investigates student experiences when presenting in headset VR, and it adds new insights such as ranking of technologies for attending and presenting in remote classes, how well several class styles help students stay motivated, additional details about how system features were used (room visitation and downloading of content), virtual room preference, and student's ratings of reasons to use or avoid VR for classes.
Students in our study rated factors such as presence, social presence, usability, and sickness. Additional questionnaire topics investigated communication methods, avatar features, Hubs features, etc. Results suggest that social VR platforms can be effective for remote classes, with the exception of simulator sickness (mostly related to general discomfort) and technical difficulties. Even though some students experienced substantial discomfort, headset viewing and presenting provided increased presence overall. We also observe increased attentional allocation of headset presenting over both viewing conditions. Even students with negative headset experiences reported high expectations for VR as a remote class platform for the future. Considering high correlations between reported sickness and other ratings in the headset conditions (viewing and presenting), results suggest that future VR technologies with improved comfort will give additional advantages of headset viewing over desktop viewing. In the meantime, desktop viewing is a good alternative for those students who experience sickness or technical problems with headsets.
2. Related Work
The use of VR for education has been suggested to increase presence, motivation, and engagement (Abulrub et al., 2011; Psotka, 2013; Borst et al., 2018; Parong and Mayer, 2018; Makransky et al., 2019; Meyer et al., 2019). Gregory et al. (2013) summarized the use of VWs (Virtual Worlds) at 19 surveyed institutions. Many of the VWs used Second Life, OpenSim, and Unity3d. The VWs were used for the following activities: role play activities (9), machinima (4), virtual tours (5), Ph.D. students (2), staff or faculty development (2), career services (2), and institutional marketing (2). Additionally, all of the institutions were using VWs for “research, collaboration, and communication.” The VWs were primarily used with standard desktop interfaces.
Other attempts to deliver remote content with VR include a 2011 study wherein IBM hosted a meeting in Second Life, an online 3D world with avatars, typically viewed on a desktop monitor (Erickson et al., 2011). The virtual event was described as “fairly successful” with the exception of technical problems. Second life was also used for the remote program committee meeting of IEEE VR 2009 (Lindeman et al., 2009). Results suggested that not many users had technical difficulties, even with little experience. Users did not prefer Second Life to a face-to-face meeting, likely due to the lack of presence of desktop VR. Campbell et al. (2019) found headset VR improved presence, closeness, and arousal, for business meetings, when compared to video-based meetings. Additionally, they reported that female participants preferred VR avatars to real-life imagery. Borst et al. (2018) showed a benefit of incorporating live guidance by a teacher into networked VR for virtual field trips by small classes, finding high ratings of presence, social presence, and other factors. Simulator sickness was not found to be substantial, but external distractions were found problematic when present.
Recently, Mozilla Hubs1 is gaining recognition for remote VR presentations. Hubs is a web-based social VR platform that supports many devices. Le et al. used it for an ACM UIST 2019 virtual poster session. They observed an increased sense of presence and state that “the participants felt involved… as if they were watching the talks in the conference hall” (Le et al., 2020). Hubs was also used for the IEEE VR 2020 conference as an optional meeting platform. Ahn et al. discuss survey results and observations made at the conference, and they provide insights about future directions for virtual conferences in the face of the COVID-19 pandemic (Ahn et al., 2021). Steinicke et al. (2020) ran a preliminary study comparing group meetings in VR (headset and desktop) via Mozilla Hubs and with video conferencing via Zoom. They reported higher social presence with headset VR than with Zoom video for a group meeting. Usability was rated as acceptable for headset VR and video-conferencing, but found unacceptable for desktop VR, which contrasts with results seen in this paper.
We use the terms headset VR (high immersion) and desktop VR (low immersion) as in Makransky et al. (2019). Desktop VR involves “a conventional PC monitor… controlled through a regular computer mouse” and headset VR is the conventional use of a VR headset. Neither desktop nor headset VR has consistently been found better in VR work comparing their use in virtual environments. Some studies found that desktop VR outperforms headset VR in learning (Makransky et al., 2019; Srivastava et al., 2019), navigation (Sousa Santos et al., 2009), or memory-based scenarios (Roettl and Terlutter, 2018). This may be due to increased cognitive load for headset VR (Roettl and Terlutter, 2018; Makransky et al., 2019). Murcia-Lopez and Steed found that headset VR outperformed desktop for spatial learning in a high-fidelity environment (Murcia-López and Steed, 2016). Oberdörfer et al. found higher enjoyment for headset VR in a serious game for affine transformations, suggesting that using immersive VR enhances learning quality (Oberdörfer et al., 2019). Another study favored headset VR for cognition (Parmar et al., 2016). More recently, Ryu and Kim compared desktop, VR headsets, and a mixed mode for viewing a lecture in Mozilla Hubs. The mixed mode used a custom fixture to simplify switching between desktop and immersive modes. They found that participants preferred the mixed mode, stating that it brings the “best of both worlds” (Ryu and Kim, 2021). There has been speculation about limited validity when presence questions are used to compare between these display types, corresponding to a lack of significant differences in some studies (Usoh et al., 2000). Viewers may interpret presence questions differently for different display types.
Based on prior work, we believe VR has substantial promise for remote classes. However, for effective remote learning, factors like technical difficulties, distractions, and viewing-related discomfort need to be understood. Studies of technologies like video-conferencing show that although they may be good for remote learning, technical problems or distractions are common drawbacks (Freeman, 1998; Jennings and Bronack, 2001; Grant and Cheon, 2007; Erickson et al., 2011). Our work in this paper gives insight into student experiences and technical limitations for “in-the-wild” (home-based) attendance of remote VR classes, and it investigates two viewing styles (desktop/headset) for possible tradeoffs.
3. Materials and Methods
3.1. Overview
Our main goal was to study real-world experiences of VR for remote instruction to homes, to guide future research and development. Our study was conducted during 7 weeks of a remote class that met entirely in Hubs. One aspect of the study was to consider possible differences in experiences when viewing type or activity varied. Specifically, the independent variable was the student activity type (headset viewing, headset presenting, or desktop viewing), in a within-subjects structure.
3.2. Class Environment With Mozilla Hubs
We used Hubs because it is “lightweight” and usable on many devices including desktops, standalone headsets, and PC-driven headsets. Other social VR platforms such as AltspaceVR, Engage, Virbela, VR Chat, etc. have varying levels of accessibility in terms of cost and portability, but we expect substantial feature overlap when used for lectures. Feature comparisons can be found online (e.g., Schultz, 2019).
Hubs features are rudimentary but support key aspects of remote VR classes. Features that we used include: upload/download of lecture slides and videos, per-user selectable avatars with tracked head and hands, livestream video of the teacher, viewing capabilities like maximizing content with a button, walk/fly/teleport navigation, voice/text chat, and emojis emitted from avatars.
Figure 1 shows a Hubs lecture with a mix of students using desktop VR and headset VR. The image shows a lecture screen (uploaded PDF content) near its center, uploaded video objects to the right of the screen, a teacher avatar near the bottom left of the lecture screen, a live-streamed webcam view of the teacher to the left of the screen, and student avatars in the virtual room. Some students were floating (fly-mode) for a better view.
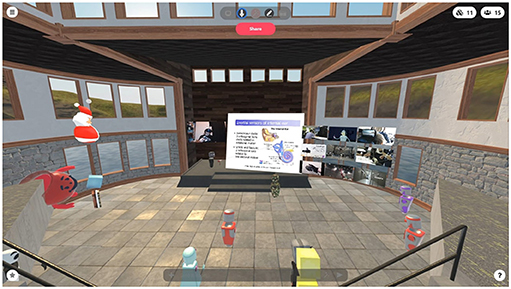
Figure 1. A Lecture in Mozilla Hubs as viewed by an audience member at the back of the room, showing the full field of view for desktop viewing.
The teacher used a Vive Cosmos headset to present in VR. Lectures introduced VR devices, their relation to human senses, and interface topics. Lectures were held twice a week and lasted 75 min each, with the last 15–20 min reserved for questionnaires. Students occasionally presented their own content related to semester projects, which were either game-type projects or independent studies with implementation.
Figure 2 shows a student presenting their project update in a VR headset. Four lecture periods were reserved as presentation days, where students presented their project content one after the other. Main presentation content consisted of slides and these were usually accompanied by supplementary materials such as embedded videos, a timeline to show project progress, and sometimes 3D objects in the virtual environment.
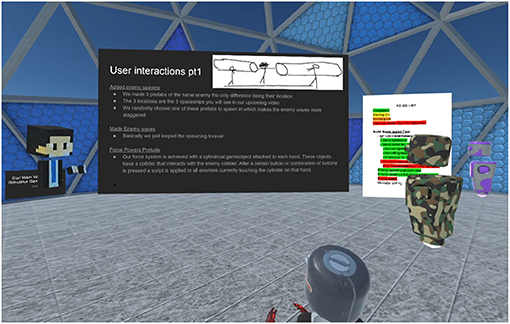
Figure 2. A student presenting a project update in Mozilla Hubs, as viewed by an audience member. The presenter is seen at the left. The field of view has been cropped for clarity.
Depending on a viewing condition, each student in the study attended with a headset or on their desktop. Student presentations were given via students presenting in VR headsets. Various headsets were used by the students: five Oculus Quests (four standalone and one PC-driven via Oculus Link), four Oculus Rift CV1s, one Oculus Rift S, one Windows Mixed Reality HP headset, one Windows Mixed Reality Odyssey+ headset, and one HTC Vive. All of these devices have 6-degree-of-freedom tracking and 2 hand controllers. We believe 6-dof head tracking is essential for a good experience, because 3-dof devices suffer from a visual-proprioceptive mismatch that contributes to motion sickness. Monitor sizes for desktop viewing ranged from 13 to 42 inches, with a median of 17.5 inches.
3.3. Participants
The study includes 13 students: 11 undergraduates and 2 graduate students. The students' ages ranged from 20 to 24 years old. Twelve of 13 students identified as male, with the remaining student identifying as female. One additional student attended but was omitted due to severe technical problems reported as network failures. All students were pursuing computer science degrees.
Although these students are not representative of the general population, they are an important demographic group for the early adoption of emerging technology and due to the growth of this major at universities. Most students had limited prior VR experience and the study shows a range of resulting experiences.
Six of the 13 students never used virtual reality before the class, with 4 others having used VR more than 20 times and the remaining 3 having used VR a median of “3–5” times. Only three students had ever used VR chat-rooms outside of class. None had used VR to watch or give formal presentations. Ten of 13 students had given in-person formal presentations in regular classes.
Eleven of 13 of students had prior experience with video tools like Skype, Zoom, or Twitch. Ten had prior experience using these tools to watch a formal presentation. However, most students (8 of 13) had never used such tools to give a formal presentation.
Students' other classes used non-VR remote delivery in parallel with our class. Nine students took at least one live video class with a teacher and students seeing each other (multi-way live video), 6 students took at least one live video class with only teacher-to-student video (one-way live video), 8 students took at least one pre-recorded video class, and 9 students took at least one other type of class including: other uploaded content only (3 responses) and project classes with no lecture content (1 response).
3.4. Procedure
On selected days, students answered questionnaires with 7-point ratings, 4-point ratings, multiple choice, and short answer items. Questionnaires were distributed by a proctor at the end of the class sessions (the proctor was present in the Hubs audience for the entire class).
The questions are listed in Appendices A1–A4 (Supplementary Material). We included our own questions and abbreviated versions of: immersive tendencies (ITQ) (Witmer and Singer, 1998), SUS-Presence (Slater et al., 1994), Networked Minds Social Presence (Harms and Biocca, 2004), System Usability Scale (Brooke, 1996), and simulator sickness (SSQ) (Kennedy et al., 1993). The questionnaires consisted of:
• Background Questionnaire: All students answered a background questionnaire once in the second week of remote lectures.
• Desktop and Headset Viewing Questionnaires: Viewing questionnaires were given during the last 15 min of a class attended either in headset or on desktop. Desktop and headset versions differed slightly to refer to headset or desktop devices. To reduce order effects and due to difficulties with headset distribution, 5 of the 13 students rated headset viewing first (in the second week) and desktop viewing later (fifth week). The other students experienced conditions in reversed order in those weeks. We note that the unequal split did not favor headset viewing in results: 4 of 5 students who reported high sickness with headsets were in the later group and tended to give low headset ratings then (section 4.2).
• Headset Presenting Questionnaire: Headset presenting questionnaires were given after all student presentations were complete for the lecture period. 7 of 13 students rated the presenting experience in the third week, with the remaining students rating it in the sixth week. Due to the one-way nature of the presenter questionnaire, it had some items omitted relative to the viewing questionnaire, resulting in fewer items combined into some subscales (Figure 4).
• Final Questionnaire: A final questionnaire was given on the last day of class (week 7). For this questionnaire, students were asked to reflect on their overall experience of the 7 weeks.
3.5. Standard Viewing/Presenting Questionnaire Items
Below we summarize 26 of the questionnaire items for an analysis of student experience ratings in section 4.1. For convenience of reference, we name them the standard items.
3.5.1. Overall Experience
A single question about overall experience gauged the general impression that students have of the VR lectures.
3.5.2. SUS Presence
Presence in a (virtual) classroom is arguably the most notable feature that VR can add to remote lectures. We selected 3 items from the SUS-Presence Questionnaire (Slater et al., 1994), rewording them to correspond to a virtual classroom.
3.5.3. Social Presence
We based several social presence items on Networked Minds Social Presence Questionnaire (Harms and Biocca, 2004).
Co-presence is the “degree to which the observer believes he/she is not alone and secluded, their level of peripheral or focal awareness of the other, and their sense of the degree to which the other is peripherally or focally aware of them” (Harms and Biocca, 2004). Co-presence may correlate well with presence (e.g., Slater et al., 2000). We believe co-presence is important in classes by promoting engagement with others. Students may not feel like they belong to a university class if they do not experience co-presence. With many universities recently switching to remote classes, this sense of belonging could be vital.
Attentional allocation “addresses the amount of attention the user allocates to and receives from an interactant” (Harms and Biocca, 2004). It lets us know if students are able to focus on others when they speak, and if they think others focus on them.
Perceived message understanding tells us if students understand the teacher and if they think the teacher understands them.
Affective understanding is “the user's ability to understand an interactant's emotional and attitudinal states as well as their perception of the interactant's ability to understand emotional states and attitudinal states” (Harms and Biocca, 2004). It is important, for example, to know if the audience understands a presenter's attitude (e.g., if the presenter is more serious about a topic, students may focus more).
Emotional interdependence is “the extent to which the user's emotional and attitudinal state affects and is affected by the emotional and attitudinal states of the interactant” (Harms and Biocca, 2004). Engagement between students and a teacher is important in educational environments.
Behavioral interdependence is “the extent to which a user's behavior affects and is affected by the interactant's behavior” (Harms and Biocca, 2004). Related engagement between participants may be helpful for education.
3.5.4. Usability
For deployment to a wide range of students, it is important for remote instruction tools to be easy to learn and use. We selected two key items from the System Usability Scale (Brooke, 1996).
4. Results
4.1. Viewing/Presenting Questionnaires: Experience Ratings
Figures 3, 4 summarize response distributions for standard questionnaire items from viewing and presenting questionnaires. Table 1 shows mean and median subscale scores, where a student's subscale score is computed as the average of contributing items in Figures 3, 4. The table also shows statistical comparison between desktop viewing, headset viewing, and presenting subscale scores. Due to the small sample size and the general nature of the questionnaire responses, we used non-parametric tests (Friedman tests, followed by post-hoc Wilcoxon Signed-Ranks Tests). Four subscales (co-presence, attentional allocation, perceived message understanding, perceived affective understanding) in the presenter questionnaire had questions removed (because those question ask about the presenter). In order to fairly compare desktop/headset viewing subscales with reduced presenter subscales, we used an abbreviated version of desktop/headset viewing subscales with respective questions removed. Appendix B (Supplementary Material) considers subscale reliability based on Cronbach's Alpha.
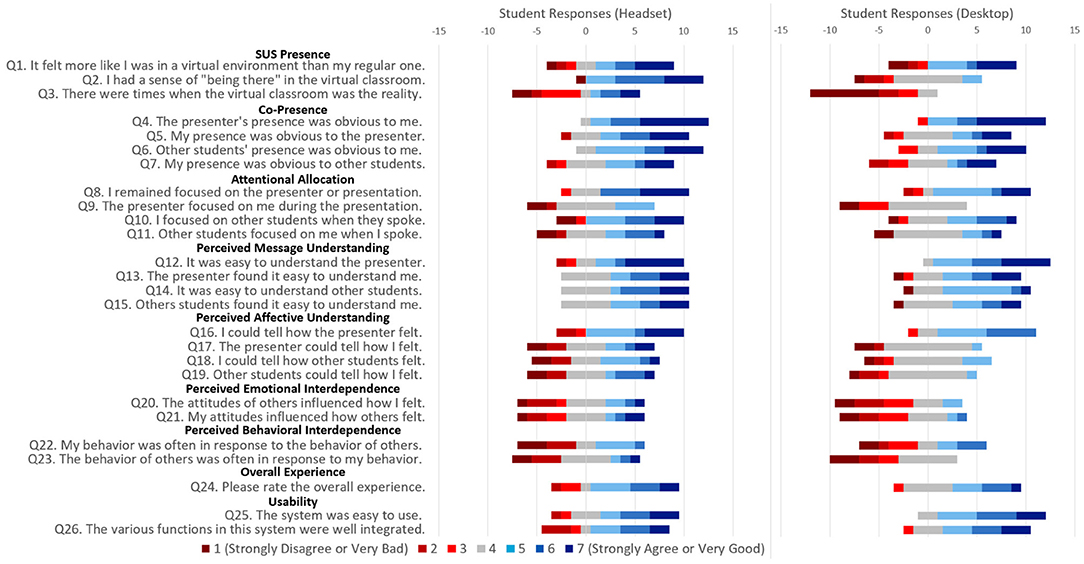
Figure 3. Diverging stacked bar charts, counting responses to standard questionnaire items (headset and desktop VR viewing of lectures). Each bar has a width of 13 (number of subjects) and consists of colored segments showing the response distribution. Segments are arranged to center neutral responses at 0, such that the bar's horizontal range relates to the number of positive (right of 0) and negative (left of 0) responses. Figure based on (Yoshimura and Borst, 2020a,b).
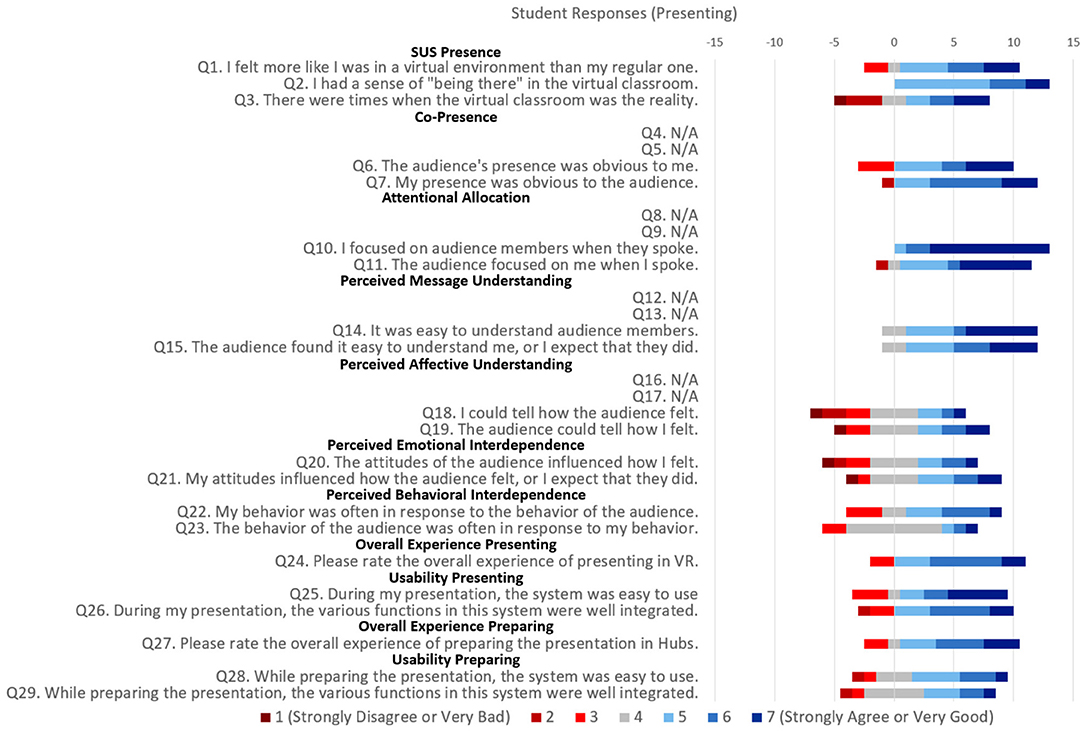
Figure 4. Diverging stacked bar charts, counting responses to standard questionnaire items (presenting).

Table 1. Subscale scores (using averages of contributing questions from Figures 3, 4) with reduced subscales for comparison with four presenting subscales; and statistical comparison of desktop viewing to headset viewing, desktop viewing to headset presenting, and headset viewing to headset presenting with Friedman tests followed by post-hoc Wilcoxon Signed-Ranks Tests.
4.1.1. Overall Experience
We found that the overall experience (Q24) of headset and desktop viewing was positive and similarly rated, with respective means of 4.92 and 4.85. Students also report a positive overall experience while presenting in headset (mean 5.46). There were no neutral results in headset presenting ratings and 1 neutral result in headset viewing. Desktop viewing received 5 neutral ratings, possibly suggesting that students have a more consistent overall experience while in headsets. No statistically detected differences were found in overall experience ratings between the three questionnaires (Table 1).
A later section (section 4.2) suggests a substantial effect of simulator sickness on this result and on some others.
In addition to the above results, we asked students to rate their overall experience for preparing presentations in Hubs, and found positive overall ratings (mean 5.38).
4.1.2. SUS Presence
As expected, students experienced a higher sense of presence in headset viewing and presenting than in desktop viewing, with statistically significant differences shown in Table 1. This can be seen especially in Q2, where desktop viewing received 7 negative ratings and headset viewing and presenting received 1 and 0 negative ratings, respectively.
4.1.3. Co-presence
Desktop viewing and headset viewing and presenting were positively rated for co-presence (Table 1), without any statistically detected difference between the viewing conditions for regular subscales or between the viewing and presenting conditions for the reduced subscales. For lecture viewing, students overall felt a sense of co-presence in each experience.
For headset viewing, both questions about others' presence being obvious to the viewer (Q4 and Q6) did not receive any negative responses, with mostly positive responses (Figure 3).
Negative co-presence responses may indicate that a few students felt isolated. It appears that even when students felt others were present, a few of them did not expect that others saw them as present. Q5 and Q7 had more negative and neutral responses than Q4 and Q6 for both headset and desktop viewing.
Headset presenting ratings reflect that students experienced high levels of co-presence on average (mean 5.5).
4.1.4. Attentional Allocation
Headset and desktop viewing subscale scores were not statistically different. We see from Figure 3 that Q9 received no positive ratings for desktop viewing, so we speculate that presenter focus may be unclear to students in a desktop view.
Notably, we see a statistically significant difference between headset presenting and both reduced desktop and headset viewing subscales (Table 1). This is related to high scores for presenting in Figure 4, where Q10 received no negative responses and mostly very high positive responses, and Q11 received only 1 negative and 1 neutral response. This effect is likely due to presenters needing to be more in tune with audience members while presenting content.
4.1.5. Perceived Message Understanding
Subscale scores for headset and desktop viewing were similar (mean of 5.35 and 5.08, respectively).
Negative responses to Q12, seen only for headset viewing, may reflect audio quality in Hubs. Most of the speaking was by the presenter, and elsewhere we note more student-reported audio glitches with headset viewing (section 4.3.3).
Headset presenting scores were positive on average, receiving no negative perceived message understanding responses. No statistically significant difference was found between reduced viewing subscales and the headset presenting subscale.
4.1.6. Perceived Affective Understanding
Table 1 shows similar mean ratings and the same median rating for desktop and headset viewing for affective understanding. Similar results were seen between reduced subscales for the viewing and presenting conditions. Figure 3 suggests that the response shapes may be different between the desktop and headset methods: Desktop responses tended to be more neutral, while headset (viewing and presenting) responses were more dispersed, including more negative and positive responses. This suggests a more consistent or less notable experience on desktop than in headset, which would not manifest as an overall score difference.
Some affective cues may be missing due to limitations of avatars. More positive ratings in Q16 than for Q17–Q19 could reflect that the teacher's voice was the only one heard often.
4.1.7. Perceived Emotional Interdependence
Ratings of emotional interdependence were moderate overall. Pairwise tests suggested a difference between headset presenting and desktop viewing (Table 1). However, the Friedman test did not detect overall significance for the subscale (p = 0.067), so we consider the result a trend rather than a demonstration of significance.
Overall, students did not report affecting each other's attitudes much. However, in headset viewing and presenting, a few students gave very high ratings, suggesting there were notable exceptions. Desktop viewing seems more consistently negative.
4.1.8. Perceived Behavioral Interdependence
As in Emotional Interdependence, the Behavioral Interdependence responses suggest only a trend between headset presenting and desktop viewing. The Friedman test did not detect overall significance (p = 0.067).
For desktop viewing, no student felt they affected the behavior of others (Q23 has no positive desktop viewing response). We consider other evidence for interdependence in section 4.4.8.
4.1.9. Usability
We see positive usability ratings for desktop viewing and headset viewing and presenting. We also asked students to rate usability with respect to preparing their presentation, and see that student responses were slightly positive (Figure 4). A few low ratings in the headset viewing and presenting conditions are associated with discomfort (section 4.2).
4.2. Viewing/Presenting Questionnaires: Simulator Sickness
Simulator sickness is an important consideration for VR. In extreme cases, it makes VR unusable. Moderate cases may substantially degrade the experience. Unlike lab settings, a home setting for VR does not allow consistent control over devices and conditions, leading to additional concern about sickness.
Questionnaires asked students to rate the extent to which they experienced a subset of symptoms from the SSQ (Kennedy et al., 1993). For each student and condition, we computed a sickness score as the average of their responses to the 4-point sickness questions.
4.2.1. Headset Viewing Sickness
Figure 5B shows the symptom distributions for headset viewing. Nine of 13 students reported at least slight “general discomfort.” Other symptoms that were highly reported were fatigue and eye strain. Two students gave maximum ratings (rating 4): One for fatigue, headache, and difficulty focusing or concentrating; and the other for general discomfort only. Students encountering problems were able to switch to desktop viewing. Three students reported removing headsets for varying amounts of time due to physical discomfort from headset wearing or nausea. Four other students briefly removed headsets, for example, to make an adjustment or check time.

Figure 5. Sickness symptoms for (A) desktop viewing, (B) headset viewing, and (C) headset presenting.
Figure 6B shows that as sickness score increases, the rating of overall experience tended to decrease (Q24). Notably, all users with sickness score below 2 gave positive overall experience ratings, but only one user with a higher score gave a positive overall rating.
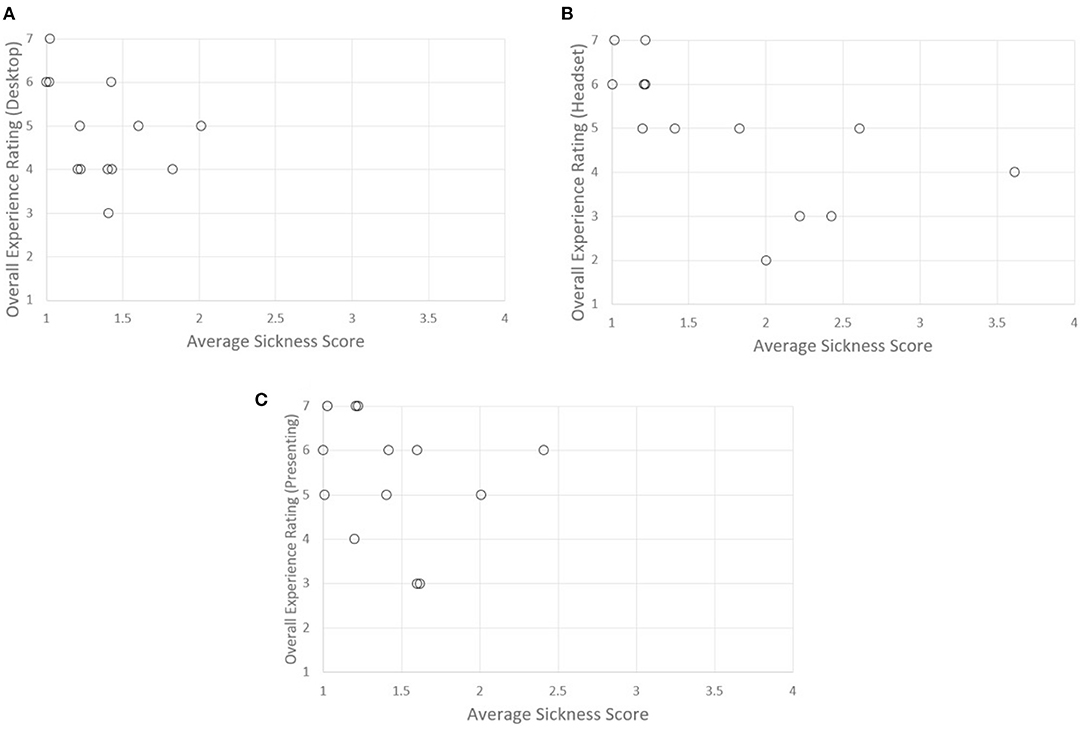
Figure 6. Overall rating (Q24) vs. sickness score for (A) desktop viewing, (B) headset viewing, and (C) headset presenting.
Statistically, very strong negative correlations were found between sickness score and usability (Spearman rs = −0.830, p = 0.000) and between sickness and perceived message understanding (rs = −0.801, p = 0.001). We found strong negative correlations between sickness and overall experience (rs = −0.792, p = 0.001), SUS presence (rs = −0.719, p = 0.006) and co-presence (rs = −0.623, p = 0.023).
Some question groups did not correlate much with sickness, suggesting students were not just answering all questions the same way. For example, we did not find notable correlation between headset viewing sickness and “prospects” ratings (section 4.3.1) about expectations of VR being good for education (rs = 0.055, p = 0.859). This could indicate that students believe their current experience is not indicative of the future of VR, so we additionally checked for correlation between overall experience and the prospects rating, with no detected correlation (rs = 0.233, p = 0.444). Other items that were less correlated with sickness include attentional allocation (rs = −0.472, p = 0.103) and perceived behavioral interdependence (rs = −0.474, p = 0.101).
Two subscales had moderate correlation results, nearly strong, but with slightly lower correlation coefficient or borderline non-significant p: perceived affective understanding (rs = −0.593, p = 0.033), perceived emotional interdependence (rs = −0.520, p = 0.069).
Sickness did not appear tied to any particular device type. The average sickness scores of at least 2 occurred with Oculus Rift CV1 (3 of 4 such devices) and Oculus Quest (2 of 5).
4.2.2. Desktop Viewing Sickness
For desktop viewing (Figures 5A, 6A), the highest sickness score was 2, reported by one student, who reported a combination of moderate headaches and slight fatigue, eye strain, and difficulty focusing or concentrating. Here, sickness was not strongly correlated with overall experience rating (rs = −0.452, p = 0.121). Due to the less notable results for desktop viewing when compared to headset viewing and presenting, we do not to further detail sickness for desktop viewing.
4.2.3. Headset Presenting Sickness
For headset presenting (Figures 5C, 6C), two students experienced a sickness score of 2 or more. The highest sickness score was 2.4 from one student, who reported a combination of moderate general discomfort, headaches, and eye strain and slight fatigue. The other student had a sickness score of 2, experiencing a combination of moderate headaches and eye strain and slight general discomfort. All students kept their headset on for the duration of their own presentation, but four students stated they took the headset off when not presenting. The stated reasons were: heat from the headset, browser problems near the end of class, a battery problem, and fatigue during the later part of class. One other subject reported readjusting the headset, and another reported removing it for 3 min to communicate with someone.
While not initially obvious from Figure 6C, we find that sickness has strong negative correlations with overall experience (rs = −0.790, p = 0.001), usability (rs = −0.770, p = 0.002), SUS presence (rs = −0.613, p = 0.026), and co-presence (rs = −0.608, p = 0.028).
Similar to headset viewing, we see three subscales that do not correlate much with sickness. These include: perceived emotional interdependence (rs = −0.283, p = 0.349), perceived behavioral interdependence (rs = −0.275, p = 0.364), and perceived message understanding (rs = −0.266, p = 0.380).
Subscales with a moderate negative correlation with sickness score include: prospects (rs = −0.527, p = 0.064), attentional allocation (rs = −0.490, p = 0.089), and perceived affective understanding (rs = −0.489, p = 0.090). However, these values are not found statistically significant.
4.2.4. Long-Term Sickness
At the end of the classes (final questionnaire), only three students reported ever experiencing symptoms 1 h or more after the end of a class using headsets. These symptoms were: headache, head pain from headset, eye strain, and slight nausea.
4.2.5. Sickness-Related Results: Headset Viewing and Presenting
Due to strong correlations between sickness and ratings with headset VR (viewing and presenting), further understanding high- and low-sickness cases can be useful for understanding the potential of future VR systems that may be able to address sickness with better devices or visuals, or to understand the experiences of users who are comfortable with VR.
We inspected students with a sickness score of 2 or more (from both desktop and headset results). In total, there were five such cases. The one student with a sickness score of 2 in the desktop viewing questionnaire had a sickness score of 2.4 in each of the headset viewing and presenting questionnaires. The one other student who had a sickness score of 2 in the headset presenting questionnaire had the score of 3.6 in the headset viewing questionnaire. The three remaining students only had high scores in the headset viewing questionnaire.
For headset viewing, all negative ratings given to the following items were from the high-sickness subjects: Q2, Co-Presence (Q4–Q7), Q8, Overall Experience (Q24), and Usability (Q25–Q26). We see a similar pattern for headset presenting, specifically for: Q7, Q11, Q23, Overall Experience Presenting (Q24), Usability Presenting (Q25–26), Overall Experience Preparing (Q27), and Usability Preparing (Q28–Q29). In other words, there were no negative ratings from reasonably comfortable users for these questions (sickness below 2).
Based on these results, we can predict that improved headset-based systems would likely provide added benefits over desktop viewing than seen in our initial analysis. There is substantial research on approaches to mitigate motion sickness, and devices can improve in terms of visual stability and comfort. The virtual classroom is overall a low-motion environment, although some avatar repositioning is suggested by scores in section 4.4.8. So, factors of discomfort other than motion sickness should be considered. Reported sickness in our study was notably much more frequent than in a live-guided VR class by Borst et al. (2018), who had more control over device setup and shorter durations for VR use.
4.3. Viewing/Presenting Questionnaires: Additional Insight
4.3.1. Comparison to In-person and Videoconference Classes (Viewing and Presenting)
Table 2 summarizes student responses when asked to list the main advantage and disadvantage of headset and desktop classes compared to in-person and video-conferencing classes.
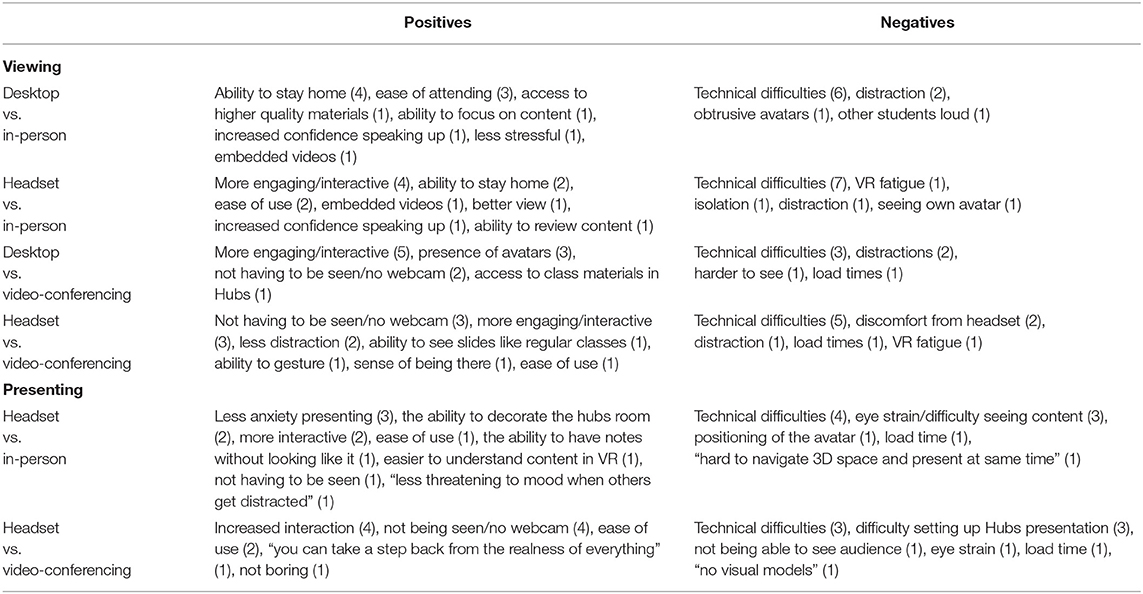
Table 2. Positives and negatives of desktop and headset viewing of classes and headset presenting compared to video-conferencing and in-person classes, with number of related responses in parenthesis.
For positive aspects of both VR viewing approaches compared to in-person classes, students value the ability to stay at home, level of engagement/interactiveness, and some aspects of content viewing. Positive aspects of VR viewing methods compared to videoconferencing were mainly related to level of engagement/interactiveness, not having to be seen or use a webcam, and avatar presence. The negative aspects for both VR viewing approaches when compared to both in-person and video-conferencing classes were mostly technical difficulties. Not many students specifically listed sickness, although it correlated negatively with rating questions.
For headset presenting, notable positive aspects when compared to in-person presentations include less anxiety when presenting, increased interactivity, and the ability to modify and decorate presentation rooms in Hubs. For positives of headset presenting compared to presenting in videoconferencing, we see again that students value increased interaction. We also see that students noted the advantage of not having to be seen on camera. This could possibly tie into the decreased anxiety listed by students comparing to in-person presentations.
Mirroring the viewing conditions, we see that negative aspects for presenting in VR headsets when compared to in-person and video-conferencing presenting were mainly technical difficulties. A few responses comparing to in-person presentations listed eye strain and difficulty seeing content, possibly due to the resolution of the headset displays. Responses comparing to videoconferencing listed the difficulty of setting up Hubs presentations.
We also asked if students expected VR to be a good replacement for in-person and video-conferencing classes within 10 years, using a 7-point rating. Headset viewers responded with means of 5.15 (vs. in-person) and 5.85 (vs. video). Desktop viewers responded with means of rating of 4.54 and 6.46. Asking the same question for headset presenting compared to in-person and video-conferencing presenting resulted with means of 4.69 and 5.54, respectively.
4.3.2. Feature Helpfulness
The viewing and presenting questionnaires asked students to rate the helpfulness of 12 features (Figure 7).
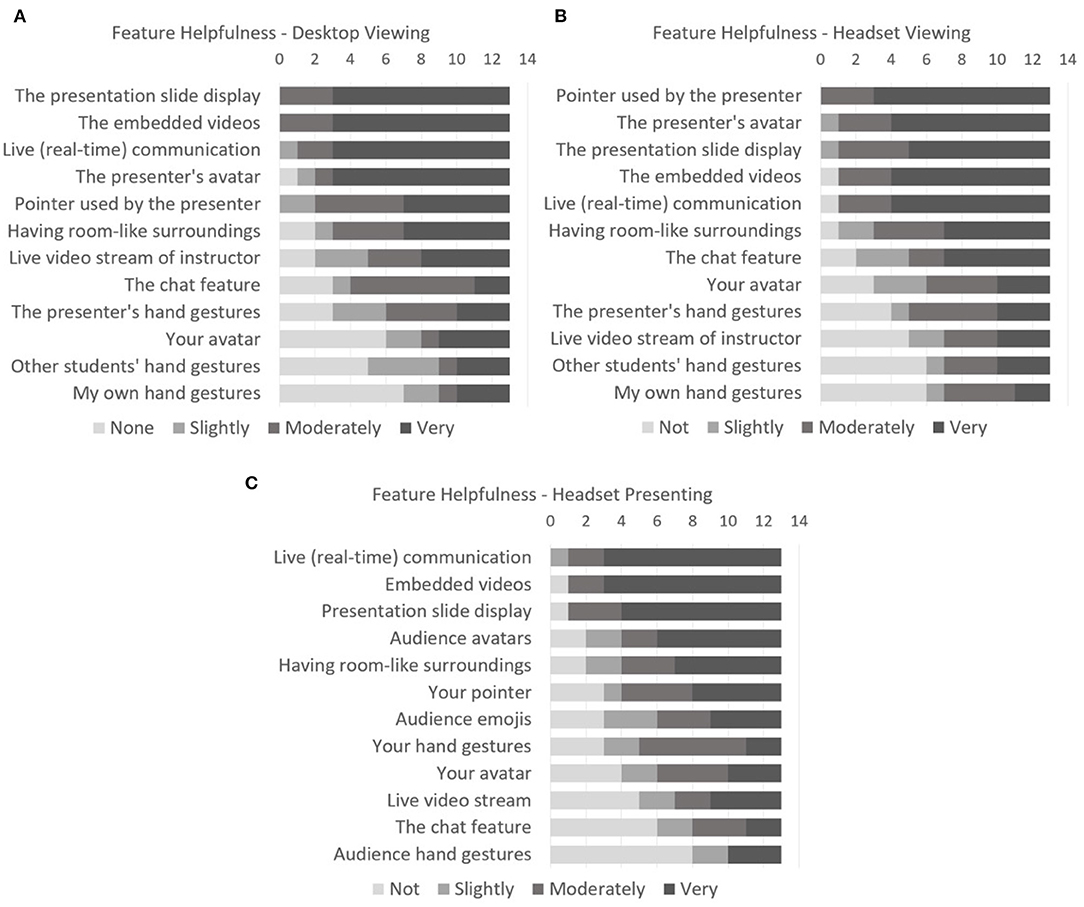
Figure 7. Feature helpfulness for (A) desktop viewing, (B) headset viewing, and (C) headset presenting.
Headset viewing results show that students value presentation features the most. The top five features were the same between desktop and headset viewing, with different ordering by means. The top 3 responses for headset presenting matched with ones from the top five in the viewing conditions. This indicates that students value presentation features for both viewing and presenting.
We see that the main possible differences between headset and desktop viewing ratings were the live video stream of the instructor and the student's avatar. The live video stream was rated intermediately for desktop viewing and low for headset viewing. This could be due to different student-chosen viewing angles or device characteristics in the headset compared to a monitor. Students in the headset mainly focused on the slide content and teacher avatar.
The student's own avatar was rated intermediately for headset viewing and low for desktop viewing. This is likely due to students in desktop not seeing their avatar or hands and consequently not having a strong sense of having a virtual body. Surprisingly, the student's own avatar was rated low for headset presenting.
Despite 10 of 13 students rating their own pointer for headset presenting at least slightly helpful, only two students used the pointer during presentations. Students also rated embedded videos highly for presenting. This is surprising because five groups had difficulties with embedded videos and shared their main screens instead. Additionally, students concerns about embedded videos are seen in section 4.4.5.
4.3.3. Technical Problems/Distractions
The viewing questionnaires had students report the extent to which they experienced certain distractions or problems. Technical problems asked about were: audio glitches, video glitches, problems with a display device, and problems with an input device. Distractions asked about include: noise in the real environment around the student, shifting attention to other activities in the surrounding environment, distractions from other objects or features in the virtual room, distractions from people's avatars, shifting attention to other activities on the computer, and electronic alerts such as: phone, email, messages.
For headset viewing, the technical problems reported most often were audio (11 of 13) and video glitches (8 of 13). Other technical problems such as display/input device problems were minimally reported. The most highly reported distraction was noise in the real environment around the student (7 of 13 students experienced this on some level, with levels ranging from 2 to 4). Other distractions were minimally reported. In addition to distractions listed in our question, students reported: checking the time with external tools like SteamVR, choppy audio, and switching between Hubs rooms.
For headset presenting, the most reported technical problem was audio glitches (11 of 13). Other technical problems were minimally reported (5 or less responses). Distractions were less reported, as the most reported distractions were noise in the real environment (5 of 13) and distractions from audience avatars (4 of 13). Other sources of distraction students listed were: phone vibrations and checking the time with external tools like SteamVR.
Desktop viewing had fewer technical problems compared to headset viewing. The main reported technical problem was audio glitches (9 of 13), with all other technical problems being minimally reported. The most reported distraction was noise in the real environment around the student (7 of 13 students). Other distractions were experienced on some level by less than half of the class.
Interestingly, the highest reported technical problem and distraction was the same between the three conditions.
One notable observation about reported distractions is that more students “shifted attention to other activities on the computer” for desktop viewing (6 of 13) than headset viewing (2 of 13) and presenting (0 of 13). Students viewing in headset experienced more distractions from objects or features in the virtual room than desktop viewers (5 and 2 out of 13, respectively). Only 1 student in headset presenting reported distractions from objects or features in the virtual room. The results between viewing conditions mirror the fact that desktop viewers can easily access other activities on the computer, while headset viewers only have objects in the virtual world readily accessible. We believe that because students presenting in headsets were likely focused on their presentations heavily, they experienced less distractions.
Technical problems with a display/input device and video glitches appear more prominent in headset viewing/presenting. This may be exacerbated by the students' low level of prior experience with headsets.
4.4. Final Questionnaire Results
The final questionnaire gives additional insights. It had students reflect on the entire 7 weeks of remote classes. The questions in the Final Questionnaire were intended for additional insights and were not subject to hypothesis tests for comparing between conditions.
4.4.1. Final Impression
Students were asked for an overall rating of desktop and headset VR as a medium for remote classes. Responses were positive and similar for desktop and headset viewing (mean of 5 and 4.77).
We then asked students how often they experienced a glitch that substantially degraded the experience. Headset scores suggested more glitches than desktop (mean of 3.54 and 2.92).
Knowing glitches and sickness can degrade overall experience, we then asked: if all glitches were fixed, how would they rate headset/desktop VR as a medium for classes overall. Mean ratings appeared higher than for the first experience question, with headset ratings showing possibly more change (headset mean changed from 4.77 to 5.92, desktop from 5 to 5.62).
4.4.2. Technology Ranking
Students were asked to rank 5 technologies for attending remote classes (Figure 8A), including VR and technologies used by other university classes. Headset VR received the most “best” rankings. Desktop and headset VR both stand out for high rankings (10 of 13 being “best” or 2nd choice). Pre-recorded videos had the most varied responses, ranging from 4 “worst” responses to 3 “best” responses. Live video options (one-way or multi-way) had no “best” responses and were not well-ranked overall. Nine of 13 students gave one-way video low rankings (4th or “worst”). We see very similar results for rankings of technologies for presenting in remote classes (Figure 8B). Again, VR in headset and on desktop were rated highest for presenting, on average.
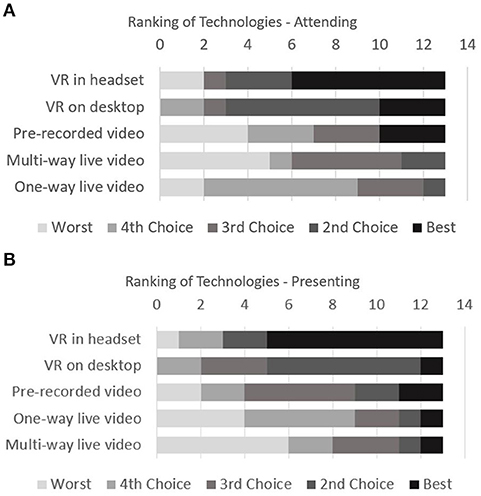
Figure 8. Ranking of technologies for (A) attending and (B) presenting in remote classes.
Additionally, students were asked to give positive or negative aspects of the technologies that they ranked as best and worst, individually. Table 3 lists student responses for the viewing condition and Table 4 lists student responses for the presenting condition. “None listed” in the tables implies that either no responses were given for that condition or no students ranked the condition as best or worst.
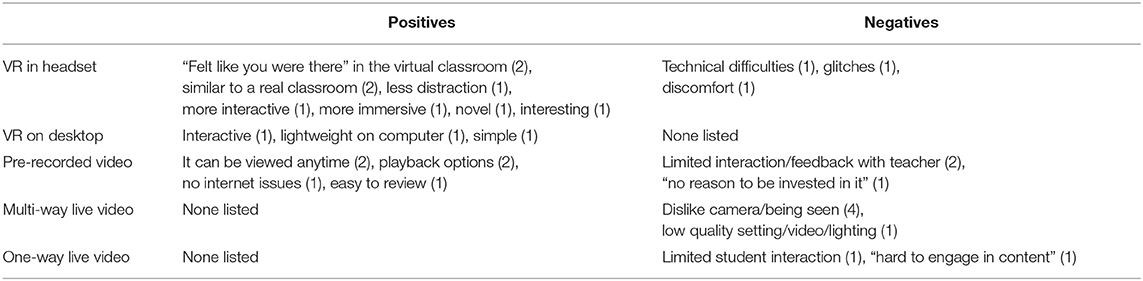
Table 3. Positive/negative aspects of technologies ranked as best and worst for viewing condition.
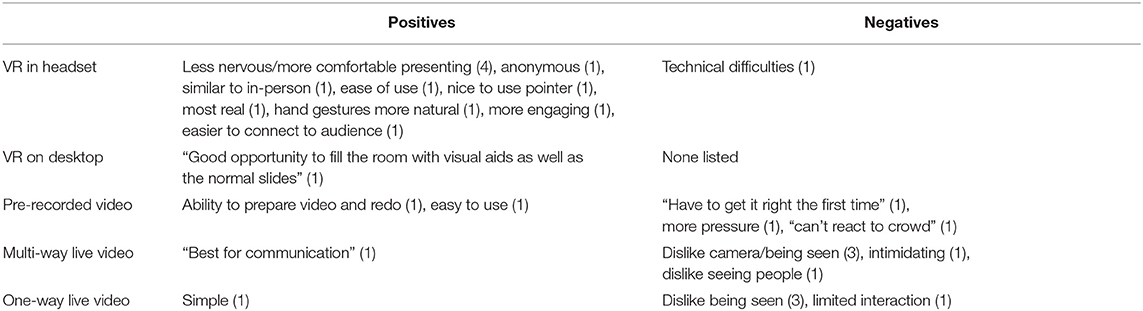
Table 4. Positive/negative aspects of technologies ranked as best and worst for presenting condition.
Notably, positive aspects of headset VR viewing mention benefits related to increased presence.
Again, here we see that students dislike using cameras and being seen. This can be seen in negatives for multi-way live video for viewing and presenting and negatives for one-way live video for presenting. Possibly relating to not having to be seen on camera/having an avatar, four students mentioned they feel less nervous/more comfortable while presenting in VR headsets.
4.4.3. Sense of Belonging to a University
As mentioned in section 4.1.3, sense of belonging to a University during remote instruction might be related to experiences such as co-presence. Students were asked to rate their sense of belonging to a university class for several class styles (Figure 9). VR in headset was rated best of the remote methods (mean 3.23) but not as high as in-person classes. Desktop VR received intermediate ratings (mean 2.62). Real in-person classes received all “very high” ratings, as would be expected.

Figure 9. Students' sense of belonging to a University class. Figure based on (Yoshimura and Borst, 2020a).
The results suggest that headset VR is promising for maintaining a sense of belonging during remote classes. Desktop VR is somewhat less promising. It received 1 more “very high” rating than multi-way video, but its mean rating is lower. We believe that low ratings of pre-recorded video reflect the importance of “live” delivery, and mostly low ratings of one-way video reflect the importance of two-way social presence.
4.4.4. Motivation
As Universities are increasing remote-lecture style teaching, it is ever more important to keep students engaged and motivated. Figure 10 shows student responses when asked to rate how well several class styles help them stay motivated. Notably, VR in headset had the highest average ranking (mean 3.38). This may be due to the novelty factor of headset VR, or due to a combination of the various factors discussed throughout this paper. Real life motivation was rated second on average and rated similarly to VR in headset (mean 3.30). VR on desktop does not appear to promote student motivation as much as we had expected (mean 2), with an average rating lower than multi-way live video, one-way live video, and pre-recorded video.
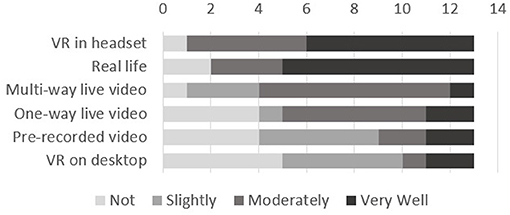
Figure 10. Student responses for how well class styles help them stay motivated.
4.4.5. Desirable Missing Features
We asked students to list additional features they would like that were missing from Hubs.
For headset viewing, suggested features included: a way to signal that you have a question/raise hand feature (2 responses like this), better ways to view media (1 response), a more classroom setting (1 response), better overall system design (1 response), easier mute toggle (1 response), note taking capabilities (1 response), a way to read the chat logs (1 response), better video support (1 response), and clearer instructions for controls (1 response).
Here we see some basic useful features were missing from Hubs like taking notes and persistent chat logs.
For headset presenting, suggested features were: better way to use media (1 response), a designated pointer (2 responses), better way to position objects (1 response), better media importing/embedded videos (4 responses), chat log to see questions (1 response), ability to show/interact with 3D models easily (1 response).
Mainly, we see that students would like better media features, better control of objects in hubs, and a pointer.
For preparing presentations in headset, students suggested: Better media importing/embedded videos (8 responses), better object control/ability to modify room (4 responses), better way to use media (1 response).
Similar to presenting in headsets, students felt better support for video uploading and object placement is needed.
Desktop suggestions included: a way to signal questions/raise hand (3 responses), a better way to feel immersed (1 response), a more classroom setting (1 response), ability to hide others' avatars (1 response), better overall system design (1 response), simple controls (1 response), more communication methods (1 response).
We see from the responses (headset and desktop viewing) that several comments suggest improving communication methods.
4.4.6. Communication Methods
Communication is a key aspect of classes. Besides speech, there are subtle things that contribute to communication, such as hand or head motions.
Students were asked: not considering any technical glitches, how helpful they considered various methods for a student to communicate to others during a VR class (4-point ratings from Not to Very Helpful). Communication methods listed by the question included: voice chat, pointing with hand/pen/ray, text chat, hand motion (e.g., raise hand), triggering an icon or emoji, moving whole avatar nearer, and nodding/bobbing your avatar head.
All communication methods received a high mean rating (mean of 3 or higher). Voice chat was unanimously rated as “Very Helpful” (mean 4). The second and third highest rated methods were pointing with hand/pen/ray and text chat (mean 3.69 and 3.54). Other listed methods had a mean of 3.
These results show that multiple factors contribute to effectively communicating with others. Some of these features are only achievable through attendance methods like headset VR.
4.4.7. Avatar Features
Avatars are important for social presence in VR, and they may aid understanding. Recall that students value the presenter's avatar from results in section 4.3.2.
The final questionnaire asked students how effective various features of the teacher avatar were. The features asked about were: having a visible body, head pulse that indicates speaking, avatar/head aim to face you or other objects, natural (tracked) head motions, hand motion or gestures, and eye movement/blink.
Each of these features received a mean rating of 3 or higher (using 4-point ratings from Not to Very Effective), with the exception of eye movement/blink (mean 1.62). This was a surprising exception, as we expected an automatic Hubs eye movement/blink to make the avatar seem more “alive.” The two highest-rated features on average were having a visible body and a head pulse that indicates speaking (mean of 3.38 for both).
Students were then asked what additional features would improve the teacher avatar's effectiveness. Responses included: more in-depth tracking (1 response), making the teacher more visible (1 response), live video feed (1 response), having a live body model (1 response), a way to see when someone raises their hands (1 response), a laser pointer (1 response), and mouth animations (1 response).
When asked what features would improve student avatars, responses mentioned: a better way to signal questions (2 responses), more in-depth tracking (1 response), removal of fly mode because it is distracting (1 response), better teleportation (1 response), making body invisible to self (1 response), better audio controls (1 response), a laser pointer (1 response), and having pictures of each student as their avatar (1 response).
Overall, a main suggestion based on these responses is an extended teacher avatar (full body tracking, mouth movements). Consistent with section 4.4.5, some students wanted a more reliable way to get the teacher's attention for questions.
4.4.8. Factors of Avatar Movement
We asked students how often they move their avatar when someone enters their personal space and how much they position their avatar to avoid invading someone else's personal space. The mean responses for headset viewing (7 point ratings from Never to Very Often) were 5.46 (to avoid others) and 5.31 (to avoid invading). The mean responses for desktop were 4.62 and 4.77. While not supported by a statistically significant difference (p = 0.066, p = 0.118), these results warrant future investigation to better determine if students are more aware of, or more responsive to, personal space in headset VR.
When asked what other things made students move their avatars, responses for headset VR included: to get a better view of lecture content (7 responses like this), to hear better (6 responses), and accidental movement (2 responses). Desktop responses included: to get a better view of lecture content (10 responses), to hear better (5 responses), and someone blocking vision (1 response).
From this, we see that a main reason for people to move their avatar is for better visuals or audio. Visual factors may include limited resolution of headsets/monitors and other avatars occluding sight. Audio changes were related to Hubs' spatial audio, which lowers audio levels with distance. Students may prefer moving instead of adjusting volume sliders on avatars. VR lectures could be enhanced with software that better optimizes audio levels and that renders occluding avatars in a see-through or minimized manner.
4.4.9. Hubs Content Viewing
Students were asked how often they used 3 Hubs viewing features for lecture slides and videos: loading slides in a browser tab, maximized in-world viewing using a focus feature, and normal in-world viewing.
The most-used approach for lecture slides, on average, was normal in-world viewing (headset mean 5.69, desktop mean 5.69), followed by maximized in-world viewing using the focus feature (headset mean 4.31, desktop mean 4.31) and loading slides in a browser tab (headset mean 3, desktop mean 4.38). As can be expected, loading content in browsers was used more in desktop than in headsets, likely due to headset users not being able to open browser tabs easily.
The most-used approach for videos was normal in-world viewing (headset mean 5.15, desktop mean 4.85), followed by maximized in-world viewing using the focus feature (headset mean 4.31, desktop mean 4.77). Browser tab loading was used the least (headset mean 2.08, desktop mean 3.62). This question was worded incorrectly, which may contribute to low ratings.
4.4.10. Hubs Room Visits and Downloads
Hubs allowed students to revisit rooms and download content after lectures. We asked students to estimate how often they visited Hubs rooms after a lecture. Three students revisited lecture rooms 5 or more times over the 7 weeks. The other 10 students reported a median of three visits.
We also asked students how much lecture content they downloaded (slides and video clips). For slides, the median response was 6 of 6 available slide sets across the 7 weeks, but 5 students downloaded less than 6 slide sets. Most (10 of 13) students did not download any video clips.
4.4.11. Virtual Room Preference
The room that a class is held in may contribute to a student's learning. If a student is uncomfortable with their surroundings, it may detract from the experience.
We asked students what type of virtual room they would like to be in for lectures. Four students responded that they would like to be in a large room. Other responses include: a classroom setting (3 responses), an immersive room (2 responses), an indoors room (1 response), rooms with stairs to allow multiple viewing angles (1 response), and a theater/auditorium room (2 responses).
We see that students like a large virtual room for attending remote classes. Our observation of avatars suggests this could be related to freedom of movement and personal space. It may also reflect more general feelings about large spaces.
4.4.12. Viewing Preference : Desktop or Headset
In the final questionnaire, we asked students how they would prefer to attend a remote VR class (desktop, headset, or some mix) if all glitches were fixed. Results were that 5 of 13 students would like an even mix, 4 students prefer mostly headset, 2 students prefer mostly desktop, with the remaining two students split between headset-only and desktop-only.
Based on this, neglecting glitches, we see that a majority of students prefer to attend either an even mix of headset and desktop viewing or mostly headset viewing.
4.4.13. Reasons For/Against VR-Based Classes
Finally, we asked students to rate how significant they found 13 reasons to use VR for classes and 11 reasons to avoid VR for classes, rating each from 1 to 4. The list of reasons was developed mainly from student comments during viewing questionnaires. We wanted to see the extent of overall agreement with comments about positive or negative aspects of VR and of other approaches.
Figure 11A shows results of asking students to rate various reasons to use VR for classes. All but one (seeing teacher and content arranged like in a classroom) of the listed reasons received mean ratings of 3 or more and a median of 4.
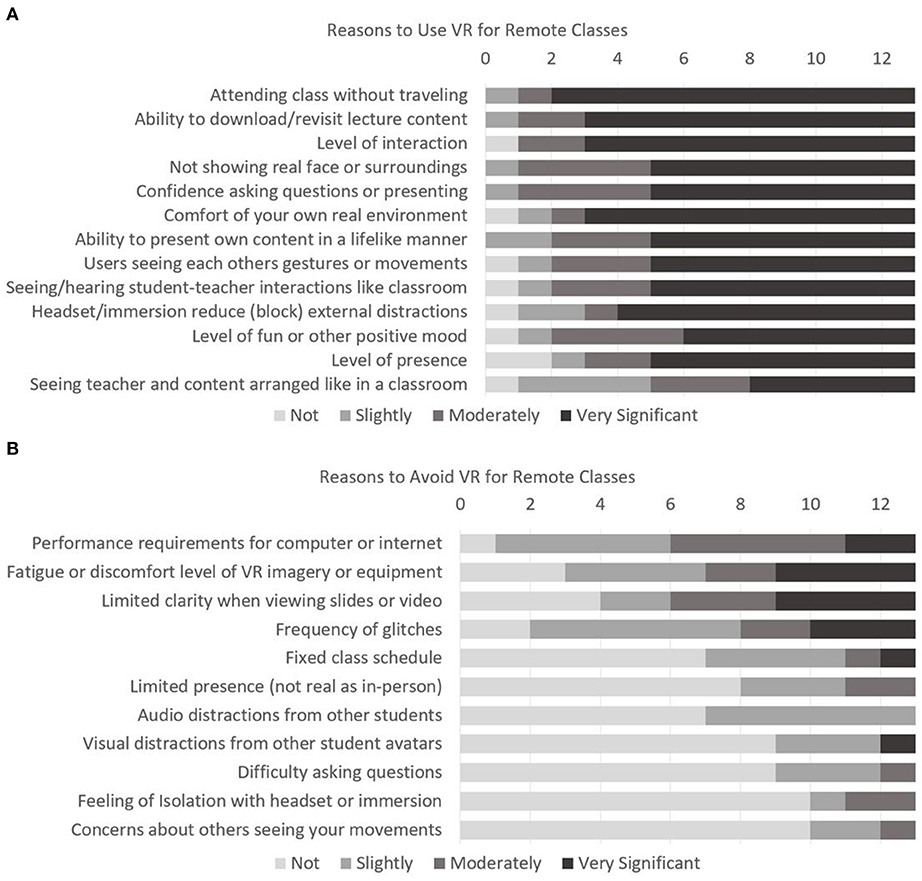
Figure 11. Ratings of reasons to (A) use VR for remote classes and reasons to (B) avoid VR for remote classes.
Figure 11B displays student ratings of reasons to avoid VR for classes. Ratings suggest that the main downsides of using VR for classes were related to technical problems or simulator sickness.
Overall, strong agreement with reasons supporting VR and low agreement with reasons against VR suggest high student expectations for benefits of VR-based classes. To the extent that some reasons against VR were supported, these relate to technological aspects that are expected to improve with future VR technologies (comfort, performance).
4.4.14. Teacher Suggestions
Although the main goal was to understand student experiences, we noted teacher suggestions about how the tools could improve. Hubs was missing some features common to real classrooms, and adding them would help lecturers. These include a clock and a duplicate view of the slides (lecture screen) visible to a teacher who is facing the audience. Hubs did not provide standard or scripting features to add such objects. The Hubs drawing mechanism, being a marker that generates 3D geometry, was found awkward for lecturing, and a good whiteboard-type mechanism would help the teacher with live problem solving or extending lecture content. Students would also benefit from easy note taking while in headsets, such as a keyboard-in-VR injection (Grubert et al., 2018) or a virtual notepad (Chen et al., 2019). Students need a way to get the teacher's attention that is independent of microphone volume or motion. Students were able to type in chat, but the text could appear below the field of view and be missed by the teacher, and text would vanish after some time. Hubs mechanisms for placing and moving uploaded content were less developed than in typical 3D software, and teacher setup effort could be reduced by a simpler way to arrange or switch uploaded content.
5. Discussion and Conclusion
We studied student viewing (headset and desktop VR) and presenting (headset VR only) experiences in a 7-week class. Results overall suggest that social VR platforms provide a promising alternative to other remote class approaches, with the exception of discomfort in some cases.
We found higher presence for headsets overall (viewing and presenting). Headset presenting benefited from increased attentional allocation over headset and desktop viewing. Also for headset presenting, there is a possible trend of higher perceived emotional and behavioral interdependence over desktop viewing.
In several ratings, headset and desktop VR did not differ statistically overall. This is due in part to a wide spread of headset scores, which occured despite a relatively homogeneous subject group. These scores varied in strong correlation with sickness symptoms encountered by several headset users. The sickness symptoms appear primarily related to general discomfort, rather than motion. The VR classroom was a low-motion environment, and considering ratings and reasons for headset removal in section 4.2, sickness ratings may reflect factors of discomfort like heat or facial pressure from the headsets, in combination with substantial duration of use.
Technical difficulties and distraction are common obstacles for remote class technologies (Freeman, 1998; Jennings and Bronack, 2001; Grant and Cheon, 2007; Erickson et al., 2011). Distractions with desktop and headset VR viewing differ due to different accessibility of internal vs. external objects (section 4.3.3). For presenting, students had problems with embedded videos, despite rating them highly (section 4.3.2). Audio and video glitches were reported for our class (Table 2; sections 4.3.3 and 4.4.13). We believe this is partly due to students' low experience with VR devices and the widely-varying home computing environments (considering better results from more controlled setups, e.g., Borst et al., 2018). Pre-training and system tuning may help. Meyer et al. (2019) found that pre-training “had a positive effect on knowledge, transfer, and self efficacy.”
Future studies could extend results with a larger sample size and less variability in devices. Students attended classes directly in home environments, using their own headsets or borrowed headsets. This made it difficult to control conditions. However, conducting experiments in real environments and with multiple headsets is important for ecological validity, and the experiment gives substantial insight into the range of resulting experiences. Despite discomfort-based symptoms and technical difficulties, students still have high expectations for future VR systems for remote classes.
Some students noted that they value having avatars and not being seen on video. This recalls Campbell's study wherein female participants preferred VR avatars to video in meetings, possibly due to social pressures (Campbell et al., 2019). We see that most students agree that confidence and not showing their face was a very significant reason to use VR for remote classes (Figure 11). We also see that students experienced less anxiety presenting in headset when compared to presenting in real-life (sections 4.3.1, 4.4.2).
Students rated the teacher's avatar as very important (section 4.3.2). This may seem contradictory with the responses seen in headset presenting, where students did not rate their own avatar highly. However, it is consistent in that students may not see their own avatar as crucial to their own understanding. Some students would like to see a more detailed teacher avatar with features like full body tracking and mouth movements (section 4.4.7). We also see that some students want to more easily get the teacher's attention (i.e., signal questions). Communication and presentation features are essential overall (sections 4.3.2, 4.4.5, and 4.4.6).
When exploring student opinions about different remote lecture approaches, we found a high sense of belonging to a University for VR in headset and on desktops (section 4.4.3). Along with this, students also rated VR in headset highly (similar to real-life) for staying motivated (section 4.4.4).
Most students reported that they prefer to attend a VR-based remote class using a mix of headset and desktop viewing (section 4.4.12). This provides good motivation to further explore these methods for attending remote classes and to study their tradeoffs with respect to different class topics and activities.
Data Availability Statement
The raw data supporting the conclusions of this article will be made available by the authors, excluding demographic data and subject to university approval.
Ethics Statement
The studies involving human participants were reviewed and approved by the Institutional Review Board, University of Louisiana at Lafayette. Written informed consent was not provided because the study was approved as Exempt following Federal Register $46.104(d). The study surveyed participants of an ongoing VR class activity. Participants borrowing VR devices signed forms accepting risks of use. Participants were informed that they may decline to answer questions, that identities would not be reported, and that they may remove headsets in case of problems.
Author Contributions
All authors listed have made a substantial, direct and intellectual contribution to the work, and approved it for publication.
Funding
This material was based on work supported by the National Science Foundation under Grant No. 1815976 and by the Louisiana Board of Regents Support Fund contract LEQSF (2019-20)-ENH-DE-22.
Conflict of Interest
The authors declare that the research was conducted in the absence of any commercial or financial relationships that could be construed as a potential conflict of interest.
Supplementary Material
The Supplementary Material for this article can be found online at: https://www.frontiersin.org/articles/10.3389/frvir.2021.648619/full#supplementary-material
Footnotes
References
Abulrub, A.-H. G., Attridge, A. N., and Williams, M. A. (2011). “Virtual reality in engineering education: the future of creative learning,” in 2011 IEEE Global Engineering Education Conference (EDUCON) Amman. doi: 10.1109/EDUCON.2011.5773223
Ahn, S. J., Levy, L., Eden, A. L., Won, A. S., MacIntyre, B., and Johnsen, K. J. (2021). IEEEVR2020: exploring the first steps toward standalone virtual conferences. Front. Vir. Real. doi: 10.3389/frvir.2021.648575
Borst, C. W., Lipari, N. G., and Woodworth, J. W. (2018). “Teacher-guided educational VR: assessment of live and prerecorded teachers guiding virtual field trips,” in 25th IEEE Conference on Virtual Reality and 3D User Interfaces, VR 2018 - Proceedings (Tüebingen; Reutlingen), 467–474. doi: 10.1109/VR.2018.8448286
Brooke, J. (1996). “SUS-A Quick and Dirty Usability Scale.” Usability Evaluation in Industry. London: CRC Press.
Campbell, A. G., Holz, T., Cosgrove, J., Harlick, M., and O'Sullivan, T. (2019). Uses of Virtual Reality for Communication in Financial Services: A Case Study on Comparing Different Telepresence Interfaces: Virtual Reality Compared to Video Conferencing. Lecture Notes in Networks and Systems Advances in Information and Communication, (Cham: Springer) 463–481. doi: 10.1007/978-3-030-12388-8_33
Chen, Y. T., Hsu, C. H., Chung, C. H., Wang, Y. S., and Babu, S. V. (2019). “IVRNote: design, creation and evaluation of an interactive note-taking interface for study and reflection in VR learning environments,” in 26th IEEE Conference on Virtual Reality and 3D User Interfaces, VR 2019 - Proceedings (Osaka), 172–180. doi: 10.1109/VR.2019.8798338
Erickson, T., Sadat Shami, N., Kellogg, W. A., and Levine, D. W. (2011). “Synchronous interaction among hundreds: An evaluation of a conference in an avatar-based virtual environment,” in Conference on Human Factors in Computing Systems - Proceedings (Vancouver, BC), 503–512. doi: 10.1145/1978942.1979013
Freeman, M. (1998). Video conferencing: a solution to the multi-campus large classes problem? Br. J. Educ. Technol. 29, 197–210. doi: 10.1111/1467-8535.00064
Grant, M. M., and Cheon, J. (2007). The value of using synchronous conferencing for instruction and students. J. Interact. Online Learn. 6, 211–226.
Gregory, S., Gregory, B., Reiners, T., Fardinpour, A., Hillier, M., Lee, M., et al. (2013). “Virtual worlds in Australian and new Zealand higher education: remembering the past, understanding the present and imagining the future,” in Electric Dreams, eds H. Carte, M. Gosper, and J. Hedberg (Sydney, NSW: Macquarie University), 312–324.
Grubert, J., Witzani, L., Ofek, E., Pahud, M., Kranz, M., and Kristensson, P. O. (2018). “Text entry in immersive head-mounted display-based virtual reality using standard keyboards,” in 25th IEEE Conference on Virtual Reality and 3D User Interfaces, VR 2018 - Proceedings (Tuebingen; Reutlingen), 159–166. doi: 10.1109/VR.2018.8446059
Harms, C., and Biocca, F. (2004). “Internal consistency and reliability of the networked minds measure of social presence,” in Seventh Annual International Workshop: Presence 2004 (Valencia), 246–251.
Jennings, M., and Bronack, S. C. (2001). The use of desktop video conferencing as a medium for collaboration between beginning instructional designers and intern teachers. Int. J. Educ. Telecommun. 7, 91–107.
Kennedy, R. S., Lane, N. E., Berbaum, K. S., and Lilienthal, M. G. (1993). Simulator sickness questionnaire: an enhanced method for quantifying simulator sickness. Int. J. Aviat. Psychol. 3, 203–220. doi: 10.1037/t04669-000
Le, D. A., Maclntyre, B., and Outlaw, J. (2020). “Enhancing the experience of virtual conferences in social virtual environments,” in 2020 IEEE Conference on Virtual Reality and 3D User Interfaces Abstracts and Workshops (VRW) Atlanta, GA. doi: 10.1109/VRW50115.2020.00101
Lindeman, R. W., Reiners, D., and Steed, A. (2009). Practicing what we preach: IEEE VR 2009 virtual program committee meeting. IEEE CGI&A 29, 80–83. doi: 10.1109/MCG.2009.28
Makransky, G., Terkildsen, T. S., and Mayer, R. E. (2019). Adding immersive virtual reality to a science lab simulation causes more presence but less learning. Learn. Instruct. 60, 225–236. doi: 10.1016/j.learninstruc.2017.12.007
Meyer, O. A., Omdahl, M. K., and Makransky, G. (2019). Investigating the effect of pre-training when learning through immersive virtual reality and video: a media and methods experiment. Comput. Educ. 140:103603. doi: 10.1016/j.compedu.2019.103603
Murcia-López, M., and Steed, A. (2016). The effect of environmental features, self-avatar, and immersion on object location memory in virtual environments. Front. ICT 3:24. doi: 10.3389/fict.2016.00024
Oberdörfer, S., Heidrich, D., and Latoschik, M. E. (2019). “Usability of gamified knowledge learning in VR and desktop-3D,” in Proceedings of the 2019 CHI Conference on Human Factors in Computing Systems (New York, NY: Association for Computing Machinery), 1-13.
Parmar, D., Bertrand, J., Babu, S. V., Madathil, K., Zelaya, M., Wang, T., et al. (2016). A comparative evaluation of viewing metaphors on psychophysical skills education in an interactive virtual environment. Virt. Real. 20, 141–157. doi: 10.1007/s10055-016-0287-7
Parong, J., and Mayer, R. E. (2018). Learning science in immersive virtual reality. J. Educ. Psychol. 110, 785–797. doi: 10.1037/edu0000241
Psotka, J. (2013). Educational games and virtual reality as disruptive technologies. Educ. Technol. Soc. 16, 69–80.
Radianti, J., Majchrzak, T. A., Fromm, J., and Wohlgenannt, I. (2019). A systematic review of immersive virtual reality applications for higher education: design elements, lessons learned, and research agenda. Comput. Educ. 147, 1–29. doi: 10.1016/j.compedu.2019.103778
Roettl, J., and Terlutter, R. (2018). The same video game in 2D, 3D or virtual reality-how does technology impact game evaluation and brand placements? PLoS ONE 13:e200724. doi: 10.1371/journal.pone.0200724
Ryu, J., and Kim, G. (2021). Interchanging the mode of display between desktop and immersive headset for effective and usable on-line learning. Intel. Hum. Comp. Interact. Lect. Notes Comput. Sci. 218-222. doi: 10.1007/978-3-030-68449-5_22
Schultz, A. R. (2019). An Updated Comparison Chart of Sixteen Social VR Platforms. Available online at: https://ryanschultz.com/2019/11/12/an-updated-comparison-chart-of-sixteen-social-vr-platforms-first-draft-november-2019/
Slater, M., Sadagic, A., Usoh, M., and Schroeder, R. (2000). Small-group behavior in a virtual and real environment: a comparative study. Presence 9, 37–51. doi: 10.1162/105474600566600
Slater, M., Usoh, M., and Steed, A. (1994). Depth of presence in virtual environments. Presence 3, 130–144. doi: 10.1162/pres.1994.3.2.130
Sousa Santos, B., Dias, P., Pimentel, A., Baggerman, J. W., Ferreira, C., Silva, S., et al. (2009). Head-mounted display versus desktop for 3D navigation in virtual reality: a user study. Multimed. Tools Appl. 41, 161–181. doi: 10.1007/s11042-008-0223-2
Srivastava, P., Rimzhim, A., Vijay, P., Singh, S., and Chandra, S. (2019). Desktop VR is better than non-ambulatory HMD VR for spatial learning. Front. Robot. AI 6:50. doi: 10.3389/frobt.2019.00050
Steinicke, F., Meinecke, A., and Lehmann-Willenbrock, N. (2020). “A first pilot study to compare virtual group meetings using video conferences and (immersive) virtual reality,” in ACM Symposium on Spatial User Interaction (SUI) 2020 New York, NY. doi: 10.1145/3385959.3422699
Usoh, M., Catena, E., Arman, S., and Slater, M. (2000). Using presence questionnaires in reality. Presence 9, 497–503. doi: 10.1162/105474600566989
Witmer, B. G., and Singer, M. J. (1998). Measuring presence in virtual environments: a presence questionnaire. Presence 7, 225–240. doi: 10.1162/105474698565686
Yoshimura, A., and Borst, C. W. (2020a). “Evaluation and comparison of desktop viewing and headset viewing of remote lectures in VR with mozilla hubs,” in ICAT-EGVE 2020 - International Conference on Artificial Reality and Telexistence and Eurographics Symposium on Virtual Environments Orlando, FL.
Yoshimura, A., and Borst, C. W. (2020b). “Evaluation of headset-based viewing and desktop-based viewing of remote lectures in a social VR platform,” in 26th ACM Symposium on Virtual Reality Software and Technology, VRST '20 (New York, NY: Association for Computing Machinery). doi: 10.1145/3385956.3422124
Keywords: virtual reality, educational VR, teleconferencing, distance learning, remote instruction, Mozilla Hubs, COVID-19, SARS-CoV-2
Citation: Yoshimura A and Borst CW (2021) A Study of Class Meetings in VR: Student Experiences of Attending Lectures and of Giving a Project Presentation. Front. Virtual Real. 2:648619. doi: 10.3389/frvir.2021.648619
Received: 01 January 2021; Accepted: 17 March 2021;
Published: 31 May 2021.
Edited by:
Stefania Serafin, Aalborg University Copenhagen, DenmarkReviewed by:
Fabien Danieau, InterDigital, FranceKatja Zibrek, Inria Rennes—Bretagne Atlantique Research Centre, France
Copyright © 2021 Yoshimura and Borst. This is an open-access article distributed under the terms of the Creative Commons Attribution License (CC BY). The use, distribution or reproduction in other forums is permitted, provided the original author(s) and the copyright owner(s) are credited and that the original publication in this journal is cited, in accordance with accepted academic practice. No use, distribution or reproduction is permitted which does not comply with these terms.
*Correspondence: Andrew Yoshimura, YW5kcmV3eW9zaEB5YWhvby5jb20=
†These authors have contributed equally to this work and share first authorship