 Isayas Adhanom
 Savannah Halow
 Eelke Folmer
 Paul MacNeilage
- 1Department of Computer Science and Engineering, University of Nevada, Reno, NV, United States
- 2Department of Psychology, University of Nevada, Reno, NV, United States
VR sickness is a major concern for many users as VR continues its expansion towards widespread everyday use. VR sickness is thought to arise, at least in part, due to the user’s intolerance of conflict between the visually simulated self-motion and actual physical movement. Many mitigation strategies involve consistently modifying the visual stimulus to reduce its impact on the user, but this individualized approach can have drawbacks in terms of complexity of implementation and non-uniformity of user experience. This study presents a novel alternative approach that involves training the user to better tolerate the adverse stimulus by tapping into natural adaptive perceptual mechanisms. In this study, we recruited users with limited VR experience that reported susceptibility to VR sickness. Baseline sickness was measured as participants navigated a rich and naturalistic visual environment. Then, on successive days, participants were exposed to optic flow in a more abstract visual environment, and strength of the optic flow was successively increased by increasing the visual contrast of the scene, because strength of optic flow and the resulting vection are thought to be major causes of VR sickness. Sickness measures decreased on successive days, indicating that adaptation was successful. On the final day, participants were again exposed to the rich and naturalistic visual environment, and the adaptation was maintained, demonstrating that it is possible for adaptation to transfer from more abstract to richer and more naturalistic environments. These results demonstrate that gradual adaptation to increasing optic flow strength in well-controlled, abstract environments allows users to gradually reduce their susceptibility to sickness, thereby increasing VR accessibility for those prone to sickness.
1 Introduction
Virtual reality (VR) is currently seen as the next digital Frontier. In recent years, various commercial VR head-mounted displays (HMD) have become available at a low cost and VR is already widely used for training, rehabilitation, education, work, and entertainment. Unfortunately, VR sickness is still considered a major barrier to mass consumer adoption (Nelson, 2015). VR sickness is a type of motion sickness unique to VR and can include symptoms such as nausea, pallor, sweating, stomach awareness, increased heart rate, drowsiness, disorientation, and general discomfort (Kennedy et al., 1993). Not all individuals who are exposed to VR will experience VR sickness, however, those who do may find it debilitating (Regan, 1995; Stanney et al., 2003).
Several VR sickness mitigation strategies have already been developed, including the use of dynamic or foveated field-of-view (FOV) restriction (Fernandes and Feiner, 2016; Adhanom et al., 2020; Yamamura et al., 2020) and vection blurring (Budhiraja et al., 2017). In practice though, the bulk of locomotor VR experiences that are currently available rely primarily on the use of teleportation (Al Zayer et al., 2020; Monteiro et al., 2021) which has been shown in a recent meta review (Prithul et al., 2021) to result in significantly lower VR sickness incidence but at the cost of lower presence and potential spatial disorientation. The reason for the success of teleportation may be in part due to the lack of optic flow generated during use (Prithul et al., 2021). Optic flow can contribute to both vection (Palmisano et al., 2011; Seno et al., 2018) and sensory conflict (Bubka et al., 2007; Palmisano et al., 2011), which cause sickness in certain contexts (Bubka et al., 2007).
A current challenge with VR sickness is that available mitigation strategies aren’t 100% effective since the effectiveness of any particular mitigation strategy varies across individuals (Reason, 1978). This makes it difficult to create a one-size-fits-all strategy for mitigation. A better strategy may be to supplement existing mitigation techniques by investigating how the user might best prepare themselves for continued VR use.
Research which focuses on using adaptation to the virtual environment has shown promising results for VR sickness mitigation (Reason and Brand, 1975; Cobb et al., 1999; Hill and Howarth, 2000; Bailenson and Yee, 2006; Domeyer et al., 2013; Beadle et al., 2021). The general assumption is that this repeated exposure facilitates adaptation to sensory conflict in the virtual environment, reducing sickness. However, much of this success is dependent on the researchers exposing users to the same virtual environment. Development of a training paradigm which facilitates the transfer of adaptation effects between multiple environments has prove more difficult to achieve (Mouloua et al., 2005; Smither et al., 2008; Duzmanska et al., 2018). These issues may be in part a result of the dissimilarities between the environments (Reason and Brand, 1975; Reason, 1978); adaptation to sensory conflict is thought to be largely dependent on the user becoming accustomed to the conflict which arises in a particular environment through developing the appropriate expectations for sensory input in that environment (Reason and Brand, 1975; Reason, 1978; Keshavarz, 2016). Therefore, facilitating more general adaptation may require training through exposure to factors that are consistent between all VR environments, for example, optic flow stimuli.
Therefore, we aimed to develop a training technique that facilitates the transfer of adaptation effects across environments. Our study borrows concepts from motion sickness mitigation work by emphasizing gradual exposure to sickness-inducing stimuli (Rine et al., 1999; Takeda et al., 2001) such as expanding optic flow (Ebenholtz, 1992; Bubka et al., 2007) and graphic realism (Golding et al., 2012; Davis et al., 2015) to facilitate adaptation. To this end, we use a simplified training environment consisting only of the walls and floor of a labyrinth that users navigate. Over successive days, we gradually adapt users to increasing optic flow by incrementally increasing luminance contrast of the visual stimulus. We show that the adaptation that is achieved using this simplified environment with gradual increases in optic flow strength successfully transfers to a richer, more naturalistic environment. Results of this study suggest that it should be possible to develop standardized training paradigms to reduce and possibly even eliminate VR sickness in susceptible individuals.
2 Related Work
There are three main theories aimed at explaining VR sickness: postural instability theory, eye movement theory, and sensory conflict theory (Reason and Brand, 1975; Riccio and Stoffregen, 1991; Ebenholtz, 1992). Postural instability theory (Riccio and Stoffregen, 1991) attributes VR sickness to a disruption of postural stability caused by unnatural or unexpected motion in the virtual environment. Eye movement theory (Ebenholtz, 1992) postulates that optic flow drives rapid reflexive eye movement to stabilize the image (optokinetic nystagmus) and that the associated sensory and motor signals innervate the vagal nerve, leading to VR sickness. Sensory conflict theory (Reason and Brand, 1975) seems to be the most widely accepted (Kolasinski, 1995; Keshavarz et al., 2014) and attributes VR sickness to the conflicting signals between the visual, vestibular, and somatosensory senses causing discomfort and nausea among other symptoms. These theories are not mutually exclusive, and this list does not encompass all efforts to explain VR sickness (Keshavarz et al., 2015).
One element these theories have in common is that they all seek to explain how sickness may be caused by exposure to full-field visual motion, or optic flow. Optic flow is thought to cause VR sickness (Davis et al., 2015; Tian et al., 2022) particularly when the visually-simulated self-motion does not match natural self-motion of the user, i.e. when there is sensory conflict (Bubka et al., 2007). Many mitigation strategies, including FOV restriction, aim to reduce optic flow during movement (Fernandes and Feiner, 2016; Adhanom et al., 2020; Shi et al., 2021). Other strategies instead try to reduce conflict by providing some form of vestibular or efferent feedback (Peng et al., 2020), for example, by walking-in-place (Tregillus and Folmer, 2016). It is important to note that optic flow is not the same as vection; optic flow refers to the visual motion stimulus itself while vection refers to the visually-induced perception of self-motion (Fujii and Seno, 2020). Optic flow can cause vection (Palmisano et al., 2015; Seno et al., 2018), so their separate effects can be easily confounded during discussions of VR sickness (Chang et al., 2020). Like optic flow, vection has been linked to feelings of VR sickness (Keshavarz et al., 2015; Palmisano et al., 2017), however the relationship is still not perfectly understood (Keshavarz et al., 2015; Palmisano et al., 2017) nor should it be oversimplified. As vection may be experienced without inducing VR sickness, vection alone is not sufficient to induce sickness (Keshavarz et al., 2015). Instead, it must be paired with other factors such as sensory conflict, postural instability, etc. This makes it difficult to disentangle the distinct effects of the optic flow versus vection when investigating sickness.
Other work related to the current study has investigated adaptation to VR sickness. Prior studies have argued that repeated exposure to an aversive stimulus allows developing an altered expectation of sensory input (Reason and Brand, 1975; Keshavarz, 2016), with the required length of exposure increasing as the stimuli become more complex (Reason, 1978). It has been suggested that this makes it unlikely for adaptation effects in one virtual environment to transfer to another. The degree of transfer may depend on the degree of dissimilarity between two environments (Reason and Brand, 1975; Reason, 1978). Previous research in similar environments has been rather consistent in demonstrating effective adaptation, with reports of symptoms decreasing over the course of exposure (Hill and Howarth, 2000; Bailenson and Yee, 2006; Howarth and Hodder, 2008; Domeyer et al., 2013; Beadle et al., 2021), even on timescales as low as 45 min (Sinitski et al., 2018). In one study by Lampton et al. (2000), the researchers saw VR sickness decrease following repeated exposure to a training environment, however, these effects disappeared when the participants entered the mission environment (Lampton et al., 2000). Another study by Hill and Howarth (2000) had participants view a game being played through an HMD on five consecutive days. Results also demonstrated significantly less nausea on the fifth day, compared to the first. More recently, a study by Beadle et al. (2021) had participants perform a shooting task in an HMD over 3 sessions. SSQ scores significantly decreased following each session. This is not an exhaustive list of VR adaptation studies (for review, we recommend Duzmanska et al. (2018)), but they do demonstrate a common theme; adaptation to a single VR environment is possible for mitigating VR sickness. In this experiment, we hope to expand upon this research by examining whether adaptation can transfer between VR environments.
Other relevant prior work has examined how various methods of training against sickness may offer a potential solution to VR sickness more generally, rather than to a single environment (Mouloua et al., 2005; Smither et al., 2008). One such study by Smither et al. (2008) showed that when participants were pre-exposed to simulated rotary stimulation they experienced less symptoms of VR sickness than individuals who had no prior exposure (Smither et al., 2008). Similarly, an experiment by Mouloua et al. (2005) demonstrated cross-platform training was possible, but that it was only successful when using optokinetic nystagmus (OKN) training, and not a VR HMD (Mouloua et al., 2005). Another study by Pöhlmann and colleagues (2021) found that individuals that spend extensive amounts of time playing action video games (not on HMDs) experienced less VR sickness when exposed to a simple virtual environment compared to individuals that do not play any video games (Pöhlmann et al., 2021). All of these experiments were examining transfer in a way that used a non-VR device as their training mechanism. It is possible that these experiments were training against motion sickness more broadly, rather than adaptation to VR specifically. While this may be another effective methodology for sickness mitigation, it stands to reason that this would not be readily available for the average user. Here, we seek to facilitate adaptation solely through the use of a VR HMD.
Specifically, we explicitly aim to facilitate adaptation between distinct VR environments. This means that experiencing one environment will lead to a reduction in VR sickness in a dissimilar environment. Additionally, we hypothesize that this adaptation can occur without exposing participants to the full optic flow and luminance contrast normally experienced in the VR environment. In other words, training can be tailored to act as a “ramp up” period for the participants. Studies which center on training against motion sickness have suggested that adaptation should be facilitated through a gradual increase of the provocative stimulus (Rine et al., 1999; Takeda et al., 2001). Similarly, if we want to train participants against VR sickness, best practice may be to increase intensity over time such that adaptation has time to take place while avoiding extreme illness.
3 Materials and Methods
Our study aims to answer two research questions:
• RQ 1. Does ramped exposure to increased optic flow strength in an abstract environment allow gradual adaptation?
• RQ 2. Does the adaptation transfer from abstract to more complex environments?
3.1 Equipment
We used an HTC Vive Pro Eye HMD to present stimuli, and track position and orientation. It has a diagonal FOV of 110°, a refresh rate of 90Hz, and a combined resolution of 2880 × 1600 pixels. It allows the user to adjust the interpupillary distance (IPD) and focal distance of the HMD to their comfort. The HMD was powered by an AMD Ryzen 7 1700x Eight-Core processor with NVIDIA GeForce GTX 1080ti graphics card and 16 GB of memory.
An Empatica E4 wristband was used to read Electrodermal Activity (EDA) from participants. We use the Empatica’s lead wire extension to collect data using Ag/AgCl electrodes attached to the palmar surface. Participants navigated the environment and provided discomfort score input using an XBox 360 controller. This controller is preferred over the Vive touchpad given its familiarity to new users. The tracking space was set to 2.2 by 2.4 m.
Our system included stimulus presentation and data acquisition components. Stimulus presentation was accomplished through a custom application developed in Unity3D engine version 2019.4.28, using SteamVR version 1.7 plugin. For data acquisition, we used lab streaming layer (LSL) along with LSL LabRecorder version v1.14.2. LSL allows unified and time-synchronized collection of various data streams in an experiment.
The Empatica E4 streaming server was used along with a custom built application that used PyLSL version 1.15.0 to stream the EDA data from the wristband to LSL LabRecorder. EDA data was collected at a sampling rate of 4 Hz.
3.2 Virtual Environment
To address our two research questions, we developed two separate virtual environments: an adaptation training environment and a test environment. The training environment was an abstract environment developed to help us answer RQ1, and the test environment was a natural and complex virtual environment developed to help us answer RQ2.
The training environment was a custom-built labyrinth. The labyrinth consists of a series of repeating hallways with alternating black and white stripes on the walls, and arrows on the floor to help guide participants to the waypoints. This environment was built to have fewer features than the city environment. Unlike the test environment, the training environment did not change in elevation, all paths were straight, sharp turns, and not winding, and the appearance stayed relatively constant throughout. Our hope with this environment was to reduce feature richness, as previous research has suggested that virtual environments with greater graphic realism (Golding et al., 2012; Davis et al., 2015) and scene complexity (Kingdon et al., 2001; Stanney et al., 2003) can lead to higher levels of sickness than simple or abstract scenes. Thus, we created an abstract environment that allowed us to maintain and control optic flow strength through manipulation of luminance contrast. Luminance contrast is the ratio between the maximum and minimum luminance values in the environment, and it is calculated using the following formula (Sauvan and Bonnet, 1993; Patterson and York, 2009; Guo et al., 2021):
With Imax and Imin representing the highest and lowest luminance. In our training environment, luminance contrast was set to a value of 0.50 during the first day, 0.75 the second, and 1.0 (full contrast) on the final day. Increasing luminance contrast leads to increased optic flow strength and vection (Guo et al., 2021), and thus serves as a method to gradually increase stimulus intensity over successive training days.
The test environment was adapted from the Windridge City (UnityTechnologies, 2021) environment. This environment was chosen due to its rich features; it consists of a city surrounded by lush forests, flower fields, and winding dirt roads. This test environment replicates what users may experience in normal VR use, particularly for entertainment. The environment has compelling imagery, changes in elevation, and provides plenty of interesting features for participants to examine as they navigate it. For these reasons, the test environment also works as a direct comparison for real-world applications. Both environments contained a set of waypoints as their main means of navigating the environments for 20 min.
In summary, the training and testing environments were very dissimilar. This ensures that any reduction in sickness on the final test day is not simply due to repeated exposure to the same environment. Instead, we examine whether adaptation acquired in the training environment is maintained and transfers to the test environment on the final day. Figure 1 shows the baseline and final testing environment used on days 1 and 5 on the left and right, and the training environment with increasing contrast luminance levels used on days 2 through 4 in the center.
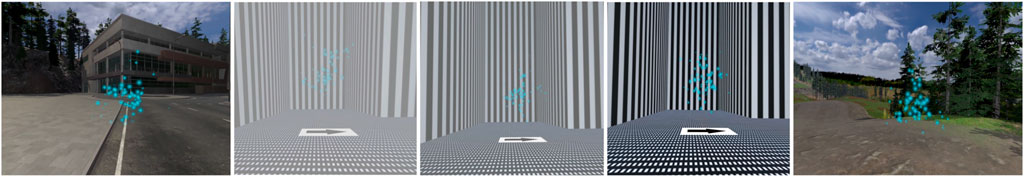
FIGURE 1. Participants were exposed to two virtual environments over the course of 5 days. On days 1 and 5, participants navigated a naturalistic environment, which served as the baseline and test for adaptation. On days 2 through 4, participants navigated an optokinetic labyrinth with an increase in the luminance contrast on each day. Participants used blue particle cloud waypoints and arrow textures to help guide their navigation.
3.3 Measurements
Measuring VR sickness has proven challenging and best practices are still being debated. Most commonly, researchers have relied on the Simulator Sickness Questionnaire (Kennedy et al., 1993) but updated versions such as the VR Sickness Questionnaire (Kim et al., 2018) have recently gained some traction. The SSQ measures multiple symptoms using a long questionnaire and is usually collected post exposure. More recently, researchers have developed more simple alternative questionnaires that can be collected during the experiment. The Discomfort Score (Fernandes and Feiner, 2016; Adhanom et al., 2020) is a widely used method which asks subjects to rate how sick they are feeling at that moment on a scale of 0–10 during the VR experience, with 0 indicating how they felt when the experience started, and 10 indicating that they need to stop usage immediately. This metric has an obvious advantage over the previously mentioned questionnaires; the Discomfort Score allows us to see sickness as it evolves in users over time.
Subjective measurements of VR sickness such as the SSQ and Discomfort scores have some limitations because they rely on the user’s subjective judgment which could vary between individuals. In an effort to establish more objective measures of tracking VR sickness, researchers have looked to collect physiological data such as postural sway (Häkkinen et al., 2002), electrodermal activity (EDA) (Magaki and Vallance, 2019), body temperature (Geršak et al., 2020), and heart rate (Yamamura et al., 2020). Eye blink data has also been suggested as a potential source of valuable sickness information (Chang et al., 2021). In this study, to measure the incidence of VR sickness and discomfort we use both subjective and objective methods.
3.3.1 Subjective Sickness Scores
3.3.1.1 Discomfort Scores
The discomfort scores were collected through the VE by prompting the user to select a score every minute. The discomfort score allows a sampling of VR sickness scores during the trial. Discomfort scores were averaged for each participant per session to obtain an average discomfort score (ADS), and an ending discomfort score (EDS) was calculated by using the last discomfort score for each participant per session, similar to Fernandes and Feiner (2016). This value is 10 if the participant terminated early due to severe discomfort.
3.3.1.2 SSQ Scores
Baseline SSQ data was collected before each session and post-immersion SSQ data was collected after each session. Data collected from the SSQ questionnaires are used to calculate four associated scores, namely: Total Severity, Oculomotor, Nausea, and Disorientation scores. These scores were calculated as per the conversion formulas by Kennedy et al. (1993). We then subtract the baseline SSQ subscores from the post-immersion SSQ subscores to get our relative SSQ subscores.
3.3.2 Objective Sickness Scores
A recent review of the causes and measurements of VR sickness by Chang et al. (2020) found that electrodermal activity (EDA) is one of the widely used objective measures of VR sickness. As a result, in this study we chose to use EDA as an objective measurement of VR sickness. EDA was recorded from the medial-phalanges of the index and middle finger of the non-dominant hand’s palmar sites. That is, we placed the sensors on the upper-middle portion of the index and middle finger (see Figure 2). Baseline EDA data was recorded for 2 min before immersion in VR, and for the full period of each experiment session. There are two main components in EDA signals: the general tonic-level component measured as Skin Conductance Level (SCL) which is thought to reflect general changes in autonomic arousal, and the phasic-level component measures as Skin Conductance Response (SCR) which refers to the fast changing elements of the signal.
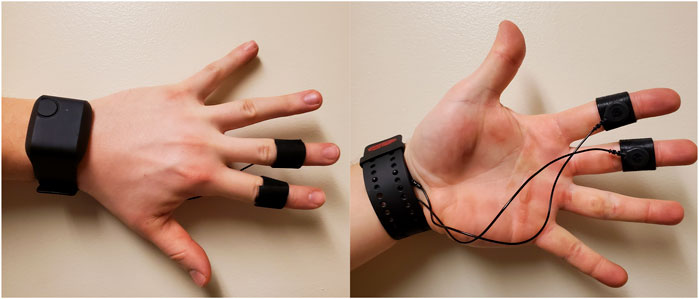
FIGURE 2. Placement of the Empatica E4 wristband and the EDA electrodes.
To decompose the EDA signal into the phasic and tonic components we applied a high pass filter with a cut-off frequency of 0.05 Hz, and we compute the SCL of the tonic component and Amplitude Root Mean Square (RMS) from the phasic component as these metrics have been shown to be promising VR sickness indicators in previous studies (Dennison et al., 2016; Gavgani et al., 2017). Similar to previous studies (Dennison et al., 2016; Gavgani et al., 2017) we divide the recorded data into blocks of 1 min each, and for the purpose of statistical analysis the tonic SCL and the RMS amplitude are averaged for these blocks.
To remove individual variability, our tonic SCL scores are standardized by dividing all exposure values by the baseline score (Braithwaite et al., 2013; Dennison et al., 2016), and our EDA signal was standardized using Z-score standardization prior to extracting the phasic component (Braithwaite et al., 2013).
3.3.3 Optic Flow
To understand the amount of optic flow experienced by participants during each day of the experiment, we measured the magnitude of optic flow during each session. To measure optic flow we recorded video streams of participants navigating the virtual environment during each condition. Similar to previous studies, the video streams were recorded from the left stereoscopic camera (Islam et al., 2021). The streams were recorded at a rate of 30 frames per second and at the full resolution of 2220 × 1450. The video frames were preprocessed by re-scaling them to 392 × 256 resolution, as calculating dense optic flow with the full resolution would be computationally expensive. We use the dense optic flow calculation algorithm developed by Farneb (2003) to calculate the magnitude and direction of optic flow in each frame. Optic flow for each frame is expressed as a 2D vector field where each vector represents displacement of image points between successive frames. We then average the magnitude of optical flow, measured as pixels per frame, over all pixels of each frame to get the average magnitude of optic flow per frame. The data for all frames of each session video is then averaged to get the average magnitude of optic flow exposure for that session. For convenience, we refer to this average magnitude below as optic flow strength.
3.4 Procedure
When participants arrived for the first day of testing, they were provided information explaining the procedures of the experiment, the risks involved, and the types and handling procedures of the data collected in the experiment. Following this, participants were asked to fill out a pre-study demographic questionnaire. The participants were shown a 2-min video explaining the virtual environments and the experiment task and were given an overview of the controller used in the study and how to use it.
Participants started by filling in a baseline SSQ. They were then assisted with putting the physiological sensor wristband on their non-dominant hand. Following this, 2 minutes of resting baseline EDA data outside the VR environment was collected from the participants. Participants were asked to sit and avoid movement of the hand wearing the wristband during baseline data collection. Following this, participants were assisted with putting on the VR headset. We made sure the HMD and wristband were well-fitted, but comfortable.
Participants were asked to navigate the Windridge City environment by following a set of waypoints to the end of the environment. On days 2 through 4, participants navigated an optokinetic labyrinth at increasing luminance contrast values: 0.5 on day 2, 0.75 on day 3, full contrast on day 4. On the final day of testing, participants navigated the Windridge city environment as they had on the first day. During the experiment, participants were also asked to provide a discomfort score (see Section 3.3.1) (Fernandes and Feiner, 2016) at 1 minute intervals. Participants completed the navigation tasks while standing. They controlled their forward and lateral movements with the XBox 360 controller and steered with their head. To prevent transfer of symptoms between sessions, a minimum of 12 h (maximum 48 h) and a full night’s rest were required between sessions. Each experiment session took around 30 min, with 20 min of VR exposure.
After each session, participants were asked to fill out a Simulator Sickness Questionnaire (SSQ (Kennedy et al., 1993)) in order to assess their level of post-exposure sickness. The room was kept at 20°C to prevent interference with SSQ data (i.e. sweating due to temperature, rather than sickness) and ensure participants all experience the same air temperature (Arnold et al., 2019).
3.5 Participants
Potential participants were recruited by online flyers from the local campus community. Participants who expressed interest in the study were given a questionnaire to determine their eligibility. The questionnaire (Supplementary Figure S1) was adapted from Golding (2006) and Kinsella (2018). Because we were interested in users who experience VR sickness symptoms, participants were excluded from participating if they satisfied any of the following conditions: frequent users of VR, never experience VR sickness or motion sickness, suffer from inner ear problems or vertigo. Initially, 49 people showed interest in the study of whom 12 were excluded because they had frequent experience with VR. Two were excluded because they have inner ear problems or vertigo. 13 chose not to participate in the study after getting contacted for participation. 22 participants were recruited for the experiment (11 male, 11 female, mean age: 23.45, and SD: 3.9).
Out of the 22 participants two participants, both female, were unable to complete the study reporting that they were too sick to continue after day 2. One additional female participant experienced data loss during a session due to equipment failure. The analyses included were conducted on the remaining 19 participants (11 male, 8 female. mean age: 22.8, SD: 3.6). The number of participants was chosen based on similar previous studies (Al Zayer et al., 2016; Fernandes and Feiner, 2016; Adhanom et al., 2020).
4 Results
To align our results with our research questions, we report the results in two parts: the first subsection reports results for the test sessions (days 1 and 5) and the second subsection reports the results for the training sessions (days 2, 3, and 4). The results for the test sessions aim to address RQ2 - whether the adaptation training was transferred from the abstract training environment to the complex testing environment.
For all statistical tests, we used Shapiro–Wilk tests to test the normality of our data, and we used the box plot method to identify outliers outside the Q1 - 1.5 × IQR to Q3 + 1.5 × IQR range. Q1 and Q3 are the first and third quartile, respectively. IQR is the interquartile range (IQR = Q3 - Q1). There were outliers in some of our results due to participants showing high levels of discomfort, especially during the early days. We retained these outliers because they are a natural part of the data, rather than errors. A significance level of 0.05 was set for all analysis. All our statistical tests were performed in R version 4.1.0 using the rstatix package, and results were duplicated SPSS.
4.1 Testing Sessions
In this section we report the results for day 1 (pre-training) and day 5 (post-training). We report summary results of the discomfort scores and the SSQ subscales in Table 1 and we discuss the results and our statistical tests in more detail in the following subsections.
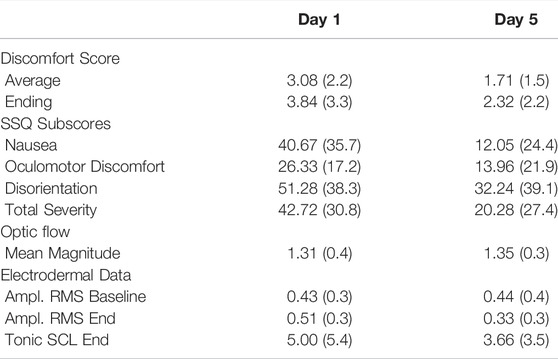
TABLE 1. Summary results of discomfort scores, simulator sickness questionnaire, optic flow, and electrodermal data for the testing days in terms of mean (standard deviation).
4.1.1 Discomfort Scores
Figure 3 shows the mean ADS and EDS scores of the testing days 1 and 5. A Shapiro–Wilk test found that our data were normally distributed. Our outlier test showed that we had one outlier, but no extreme outliers. We retained the identified outlier in each score, as we considered that they were a natural part of the data, rather than errors.
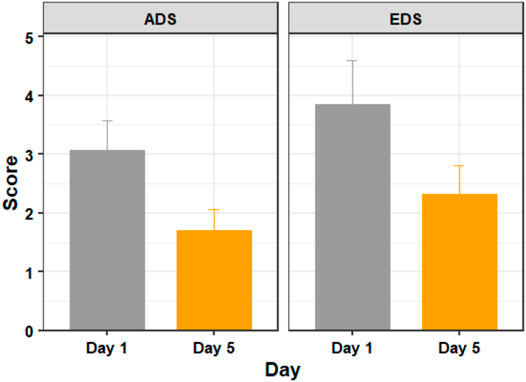
FIGURE 3. The average discomfort score (ADS) and ending discomfort score (EDS) of participants on days 1 (before training) and 5 (after training). Figure shows mean and standard error.
Using a paired t-test we found significant differences in discomfort measures between days 1 and 5 with respect to both ADS (t (18) = 3.297, p = 0.004, d = 0.756) and EDS (t (18) = 2.635, p = 0.017, d = 0.605).
4.1.2 SSQ Sub-scores
Figure 4 shows the average SSQ subscores for the testing days. A Shapiro–Wilk test found that our data were not normally distributed. Our outlier test showed that we had some outliers. We retained the identified outliers in each sub-score, as these scores were from users who felt severe discomfort during the experiment and were not extreme outliers. Since our data violates the assumptions of the paired t-test, we used a Wilcoxon signed-rank test - the non-parametric alternative to the paired t-test.
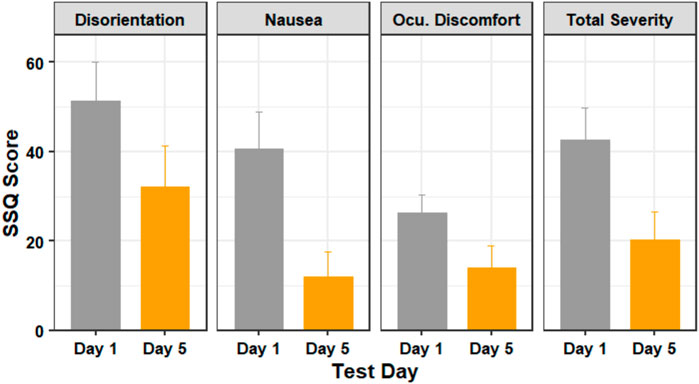
FIGURE 4. The SSQ subscores of participants in days 1 (before training) and 5 (after training). Figure shows mean and standard error.
A Wilcoxon signed-rank test showed that there was statistically significant change in nausea score (Z = 16, p = 0.001) and the total severity score (Z = 14, p = 0.031), but there was no statistically significant change in the disorientation score (Z = 12, p = 0.143) or the oculomotor discomfort score (Z = 13, p = 0.096) between days 1 and 5.
4.1.3 EDA Data
A Wilcoxon signed rank test showed that, on day 1, the phasic amplitude RMS values did not differ significantly when compared to the baseline values (Z = 115, p = 0.322). On day 5, there was no significant increase in phasic amplitude RMS values during the session (Z = 174, p = 0.0.322). Comparing between days, while there were no significant differences at the baseline between days 1 and 5 (Z = 146, p = 0.973), the phasic amplitude RMS was significantly lower on day 5 compared to day 1 (Z = 215, p = 0.015) indicating a decrease of VR sickness symptoms in day 5, after completing the training sessions.
Figure 5 shows how the average tonic SCL values changed over time during each session. Although the SCL plot shows a decrease on the tonic SCL level between days 1 and 5, a Wilcoxon signed-rank test showed that the difference was not significant (Z = 18, p = 0.648).
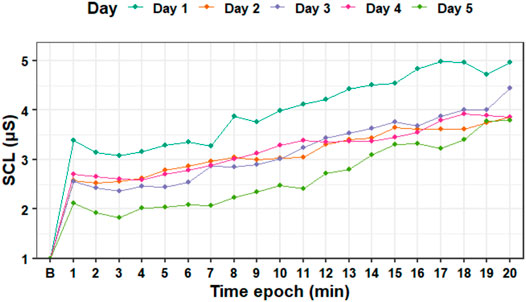
FIGURE 5. Standardized tonic skin conductance level data averaged for each epoch (minute) during the experiment days. B—baseline SCL.
4.1.4 Optic Flow Magnitude
A Shapiro–Wilk test found that our optic flow magnitude data for the testing days were not normally distributed, therefore we used the Wilcoxon-signed ranks test to analyze the data.
Our analysis of optic flow magnitude data with the Wilcoxon-signed rank test for the testing days (days 1 and 5) found that participants did not experience a significantly different magnitude of optic flow (Z = 0.648, p = 0.517) during the test days.
4.2 Training Sessions
In this section we report our results for the training days (days 2, 3, and 4). We report summary results of the discomfort scores and the SSQ subscales in Table 2 and we discuss the results and our statistical tests in more detail in the following subsections.
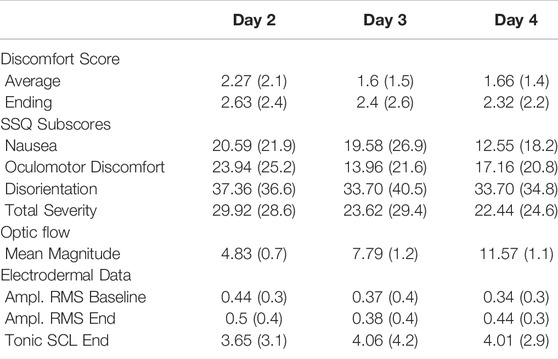
TABLE 2. Summary results of discomfort scores, simulator sickness questionnaire, optic flow, and electrodermal data for the training days in terms of mean (standard deviation).
4.2.1 Discomfort Scores
Figure 6 shows the mean ADS and EDS scores of the training days 2, 3, and 4. A Shapiro–Wilk test found that our data were normally distributed. We did not have extreme outliers in our data.
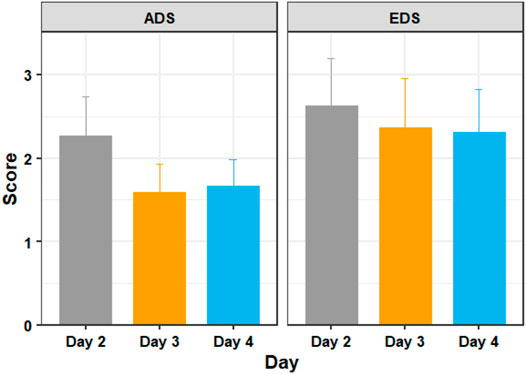
FIGURE 6. The average discomfort score (ADS) and ending discomfort score (EDS) of participants in days 2, 3, and 4 of adaptation training. Figure shows mean and standard error.
A one way repeated measures ANOVA showed that there were significant differences in discomfort measures between the training days with respect to ADS (F = 4.086, p = 0.042) but not with respect to EDS (F = 0.503, p = 0.609). Post hoc analysis with paired t-tests was conducted and Bonferroni adjustment applied. The post hoc tests revealed that ADS was statistically significantly decreased from day 2 to day 3 (t (18) = 3.38, p = 0.010), but not from days 3–4 (t (18) = −0.31, p = 1.000). EDS did not show any statistically significant decreases between day 2 and day 3 (t (18) = 0.96, p = 1.000) or from day 3 to day 4 (t (18) = 0.15, p = 1.000).
4.2.2 SSQ Sub-Scores
Figure 7 shows the average SSQ subscores for the training days. A Shapiro–Wilk test found that our data were not normally distributed. Our outlier test also showed that we had some outliers from users who felt extreme discomfort during the experiment. Since our data violates the assumptions of the one way repeated measures ANOVA, we used the Friedman test - the non-parametric alternative to the one way repeated measures ANOVA.
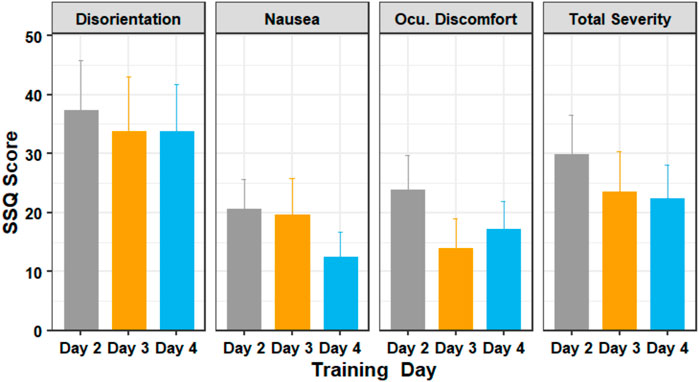
FIGURE 7. The SSQ subscores of participants in days 2 through 4 of the training session. Figure shows mean and standard error.
The Friedman test showed that there was a statistically significant difference in the oculomotor discomfort score among the training days, (χ2 (2) = 8.38, p = 0.015). The test showed that there was no significant difference in the nausea score (χ2 (2) = 2.76, p = 0.251), disorientation score (χ2 (2) = 2.52, p = 0.284) and the total severity score (χ2 (2) = 3.65, p = 0.161). Post-hoc analysis with Wilcoxon signed-rank tests was conducted with a Bonferroni correction applied, and showed that there was no significant difference in scores between the training days.
4.2.3 EDA Data
Wilcoxon signed rank tests showed that the phasic amplitude RMS values did not increase significantly at the end of the session for days 2 (Z = 147. p = 0.945), 3 (Z = 145.5. p = 0.986) and 4 (Z = 109. p = 0.231) when compared to the baseline values. Comparing between days 2, 3, and 4, a Friedman test showed that there were no significant differences for the baseline (χ2 (2) = 2.471, p = 0.291) or the session end (χ2 (2) = 0.471, p = 0.790) values of the phasic amplitude RMS. A Friedman test showed that the tonic SCL data also does not show significant difference between days 2, 3, and 4 (χ2 (2) = 1.529, p = 0.465).
4.2.4 Optic Flow Magnitude
Figure 8 shows the average optic flow magnitude for the training days, and Figure 9 shows a visualization of the optic flow a typical user experienced during the training days. A Shapiro–Wilk test found that our data for both the training days were not normally distributed, therefore we used the Friedman test to analyze the results for the training days.
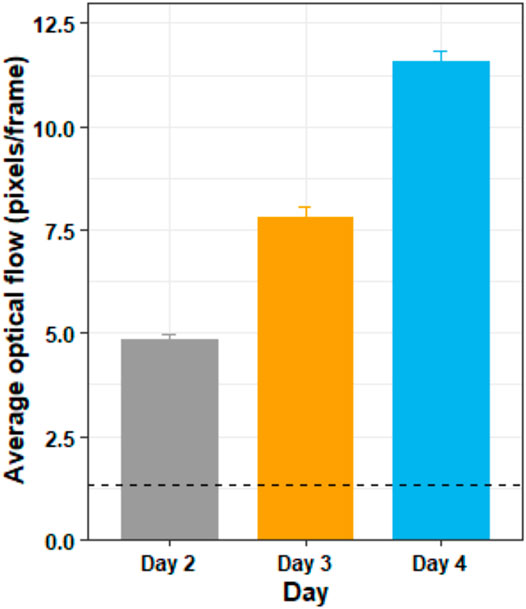
FIGURE 8. The average optic flow magnitude by day for the training days. The horizontal dotted line shows the average optic flow magnitude of the two testing days (days 1 and 5) for comparison. The figure shows mean and standard deviation.
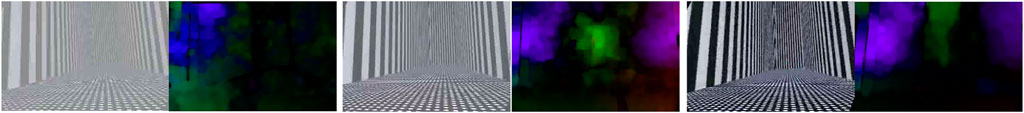
FIGURE 9. Frames captured in days 2, 3, and 4 of training days along with their corresponding optic flow visualization. The frames show the view a typical participant saw traveling through the same spot at the same speed on the three separate days of the experiment, along with their optic flow visualizations.
The Friedman test showed that there was a substantially significant difference in optic flow magnitude between the training days (χ2 (2) = 38, p < 0.05). Post hoc analysis with Wilcoxon signed-rank tests was conducted with a Bonferroni correction applied, and showed that there was significant difference in optic flow magnitude between days 2 and 3 (Z = 0, p < 0.05), between days 3 and 4 (Z = 0, p < 0.05) and between days 2 and 4 (Z = 0, p < 0.05).
5 Discussion
This study had two aims, to investigate VR sickness adaptation methods that allow gradual exposure to increasing optic flow and the transferability of adaptation from one environment to another. To avoid floor effects, we explicitly recruited individuals that reported susceptibility to VR sickness and limited VR use. Subjects were tested over 5 days, consisting of a baseline on day 1, three consecutive training days, and a final test session on day 5. The test environment consisted of a cityscape, while the training environment was a less realistic labyrinth with black and white striped walls. Contrast and thus optic flow strength was gradually increased over consecutive training days. Results indicate that, despite the increase in optic flow strength, subjective sickness reports and objective physiological measures did not increase, but instead tended to remain constant or even decrease over consecutive training days, though this decrease was generally not significant. Comparison between measures obtained on days 1 and 5, on the other hand, tended to show significant decreases in sickness. These results suggest that exposure to ramped optic flow strength supports gradual adaptation of VR sickness and its symptoms. Additionally, adaptation that is developed in more abstract and impoverished environments can transfer to richer and more naturalistic environments. These results suggest that carefully controlled adaptation procedures can be a successful mitigation strategy for VR sickness.
5.1 RQ1: Ramped Optic Flow Exposure
One of the primary aims of this study was to investigate whether exposure to ramped optic flow strength in an abstract environment allows for gradual adaptation to VR sickness. Prior studies have shown that reducing overall optic flow strength, for example, by restricting the FOV to eliminate faster motion at the periphery (Fernandes and Feiner, 2016) can lead to reduced sickness. In addition, reducing contrast has recently been shown to reduce vection magnitude and duration, and to increase vection onset latency (Guo et al., 2021). However, to our knowledge, no prior studies have explicitly demonstrated that scene contrast directly impacts VR sickness. It is reasonable to hypothesize that decreased contrast, and thus decreased optic flow strength, should lead to decreased severity of sickness. For this reason, we chose to begin training on day 2 with a reduced contrast version of the training environment. The drop in reported sickness between days 1 and 2 suggests that the low-contrast labyrinth was indeed less provocative than the full-contrast test environment, and thus a well-chosen training stimulus. We believe this reduction is due in part to the impoverished nature of the training environment (Stanney et al., 2003; Riecke et al., 2006; Davis et al., 2015) and the reduced contrast, but it may also be a manifestation of the typical day-1-to-day-2 learning rate reported previously (Newman et al., 2013). Regardless, contrast manipulation provided a convenient method to parametrically increase optic flow strength (Figure 8), vection (Guo et al., 2021), and thus (presumably) the provocative nature of the VR experience, over successive training days. Despite this increase, we did not observe an increase in reported sickness. To the contrary, reported sickness either remained constant or decreased over successive training days. These results suggest that manipulating optic flow via contrast manipulation may be a straightforward way to maintain sickness at manageable levels while still allowing training.
5.2 RQ2: Adaptation Transfer
Another primary aim of this study was to investigate whether adaptation to VR sickness that was developed in a more abstract environment can transfer to a richer and more complex environment. Prior research has demonstrated that VR sickness is more pronounced with increasing graphic realism (Golding et al., 2012; Davis et al., 2015) and scene complexity (Kingdon et al., 2001; Stanney et al., 2003). This was our motivation for training using an impoverished environment, as a way to limit sickness during training. But for such a method to be effective, the results of any adaptation must be shown to transfer from more impoverished to richer environments. To our knowledge, no other study has demonstrated the transfer of adaptation between VR environments using VR as its training mechanism. We take the reduction in sickness observed on Day 5 relative to Day 1 in our experiment to be evidence that adaptation developed in the labyrinth environment effectively transferred to the richer test environment. An alternative explanation for the reduced sickness on day 5 relative to day 1 is that this is simply a manifestation of the reduction in sickness due to prior exposure to the test environment on day 1. We believe this is unlikely because the sickness scores on day 4 with the training stimulus (ADS, EDS, and SSQ) are generally very similar to the sickness scores observed on day 5 with the test stimulus. This similarity is consistent with the idea of adaptation transfer and seems unlikely to occur by chance. Not all subscores from the SSQ indicated decreased sickness, specifically, the oculomotor and disorientation scores were not significantly different between Day 1 and Day 5. This would indicate that the change in total severity score is driven mostly by a change in nausea. It is worth noting that research also suggests that an increased sense of presence can lead to a decrease in VR sickness (Weech et al., 2019). While we did not collect information on subjects’ feelings of presence, we take the drop in sickness between days 1 and 2 to demonstrate that regardless of presence, subjects did experience greater sickness in the original, complex, environment.
6 Limitations and Future Work
The conclusions of the study would be strengthened by collection of additional data to control for both ramping optic flow as well as the transfer of adaptation between abstract and rich natural environments. For example, the drop in sickness and EDA observed between days 1 and 5 could be compared against the drop in sickness observed in a comparison group exposed to the test stimulus on consecutive days without being exposed to the training environment. Similarly, the levels of sickness observed on training days 2 through 4 could be compared against sickness observed in a comparison group for which contrast and optic flow were held constant over the 3 days. These avenues were not explored for two reasons; first, these measurements were not possible because they would have required tripling the number of subjects enrolled in our study. Due to our restrictive inclusion criteria (see methods) and COVID-19 concerns it was already a challenge to recruit the current pool of subjects. Second, these methodologies were already largely exploratory, with previous literature already investigating much of the aforementioned control results. As mentioned in the related works section, it is well-known that consistent exposure to the same VR environment results in adaptation (Reason and Brand, 1975; Cobb et al., 1999; Hill and Howarth, 2000; Bailenson and Yee, 2006; Domeyer et al., 2013; Beadle et al., 2021), but these effects have also been known to dissipate in as little the same day (Lampton et al., 2000). This makes it unlikely that the results from day 5 are solely due to exposure to the city environment on the first day. Similarly, investigations into adaptation transfer have been largely unsuccessful or conflicting, so it is noteworthy that scores between days 4 and 5 were so similar. We suggest that this methodology was successful because it borrows concepts from motion sickness training such as gradually increasing exposure (Rine et al., 1999; Takeda et al., 2001) to a root cause of VR sickness (i.e., optic flow or the associated vection).
From our results, we concluded that subjects experienced lower levels of sickness over time, and these effects persisted between environments. The mechanisms behind this change, whether they be through the actions of the subjects or via some neurological mechanism, are unfortunately beyond the scope of this study. However, future work exploring changes in behavior in subjects in VR over time would be a worthy follow-up to this study.
Subjective feelings of vection were not directly measured during this experiment. However, previous research has shown increasing luminance contrast increases feelings of vection (Sauvan and Bonnet, 1993; Patterson and York, 2009; Guo et al., 2021), and so it is logical to assume the same effect was experienced in our experiment. Independent of this matter, further research has shown that increases in optic flow lead to greater feelings of VR sickness (Davis et al., 2015). Therefore, regardless of vection, we can assume that the increase in luminance contrast and optic flow did lead to greater stimulus intensity as intended.
Regarding physiological data, we used the Empatica E4 watch, which is limited to a sampling rate of 4 Hz for EDA data. It is important to note that EDA signals are particularly sensitive to motion artifacts. Because our subjects were using their hands in order to manipulate the controller for locomotion, these artifacts were likely present in our data.
7 Conclusion
In this study, we tested a novel method for managing VR sickness through training. We used an abstract environment and reduced stimulus contrast to limit sickness during training. We showed that sickness remained constant or decreased on consecutive training days, even though contrast and optic flow strength was increasing. We also argue that adaptation developed in an abstract training environment transferred to a richer test environment. These results demonstrate that adaptation to VR sickness via careful and gradual exposure to successively more provocative VR stimuli shows promise as a VR sickness mitigation strategy.
Data Availability Statement
The raw data supporting the conclusion of this article will be made available by the authors, without undue reservation.
Ethics Statement
The studies involving human participants were reviewed and approved by The University of Nevada, Reno Institutional Review Board. Written informed consent for participation was not required for this study in accordance with the national legislation and the institutional requirements.
Author Contributions
IA and SH contributed equally to this work and share first authorship. IA and SH contributed to the design, implementation, data collection, and statistical analysis. EF and PM contributed to the design and supervision of this work. All authors contributed to writing the article and approved the submitted version.
Funding
This work is supported by NSF grant 1911041 and NIH under Grant P20 GM103650.
Conflict of Interest
The authors declare that the research was conducted in the absence of any commercial or financial relationships that could be construed as a potential conflict of interest.
Publisher’s Note
All claims expressed in this article are solely those of the authors and do not necessarily represent those of their affiliated organizations, or those of the publisher, the editors and the reviewers. Any product that may be evaluated in this article, or claim that may be made by its manufacturer, is not guaranteed or endorsed by the publisher.
Supplementary Material
The Supplementary Material for this article can be found online at: https://www.frontiersin.org/articles/10.3389/frvir.2022.848001/full#supplementary-material
References
Adhanom, I. B., Navarro Griffin, N., Macneilage, P., and Folmer, E. (2020). “The Effect of a Foveated Field-Of-View Restrictor on VR Sickness,” in Proceedings - 2020 IEEE Conference on Virtual Reality and 3D User Interfaces, VR (IEEE), 645–652. doi:10.1109/VR46266.2020.1581314696458
Al Zayer, M., MacNeilage, P., and Folmer, E. (2020). Virtual Locomotion: A Survey. IEEE Trans. Vis. Comput. Graph.(New York, NY) 26, 2315–2334. doi:10.1109/TVCG.2018.2887379
Al Zayer, M., Tregillus, S., Bhandari, J., Feil-Seifer, D., and Folmer, E. (2016). “Exploring the Use of a Drone to Guide Blind Runners,” in Proceedings of the 18th International ACM SIGACCESS Conference on Computers and Accessibility (ACM), 263–264. doi:10.1145/2982142.2982204
Arnold, J. T., O'Keeffe, K., McDaniel, C., Hodder, S., and Lloyd, A. (2019). Effect of Virtual Reality and Whole-Body Heating on Motion Sickness Severity: A Combined and Individual Stressors Approach. Displays 60, 18–23. doi:10.1016/j.displa.2019.08.007
Bailenson, J. N., and Yee, N. (2006). A Longitudinal Study of Task Performance, Head Movements, Subjective Report, Simulator Sickness, and Transformed Social Interaction in Collaborative Virtual Environments. Presence Teleoperators Virtual Environ. 15, 699–716. doi:10.1162/pres.15.6.699
Beadle, S. C., Muth, E. R., and Pagano, C. C. (2021). Using Head-Mounted Displays to Examine Adaptation and Calibration under Varying Perturbations. Displays 66, 101985. doi:10.1016/j.displa.2020.101985
Braithwaite, J. J. J., Derrick, D., Watson, G., Jones, R., Rowe, M., Watson, D., et al. (2013). A Guide for Analysing Electrodermal Activity (EDA) & Skin Conductance Responses (SCRs) for Psychological Experiments. UK: University of Birmingham, 1–42.
Bubka, A., Bonato, F., and Palmisano, S. (2007). Expanding and Contracting Optical Flow Patterns and Simulator Sickness. Aviat. Space Environ. Med. 78, 383–386.
[Dataset] Budhiraja, P., Miller, M. R., Modi, A. K., and Forsyth, D. (2017). Rotation Blurring: Use of Artificial Blurring to Reduce Cybersickness in Virtual Reality First Person Shooters. New York, NY: arXiv:1710.02599.
Chang, E., Kim, H. T., and Yoo, B. (2021). Predicting Cybersickness Based on User's Gaze Behaviors in HMD-Based Virtual Reality. J. Comput. Des. Eng. 8, 728–739. doi:10.1093/jcde/qwab010
Chang, E., Kim, H. T., and Yoo, B. (2020). Virtual Reality Sickness: A Review of Causes and Measurements. Int. J. Human-Computer Interact. 36, 1658–1682. doi:10.1080/10447318.2020.1778351
Cobb, S. V. G., Nichols, S., Ramsey, A., and Wilson, J. R. (1999). Virtual Reality-Induced Symptoms and Effects (VRISE). Presence Teleoperators Virtual Environ. 8, 169–186. doi:10.1162/105474699566152
Davis, S., Nesbitt, K., and Nalivaiko, E. (2015). “Comparing the Onset of Cybersickness Using the Oculus Rift and Two Virtual Roller Coasters,” in 11th Australasian Conference on Interactive Entertainment (IE 2015) (Sydney, Australia: CRPIT), 27–30.
Dennison, M. S., Wisti, A. Z., and D’Zmura, M. (2016). Use of Physiological Signals to Predict Cybersickness. Displays 44, 42–52. doi:10.1016/j.displa.2016.07.002
Domeyer, J. E., Cassavaugh, N. D., and Backs, R. W. (2013). The Use of Adaptation to Reduce Simulator Sickness in Driving Assessment and Research. Accid. Analysis Prev. 53, 127–132. doi:10.1016/j.aap.2012.12.039
[Dataset] Dużmańska, N., Strojny, P., and Strojny, A. (2018). Can Simulator Sickness Be Avoided? A Review on Temporal Aspects of Simulator Sickness. Front. Psychol. 9, 1. doi:10.3389/fpsyg.2018.02132
Ebenholtz, S. M. (1992). Motion Sickness and Oculomotor Systems in Virtual Environments. Presence Teleoperators Virtual Environ. 1, 302–305. doi:10.1162/pres.1992.1.3.302
Farnebäck, G. (2003). Two-Frame Motion Estimation Based on Polynomial Expansion. Lect. Notes Comput. Sci. 2749, 363–370. doi:10.1007/3-540-45103-x_50
Fernandes, A. S., and Feiner, S. K. (2016). “Combating VR Sickness through Subtle Dynamic Field-Of-View Modification,” in 2016 IEEE Symposium on 3D User Interfaces (3DUI) (IEEE), 201–210. doi:10.1109/3dui.2016.7460053
Fujii, Y., and Seno, T. (2020). The Effect of Optical Flow Motion Direction on Vection Strength. i-Perception 11, 204166951989910. doi:10.1177/2041669519899108
Gavgani, A. M., Nesbitt, K. V., Blackmore, K. L., and Nalivaiko, E. (2017). Profiling Subjective Symptoms and Autonomic Changes Associated with Cybersickness. Aut. Neurosci. 203, 41–50. doi:10.1016/j.autneu.2016.12.004
Geršak, G., Lu, H., and Guna, J. (2020). Effect of VR Technology Matureness on VR Sickness. Multimed. Tools Appl. 79, 14491–14507. doi:10.1007/s11042-018-6969-2
Golding, J. F., Doolan, K., Acharya, A., Tribak, M., and Gresty, M. A. (2012). Cognitive Cues and Visually Induced Motion Sickness. Aviat. space Environ. Med. 83, 477–482. doi:10.3357/ASEM.3095.2012
Golding, J. F. (2006). Predicting Individual Differences in Motion Sickness Susceptibility by Questionnaire. Personality Individ. Differ. 41, 237–248. doi:10.1016/j.paid.2006.01.012
Guo, X., Nakamura, S., Fujii, Y., Seno, T., and Palmisano, S. (2021). Effects of Luminance Contrast, Averaged Luminance and Spatial Frequency on Vection. Exp. Brain Res. 239, 3507–3525. doi:10.1007/s00221-021-06214-5
Häkkinen, J., Vuori, T., and Paakka, M. (2002). Postural Stability and Sickness Symptoms after HMD Use. Proc. IEEE Int. Conf. Syst. Man Cybern. 1, 147–152. doi:10.1109/icsmc.2002.1167964
Hill, K. J., and Howarth, P. A. (2000). Habituation to the Side Effects of Immersion in a Virtual Environment. Displays 21, 25–30. doi:10.1016/s0141-9382(00)00029-9
Howarth, P. A., and Hodder, S. G. (2008). Characteristics of Habituation to Motion in a Virtual Environment. Displays 29, 117–123. doi:10.1016/j.displa.2007.09.009
Islam, R., Desai, K., and Quarles, J. (2021). “Cybersickness Prediction from Integrated HMD's Sensors: A Multimodal Deep Fusion Approach Using Eye-Tracking and Head-Tracking Data,” in 2021 IEEE International Symposium on Mixed and Augmented Reality (ISMAR) (IEEE), 31–40. doi:10.1109/ISMAR52148.2021.00017
Kennedy, R. S., Lane, N. E., Berbaum, K. S., and Lilienthal, M. G. (1993). Simulator Sickness Questionnaire: An Enhanced Method for Quantifying Simulator Sickness. Int. J. Aviat. Psychol. 3, 203–220. doi:10.1207/s15327108ijap0303_3
Keshavarz, B. (2016). “Exploring Behavioral Methods to Reduce Visually Induced Motion Sickness in Virtual Environments,” in Virtual, Augmented and Mixed Reality (Springer International Publishing), 147–155. doi:10.1007/978-3-319-39907-2_14
Keshavarz, B., Hecht, H., and Lawson, B. (2014). Visually Induced Motion Sickness: Characteristics, Causes, and Countermeasures. Handb. Virtual Environ. Des. Implement. Appl. 1, 648–697.
Keshavarz, B., Riecke, B. E., Hettinger, L. J., and Campos, J. L. (2015). Vection and Visually Induced Motion Sickness: How Are They Related? Front. Psychol. 6, 1–11. doi:10.3389/fpsyg.2015.00472
Kim, H. K., Park, J., Choi, Y., and Choe, M. (2018). Virtual Reality Sickness Questionnaire (VRSQ): Motion Sickness Measurement Index in a Virtual Reality Environment. Appl. Ergon. 69, 66–73. doi:10.1016/j.apergo.2017.12.016
Kingdon, K. S., Stanney, K. M., and Kennedy, R. S. (2001). Extreme Responses to Virtual Environment Exposure. Proc. Hum. Factors Ergonomics Soc. Annu. Meet. 45, 1906–1910. doi:10.1177/154193120104502711
Kinsella, A. (2018). Adaptation to Base Latency in a Head-Mounted Display Using a Performance Task to Facilitate Adaptation. ProQuest Diss. Theses 1, 147.
Kolasinski, E. M. (1995). Simulator Sickness in Virtual Environments. New York, NY: Tech. rep., DTIC Document.
Lampton, D. R., Rodriguez, M. E., and Cotton, J. E. (2000). “Simulator Sickness Symptoms during Team Training in Immersive Virtual Environments,” in Proceedings of IEA 2000/HFES 2000 Congress (IEEE). doi:10.1177/154193120004400512
Magaki, T., and Vallance, M. (2019). “Developing an Accessible Evaluation Method of VR Cybersickness,” in 26th IEEE Conference on Virtual Reality and 3D User Interfaces, VR 2019 - Proceedings (IEEE), 1072–1073. doi:10.1109/VR.2019.8797748
Monteiro, D. V., Chen, H., Liang, H.-N., Tu, H., and Dub, H. (2021). “Evaluating Performance and Gameplay of Virtual Reality Sickness Techniques in a First-Person Shooter Game,” in 2021 IEEE Conference on Games (CoG) (IEEE), 1–8. doi:10.1109/cog52621.2021.9619145
Mouloua, M., Smither, J., Kennedy, R. C., Kennedy, R. S., Compton, D. E., and Drexler, J. M. (2005). Training Effects in a Sickness-Inducing Environment. Proc. Hum. Factors Ergonomics Soc. Annu. Meet. 49, 2206–2210. doi:10.1177/154193120504902519
[Dataset] Nelson, N. (2015). Npr: All Tech Considered. Virtual Reality’s Next Hurdle: Overcoming ’sim Sickness’. Available at: http://www.npr.org/sections/alltechconsidered/2014/08/05/338015854/virtual-realitys-next-hurdle-overcoming-sim-sickness.
Newman, M. C., McCarthy, G. W., Glaser, S. T., Bonato, F., and Bubka, A. (2013). Motion Sickness Adaptation to Coriolis-Inducing Head Movements in a Sustained G Flight Simulator. Aviat. space Environ. Med. 84, 104–109. doi:10.3357/ASEM.3170.2013
Palmisano, S., Allison, R. S., Schira, M. M., and Barry, R. J. (2015). Future Challenges for Vection Research: Definitions, Functional Significance, Measures, and Neural Bases. Front. Psychol. 6, 1–15. doi:10.3389/fpsyg.2015.00193
Palmisano, S., Kim, J., Allison, R., and Bonato, F. (2011). Simulated Viewpoint Jitter Shakes Sensory Conflict Accounts of Vection. Seeing Perceiving 24, 173–200. doi:10.1163/187847511X570817
Palmisano, S., Mursic, R., and Kim, J. (2017). Vection and Cybersickness Generated by Head-And-Display Motion in the Oculus Rift. Displays 46, 1–8. doi:10.1016/j.displa.2016.11.001
Patterson, F., and York, Y. (2009). Vection and Motion Thresholds as a Function of Contrast. Biology 2009, 1. doi:10.12968/sece.2009.4.1489
[Dataset] Peng, Y.-H., Yu, C., Liu, S.-H., Wang, C.-W., Taele, P., Yu, N.-H., et al. (2020). “WalkingVibe: Reducing Virtual Reality Sickness and Improving Realism while Walking in VR Using Unobtrusive Head-Mounted Vibrotactile Feedback,” in Proceedings of the 2020 CHI Conference on Human Factors in Computing Systems (New York, NY: ACM). doi:10.1145/3313831.3376847
[Dataset] Pöhlmann, K. M. T., O’Hare, L., Dickinson, P., Parke, A., and Föcker, J. (2021). Action Video Game Players Do Not Differ in the Perception of Contrast-Based Motion Illusions but Experience More Vection and Less Discomfort in a Virtual Environment Compared to Non-action Video Game Players. J. Cogn. Enhanc. 6, 3–19. doi:10.1007/s41465-021-00215-6
Prithul, A., Adhanom, I. B., and Folmer, E. (2021). Teleportation in Virtual Reality; A Mini-Review. Front. Virtual Real. 2. doi:10.3389/frvir.2021.730792
Reason, J. T. (1978). Motion Sickness Adaptation: a Neural Mismatch Model. J. R. Soc. Med. 71, 819–829. doi:10.1177/014107687807101109
Regan, E. C. (1995). Some Evidence of Adaptation to Immersion in Virtual Reality. Displays 16, 135–139. doi:10.1016/0141-9382(96)81213-3
Riccio, G. E., and Stoffregen, T. A. (1991). An Ecological Theory of Motion Sickness and Postural Instability. Ecol. Psychol. 3, 195–240. doi:10.1207/s15326969eco0303_2
Riecke, B. E., Schulte-Pelkum, J., Avraamides, M. N., Heyde, M. V. D., and Bülthoff, H. H. (2006). Cognitive Factors Can Influence Self-Motion Perception (Vection) in Virtual Reality. ACM Trans. Appl. Percept. 3, 194–216. doi:10.1145/1166087.1166091
Rine, R. M., Schubert, M. C., and Balkany, T. J. (1999). Visual-vestibular Habituation and Balance Training for Motion Sickness. Phys. Ther. 79, 949–957. doi:10.1093/ptj/79.10.949
Sauvan, X. M., and Bonnet, C. (1993). Properties of Curvilinear Vection. Percept. Psychophys. 53, 429–435. doi:10.3758/BF03206786
Seno, T., Murata, K., Fujii, Y., Kanaya, H., Ogawa, M., Tokunaga, K., et al. (2018). Vection Is Enhanced by Increased Exposure to Optic Flow. i-Perception 9, 204166951877406. doi:10.1177/2041669518774069
Shi, R., Liang, H.-N., Wu, Y., Yu, D., and Xu, W. (2021). Virtual Reality Sickness Mitigation Methods. Proc. ACM Comput. Graph. Interact. Tech. 4, 1–16. doi:10.1145/3451255
Sinitski, E. H., Thompson, A. A., Godsell, P., Honey, J., and Besemann, M. (2018). Postural Stability and Simulator Sickness after Walking on a Treadmill in a Virtual Environment with a Curved Display. Displays 52, 1–7. doi:10.1016/j.displa.2018.01.001
Smither, J. A.-A., Mouloua, M., and Kennedy, R. (2008). Reducing Symptoms of Visually Induced Motion Sickness through Perceptual Training. Int. J. Aviat. Psychol. 18, 326–339. doi:10.1080/10508410802346921
Stanney, K. M., Hale, K. S., Nahmens, I., and Kennedy, R. S. (2003). What to Expect from Immersive Virtual Environment Exposure: Influences of Gender, Body Mass Index, and Past Experience. Hum. Factors 45, 504–520. doi:10.1518/hfes.45.3.504.27254
Takeda, N., Morita, M., Horii, A., Nishiike, S., Kitahara, T., and Uno, A. (2001). Neural Mechanisms of Motion Sickness. J. Med. Invest. 48, 44–59.
Tian, N., Lopes, P., and Boulic, R. (2022). A Review of Cybersickness in Head-Mounted Displays: Raising Attention to Individual Susceptibility. Springer Virtual Reality. doi:10.1007/S10055-022-00638-2
Tregillus, S., and Folmer, E. (2016). “VR-STEP: Walking-In-Place Using Inertial Sensing for Hands Free Navigation in Mobile Vr Environments,” in Proceedings of the 2016 CHI Conference on Human Factors in Computing Systems (New York, NY: ACM), 1250–1255.
[Dataset] UnityTechnologies (2021). Windridge City. Available at: https://naturemanufacture.com/windridge-city/.
Weech, S., Kenny, S., and Barnett-Cowan, M. (2019). Presence and Cybersickness in Virtual Reality Are Negatively Related: A Review. Front. Psychol. 10, 1–19. doi:10.3389/fpsyg.2019.00158
Yamamura, H., Baldauf, H., and Kunze, K. (2020). “Pleasant Locomotion -- towards Reducing Cybersickness Using fNIRS during Walking Events in VR,” in UIST 2020 - Adjunct Publication of the 33rd Annual ACM Symposium on User Interface Software and Technology (New York, NY: ACM), 56–58. doi:10.1145/3379350.3416184
Keywords: virtual reality, VR sickness, simulator sickness, optic flow, cybersickness, adaptation
Citation: Adhanom I, Halow S, Folmer E and MacNeilage P (2022) VR Sickness Adaptation With Ramped Optic Flow Transfers From Abstract To Realistic Environments. Front. Virtual Real. 3:848001. doi: 10.3389/frvir.2022.848001
Received: 03 January 2022; Accepted: 02 May 2022;
Published: 23 May 2022.
Edited by:
Hai-Ning Liang, Xi’an Jiaotong-Liverpool University, ChinaReviewed by:
Bernhard E. Riecke, Simon Fraser University, CanadaKatharina Pöhlmann, University of Glasgow, United Kingdom
Copyright © 2022 Adhanom, Halow, Folmer and MacNeilage. This is an open-access article distributed under the terms of the Creative Commons Attribution License (CC BY). The use, distribution or reproduction in other forums is permitted, provided the original author(s) and the copyright owner(s) are credited and that the original publication in this journal is cited, in accordance with accepted academic practice. No use, distribution or reproduction is permitted which does not comply with these terms.
*Correspondence: Isayas Adhanom, aWFkaGFub21AbmV2YWRhLnVuci5lZHU=