 Marc-Antoine Moinnereau
 Alcyr A. Oliveira
 Tiago H. Falk
- 1Institut National de la Recherche Scientifique (INRS-EMT), University of Québec, Montréal, QC, Canada
- 2Department of Psychology, Federal University of Health Sciences of Porto Alegre, Porto Alegre, Brazil
Measuring a gamer’s behaviour and perceived gaming experience in real-time can be crucial not only to assess game usability, but to also adjust the game play and content in real-time to maximize the experience per user. For this purpose, affective and physiological monitoring tools (e.g., wearables) have been used to monitor human influential factors (HIFs) related to quality of experience (QoE). Representative factors may include the gamer’s level of engagement, stress, as well as sense of presence and immersion, to name a few. However, one of the major challenges the community faces today is being able to accurately transfer the results obtained in controlled laboratory settings to uncontrolled everyday settings, such as the gamer’s home. In this paper, we describe an instrumented virtual reality (VR) headset, which directly embeds a number of dry ExG sensors (electroencephalography, EEG; electrocardiography, ECG; and electrooculography, EOG) to allow for gamer behaviour assessment in real-time. A protocol was developed to deliver kits (including the instrumented headset and controllers, laptop with the VR game Half-life Alyx, and a second laptop for data acquisition) to participants’ homes during the COVID-19 lockdown. A brief videoconference session was made to provide the participants with instructions, but otherwise the experiment proceeded with minimal experimenter intervention. Eight participants consented to participate and each played the game for roughly 1.5 h. After each gaming session, participants reported their overall experience with an online questionnaire covering aspects of emotions, engagement, immersion, sense of presence, motion sickness, flow, skill, technology adoption, judgement and usability. Here, we describe our obtained findings, as well as report correlations between the subjective ratings and several QoE-related HIFs measured directly from the instrumented headset. Promising results are reported.
1 Introduction
Recent reports have shown that the virtual reality (VR) sector grew nearly 30% since January 2021, suggesting that the sector growth was not affected by the worldwide COVID-19 pandemic1. The Meta (formerly Oculus) Quest 2 portable VR headset, for example, now accounts for nearly half of the headsets used on the Steam VR platform2. The total number of monthly connected VR headsets has increased by 29.5% since January 2021. Gaming, however, is just one of the possible domains in which VR is expected to make an impact. Applications in rehabilitation, education, training, and exercise are also emerging (Arndt et al., 2018; Radianti et al., 2020). Ultimately, the success of immersive applications are known to rely on the user experience they provide and not necessarily on the technology they use (Apostolopoulos et al., 2012). As virtual reality and the metaverse are projected to burgeon in the coming years, being able to objectively quantify user experience in immersive settings is crucial. To this end, automated measurement of human influential factors (HIFs), such as sense of presence/immersion, attention, stress, engagement, and fun factors, has become an extremely important factor (Perkis et al., 2020).
Traditionally, subjective methods have been utilized, which rely on post-experience questionnaires, such as the Presence Questionnaire to evaluate the sense of presence (Witmer and Singer, 1998). Subjective tests, however, can be highly biased, lack temporal resolution, and are performed after the immersive application is finished, thus rely on gamer memory to recall events. Monitoring HIFs in real-time, in turn, requires objective methods and physiological signals have proven to be particularly effective (Moinnereau et al., 2022a). For instance, stress and engagement levels, emotions, sense of presence and immersion, and overall experience have been monitored from electroencephalograms (EEG), electrocardiograms (ECG), and electrooculograms (EOG) (Dehais et al., 2018). As psychophysiological signals are known to be sensitive to movement artifacts, studies have been typically conducted in controlled laboratory settings with significant experimenter intervention to ensure high quality signal recordings. Findings from these studies, however, may not transfer to everyday settings, such as gamers’ homes, thus may have limited practical use. Additionally, the recent COVID-19 pandemic and its worldwide lockdowns along with social distancing directives have made measuring gamer experience in controlled settings extremely challenging. As such, alternative solutions to enable “in the wild” experiments are still drastically needed.
To overcome this issue, here we describe a system and protocol to collect multimodal physiological signals from a “plug-and-play” instrumented VR head-mounted display (henceforth termed iHMD) (Cassani et al., 2020) that was delivered to participants’ homes together with a gaming laptop and a biosignal data streaming laptop. The headset was equipped with 16 ExG biosensors, including EEG, ECG, and EOG. A portable, wireless bioamplifier was used to collect, stream, and store the signals in real-time. An in-house developed signal quality and analysis software was integrated into the iHMD to ensure high-quality signals were collected. Proper device cleaning and sanitation, as well as hardware quarantining were performed to minimize the spread of COVID-19, following protocols in place at the authors’ institution. We build on the work of Moinnereau et al. (2022b) and propose the extraction of several HIF-related measures from the ExG signals and correlate them to experience ratings reported by the gamers. Overall, with this study we aim to answer two main research questions (RQs): 1) Can the proposed iHMD be used in highly ecological settings with minimal experimenter intervention? and 2) Can the measured physiological signals be used as correlates of gamer HIFs?
The remainder of this paper is organized as follows: Section 2 provides a background on subjective and objective HIFs and gamer behaviour assessment. Section 3 covers the experimental procedures and the biosignal feature extraction pipelines. Sections 4, 5, in turn, present the experimental results and then discusses them in light of existing works, respectively. Finally, Section 6 presents the conclusions.
2 Background
As mentioned previously, the success or failure in the development of new immersive applications lies in the user experience it provides and not on the technology it relies on. User quality of experience (QoE) refers to the “degree of delight or annoyance of applications or services resulting from the fulfillment of his or her expectations with respect to the utility and/or enjoyment of the application or service in the light of the users personality and current state” (Perkis et al., 2020). In fact, QoE is driven by three influential factors: technological, contextual and human. With immersive content, human influential factors (HIFs) play an important role as a user’s level of engagement, flow, and sense of presence and immersion can be driven by their affective states, preferences, and behaviour (Perkis et al., 2020). Therefore, it has become crucial to develop reliable models of immersive media QoE. While technological and contextual factors have been explored in the past (Wang et al., 2017; Metzger et al., 2018; Sousa et al., 2020; Kougioumtzidis et al., 2022), HIFs have been less explored, as highlighted by Moinnereau et al. (2022a).
When it comes to immersive media and content, HIFs can include factors such as sense of presence, immersion, attention, stress, engagement, as well as cybersickness. In most cases, subjective methods have been used for post-experience assessment with questionnaires being presented either on paper or directly into the virtual environment (Regal et al., 2018). Subjective assessments based on standardized questionnaires are important as they provide insights into specific dimensions and characteristics of the immersive experience with high validity. On the other hand, subjective methods can be intrusive, especially if multiple queries are done throughout a session to gather temporal insights about the experience. These interruptions can increase cognitive load, disrupt immersion, and negatively affect the experience (Chung and Gardner, 2012).
In turn, the use of physiological monitoring methods provide a real-time glimpse into the user’s mental, affective, and behavioural states with minimal impact on the experience itself. Neurophysiological indicators of user experience (in real world settings) can comprise several neurobiological processes typically associated with motor, sensory, cognitive and emotional events. Their existence when immersed in virtual reality could be indicators of sense of presence and immersion. Moreover, physiological signals can also provide an objective measure of the emotional state of the user during the interaction in the virtual environment (Crowley et al., 2010), their stress levels (Martinez Rodrigo et al., 2018), engagement (Dehais et al., 2018), affective states (Clerico et al., 2018), sense of presence (Weech et al., 2019), immersion (Burns and Fairclough, 2014), and overall experience (Egan et al., 2016), to name a few factors. Some of the physiological signals that have been shown useful in QoE assessment include the ECG and measured heart rate (HR) or heart rate variability (HRV) (Kim et al., 2018), electrodermal activity (EDA) or galvanic skin response (GSR) (Patrão et al., 2016), and cerebral blood flow measured via near-infrared spectroscopy (NIRS) (Laghari et al., 2013). Automated quality measurement of these signals is crucial for the development of remote gamer monitoring systems (Falk et al., 2014; Gautam et al., 2018).
Recent advances in dry/wireless electrodes (Wiederhold et al., 2003; Kam et al., 2018; Lee et al., 2018) and motion artifact suppression (Rosanne et al., 2019; dos Santos, 2020; Arad et al., 2018) further increase the practicality of integrating physiological signals, especially EEG and EOG, directly into the VR headset. In fact, device design in terms of portability, usability, and ergonomic aspects directly impact the user experience, such as tethered versus fully mobile, or plug-and-play versus systems requiring gel (Kharoub et al., 2019; Kim et al., 2019). As immersive experiences require the user to be ambulant, new signal enhancement and/or artifact-robust feature extraction (Rosanne et al., 2019; Tiwari et al., 2019) methods are needed. To enable gamer assessment outside controlled conditions, a quick plug-and-play solution comprised of dry ExG electrodes coupled with multimodal enhancement and artifact-robust feature extraction algorithms is needed. This is the aim of the present study and the developed instrumented headset.
3 Materials and methods
In this section, we detail the experimental protocol followed, including remote data collection, signal pre-processing, analysis and the measurement of HIF metrics.
3.1 Instrumented VR headset
We have recently described how to build a portable and wireless VR headset that integrates several high-quality physiological sensors on any off-the-shelf head-mounted display (HMD) (Cassani et al., 2020). Here, we integrated sensors on an HTC VIVE Pro Eye VR headset, a PC-powered VR headset, released in 2019, with 98° field-of-view, 1440 × 1600 per eye resolution, 90 Hz refresh rate, and 6 degrees-of-freedom tracking. The HMD offers increased visual resolution and spatial sound to enhance the immersion and improve the gameplay experience. An OpenBCI bioamplifier, including the Cyton and Daisy boards (Open BCI, United States), was used to record sixteen fully-differential input channels to record EEG, EOG, and ECG signals. To power the OpenBCI boards, we used a 1000 mA @ 3.7 V Lithium polymer battery; the capacity of the battery was calculated to last 12 h. We propose to acquire 11 EEG signals located in three areas: frontal (Fp1, Fpz and Fp2), central (F3, F4, FCz, C3 and C4), and occipital (O1, Oz and O2), as shown in Figure 1. The EOG signals were derived from the EEG electrodes on the frontal area, as well as two vertical and two horizontal electrodes (H EOG right, H EOG left, V EOG right, and V EOG left), all embedded directly into the foam of the VR headset, as shown in Figure 1 (left).
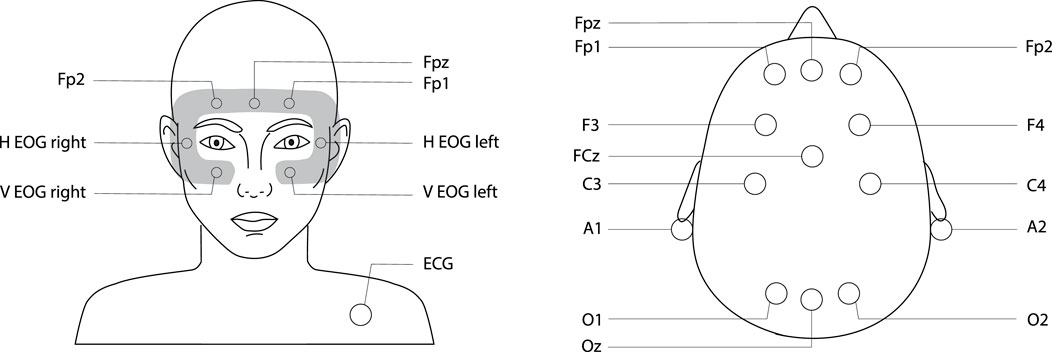
FIGURE 1. Locations of the 16-ExG electrodes placed directly onto a VR headset. Left figure shows sensors placed on the faceplate of the headset and right figure those placed on the headset straps. Placement of electrodes follow the 10-10 international system (Sharbrough et al., 1991). EEG electrodes notation: Fp, Frontopolar; Fpz, Midline Frontopolar; F, Frontal; FCz, Midline Frontocentral; C, Central; O, Occipital; OZ, Midline Occipital.
Three different types of electrodes were used: flexible, flat, and disposable, depending on their location in the iHMD. Ag/AgCl dry electrodes (CGX Systems, United States) were used for EEG measurement in locations with the presence of hair. Flat Ag/AgCl dry electrodes (Thought Technology Ltd., Canada) were used in places where contact with the bare skin is needed (i.e., around the face-piece to record EOG, and frontal EEG). Lastly, one disposable electrode (Thought Technology Ltd., Canada) was placed on the user’s collarbone for ECG recording. The collarbone electrode has been shown to acquire reliable ECG signals without adding discomfort to the user, relative to chest-placed electrodes. All signals were acquired at a sampling rate of 125 Hz. Lastly, two earclip electrodes were used as references on each lobe. Data was streamed wirelessly using the standalone OpenBCI graphical user interface (GUI) to a nearby laptop.
3.2 Experimental procedure
The entire experimental procedure is detailed in Figure 2, where solid rectangles correspond to experimenter tasks and dashed rectangles to participant tasks. Eight participants consented to take part in this experiment (five male and three female, 28.9 ± 2.9 years of age) that received Ethics approval by the INRS Ethics Committee. Participants consisted of consenting adults with normal hearing, normal or corrected-to-normal vision, and without any known issues with virtual reality, such as severe cybersickness. Participants had no previous experience with playing the game Half-Life: Alyx. As can be seen, first a box was placed in front of the participant’s home at a mutually-agreed time including two laptops, two controllers, two base stations, and the iHMD (see items displayed in Figure 3). The MSI GT62VR 6RE Dominator Pro laptop was used to display the VR content and an ASUS k550 was used to record the streamed biosignal data. Next, gameplay and real-time signal quality monitoring were achieved through the “Teamviewer” platform and a dedicated videoconference session via in-house developed quality monitoring tools. Moreover, instructions on how to set up the gaming environment, how to wear the iHMD, as well as how to play the game (Half-life: Alyx) were given via a videoconference call.
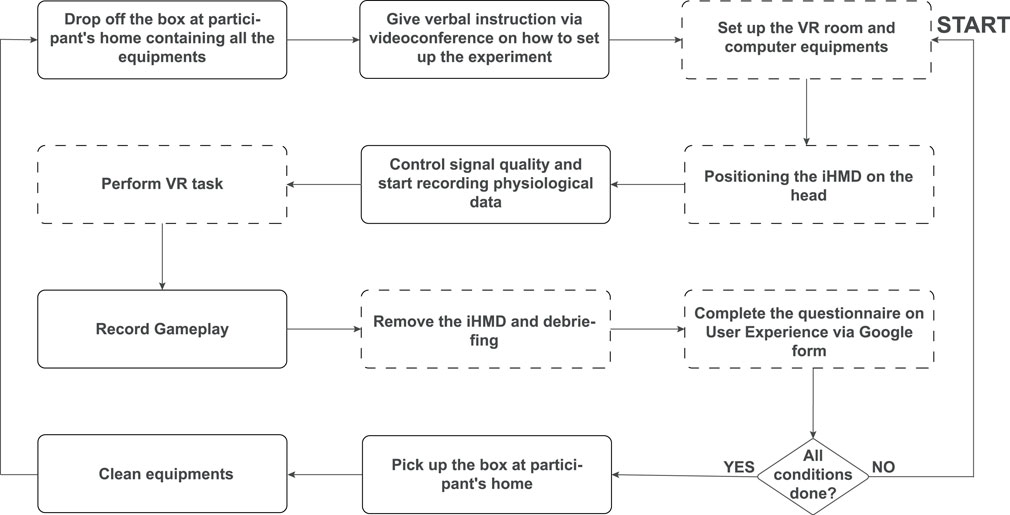
FIGURE 2. Flowchart of the experimental procedure. The solid rectangles correspond to the experimenter tasks and the dashed rectangles to participant tasks.
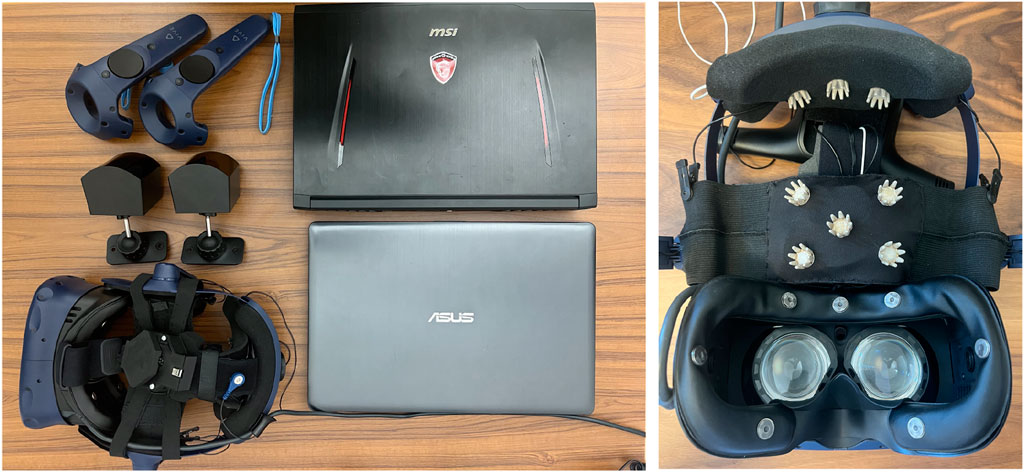
FIGURE 3. On the left: entire equipment drop off at participant’s home including two laptops, base stations, controllers and the iHMD; on the right: 16 ExG sensor-equipped VR headset.
For proper tracking of the iHMD and controllers, participants had to mount the base stations diagonally at opposite corners of their gaming room. Each base station has a 150-degree horizontal field of view and a 110-degree vertical field of view. Half-Life: Alyx is one of the most immersive VR first-person shooter games developed by Valve where players are immersed into deep environmental interactions, puzzle solving, world exploration, and visceral combat. In the experiment, participants went through two conditions, which we term 1) baseline and 2) exploration/fight. The baseline corresponds to the first two chapters of the game (about 30 min of gameplay) where the player discovers the game storyline, learns how to navigate by flicking the analog stick and how to manipulate physical objects throughout the world using the “gravity gloves,” including realistically reloading weapons.
After concluding the two chapters, participants filled an online unified user experience questionnaire (more details in the next Section). Next, participants would continue with subsequent chapters of the game, which we term “exploration/fight” as the player is confronted with puzzle solving and fighting challenge phases to advance through the game (about 1 h of gameplay). The top-right plot of Figure 4 shows a representative exploration/fight scene where the player must confront soldiers and defeat them. The player can hide behind surrounding structures, if possible, to avoid getting shot at and attack once the soldiers reload. At the end of this second session, participants filled again the unified user experience questionnaire. Participants were free to play the baseline and exploration/fight conditions at different times of the day or even different days to minimize visual fatigue and maintain spatial awareness of the room around them.
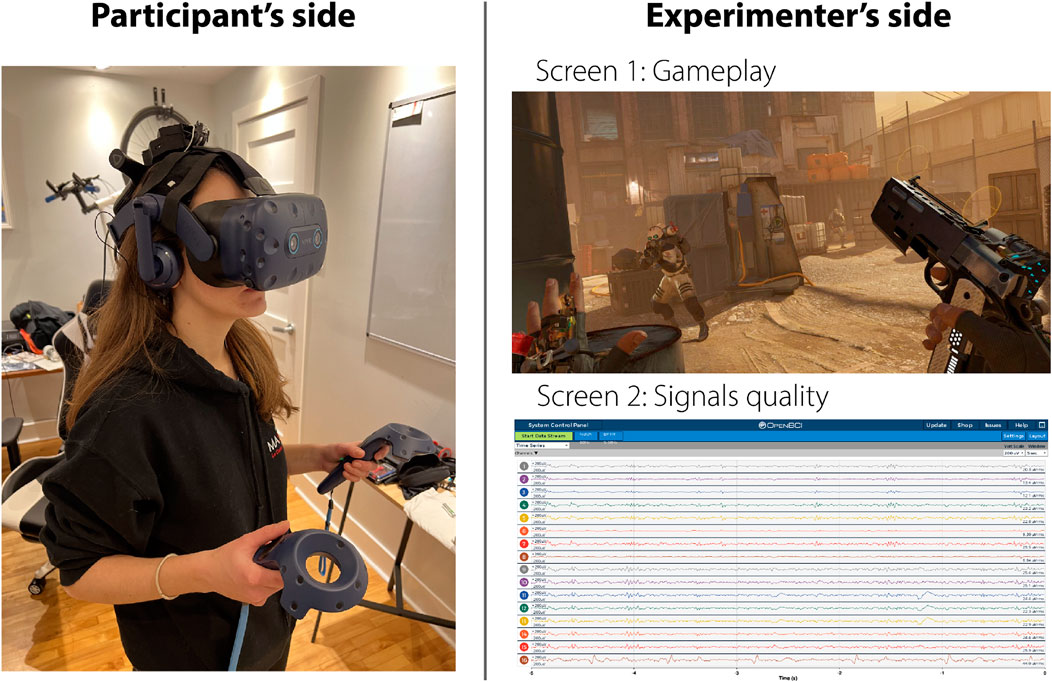
FIGURE 4. Representative view of one session of the experiment from the perspective of the participant (left) and the experimenter (right).
Figure 4 shows a representative view of the experiment conducted from the participant’s (left) and the experimenter’s (right) perspectives. Lastly, once the two sessions were completed, participants were asked to put all the hardware back inside the box. Once the box was collected by the experimenter, the cleaning and disinfecting phase would start. Proper device cleaning and sanitation was performed to minimize the spread of COVID-19, following protocols in place at the authors’ institution. All VR equipment, the iHMD electrodes, and the two laptops were thoroughly disinfected with alcoholic wipes. The iHMD was disinfected using a Cleanbox UV-C chamber built specially for VR headsets (Cleanbox Technology, United States). Upon sanitation, the iHMD stayed in quarantine in the chamber for 24 h and outside the chamber for another 24 h. After 48 h of quarantine, all the material was ready to be boxed up again and delivered to the next participant. No cases of COVID-19 were reported during this study.
3.3 Subjective user experience assessment
In order to measure the impact of immersive media related HIFs on gamer’s user experience, we utilized the unified questionnaire proposed by Tcha-Tokey et al. (2016). The questionnaire combines 87 different items, compiled from 10 different scales measuring the gamer’s sense of presence, engagement, immersion, flow, usability, skill, emotion, cybersickness, judgement, and technology adoption, as well as three open-ended questions aimed at gathering candid gamer feedback about their experiences. Scale construction was based on nine other existing questionnaires. The 87 items used a 10-point Likert scale with the lower value indicating a “strongly disagree” response.
3.4 Pre-processing and biosignal feature extraction
3.4.1 Signal pre-processing
Signal pre-processing was performed using MATLAB; the EEGLab toolbox (Delorme and Makeig, 2004) was used for EEG analysis. In particular, EEG signals were first band-pass filtered between 0.5 and 45 Hz and then zero-mean normalized. To remove motion artifacts the artifact subspace reconstruction (ASR) method was applied. ASR is an online, component-based method to effectively remove transient or large-amplitude artifacts. The technique is capable of running in real-time and uses statistical anomaly detection to separate artifacts from EEG signals in multichannel data sets. It assumes that non-brain signals introduce a large amount of variance to the data set and can be detected via statistics. ASR decomposes short segments of EEG data and contrasts them to calibration data. Figure 5 depicts a 140 s signal excerpt recorded from Fp1 with different types of artifacts, including horizontal and vertical head motions, eye blinks and the eye movements. As can be seen, the ASR algorithm is able to remove such artifacts for posterior EEG feature extraction.
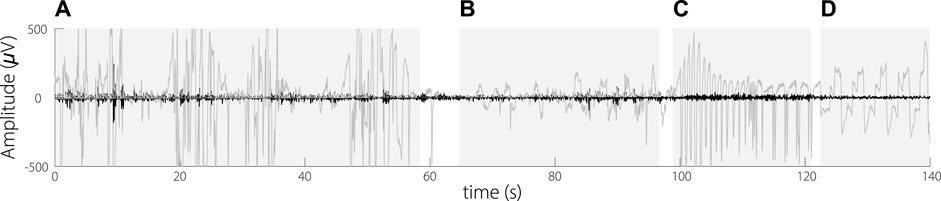
FIGURE 5. ASR applied on signal from Fp1 channel. Raw signal (grey) and enhanced signal (black). Artifacts (A) horizontal head motions; (B) vertical head motions; (C) Eye blinks; (D) Eye gaze.
3.4.2 EEG features
As we are interested in measuring user experience, several EEG metrics described and widely used in the literature were tested, namely: the engagement score (ES), arousal and valence indixes (AI and VI), and frontal alpha asymmetry (FAA). Moreover, different EEG sub band frequency powers were measured per EEG electrode and their ratios computed: delta (δ; 0.5–4 Hz), theta (θ; 4–8 Hz), alpha (α; 8–12 Hz), beta (β; 12–30 Hz), and gamma (γ; 30–44 Hz). In the past, several studies have linked spectral powers to HIFs; for example, a link between VR video quality and alpha power was shown in the occipital and parietal regions (Zheleva et al., 2020), between immersion and θ/α and concentration and β/θ (Lim et al., 2019), stress regulation and δ/β (Poppelaars et al., 2021), as well as sense of presence and θ/β (Zhang et al., 2021).
3.4.2.1 Engagement score
The EEG signals were segmented into 2-s windows with 50% overlap using a Hamming window and transformed to the frequency domain via a fast Fourier transform, then magnitude squared, and averaged in order to obtain the power spectral density from which the absolute spectral power was estimated in theta, alpha, and beta bands. Relative powers were calculated by summing absolute power across the three bands to compute the total power, and then dividing the absolute power for each individual band by the total power, expressed as a percentage. Finally, the engagement score (ES) was computed as per Pope et al. (1995):
3.4.2.2 Arousal and valence indexes
To measure the emotional state of the gamer, we use the arousal (AI) and valence indexes (VI) proposed by McMahan et al. (2015):
Valence corresponds to the level of pleasantness, whereas arousal measures how calming/exciting the stimulus is. Moreover, engagement and arousal indexes have been shown to also correlate with perceived immersion levels (McMahan et al., 2015), thus could provide useful cues for user experience measurement.
3.4.2.3 Frontal alpha asymmetry (FAA) index
FAA can be used as an additional measure of pleasantness. FAA is expressed as the alpha band power difference between right and left frontal regions, and can be computed by:
where ln corresponds to the natural log. A positive FAA index reflects greater left-sided frontal activity (alpha power has an inverse relationship with cortical activity) and may serve as an index of approach motivation or related emotion (e.g., anger and joy), whereas negative values indicate greater right-sided activity and may serve as an index of withdrawal motivation or related emotion, such as disgust, fear, and sadness (Fischer et al., 2018).
3.4.3 EOG features
The frequency range of EOG signal is 0.1–50 Hz and the amplitude lies between 100 and 3500 μV (López et al., 2017). From the EOG signals, we extracted eye blink and saccade rate measures using the EOG event recognizer toolbox (Toivanen et al., 2015). Eye blinks have been used to predict cybersickness (Dennison et al., 2016) and saccades could be indicative of user frustration (Bitkina et al., 2021) and sense of presence in immersive virtual environment (Ju et al., 2019). Saccades correspond to rapid and simultaneous movements of both eyes while fixing in the same direction. EOG signals (Fp1, Fp2, Fpz, H EOG right, H EOG left, V EOG right, and V EOG left) were therefore band-pass filtered in this frequency range and then zero-mean normalized. The ASR algorithm was also applied to remove head motion-related artifacts while keeping the eye blinks and eye movements intact. The blinks and saccades measurement algorithm relies on a probabilistic method that requires a short period of unsupervised training before the actual measurements. For this, the first 60 s of each session for each participant were used. The parameters of the Gaussian likelihoods were learned using an expectation maximization algorithm following the work of Toivanen et al. (2015).
3.4.4 ECG features
For ECG signal processing, an open-source MATLAB toolbox was used to extract 15 features related to HR and HRV3. HRV analysis methods can be divided into time-domain, frequency-domain, as well as nonlinear methods. Time-domain parameters quantify the degree of variability in measurements of the time period between two successive heartbeats (interbeat interval, IBI, where ECG peaks are denoted by R’s or N’s if the beats are normal). We extracted from the time-domain the average IBI, the standard deviation of NN intervals (SDNN), the root mean square of successive RR interval differences (RMSSD), the number of pairs of successive RR intervals that differ by more than 50 ms and its percentage (NN50, and pNN50 respectively). Next, frequency-domain analysis relies on the power spectral density of the RR time series. We extracted the relative power of the low-frequency (LF) band (0.04–0.15 Hz), and high-frequency (HF) band (0.15–0.4 Hz), their percentages, the ratio of LF to HF, as well as the total power that corresponds to the sum of the four spectral bands, LF, HF, the absolute power of the ultra-low-frequency (ULF) band (≤0.0003 Hz) and the absolute power of the very-low-frequency (VLF) band (0.0033–0.04 Hz). Finally, nonlinear measurements quantify the unpredictability of a time series. Pointcare plot standard deviation perpendicular the line of identity (SD1), and along the line of identity (SD2) were extracted. These traditional HRV based measures have been used to assess user experience, specially when experiencing emotional or physical stress, where an increase in HR can be observed (Murphy and Higgins, 2019; Pallavicini et al., 2019). Moreover, changes in HR and HRV have been reported with varying game difficulty levels (Muñoz et al., 2020).
3.5 Statistical tests
First, to validate the experimental protocol, we compare the baseline and exploration/fight conditions using a t-test on each question of the 10 scales of the subjective questionnaire with a significance level of 95%. Next, to help answer RQ1, a t-test is conducted on each physiological metric (significance level of 95%) over the two conditions. The degree of freedom of the test, the estimated population standard deviation, and confidence intervals are reported. Lastly, to help answer RQ2, we use Pearson correlation between the measured physiological signals and the subjective ratings to explore which metrics best correlate with each HIF.
4 Experimental results
Table 1 reports the 21 subjective questions, out of the 87 available, that showed a significant difference between the baseline and exploration conditions across all subjects. As can be seen, eight of the 10 different scales showed a significant difference, with only “usability” and “technology adoption” scales not showing any significant difference. In general, the exploration/fight scenes showed increased sense of presence, flow, immersion, and emotions, but somewhat higher cybersickness symptoms. These results help answer RQ1.
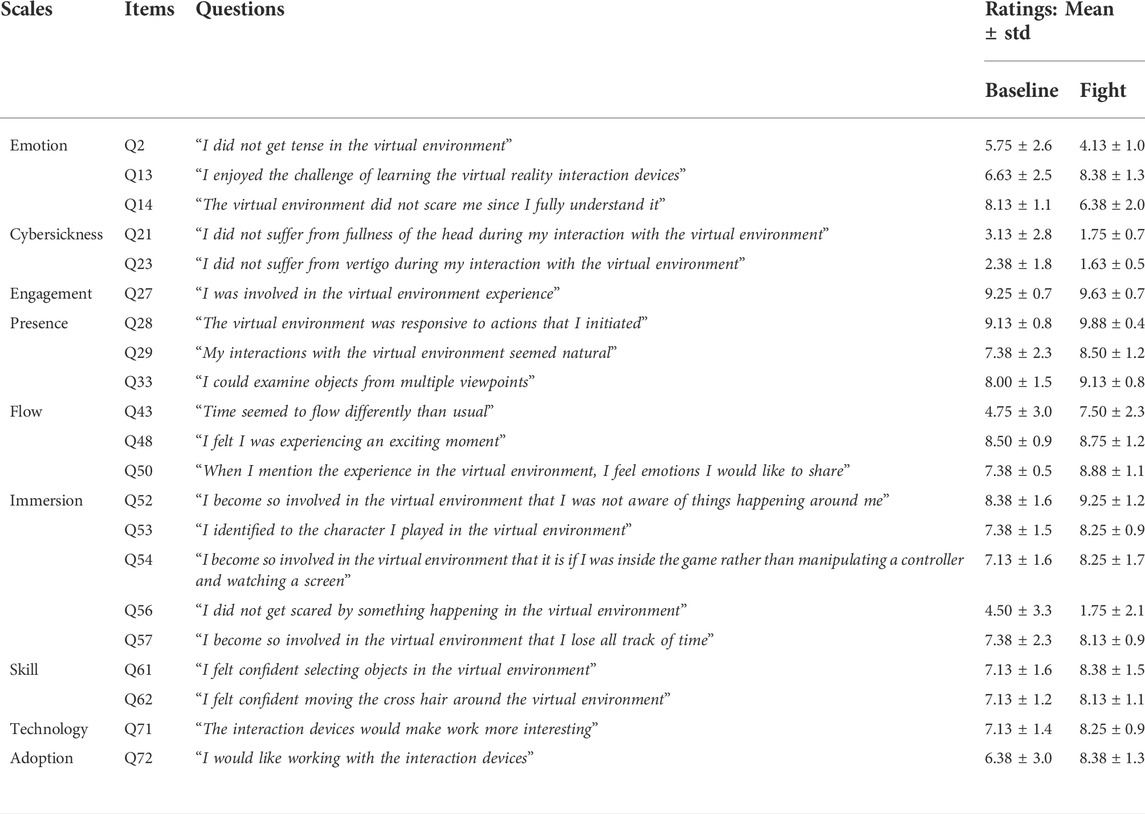
TABLE 1. Summary of the 21 scales that showed significant differences between baseline and exploration/fight conditions across all subjects.
Next, we explore the changes seen in the measured physiological signals between the two conditions. Table 2 shows the difference between the average metric in the exploration/fight condition to the average metric over baseline condition, represented by a Δ symbol, for each of the eight subjects, as well as the average across subjects. As can be seen, there is an increase in HR of approximately 12 beats per minute in the fighting condition, as well as an increase of 23 saccades per minute. To test the significance of these changes, Table 3 further presents the results of the statistical test. As can be seen, heart rate showed a significant difference whereas the changes in saccades were mildly significant.
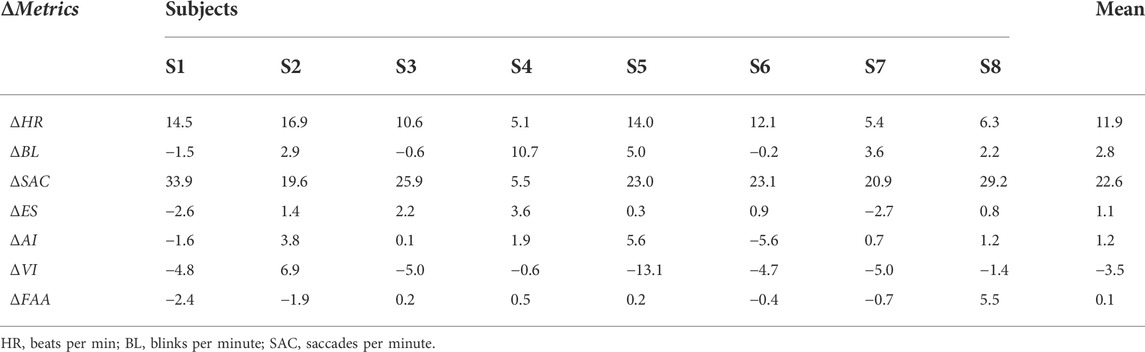
TABLE 2. Difference between the average metrics in the exploration/fight condition to the average metrics over the baseline condition for each subject and averaged over all subjects.
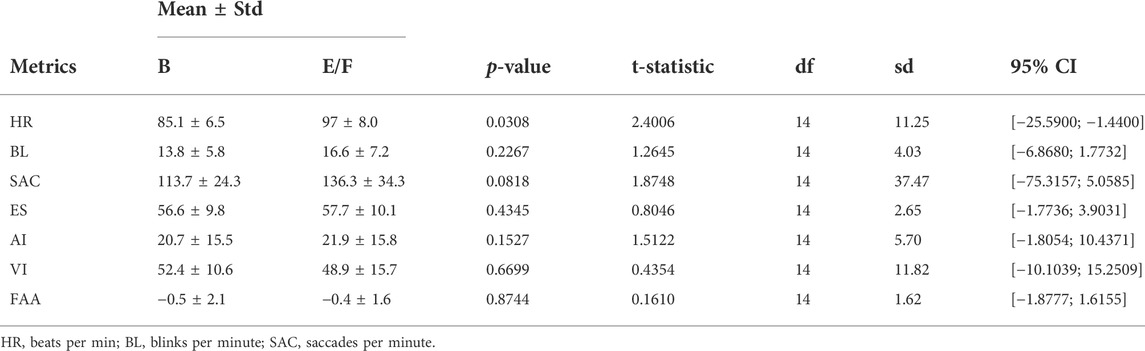
TABLE 3. Statistics of the difference between conditions for each computed metric averaged across all subjects.
In order to study the temporal evolution of each physiological metric, Figure 6 depicts the averages of the metrics presented as a function of time across all participants during baseline and exploration/fight conditions (black and grey curves, respectively). As can be seen, heart rate remained consistently higher in the fight condition, as expected, as this is a more stressful condition. The saccades per minute metric was also consistently higher in the exploration condition. This is also expected as the gamer is trying to escape from being shot, thus needs to survey the scene more intensely. The “humps” seen in the SAC plots are likely indicative of the brief period when the gamers moved to subsequent chapters. The engagement index, in turn, decreased with time in the baseline condition, likely indicating that gamers became bored after roughly 15 min. In the fighting condition, on the other hand, engagement levels remained consistent throughout the experience. The arousal index suggests that towards the end of each session arousal levels decreased in both conditions. With such temporal information available, thresholds could be set such that adaptive games could be developed (e.g., if ES drops below a certain value, increase the number of attacks or puzzles that need to be solved).
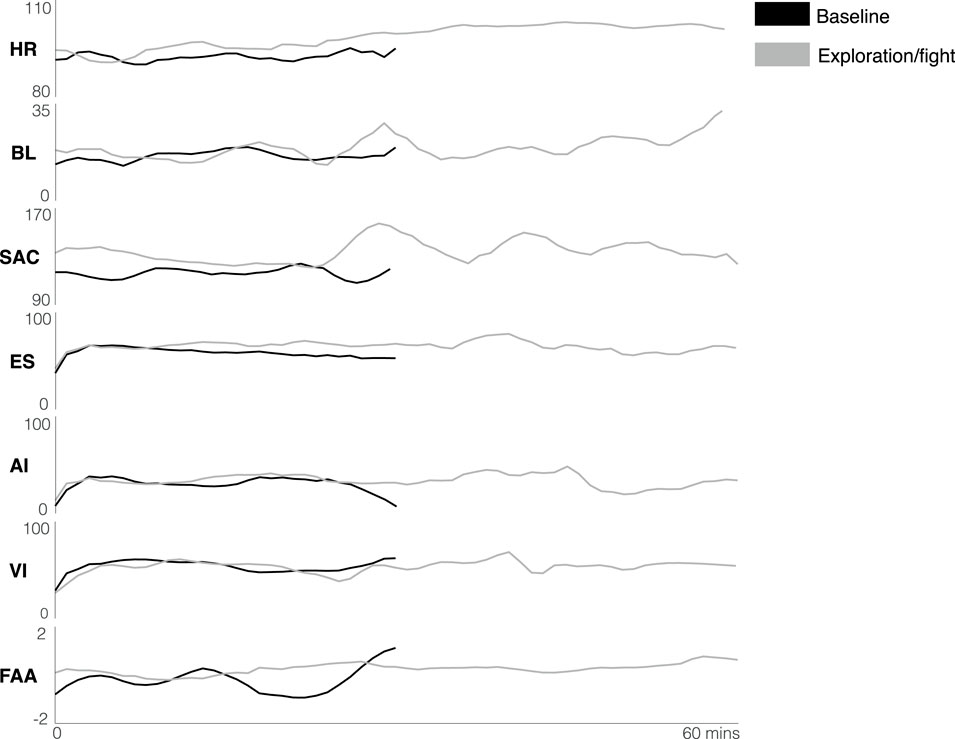
FIGURE 6. Instrumental measures over time in baseline (black) and exploration/fight (grey) conditions for all participants.
Lastly, Figure 7 shows the Pearson correlations achieved between all physiological measures and the 21 subjective scales from Table 1 with values concatenated for both conditions. The correlations are colour-coded based on the strength of the correlations, ranging from strong (e.g., greater than 0.7), to moderate (between 0.3 and 0.7) to low (below 0.3). As can be seen, several HR and HRV measures showed strong correlations with several scales, in particular for flow and immersion. EEG alpha and beta band features showed strong correlation with emotional states and moderate correlatuions with several other scales; same was true for the delta band features. The engagement score showed moderate correlation with engagement ratings and EOG based measures showed moderate correlations with emotion and cybersickness ratings. Overall, almost all HIFs showed moderate to strong correlations with at least one physiological signal, thus helping answer RQ2.
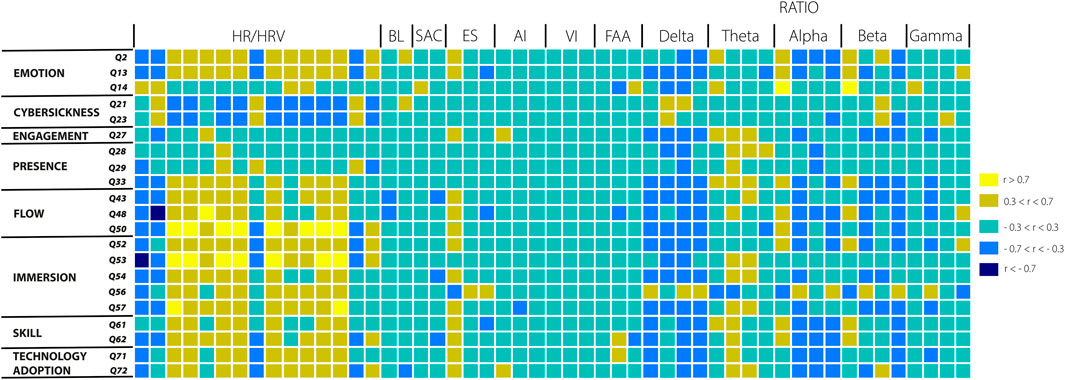
FIGURE 7. List of metrics that showed correlation with each subjective rating.
5 Discussion
5.1 Answering RQ#1: Can the proposed iHMD be used in highly ecological settings with minimal experimenter intervention?
Results reported herein suggest that, yes, the iHMD can be used reliably in gamer homes with minimal experimenter intervention. The changes seen not only in the subjective ratings reported across experimental conditions, but also with the physiological signal measures (in both time-averaged and real-time changes) suggest that the headset can be correctly deployed and interfaced with commercial games and used by the average gamer at the comfort of their own homes. The subsections to follow discuss the reported subjective measures and computed physiological metrics in more detail.
5.1.1 Capturing (expected) subjective insights
As can be seen in Table 1, the scales emotion, cybersickness, engagement, presence, immersion, skill, and technology adoption showed significant differences between the two conditions. For each question, except Q2 (emotion), Q21 and Q23 (cybersickness), and Q56 (immersion), the average scores were higher in the exploration/fight condition relative to the baseline. Note, however, that these four questions were asked in a negative manner; for example, Q56 mentioned “I did not get scared by something happening in the virtual environment.” As such, a lower value indicates that the gamers were more scared in the exploration/fight condition.
In fact, since this condition includes fight and puzzle solving challenges, the exploration/fight condition is likely to induce higher stress and concentration levels for the gamer, thus increasing such states. Increases in their perception of skill, for example, could also be due to the fact that the exploration/fight condition came second, thus the gamers had obtained some experience in navigating and interacting with the objects. Moreover, as the fight conditions were more challenging, participants also reported becoming more involved, excited, and engaged during this phase, hence explaining the increases in emotion, engagement, presence, flow, and immersion subscales. However, in most cases, participants complained of visual fatigue after 15–20 min of playing. Only one participant reported cybersickness with a little nausea when using VR for a while. After 50 min of play, some participants experienced physical and mental fatigue, thus explaining the lower ratings in the exploration/fight in cybersickness. The changes observed were expected (e.g., higher stress levels in the fight conditions) and indicate that the commercial game and iHMD were correctly deployed and gamers, who had no previous experience with Half-Life: Alyx, were able to successfully perform the experiment from the comfort of their own homes with minimal experimenter intervention.
5.1.2 Measuring aggregate physiological changes and insights
While the subjective changes reported above suggest that the gamers were able to correctly deploy the game from home, changes in the measured physiological signals will indicate if the iHMD was correctly placed and that the signal processing pipelines were accurate and ensured high-quality signals were collected with minimal experimenter intervention. To obtain an overall snapshot of the changes seen in the physiological measures, Table 2 shows that for ECG the ΔHR (in bpm) is positive for all participants, as well as an average values across all participants of 85.1 bpm and 97 bpm in baseline and exploration/fight conditions (according to Table 3), respectively. This is expected, as in the first condition, the gamers explore the virtual environment and are not facing any stressful scenes, while in the second condition, they are confronted to period of stress while fighting sequences.
Moroever, as can be seen from the metrics extracted from the EOG signals, the number of eye blinks/min (ΔBL), for six of the eight participants, as well as the number of saccades/min ΔSAC, for all participants, increased by 2.8 and 22.6, respectively, for the exploration/fight condition. Indeed, during the combat sequences, participants have to react very quickly and look in several directions, which explains the increase in the number of saccades/min. In addition, visual fatigue is known to increase the number of blinks/min (Kuwahara et al., 2022). Several participants reported visual fatigue. Since the exploration/fight condition lasted twice as long as the baseline condition, this could explain the increased number of blinks for many participants.
Next, we examine the EEG signals and note that for six of the eight participants a slightly higher positive ΔES during the exploration/combat condition could be seen, suggesting greater engagement. According to the valence and arousal results, all participants showed low values for the arousal index (with average of 20.7 and 21.9 on a 0–100 scale for the baseline and exploration/fight condition, respectively), and moderate values for the valence index (with average of 52.4 and 21.9 on a 0–100 scale for the baseline and exploration/fight condition, respectively), suggesting an overall positive emotion eliciting joy and happiness with a greater interest in the second condition. However, we observed similar effects as McMahan et al. (2015), where the valence index decreased during death events, except for participant S2. In fact, participants face death situations several times during the exploration/fight condition, hence explaining the decrease in valence index for several of the participants, as well as on average. Lastly, from the FAA metric, we can observe that most of the participants exhibited a negative ΔFAA, hence corroborating the increased levels of fear.
Lastly, from Table 3, HR showed to be significantly different between the two conditions across all subjects. Moreover, the t-statistic value indicates that the observed difference is more than twice the variability of the data, thus suggesting a potentially useful metric to objectively characterize gamer experience. Overall, these findings show that the collected physiological metrics followed expected behaviours, thus indicating that high-quality signals were indeed measured from the gamers homes and did not require lengthy preparation sessions in controlled laboratory settings.
5.1.3 Measuring real-time physiological changes and insights
While measuring aggregate measures of physiological signals can be useful and suggest the measurement of high-quality data, aggregate measures may not be as useful for real-time tracking of gamer behavior, which would ultimately be needed for adaptive gaming at home. To this end, real-time measurement and monitoring of physiological measures is needed, as enabled by the iHMD. As shown in Figure 6, HR increased over time, especially for the fight condition. In fact, movements related to interaction in the game, increased temperature and sweating, as well as higher stress levels in the fighting scenes are all factors that can lead to increases in heart rate over time. For the blinks, it can be observed that it increases with time for both conditions, but more substantially for the longer exploration condition. This corroborates the use of blink rate as a potential indicator of visual fatigue, which could be useful for QoE assessment.
For the engagement score, as mentioned above, the decrease over time for the baseline condition could be indicative of boredom, whereas in the fighting condition it remains fairly consistent. Indeed, in the exploration/fight condition, the player is constantly solicited, whether to fight or to solve puzzles. On the other hand, in the baseline condition not much happens and players could potentially become bored. We observe the same trends in the arousal index where in the baseline condition, the drops towards the end could be indicative of boredom. In the exploration/fight condition, on the other hand, this dropped happened only after after 45 min of gameplay. This drop in arousal could be indicative of fatigue, as this coincided with an increase in blink rate as well around the same time.
Combined, the temporal information available from multiple physiological signal modalities could be used to infer the gamer’s QoE levels in real-time. With simple thresholding or more complex machine learning models, real-time game adaptation could eventually be performed, thus maximizing QoE on a per-gamer basis. This capability was enabled with the proposed iHMD with minimal experimenter intervention. Overall, these combined insights help validate RQ#1 and show that an biosensor-instrumented headset, coupled with a signal processing pipeline, could be used in highly ecological settings with minimal experimenter intervention.
5.2 Answering RQ#2: Can the measured physiological signals be used as correlates of gamer HIFs?
Ultimately, we are interested in using physiological signals to extract measures that correlate with gamer experience HIFs in an objective manner. Here, Pearson correlation was used to help pin-point which of the explored objective metrics could be used as correlates of immersive gaming HIFs. From Figure 7, it can be seen that ECG and EEG signals generated features that showed the most moderate to strong correlations with the majority of the subjective ratings, thus indicating their importance for gamer experience assessment. More specifically, from the ECG signal, HR (in bpm) and several HRV measures, including SDNN, rmsRR, IBImean, LF, HF and total powers, pNN50, SD1 and SD2, showed a strong correlation with most of the subjective flow and immersion ratings. The ratios α/δ and β/δ also showed a strong correlation with the emotion rating. Similar to the studies presented in section 3.4.2 that linked spectral powers to HIFs, we observe a moderate correlation between immersion and θ/α, stress regulation and δ/β, as well as presence and θ/β. Moreover, ES showed moderate correlation with engagement, emotion, flow, immersion, skill and technology adoption ratings. Finally, eye blinks showed correlation with the cybersickness rating, further confirming its usefulness for visual fatigue monitoring. Overall, several metrics showed strong correlations across all tested human influential factors, thus corroborating the usefulness of the iHMD to extract correlates of gaming HIFs.
Taken together, the results obtained herein are promising as they 1) were achieved in highly uncontrolled “in-the-wild” scenarios, with minimal experimenter intervention, and 2) resulted in measured physiological measures that could be used for real-time gamer QoE assessment. None of the participants reported any difficulty in setting up the VR room and the instrumented headset. The fact that the system is wireless, portable, and that setup times, including automated data quality analysis, can take less than a minute, makes it ideal for at-home deployment. Ultimately, it is hoped that the work presented here will inspire researchers in various fields to replicate and use this technology to develop next-generation immersive applications.
5.3 Study limitations
Although the experimental results reported herein are promising, some study limitations exist. First, the results presented in this study were performed in the middle of the COVID-19 pandemic lockdown. As such, despite all the necessary sanitary measures put in place, recruitment of a large sample size was difficult. This was further exacerbated by the fact that hardware needed to remain in quarantine for several days between participants and that devices were left for 1–2 weeks at the participant’s homes. In the future, increasing the number of participants to ensure greater statistical power will be needed. Moreover, given the limited number of participants, developing instrumental QoE measures based on the obtained metrics also became challenging, thus future work should explore overall QoE prediction, thus ultimately leading to user experience optimization on a per-gamer basis.
6 Conclusions and future work
In this study, we presented a new protocol for collecting physiological data remotely for home-based VR studies with minimal experimenter intervention. By equipping a plug-and-play VR headset with a number of ExG sensors, combined with a strict sanitization protocol, we were able to collect data from eight participants remotely from their homes during periods of COVID-19 lockdowns. From the collected biosignals data, we extracted several metrics that were found to correlate with several HIFs, including emotional states, engagement, presence, immersion, skills, flow, and technology adoption. Future work will explore the extraction of other HIFs from facial gestures and other EOG measures (e.g., gaze speed/acceleration). Ultimately, the goal will be to use the measured HIF metrics to adjust the game in real time to maximize the user experience for each player.
Data availability statement
The raw data supporting the conclusions of this article will be made available by the authors, without undue reservation.
Ethics statement
The studies involving human participants were reviewed and approved by INRS Ethics Committee. The participants provided their written informed consent to participate in this study. Written informed consent was obtained from the individual(s), and minor(s)’ legal guardian/next of kin, for the publication of any potentially identifiable images or data included in this article.
Author contributions
All authors conceived and designed the study. M-AM conducted the experiments, analyzed the data, and wrote the paper. All authors contributed to the manuscript revisions. All authors approved the final version of the manuscript and agree to be held accountable for the content therein.
Funding
The authors acknowledge funding from the Natural Sciences and Engineering Research Council of Canada (RGPIN-2021-03246).
Conflict of interest
The authors declare that the research was conducted in the absence of any commercial or financial relationships that could be construed as a potential conflict of interest.
Publisher’s note
All claims expressed in this article are solely those of the authors and do not necessarily represent those of their affiliated organizations, or those of the publisher, the editors and the reviewers. Any product that may be evaluated in this article, or claim that may be made by its manufacturer, is not guaranteed or endorsed by the publisher.
Footnotes
1https://store.steampowered.com/hwsurvey/Steam-Hardware-Software-Survey-Welcome-to-Steam
2https://www.statista.com/statistics/265018/proportion-of-directx-versions-on-the-platform-steam/
3https://www.mathworks.com/matlabcentral/fileexchange/84692-ecg-class-for-heart-rate-variability-analysis
References
Apostolopoulos, J. G., Chou, P. A., Culbertson, B., Kalker, T., Trott, M. D., and Wee, S. (2012). The road to immersive communication. Proc. IEEE 100, 974–990. doi:10.1109/jproc.2011.2182069
Arad, E., Bartsch, R., Kantelhardt, J., and Plotnik, M. (2018). Performance-based approach for movement artifact removal from electroencephalographic data recorded during locomotion. PLoS ONE 13, e0197153. doi:10.1371/journal.pone.0197153
Arndt, S., Perkis, A., and Voigt-Antons, J.-N. (2018). “Using virtual reality and head-mounted displays to increase performance in rowing workouts,” in Proceedings of the 1st international workshop on multimedia content analysis in sports (New York, NY, USA: Association for Computing Machinery), 45
Bitkina, O., Park, J., and Kim, H. K. (2021). The ability of eye-tracking metrics to classify and predict the perceived driving workload. Int. J. Industrial Ergonomics 86, 103193. doi:10.1016/j.ergon.2021.103193
Burns, C., and Fairclough, S. (2014). Use of auditory event-related potentials to measure immersion during a computer game. Int. J. Hum. Comput. Stud. 73, 107–114. doi:10.1016/j.ijhcs.2014.09.002
dos Santos, E. M., Cassani, R., Falk, T. H., and Fraga, F. J. (2020). Improved motor imagery brain-computer interface performance via adaptive modulation filtering and two-stage classification. Biomed. Signal Process. Control 57, 101812. doi:10.1016/j.bspc.2019.101812
Cassani, R., Moinnereau, M.-A., Ivanescu, L., Rosanne, O., and Falk, T. H. (2020). Neural interface instrumented virtual reality headsets: Toward next-generation immersive applications. IEEE Syst. Man. Cybern. Mag. 6, 20–28. doi:10.1109/msmc.2019.2953627
Chung, J., and Gardner, H. (2012). Temporal presence variation in immersive computer games. Int. J. Human-Computer Interact. 28, 511–529. doi:10.1080/10447318.2011.627298
Clerico, A., Tiwari, A., Gupta, R., Jayaraman, S., and Falk, T. (2018). Electroencephalography amplitude modulation analysis for automated affective tagging of music video clips. Front. Comput. Neurosci. 11, 115. doi:10.3389/fncom.2017.00115
Crowley, K., Sliney, A., Pitt, I., and Murphy, D. (2010). “Evaluating a brain-computer interface to categorise human emotional response,” in Proceedings of the 2010 10th IEEE International Conference on Advanced Learning Technologies (ICALT ’10) (Washington, DC, United States: IEEE Computer Society), 276–278. doi:10.1109/ICALT.2010.81
Dehais, F., Dupres, A., Di Flumeri, G., Verdiere, K., Borghini, G., Babiloni, F., et al. (2018). Monitoring pilot’s cognitive fatigue with engagement features in simulated and actual flight conditions using an hybrid fNIRS-EEG passive BCI. In 2018 IEEE International Conference on Systems, Man, and Cybernetics (SMC). 544
Delorme, A., and Makeig, S. (2004). Eeglab: An open source toolbox for analysis of single-trial EEG dynamics including independent component analysis. J. Neurosci. methods 134, 9–21. doi:10.1016/j.jneumeth.2003.10.009
Dennison, M. S., Wisti, A. Z., and D’Zmura, M. (2016). Use of physiological signals to predict cybersickness). Displays 44, 42–52. Contains Special Issue Articles – Proceedings of the 4th Symposium on Liquid Crystal Photonics (SLCP 2015. doi:10.1016/j.displa.2016.07.002
Egan, D., Brennan, S., Barrett, J., Qiao, Y., Timmerer, C., and Murray, N. (2016). “An evaluation of heart rate and electrodermal activity as an objective QoE evaluation method for immersive virtual reality environments,” in 2016 Eighth International Conference on Quality of Multimedia Experience (QoMEX) (IEEE), 1–6.
Falk, T. H., Maier, M., et al. (2014). Ms-qi: A modulation spectrum-based ecg quality index for telehealth applications. IEEE Trans. Biomed. Eng. 63, 1613–1622. doi:10.1109/tbme.2014.2355135
Fischer, N. L., Peres, R., and Fiorani, M. (2018). Frontal alpha asymmetry and theta oscillations associated with information sharing intention. Front. Behav. Neurosci. 12, 166. doi:10.3389/fnbeh.2018.00166
Gautam, A., Simões-Capela, N., Schiavone, G., Acharyya, A., De Raedt, W., and Van Hoof, C. (2018). A data driven empirical iterative algorithm for GSR signal pre-processing in 2018 26th European Signal Processing Conference (EUSIPCO). Rome, Italy: IEEE, 1162–1166. doi:10.23919/EUSIPCO.2018.8553191
Ju, Y. S., Hwang, J. S., Kim, S. J., and Suk, H. J. (2019). “Study of eye gaze and presence effect in virtual reality,” in HCI international 2019-posters. Editor C. Stephanidis (Cham: Springer International Publishing), 446–449.
Kam, J., Griffin, S., Shen, A., Patel, S., Hinrichs, H., Heinze, H.-J., et al. (2018). Systematic comparison between a wireless EEG system with dry electrodes and a wired EEG system with wet electrodes. NeuroImage, 119–129. doi:10.1016/j.neuroimage.2018.09.012
Kharoub, H., Lataifeh, M., and Ahmed, N. (2019). 3d user interface design and usability for immersive vr. Appl. Sci. 9, 4861. doi:10.3390/app9224861
Kim, H. K., Park, J., Choi, Y., and Choe, M. (2018). Virtual reality sickness questionnaire (VRSQ): Motion sickness measurement index in a virtual reality environment. Appl. Ergon. 69, 66–73. doi:10.1016/j.apergo.2017.12.016
Kim, Y., Rhiu, I., Rhie, M., Choi, H., and Yun, M. (2019). “Current state of user experience evaluation in virtual reality: A systematic review from an ergonomic perspective,” in Proceedings of the Human Factors and Ergonomics Society Annual Meeting, 1274–1275. doi:10.1177/107118131963108063
Kougioumtzidis, G., Poulkov, V., Zaharis, Z. D., and Lazaridis, P. I. (2022). A survey on multimedia services qoe assessment and machine learning-based prediction. IEEE Access 10, 19507–19538. doi:10.1109/access.2022.3149592
Kuwahara, A., Nishikawa, K., Hirakawa, R., Kawano, H., and Nakatoh, Y. (2022). Eye fatigue estimation using blink detection based on eye aspect ratio mapping(earm). Cogn. Robot. 2, 50–59. doi:10.1016/j.cogr.2022.01.003
Laghari, K., Gupta, R., Arndt, S., Voigt-Antons, J.-N., Schleicher, R., Möller, S., et al. (2013). Neurophysiological experimental facility for quality of experience (QoE) assessment,” in 2013 IFIP/IEEE International Symposium on Integrated Network Management (IM 2013). 1300
Lee, H.-N., Shin, Y., Kumar, A., and Kim, M. (2018). Dry electrode-based fully isolated EEG/fNIRS hybrid brain-monitoring system. IEEE Trans. Biomed. Eng. 66, 1055–1068. doi:10.1109/tbme.2018.2866550
Lim, S., Yeo, M., and Yoon, G. (2019). Comparison between concentration and immersion based on EEG analysis. Sensors 19, 1669. doi:10.3390/s19071669
López, A., Ferrero, F., Yangüela, D., Álvarez, C., and Postolache, O. (2017). Development of a computer writing system based on eog. Sensors (Basel). 17 (7), 1505. doi:10.3390/s17071505
Martinez Rodrigo, A., Garcia, B., Alcaraz, R., González, P., and Fernández-Caballero, A. (2018). Multiscale entropy analysis for recognition of visually elicited negative stress from eeg recordings. Int. J. Neural Syst. 29 (02), 1850038. doi:10.1142/s0129065718500387
McMahan, T., Parberry, I., and Parsons, T. D. (2015). Evaluating player task engagement and arousal using electroencephalography,” in 6th International Conference on Applied Human Factors and Ergonomics (AHFE 2015) and the Affiliated Conferences, AHFE 2015, 3. Amsterdam, Netherlands: Procedia Manufacturing, 2303–2310. doi:10.1016/j.promfg.2015.07.376
Metzger, F., Hoßfeld, T., Skorin-Kapov, L., Liotou, E., Pocta, P., Melvin, H., et al. (2018). “Context monitoring for improved system performance and qoe,” in Autonomous control for a reliable internet of services: Methods, models, approaches, techniques, algorithms, and tools. Editors I. Ganchev, R. D. van der Mei, and H. van den Berg (Springer International Publishing).
Moinnereau, M.-A., Oliveira, A. de, and Falk, T. H. (2022a). A.Immersive media experiencea survey of existing methods and tools for human influential factors assessment. Qual. User Exp. 7 (1), 1–23. doi:10.1007/s41233-022-00052-1
Moinnereau, M.-A., Oliveira, Alves de, and Falk, T. H. (2022b). Measuring human influential factors during vr gaming at home: Towards optimized per-user gaming experiences
Muñoz, J. E., Quintero, L., Stephens, C. L., and Pope, A. T. (2020). A psychophysiological model of firearms training in police officers: A virtual reality experiment for biocybernetic adaptation. Front. Psychol. 11. doi:10.3389/fpsyg
Murphy, D., and Higgins, C. (2019). Secondary inputs for measuring user engagement in immersive vr education environments. ArXiv. abs/1910.01586.
Pallavicini, F., Pepe, A., and Minissi, M. E. (2019). Gaming in virtual reality: What changes in terms of usability, emotional response and sense of presence compared to non-immersive video games? Simul. Gaming, 1420. doi:10.1177/1046878119831420
Patrão, B., Pedro, S. L., and Menezes, P. (2016). Human emotions and physiological signals: A classroom experiment. Int. J. Onl. Eng. 12, 37–39. doi:10.3991/ijoe.v12i04.5098
Perkis, A., Timmerer, C., Baraković, S., Barakovic, J., Bech, S., et al. (2020). QUALINET white paper on definitions of immersive media experience (imex). ArXiv abs/2007.07032.
Pope, A. T., Bogart, E. H., and Bartolome, D. S. (1995). Biocybernetic system evaluates indices of operator engagement in automated taskEEG in basic and applied settings. Biol. Psychol. 40, 187–195. doi:10.1016/0301-0511(95)05116-3
Poppelaars, E., Klackl, J., Pletzer, B., and Jonas, E. (2021). Delta-beta cross-frequency coupling as an index of stress regulation during social-evaluative threat. Biol. Psychol. 160, 108043. doi:10.1016/j.biopsycho.2021.108043
Radianti, J., Majchrzak, T. A., Fromm, J., and Wohlgenannt, I. (2020). A systematic review of immersive virtual reality applications for higher education: Design elements, lessons learned, and research agenda. Comput. Educ. 147, 103778. doi:10.1016/j.compedu.2019.103778
Regal, G., Schatz, R., Schrammel, J., and Suette, S. (2018). A unity3D asset for integrating subjective assessment questionnaires in virtual environments in 2018 Tenth international conference on quality of multimedia experience (QoMEX) (IEEE), 1–3. doi:10.1109/QoMEX
Rosanne, O., Albuquerque, I., Gagnon, J., Tremblay, S., and Falk, T. H. (2019). “Performance comparison of automated eeg enhancement algorithms for mental workload assessment of ambulant users,” in 2019 9th International IEEE/EMBS Conference on Neural Engineering (NER). doi:10.1109/NER
Sharbrough, F., Chatrian, G., Lesser, R., Luders, H., Nuwer, M., and Picton, T. (1991). American electroencephalographic society guidelines for standard electrode position nomenclature. J. Clin. Neurophysiology 8, 200–202. doi:10.1097/00004691-199104000-00007
Sousa, I., Queluz, M. P., and Rodrigues, A. (2020). A survey on qoe-oriented wireless resources scheduling. J. Netw. Comput. Appl. 158, 102594. doi:10.1016/j.jnca.2020.102594
Tcha-Tokey, K., Christmann, O., Loup-Escande, E., and Richir, S. (2016). Proposition and validation of a questionnaire to measure the user experience in immersive virtual environments. Int. J. Virtual Real. 16, 33–48. doi:10.20870/ijvr.2016.16.1.2880
Tiwari, A., Albuquerque, I., Gagnon, J.-F., Lafond, D., Parent, M., Tremblay, S., et al. (2019). Mental workload assessment during physical activity using non-linear movement artefact robust electroencephalography features,” in 2019 IEEE International Conference on Systems, Man and Cybernetics (SMCc), 4149–4154.
Toivanen, M., Pettersson, K., and Lukander, K. (2015). A probabilistic real-time algorithm for detecting blinks, saccades, and fixations from EOG data. J. Eye Mov. Res 8 (2). doi:10.16910/jemr.8.2.1
Wang, Y., Li, P., Jiao, L., Su, Z., Cheng, N., Shen, X. S., et al. (2017). A data-driven architecture for personalized qoe management in 5g wireless networks. IEEE Wirel. Commun. 24, 102–110. doi:10.1109/mwc.2016.1500184wc
Weech, S., Kenny, S., and Barnett-Cowan, M. (2019). Presence and cybersickness in virtual reality are negatively related: A review. Front. Psychol. 10, 158. doi:10.3389/fpsyg.2019.00158
Wiederhold, B., Jang, D., Kaneda, M., Cabral, I., Lurie, Y., May, T., et al. (2003). Amsterdam, IOS Press An investigation into physiological responses in virtual environments: An objective measurement of presence. Towards CyberPsyhcology Mind, Cognitions Soc. Internet Age, 176–182.
Witmer, B. G., and Singer, M. J. (1998). Measuring presence in virtual environments: A presence questionnaire. Presence. (Camb). 7, 225–240. doi:10.1162/105474698565686
Zhang, S., Feng, X., and Shen, Y. (2021). Quantifying auditory presence using electroencephalography. Appl. Sci. 11, 10461. doi:10.3390/app112110461
Keywords: biosignals, virtual reality, remote experiment, games user research, human influential factors
Citation: Moinnereau M-A, Oliveira AA and Falk TH (2022) Instrumenting a virtual reality headset for at-home gamer experience monitoring and behavioural assessment. Front. Virtual Real. 3:971054. doi: 10.3389/frvir.2022.971054
Received: 16 June 2022; Accepted: 28 September 2022;
Published: 12 October 2022.
Edited by:
Jan-Niklas Voigt-Antons, Hamm-Lippstadt University of Applied Sciences, GermanyReviewed by:
Francesco Vona, Politecnico di Milano, ItalyMaurizio Vergari, Technical University of Berlin, Germany
Georg Regal, Austrian Institute of Technology (AIT), Austria
Copyright © 2022 Moinnereau, Oliveira and Falk. This is an open-access article distributed under the terms of the Creative Commons Attribution License (CC BY). The use, distribution or reproduction in other forums is permitted, provided the original author(s) and the copyright owner(s) are credited and that the original publication in this journal is cited, in accordance with accepted academic practice. No use, distribution or reproduction is permitted which does not comply with these terms.
*Correspondence: Marc-Antoine Moinnereau, bWFyYy1hbnRvaW5lLm1vaW5uZXJlYXVAaW5ycy5jYQ==