 Niels Hinricher
 Simon König1
 Chris Schröer
 Claus Backhaus
- 1Center for Ergonomics and Medical Engineering, FH Münster - University of Applied Sciences, Steinfurt, Germany
- 2Institute Department of Psychology and Ergonomics, Technische Universität, Berlin, Germany
User experience and user acceptance of a product are essential for the product’s success. Virtual reality (VR) technology has the potential to assess these parameters early in the development process. However, research is scarce on whether the evaluation of the user experience and user acceptance of prototypes in VR, as well as the simulation of the usage environment, lead to comparable results to reality. To investigate this, a digital twin of a blood pressure monitor (BPM) was created using VR. In a 2 × 2 factorial between-subjects design, 48 participants tested the real or VR BPM. The tests were performed either in a low-detail room at a desk or in a detailed operating room (OR) environment. Participants executed three use scenarios with the BPM and rated their user experience and acceptance with standardized questionnaires. A test leader evaluated the performance of the participants’ actions using a three-point scheme. The number of user interactions, task time, and perceived workload were assessed. The participants rated the user experience of the BPM significantly (p < .05) better in VR. User acceptance was significantly higher when the device was tested in VR and in a detailed OR environment. Participant performance and time on task did not significantly differ between VR and reality. However, there was significantly less interaction with the VR device (p < .001). Participants who tested the device in a detailed OR environment rated their performance significantly worse. In reality, the participants were able to haptically experience the device and thus better assess its quality. Overall, this study shows that user evaluations in VR should focus on objective criteria, such as user errors. Subjective criteria, such as user experience, are significantly biased by VR.
1 Introduction
The user-centered design process is a product development method that focuses on user requirements. Based on these requirements, prototypes are developed iteratively and are evaluated by users in usability tests or by experts (Backhaus, 2010). Depending on the stage of development and the product, the prototypes are paper models, click dummies, mockups, or interactive models. In early development phases, the functionality of prototypes is severely limited. In addition, the level of detail is low, and the test environment does not represent a later usage environment, which reduces the external validity compared to field studies with fully developed prototypes (Sarodnick and Brau, 2011).
The production of fully developed prototypes is resource- and cost-intensive (Zhou and Rau, 2019). One way to reduce these costs and development times is to use virtual prototypes (Choi et al., 2015). Virtual prototypes are highly detailed computer simulations of a new product and can be presented, analyzed, and tested depending on the programmed functionality (Wang, 2002). However, user tests are still mainly performed using real, fully developed prototypes. One reason is that the success of a product in the market also depends on subjective criteria, such as user acceptance and user experience (Hassenzahl and Tractinsky, 2006; Garrett, 2011; Salwasser et al., 2019). The user experience describes the overall impression of a product on the user. It is closely linked to the perception of the product and should therefore only be evaluated with mature and detailed prototypes and not, for example, with paper models or click dummies (Rudd et al., 1996; Rauschenberger et al., 2013a; Salwasser et al., 2019).
Virtual reality (VR) technology offers a new way of visualizing virtual prototypes in detail and making them experienceable. Using head-mounted displays (HMDs), it is possible to simulate immersive environments in which users can move freely. This makes it possible to evaluate prototypes with a high level of detail during early development phases (Salwasser et al., 2019).
Design reviews are often conducted in VR to evaluate prototypes. In VR design reviews, the three-dimensional view of the prototype is presented to the development team and stakeholders, allowing potential improvements at an early stage and increasing the efficiency of the development process (Antonya and Talaba, 2007; Aromaa and Väänänen, 2016; Aromaa, 2017; Berg and Vance, 2017; Brandt et al., 2017; Sivanathan et al., 2017; Ahmed et al., 2019; Clerk et al., 2019; Wolfartsberger, 2019; Adwernat et al., 2020; Wolfartsberger et al., 2020; Chen et al., 2021; Franzreb et al., 2022; Freitas et al., 2022).
However, studies in which users operate and subsequently evaluate prototypes in VR are scarce. Bruno and Muzzupappa (2010) presented the first comparative study in which participants used a product in reality and VR. The number and type of user errors observed between the groups did not differ significantly. The time required to perform concrete tasks was approximately twice that of VR. Further studies revealed that interactive user evaluation in VR can lead to valid results (Bruno et al., 2010; Bordegoni and Ferrise, 2013; Holderied, 2017; Madathil and Greenstein, 2017; Oberhauser and Dreyer, 2017; Bergroth et al., 2018; Bolder et al., 2018; Ma and Han, 2019; Aromaa et al., 2020; Grandi et al., 2020).
Overall, only a few studies have examined subjective criteria such as user experience or user acceptance of products in VR and compared them with real products. Metag et al. (2008) compared the subjective product evaluation of a real prototype and a virtual prototype using three-sided projection. In particular, the evaluation of colors and surface structures led to difficulties in VR. Kuliga et al. (2015) compared user experiences of visiting buildings in VR and reality. Significant differences were identified with regard to perceived user experience. Franzreb et al. (2022) investigated the user experience of three furnishing products in VR and in reality. For two of the three products, there were no significant differences in the evaluated user experience. One product was rated as significantly better in VR.
Initial studies in mixed reality (MR) vehicle environments, where virtual and real controls are combined, showed that the user experience and user acceptance in reality and MR were evaluated comparably (Bolder et al., 2018; Pettersson et al., 2019). However, studies investigating user experience and user acceptance within a usability test with fully interactive virtual products in VR have not yet been conducted.
Both the product and the usage environment influence subjective criteria. In classic usability tests, the usage environment was often biased owing to deviations from reality. The test participants knew that it was a simulation and, therefore, acted differently (Unger, 2020). Currently, there is limited understanding of the effect of VR environments on users’ cognitive processes. It remains unclear whether the cognitive requirements of a virtual task are equivalent to those of the real world (Harris et al., 2020). Frederiksen et al. (2020) discovered that a highly immersive and detailed VR environment during laparoscopy simulation resulted in a higher perceived workload than a less detailed VR simulation. If the interaction with a product leads to a high perceived workload, this can have an impact on the user experience (Winter et al., 2015).
Although VR offers the possibility to simulate the use of prototypes in a later usage environment, which would reduce the bias described by Unger (2020), simultaneously, detailed and immersive usage environments can bias the evaluation of the user experience because the participants unknowingly co-evaluate the VR environment.
Several studies have examined presence, that is, the feeling of being in the virtual world (Berkman and Akan, 2019), and compared it to reality (Usoh et al., 2000; Mania, 2001; Mania and Chalmers, 2001; Schuemie et al., 2001). Busch et al. (2014) investigated the suitability and user acceptance of virtual environments generated by a cave automatic virtual environment (CAVE) to simulate the usage environment. The results showed no differences between the virtual and real environments in terms of user acceptance of the real product. Brade et al. (2017) extended this study and investigated the influence of the virtual environment on the usability and user experience of a geocaching game. Users in the CAVE rated hedonic quality significantly better.
However, the VR technologies used in these studies are now obsolete. Current VR systems have high-resolution HMDs with resolutions of up to 2880 × 2720 pixels per eye and a field of view of up to 200° (Găină et al., 2022). VR controllers have evolved to offer more intuitive interactions; they incorporate motion tracking, finger tracking, force and haptic feedback, and buttons, allowing users to interact with the virtual environment more naturally (Anthes et al., 2016; Novacek and Jirina, 2022). Because of this technological progress, high-resolution, modern HMDs can create higher immersion than CAVE systems (Elor et al., 2020). Studies using modern HMDs to investigate the influence of the virtual environment on the user experience and acceptance of virtual prototypes or products are scarce.
The aim of this study was to investigate whether VR influences the evaluation of user experience and user acceptance of a product in the context of a usability test. Additionally, the influence of the design of the virtual environment on the user experience and user acceptance of a product were investigated.
2 Methods
2.1 Experimental design and participants
To investigate whether VR or the design of the VR environment has an impact on the user experience and user acceptance of a product, usability tests were performed in reality and in VR with a blood pressure monitor (BPM) (Model B02R, JianZhiKang Technology Co., China) in two different test environments (see Figure 1).
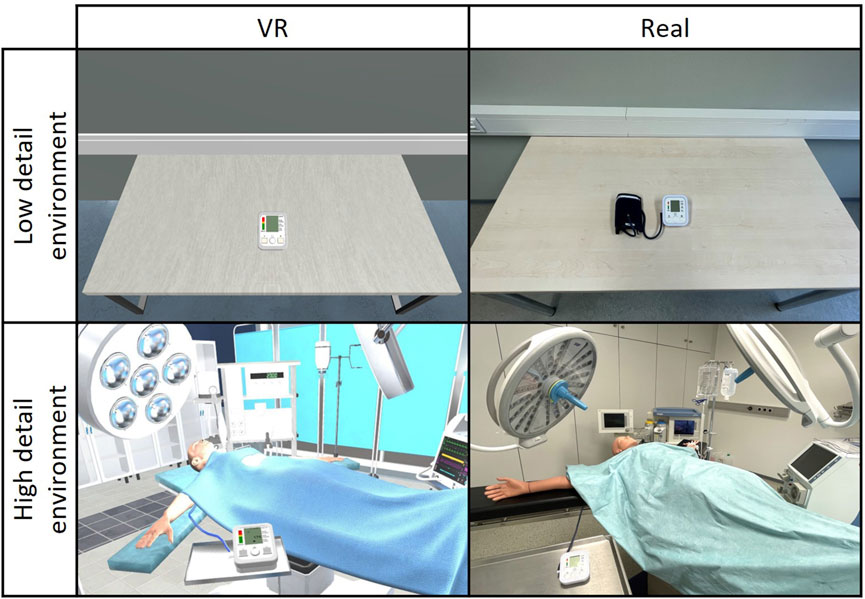
FIGURE 1. Real and virtual test environments. Forty eight test participants were divided into the four scenarios.
A total of 48 participants participated in this study. A 2 × 2 factorial between-subjects design with randomization was used. Half of the participants tested a real BPM. The other half tested a virtual copy using VR. Half of each group performed the usability test in a highly detailed environment (operating room (OR)). The other half of each group performed the test in a low-detail environment (an empty room with a table).
Table 1 lists the participant data for each trial group.
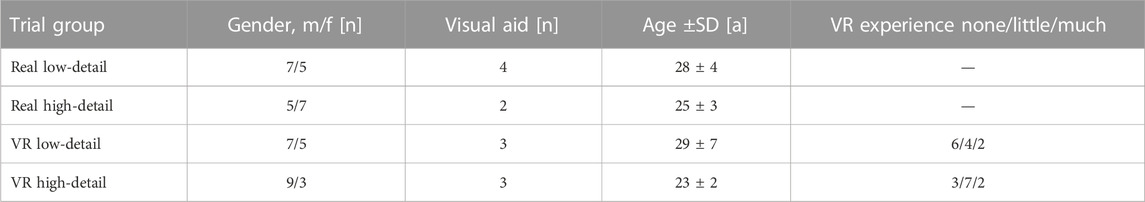
TABLE 1. Participant data.
All participants indicated that they had used a BPM before but were not familiar with the BPM in this study. All participants were enrolled in a bachelor’s or master’s degree program with a technical focus at the time of the study and stated that they used computers on a daily basis.
2.2 Experimental setup and procedure
2.2.1 Experimental setup
In a previously conducted workshop with experts from the field of nursing and usability, three different blood pressure measuring devices from different manufacturers were examined in terms of usability. The device used in this study showed the most usability problems and was, therefore, selected.
Figure 2 shows the visualization of the BPM. The virtual BPM matches the real device in terms of design and function. If the participant pressed a button, a click sound was generated in the VR as acoustic feedback. The pump noise of the real BPM was recorded and implemented in VR.
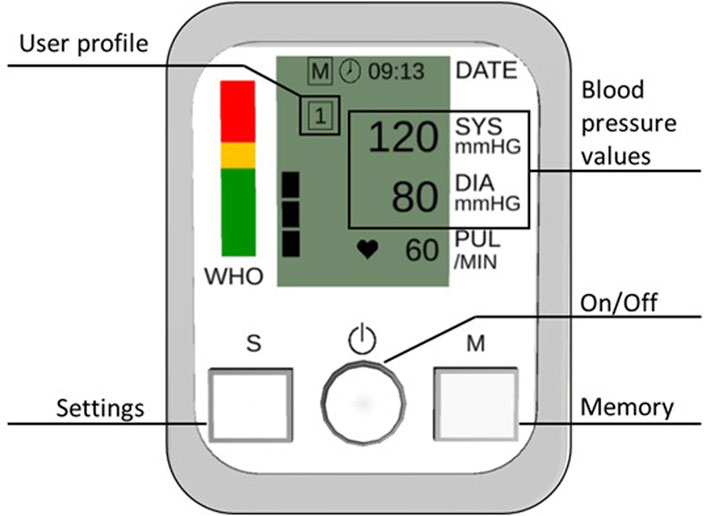
FIGURE 2. Illustration of the examined BPM.
In the real-life test setup, a camera (GoPro Hero 5, GoPro Inc., United States) was positioned vertically above the real BPM to record the participants’ interactions with the device. The tests were monitored using a tablet computer (Galaxy Tab A6, Samsung Co., South Korea), which was connected to the camera via WiFi. The test leader was in a separate monitoring room and observed the subject through a mirrored window. Using an intercom system, the test leader communicated with the participant and provided support in the event of a problem.
Virtual environments and the virtual BPM were created in the Unity 2020.2.3f1 development environment (Unity Technologies, United States) and coded in C# (Microsoft Corporation, United States). Visualization was performed using the Valve Index HMD (Valve Corporation, United States) and a PC with an i7 processor and a GeForce GTX 1070 graphics card (NVIDIA Inc. United States). An infrared sensor (Leap Motion Controller, Ultraleap Limited, United Kingdom) was mounted on the HMD. Using this sensor, the hands of the participants were captured and visualized in VR. Therefore, the participants did not need a controller, which enabled natural interaction with the BPM (Harms, 2019).
2.2.2 Experimental procedure
The experimental procedure was identical for all four test conditions. The participants were instructed on the test procedure in a standardized manner. The participants then performed three usage scenarios: measuring blood pressure, displaying measured values, and switching users. The usage scenarios were divided into tasks (Table 2).
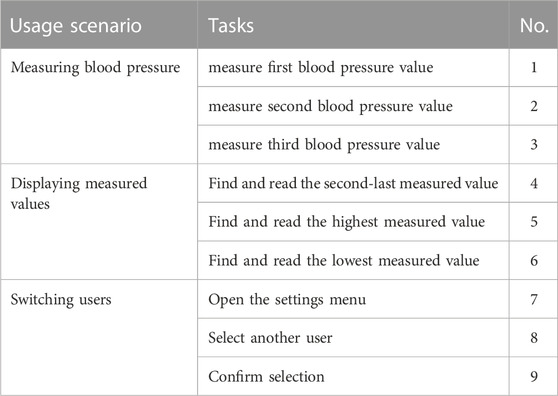
TABLE 2. Usage scenarios and the specific tasks.
Usage scenario 1
The on/off button switched the device on and off. The blood pressure measurements started automatically after the devices were switched on. Because no real measurement of the blood pressure is possible in VR, a random systolic value between 110 and 180 mmHg was generated after a simulated measurement time. The diastolic value and pulse were also generated randomly within the physiological range.
Usage scenario 2
After the measurement, the values were displayed and saved automatically. The saved older values could be displayed by pressing a memory key (M). When the memory key was pressed for the first time, the average blood pressure calculated from the saved measurements appeared. Navigation through the saved values was performed using the memory (forward) and setting (back) keys.
Usage scenario 3
The devices enabled the use of two different user profiles. To change the user, the setting key (S) was pressed for 2 s. Then, the settings menu opened, and an icon indicating the active user profile started blinking. The other user profile was called by pressing the memory key (M). This selection had to be confirmed using an on/off key.
After completing the usage scenarios, the participants evaluated their user experience, user acceptance, and perceived workload using standardized questionnaires.
2.3 Primary endpoints
2.3.1 User experience
User experience was measured using the user experience questionnaire (UEQ) (Laugwitz et al., 2008). The UEQ comprises 26 bipolar items divided into the following six dimensions:
• Attractiveness: Describes the general impression of the product.
• Perspicuity: Describes the user’s feeling that interaction with a product is easy, predictable, and controllable.
• Efficiency: Describes how quickly and efficiently the user can use the product.
• Dependability: Describes the feeling of being in control of the system.
• Stimulation: Describes the user’s interest and enthusiasm for the product.
• Novelty: Describes whether product design is perceived as innovative or creative.
Participants rated the items using a seven-point Likert scale (Rauschenberger et al., 2013b). Each box on the Likert scale was assigned a score between −3 and +3, where +3 corresponds to an adjective with a positive connotation. The UEQ score of a dimension is the mean of its respective scores.
2.3.2 User acceptance
User acceptance was measured using the system usability scale (SUS) (Brooke, 1995). The SUS is an effective and simple method for evaluating user acceptance of a system and comprises 10 alternating positive and negative statements. Between 1 and 5 points are awarded for each statement. Depending on the formulation of the item (positive/negative), a five-point rating represents either the statement “I fully agree” or the statement “I fully disagree.” The result is expressed as a score between 0 (negative) and 100 (positive). This 100-point scale enables a relative comparison between different products (Bangor et al., 2009). Figure 3 shows the evaluation scheme for interpreting the SUS score.
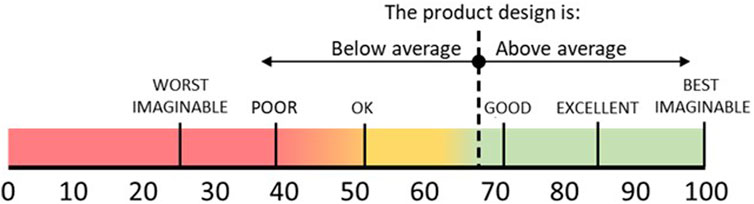
FIGURE 3. Classification of the SUS score. Adapted with permission from Bangor et al. (2009).
2.4 Secondary endpoints
2.4.1 Task success rate
To control whether possible differences in user experience and user acceptance could result from operational problems or errors, the task success rate was determined for all four test scenarios. For this purpose, a test leader evaluated the performance of the tasks listed in Table 2 using a 3-point scheme (Table 3). The test leader was not informed of the study aims.
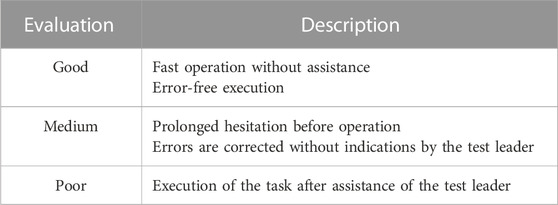
TABLE 3. Criteria for assessing task success rate.
For the analysis, the ratings are displayed as stacked bar charts. Each task was individually evaluated. The bars indicate the relative frequencies of the evaluation levels. The success rates were calculated using the following formula:
The calculated success rates were averaged and evaluated individually for each task as well as for each usage scenario.
2.4.2 Number of user interactions and time on usage scenario
In this study, the hands of the participants were captured and displayed in VR to allow natural interaction with the BPM. However, haptic feedback could not be simulated. The number of user interactions and the completion time for each usage scenario were recorded to verify whether the participants interacted comparably with the BPM in VR and in reality.
Every button touch by the participant was counted as an interaction. Attempts to use the screen of the device as a touchscreen were also counted as an interaction. Processing time is defined as the time between reading the usage scenario and completing the scenario.
In reality, the processing time of the usage scenario “measuring blood pressure” is primarily dependent on the pumping and measuring time of the device and differs physiologically between test participants. Therefore, the processing time was only evaluated for the usage scenarios “displaying measured values” and “switching users.”
2.4.3 Perceived workload
If the interaction with a product is mentally demanding, this may have an impact on the user experience (Winter et al., 2015). Studies have shown that performing tasks in VR can lead to a higher mental stress than in reality (Madathil and Greenstein, 2017; Siebers et al., 2020). To control whether mental workload was comparable between the experimental scenarios, participants filled out the NASA-RAW-TLX questionnaire after the experiment. The NASA-RAW-TLX Hart and Staveland (1988) comprises six items representing the dimensions of mental, physical, and temporal demands, as well as performance, effort, and frustration on a 20-point scale. A German translation was used in this study (Seifert, 2002). In addition to the total load, the individual subscales were evaluated.
2.5 Statistical analysis
Statistical analyses were performed using SPSS Statistics software (v.27, IBM, United States). Through a two-factorial analysis of variance (ANOVA) (α = .05), we investigated whether the test environment (highly detailed OR/low-detail desk) or simulation environment (VR/Real) had a significant influence on the dimensions of the UEQ and the SUS score.
In addition, ANOVA was used to examine whether the test environment or the simulation environment had a significant effect on the task success rate, number of user interactions, time spent on the usage scenario, and dimensions of the NASA-RAW-TLX.
The Kruskal–Wallis test (α = .05) was used to examine whether there were significant differences in the test leaders’ ratings of the different tasks between the four experimental conditions.
3 Results
3.1 Primary endpoints
3.1.1 User experience
Figure 4 shows the mean values for attractiveness, perspicuity, efficiency, dependability, stimulation, and novelty depending on the investigated factors (high/low detail and VR/reality).
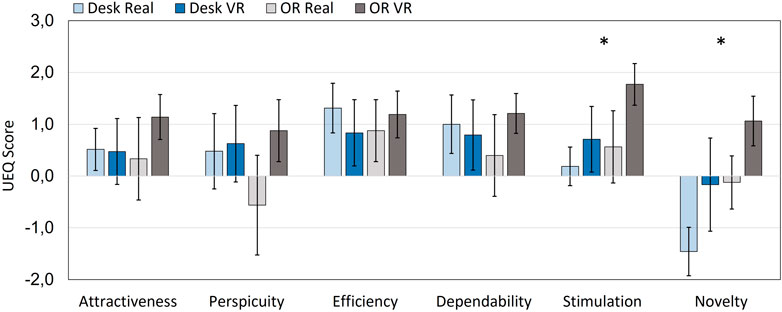
FIGURE 4. Results of UEQ: dimension means with 95% confidence interval.
Both the test environment (high-detail OR/low-detail desk) and the simulation environment (VR/Real) had a significant effect on the UEQ dimension stimulation and novelty. Table 4 lists the calculated significance values for the different UEQ dimensions.
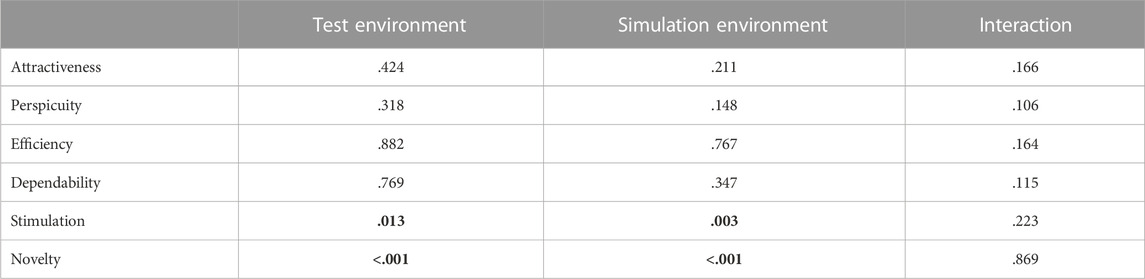
TABLE 4. UEQ dimensions that are significantly influenced (bold) by the factors “test environment” and “simulation environment” (ANOVA).
Figure 4 shows that the participants rated the dimensions novelty (MVR = 0.44 ± 1.22; MReal = −0.79 ± 0.87) and stimulation (MVR = 1.24 ± 0.92; MReal = 0.38 ± 0.94) significantly better in the VR simulation environment. Participants who tested the devices in the detailed OR environment also rated the novelty (MOR = 0.47 ± 0.87; MDesk = −0.81 ± 1.21) and stimulation (MOR = 1.17 ± 0.97; MDesk = 0.45 ± 0.89) dimensions significantly higher.
3.1.2 User acceptance
Figure 5 shows SUS scores as a function of the four trials.
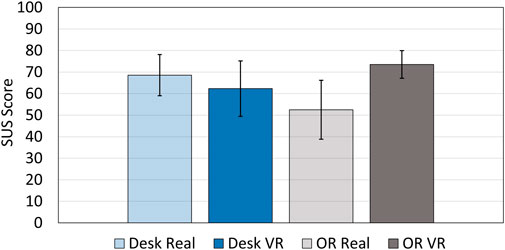
FIGURE 5. Results of the SUS: mean values with 95% confidence interval.
Neither the test environment (p = .67) nor the simulation environment (p = .20) had a significant effect on SUS scores. However, there was a significant interaction effect between the test and simulation environments on the SUS score (p = .02). The virtual device in the highly detailed OR environment scored the highest SUS score of 74 ± 11 and had “good” perceived usability according to Bangor et al. (2009) (see Figure 3). The real device in the OR environment, in contrast, only achieved a score of 53 ± 24, which corresponds to “poor” to “acceptable” usability.
In the low-detail test environment, the real device achieved a slightly higher value than the virtual device (62 ± 23), with an SUS score of 69 ± 17.
3.2 Secondary endpoints
3.2.1 Task success rate
Figure 6 shows the calculated success rates of the tasks, as well as the overall ratings of the usage scenarios.
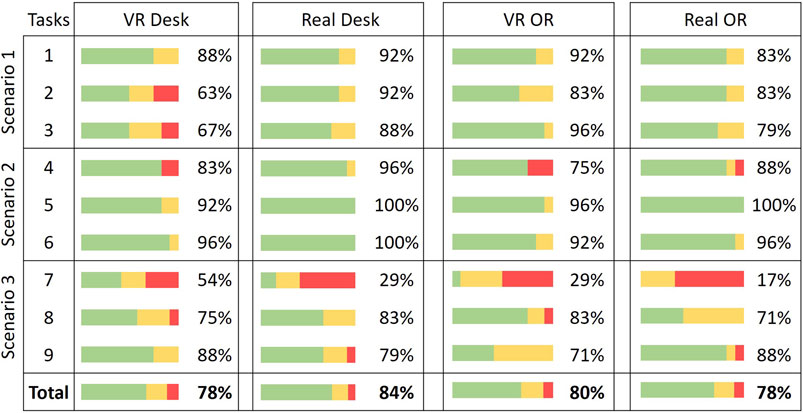
FIGURE 6. Comparison of success rates between the four different user tests. Usage scenario 1: measuring blood pressure; usage scenario 2: displaying measured values; usage scenario 3: switching users.
The Kruskal–Wallis test showed no significant differences with regard to the test leader’s evaluation of the individual tasks according to the three-point scheme (p > .05). The ANOVA results demonstrate that there are no significant differences between the four different user tests regarding success rates (p > .05).
Regardless of the test and simulation environments, the results demonstrate that the BPM has significant usability problems for use case 3 “switching users.” In particular, Task 7 (“Open the settings menu”) could not be performed by several participants without assistance.
3.2.2 Number of user interactions and time on usage scenario
Overall, the participants required less time to complete the scenarios in VR than in reality (MVR = 226 ± 84 s, MReal = 269 ± 81 s). A comparison of task completion times for the test environments showed that participants required less time to complete the tasks in the low-detail environment than in the detailed OR environment (MDesk = 224 ± 82 s, MOR = 271 ± 81 s). However, the differences were not statistically significant. (pVR-Real = .08, pDesk-OR > .05).
The participants in VR interacted with the BPM significantly less (p < .001, M = 61 ± 27) than the participants who operated the real device (M = 108 ± 32). Figure 7 shows the mean number of interactions of the participants. The test environment had no significant effect on the number of interactions (p = .73).
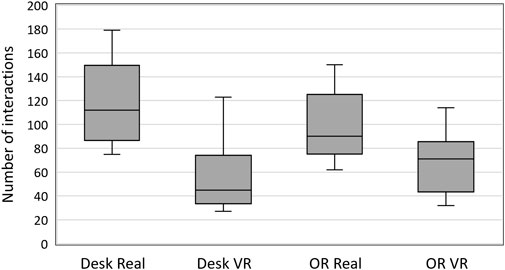
FIGURE 7. Number of operator interactions summed over the entire experiment as a function of the factors investigated.
3.2.3 Perceived workload
Figure 8 compares the dimensions of the perceived workload assessed by the NASA-RAW-TLX. Both the test and simulation environments had no significant influence on the dimensions of mental demand, physical demand, temporal demand, effort, and frustration. However, the test environment had a significant influence on the performance dimension (p = .008). Participants in the detailed OR environment rated their performance worse (MOR = 10.06 ± 4.72) than participants in the low-detail environment (MDesk = 6.40 ± 4.37).
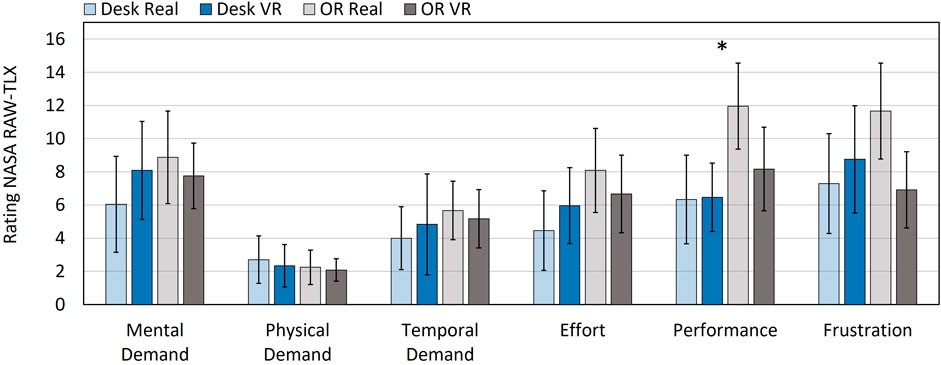
FIGURE 8. Comparison of perceived workload: dimension means and 95% confidence intervals.
Table 5 lists the calculated significance values for each dimension of the NASA-RAW-TLX.
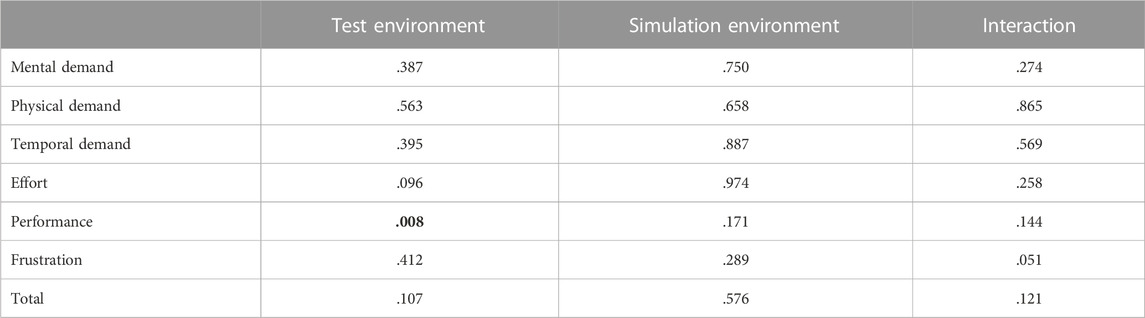
TABLE 5. Significance values of the NASA-RAW-TLX dimensions depending on the factors investigated.
4 Discussion
4.1 Experimental setup and procedure
In this study, we investigated whether a survey of user experience and user acceptance of a product in VR leads to the same results as a survey of a real product. By varying the test environment, we investigated whether this has an additional influence on the user experience and user acceptance.
In principle, the use of an infrared sensor for interaction with a virtual BPM proved to be suitable. The participants were able to operate the BPM using their hands. However, in some cases, the covering of the fingers by the back of the hand during the tests led to difficulties in capturing the interactions. Consequently, the VR participants used different hand postures than those who tested the real device. In reality, the participants sometimes held the device in both hands and operated the buttons with their thumbs. In VR, the participants operated the device exclusively using their index fingers. Figure 9 shows the different VR and real operations.
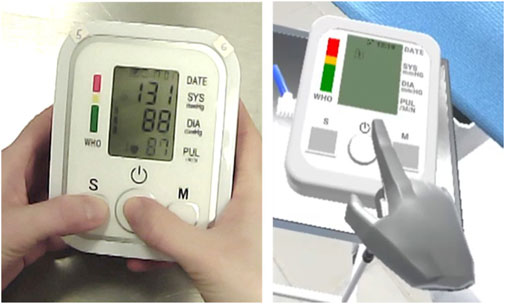
FIGURE 9. Example of operation of the BPM in reality (left) and in VR (right).
VR gloves with direct capture of finger and hand positions and haptic feedback through vibration motors can increase the comparability of interaction. The influence of different input devices or the use of wireless VR systems on the user experience needs to be further investigated.
One limitation of this study is the participant sample. The participants were students who were in a bachelor’s or master’s degree program with a technical focus at the time of the study. However, the main user group of home-care blood pressure monitors is the elderly, for whom a different perception of VR and technology in general can be assumed. The extent to which the results of this study can be transferred to an older group of participants must be investigated in a further study.
4.2 Primary endpoints
4.2.1 User experience
Participants rated the BPM “more novel” and “more stimulating” in VR than in reality. This is assumed to be owing to the novelty effect (Karapanos et al., 2009). Most participants had little or no experience with VR (Table 1). Owing to the novelty of the technology, the participants also perceived the product in VR as more novel and stimulating. The novelty effect may also have led to the BPM being rated as significantly more “original” and “stimulating” in the OR environment. Several users from the university environment were in the OR for the first time. This new experience may have influenced the evaluation of the blood pressure monitoring. In a study by Brade et al. (2017) in which participants performed a geocaching game in real and virtual environments, the participants also rated the UEQ dimensions “stimulation” and “novelty” significantly higher. In this study, most participants had little or no VR experience. Further studies are needed to investigate whether the UEQ dimensions are rated significantly better by users with significant VR experience.
Pettersson et al. (2019) did not identify any significant differences in terms of user experience between operating a real car and a car in an MR environment. The participants in this study also mostly had no or little VR experience. Unlike our study, the MR environment allowed the participants to experience the product haptically. All user interfaces, such as the steering wheel and infotainment system, were present in reality. In a comparative study in which, for instance, a real product is compared with a product in an MR environment and a completely virtual product in VR, it should be investigated whether the lack of haptic feedback is a reason for the different evaluations of the user experience.
A study by Vergara et al. (2011) showed that multisensory (visual-haptic) interaction influences the perceived ergonomics compared to purely visual interaction. Test subjects who interacted with a product purely visually noted fewer problems with the product regarding ergonomics and interaction. The influence of VR gloves with force and vibration feedback on the user experience needs to be investigated in further studies.
4.2.2 User acceptance
In contrast to the UEQ, it could not be shown for user acceptance that the test environment or the simulation environment independently had a significant influence on the SUS score. Comparable studies could also not find a difference between VR and real environments with regard to the SUS score (Busch et al., 2014; Bolder et al., 2018).
However, a significant interaction effect was observed in the present study. Participants who operated the BPM in the VR and detailed OR environment rated the perceived usability higher. This contradicts the study by Brade et al. (2017), in which participants rated the usability of a mobile device application in VR (CAVE) significantly worse than in reality. We suspect that, in our study, the novelty effect also influenced user acceptance.
In general, the comparison of the achieved SUS scores in this study shows that the evaluation of the user acceptance of products in VR can result in misleading conclusions. The product design of the VR BPM is rated as “good,” whereas the real device in the OR environment is rated in the range of “poor” to “acceptable.”
4.3 Secondary endpoints
4.3.1 Task success rate
Overall, no significant differences were identified in the task success rates as assessed by the test leader. In all four test scenarios, problems occurred in task 7, “Open the settings menu.” The participants did not identify that the settings button had to be pressed for 2 seconds to open the settings menu. This result indicates that the same usability problems can be identified in VR as in a real usability test. Furthermore, no new usability problems were generated owing to the different interaction modalities used in the VR. Therefore, biases in the assessment of user experience and user acceptance due to errors or uncertainties in the operation of the prototype in VR are excluded.
4.3.2 Number of user interactions and time on usage scenario
The participants interacted significantly less with the virtual device than with the real device (Figure 7). One reason for this could be the VR experience, which was novel to several participants, as well as the described problem of the fingers being covered by the back of the hand. In addition, haptic feedback was missing in VR. Subsequent studies should investigate whether the number of operator interactions changes when other interaction devices such as VR gloves with haptic feedback or an MR environment are used. Additionally, it should be investigated whether the number of user interactions increases when users have significantly more VR experience.
We assume that the intensive haptic perception of a real device influences the evaluation of the user experience. In reality, the participants perceived the device using both hands. This experience was included in the evaluation of the dimension “stimulation” with adjective pairs such as “valuable” vs. “inferior.” In VR, the participants were required to evaluate the device using only visual sensations. As described in the study by Metag et al. (2008), it is difficult for participants in VR to evaluate the quality of surface textures.
As in the study by Madathil and Greenstein (2017), no significant differences were detected between VR and reality in terms of the time to complete the tasks; however, in the study by Siebers et al. (2020), there was a highly significant difference. In this study, participants had to solve a puzzle in both VR and reality. As expected, the test participants required significantly more time for this fine-motor task in VR. The interaction with the BPM had low complexity owing to the button-only operation. It is expected that there may be differences in completion times for products with complex controls. The influence of this complexity difference, if any, on user experience and user acceptance must be evaluated in further studies with more complex user interfaces.
4.3.3 Perceived workload
Participants in the highly detailed OR environment rated their performance significantly worse than those in the low-detail desk environment. The results of this study demonstrate that both real and virtual OR environments increase the pressure on the participants to perform. It follows that, particularly in the early stages of development, when user testing in a real product usage environment cannot be performed because of cost or effort, testing in a virtual usage environment may be useful. Although the pressure required to perform in a real OR environment was even higher, the use of photorealistic environments could further improve the results in VR.
If participants rate their performance as poor or if the operation of the product is mentally demanding, this can negatively influence user experience (Winter et al., 2015). However, because the BPM was not rated significantly worse in the OR environment than in the low-detail tabletop environment, it is assumed that the significant difference in the performance dimension had no influence on the assessment of the user experience or user acceptance.
5 Conclusion
The results of this study demonstrate that both the simulation environment (VR/real) and design of the test environment have a significant effect on measuring user experience and user acceptance. The participants had comparable difficulties with the product in both VR and reality, resulting in problems with the same task. Nevertheless, the participants rated the user experience of the product as significantly better in VR than in reality. In addition, user acceptance of the BPM was significantly higher when the device was tested in VR and in a detailed OR environment. We suggest that these differences are caused by the novelty effect and lack of haptic feedback in VR. In reality, the participants were able to experience the device haptically and consequently assess its quality better.
From these results, it follows that the evaluation of user experience and user acceptance of products in VR with currently established questionnaires, such as the SUS or the UEQ, is not useful. The focus of usability testing in VR should be on objective criteria, such as user errors. However, the participants in this study had little or no experience with VR technology. Further studies should investigate whether participants with a lot of VR experience evaluate products in VR in a similar way as in reality.
Data availability statement
The raw data supporting the conclusion of this article will be made available by the authors, without undue reservation.
Ethics statement
Ethical review and approval was not required for the study on human participants in accordance with the local legislation and institutional requirements. The patients/participants provided their written informed consent to participate in this study.
Author contributions
NH, SK, and CS carried out the experiment. NH wrote the manuscript with support from SK, CS, and CB. NH conceived the original idea. CB supervised the project. All authors contributed to the article and approved the submitted version.
Conflict of interest
The authors declare that the research was conducted in the absence of any commercial or financial relationships that could be construed as a potential conflict of interest.
Publisher’s note
All claims expressed in this article are solely those of the authors and do not necessarily represent those of their affiliated organizations, or those of the publisher, the editors and the reviewers. Any product that may be evaluated in this article, or claim that may be made by its manufacturer, is not guaranteed or endorsed by the publisher.
References
Adwernat, S., Wolf, M., and Gerhard, D. (2020). Optimizing the design review process for cyber-physical systems using virtual reality. Procedia CIRP 91, 710–715. doi:10.1016/j.procir.2020.03.115
Ahmed, S., Irshad, L., Demirel, H. O., and Tumer, I. Y. (2019). “A comparison between virtual reality and digital human modeling for proactive ergonomic design,” in Digital human modeling and applications in health, safety, ergonomics and risk management. Human body and motion. Editor V. G. Duffy (Heidelberg, Germany: Springer International Publishing), 3–21.
Anthes, C., Garcia-Hernandez, R. J., Wiedemann, M., and Kranzlmuller, D. (2016). “State of the art of virtual reality technology,” in Proceedings of the 2016 IEEE Aerospace Conference (IEEE), Big Sky, MT, USA, March 2016.
Antonya, C., and Talaba, D. (2007). Design evaluation and modification of mechanical systems in virtual environments. Virtual Real 11, 275–285. doi:10.1007/s10055-007-0074-6
Aromaa, S., Goriachev, V., and Kymäläinen, T. (2020). Virtual prototyping in the design of see-through features in mobile machinery. Virtual Real 24, 23–37. doi:10.1007/s10055-019-00384-y
Aromaa, S., and Väänänen, K. (2016). Suitability of virtual prototypes to support human factors/ergonomics evaluation during the design. Appl. Ergon. 56, 11–18. doi:10.1016/j.apergo.2016.02.015
Aromaa, S. (2017). “Virtual prototyping in design reviews of industrial systems,” in Proceedings of the 21st International Academic Mindtrek Conference, New York, NY, USA, June 2017. Editors M. Turunen, H. Väätäjä, J. Paavilainen, and T. Olsson 110–119.
Backhaus, C. (2010). Usability-engineering in der Medizintechnik. Berlin Germany: Springer Berlin Heidelberg.
Bangor, A., Kortum, P., and Miller, J. (2009). Determining what individual SUS scores mean: Adding an adjective rating scale. J. Usability Stud. Arch. 4, 114–123.
Berg, L. P., and Vance, J. M. (2017). An industry case study: Investigating early design decision making in virtual reality. J. Comput. Inf. Sci. 17. doi:10.1115/1.4034267
Bergroth, J. D., Koskinen, H. M. K., and Laarni, J. O. (2018). Use of immersive 3-D virtual reality environments in control room validations. Nucl. Technol. 202, 278–289. doi:10.1080/00295450.2017.1420335
Berkman, M. I., and Akan, E. (2019). “Presence and immersion in virtual reality,” in Encyclopedia of computer graphics and games. Editor N. Lee (Berlin Germany: Springer International Publishing), 1–10.
Bolder, A., Grünvogel, S. M., and Angelescu, E. (2018). “Comparison of the usability of a car infotainment system in a mixed reality environment and in a real car,” in Proceedings of the 24th ACM Symposium on Virtual Reality Software and Technology, New York, NY, USA, August 2018. Editors S. N. Spencer, S. Morishima, Y. Itoh, T. Shiratori, Y. Yue, and R. Lindeman, 1–10.
Bordegoni, M., and Ferrise, F. (2013). Designing interaction with consumer products in a multisensory virtual reality environment. Virtual Phys. Prototyp. 8, 51–64. doi:10.1080/17452759.2012.762612
Brade, J., Lorenz, M., Busch, M., Hammer, N., Tscheligi, M., and Klimant, P. (2017). Being there again – presence in real and virtual environments and its relation to usability and user experience using a mobile navigation task. Int. J. Hum. Comput. Stud. 101, 76–87. doi:10.1016/j.ijhcs.2017.01.004
Brandt, S., Fischer, M., Gerges, M., Jähn, C., and Berssenbrügge, J. (2017). “Automatic derivation of geometric properties of components from 3D polygon models,” in Proceedings of the 37th Computers and Information in Engineering Conference, New York, NY, USA, November 2017 (American Society of Mechanical Engineers).
Bruno, F., Cosco, F., Angilica, A., and Muzzupappa, M. (2010). “Mixed prototyping for products usability evaluation,” in Proceedings of the 30th Computers and Information in Engineering Conference, kuala lumpur, Malaysia, November 2010.
Bruno, F., and Muzzupappa, M. (2010). Product interface design: A participatory approach based on virtual reality. Int. J. Hum. Comput. Stud. 68, 254–269. doi:10.1016/j.ijhcs.2009.12.004
Busch, M., Lorenz, M., Tscheligi, M., Hochleitner, C., and Schulz, T. (2014). “Being there for real,”. Editors V. Roto, J. Häkkilä, K. Väänänen-Vainio-Mattila, O. Juhlin, T. Olsson, and E. Hvannberg, 117–126.Proceedings of the 8th Nordic Conference on Human-Computer Interaction: Fun, Fast, Foundational, New York, NY, USA, July 2014
Choi, S., Jung, K., and Noh, S. D. (2015). Virtual reality applications in manufacturing industries: Past research, present findings, and future directions. Concurr. Eng. 23, 40–63. doi:10.1177/1063293X14568814
Chalil Madathil, K., and Greenstein, J. S. (2017). An investigation of the efficacy of collaborative virtual reality systems for moderated remote usability testing. Appl. Ergon. 65, 501–514. doi:10.1016/j.apergo.2017.02.011
Chen, X., Gong, L., Berce, A., Johansson, B., and Despeisse, M. (2021). Implications of virtual reality on environmental sustainability in manufacturing industry: A case study. Procedia CIRP 104, 464–469. doi:10.1016/j.procir.2021.11.078
Clerk, M. de, Dangelmaier, M., Schmierer, G., and Spath, D. (2019). User centered design of interaction techniques for VR-based automotive design reviews. Front. Robot. AI 6, 13. doi:10.3389/frobt.2019.00013
Elor, A., Powell, M., Mahmoodi, E., Hawthorne, N., Teodorescu, M., and Kurniawan, S. (2020). On shooting stars: Comparing CAVE and HMD immersive virtual reality exergaming for adults with mixed ability. ACM Trans. Comput. Healthc. 1, 1–22. doi:10.1145/3396249
Franzreb, D., Warth, A., and Futternecht, K. (2022). “User experience of real and virtual products: A comparison of perceived product qualities,” in Developments in design research and practice. Editors E. Duarte, and C. Rosa (Berlin, Germany: Springer International Publishing), 105–125.
Frederiksen, J. G., Sørensen, S. M. D., Konge, L., Svendsen, M. B. S., Nobel-Jørgensen, M., Bjerrum, F., et al. (2020). Cognitive load and performance in immersive virtual reality versus conventional virtual reality simulation training of laparoscopic surgery: A randomized trial. Surg. Endosc. 34, 1244–1252. doi:10.1007/s00464-019-06887-8
Freitas, F. V. de, Gomes, M. V. M., and Winkler, I. (2022). Benefits and challenges of virtual-reality-based industrial usability testing and design reviews: A patents landscape and literature review. Appl. Sci. 12, 1755. doi:10.3390/app12031755
Găină, M.-A., Szalontay, A. S., Ștefănescu, G., Bălan, G. G., Ghiciuc, C. M., Boloș, A., et al. (2022). State-of-the-Art review on immersive virtual reality interventions for colonoscopy-induced anxiety and pain. J. Clin. Med. 11, 1670. doi:10.3390/jcm11061670
Garrett, J. J. (2011). The elements of user experience: User-centered design for the Web and beyond. Berkeley, CA,USA: New Riders.
Grandi, F., Zanni, L., Peruzzini, M., Pellicciari, M., and Campanella, C. E. (2020). A Transdisciplinary digital approach for tractor’s human-centred design. Int. J. Comput. Integr. Manuf. 33, 377–397. doi:10.1080/0951192X.2019.1599441
Harms, P. (2019). Automated usability evaluation of virtual reality applications. ACM Trans. Comput.-Hum. Interact. 26, 1–36. doi:10.1145/3301423
Harris, D., Wilson, M., and Vine, S. (2020). Development and validation of a simulation workload measure: The simulation task load index (SIM-TLX). Virtual Real 24, 557–566. doi:10.1007/s10055-019-00422-9
Hart, S. G., and Staveland, L. E. (1988). “Development of NASA-TLX (task load index): Results of empirical and theoretical research,” in Human mental workload (Amsterdam, Netherlands: Elsevier), 139–183.
Hassenzahl, M., and Tractinsky, N. (2006). User experience-a research agenda. Behav. Inf. Technol. 25, 91–97. doi:10.1080/01449290500330331
Holderied, H. (2017). Evaluation of interaction concepts in virtual reality applications. Bonn, Germany: Gesellschaft für Informatik.
Karapanos, E., Zimmerman, J., Forlizzi, J., and Martens, J.-B. (2009). “User experience over time,” in Proceedings of the 27th International Conference on Human Factors in Computing Systems - CHI 09, New York, NY, USA. Editors D. R. Olsen, R. B. Arthur, K. Hinckley, M. R. Morris, S. Hudson, and S. Greenberg (ACM Press), 729.
Kuliga, S. F., Thrash, T., Dalton, R. C., and Hölscher, C. (2015). Virtual reality as an empirical research tool — exploring user experience in a real building and a corresponding virtual model. Comput. Environ. Urban Syst. 54, 363–375. doi:10.1016/j.compenvurbsys.2015.09.006
Laugwitz, B., Held, T., and Schrepp, M. (2008). “Construction and evaluation of a user experience questionnaire,” in HCI and usability for education and work. Editor A. Holzinger (Berlin, Germany: Springer Berlin Heidelberg), 63–76.
Ma, C., and Han, T. (2019). “Combining virtual reality (VR) technology with physical models – a new way for human-vehicle interaction simulation and usability evaluation,” in HCI in mobility, transport, and automotive systems. Editor H. Krömker (Berlin, Germany: Springer International Publishing), 145–160.
Mania, K., and Chalmers, A. (2001). The effects of levels of immersion on memory and presence in virtual environments: A reality centered approach. Cyberpsychol. Behav. 4, 247–264. doi:10.1089/109493101300117938
Mania, K. (2001). “Connections between lighting impressions and presence in real and virtual environments,” in Proceedings of the 1st International Conference on Computer Graphics, Virtual Reality and Visualisation - AFRIGRAPH '01, New York, New York, USA, June 2001. Editors A. Chalmers, V. Lalioti, E. Blake, S. Bangay, and J. Gain (ACM Press), 119.
Metag, S., Husung, S., Krömker, H., and Weber, C. (2008). “Studying user experience in virtual environments,” in Proceedings of the Workshop “Research Goals and Strategies for Studying User Experience and Emotion” at the 5th Nordic Conference on Human-computer Interaction: Building Bridges, Lund, Sweden, December 2008 (NordiCHI).
Novacek, T., and Jirina, M. (2022). Overview of controllers of user interface for virtual reality. PRESENCE Virtual Augmented Real. 29, 37–90. doi:10.1162/pres_a_00356
Oberhauser, M., and Dreyer, D. (2017). A virtual reality flight simulator for human factors engineering. Cogn. Tech. Work 19, 263–277. doi:10.1007/s10111-017-0421-7
Pettersson, I., Karlsson, M., and Ghiurau, F. T. (2019). “Virtually the same experience?,” in Proceedings of the 2019 on Designing Interactive Systems Conference, New York, NY, USA, August 2019. Editors S. Harrison, S. Bardzell, C. Neustaedter, and D. Tatar, 463–473.
Rauschenberger, M., Schrepp, M., Perez-Cota, M., Olschner, S., and Thomaschewski, J. (2013a). Efficient measurement of the user experience of interactive products. How to use the user experience questionnaire (UEQ). Example: Spanish language version. IJIMAI 2, 39. doi:10.9781/ijimai.2013.215
Rauschenberger, M., Schrepp, M., and Thomaschewski, J. (2013b). “User Experience mit Fragebögen messen – durchführung und Auswertung am Beispiel des UEQ,” in Tagungsband UP13. Editors H. Brau, A. Lehmann, K. Petrovic, and M. C. Schroeder (Stuttgart Germany: German UPA e.V), 72–77.
Rudd, J., Stern, K., and Isensee, S. (1996). Low vs. high-fidelity prototyping debate. Interactions 3, 76–85. doi:10.1145/223500.223514
Salwasser, M., Dittrich, F., Melzer, A., and Müller, S. (2019). Virtuelle Technologien für das User-Centered-Design (VR for UCD). Einsatzmöglichkeiten von Virtual Reality bei der nutzerzentrierten Entwicklung. Hamburg, Germany: Gesellschaft für Informatik e.V. Und German UPA e.V.
Sarodnick, F., and Brau, H. (2011). Methoden der Usability evaluation. Bern, Switzerland: Verlag Hans Huber.
Schuemie, M. J., van der Straaten, P., Krijn, M., and van der Mast, C. A. (2001). Research on presence in virtual reality: A survey. Cyberpsychol. Behav. 4, 183–201. doi:10.1089/109493101300117884
Seifert, K. (2002). Evaluation multimodaler computer-systeme in frühen entwicklungsphasen. Berlin, Germany: Technische Universität Berlin.
Siebers, S., Sannwaldt, F., and Backhaus, C. (2020). “Vergleich grundlegender Aufgaben in VR und echtem Szenario Digitale Arbeit, digitaler Wandel, digitaler Mensch? 66,” in Kongress der Gesellschaft für Arbeitswissenschaft, TU Berlin, Fachgebiet Mensch-Maschine-Systeme/HU Berlin, Professur Ingenieurpsychologie (Berlin, Germany: GfA-Press).
Sivanathan, A., Ritchie, J. M., and Lim, T. (2017). A novel design engineering review system with searchable content: Knowledge engineering via real-time multimodal recording. J. Eng. Des. 28, 681–708. doi:10.1080/09544828.2017.1393655
Unger, N. R. (2020). Testing the untestable: Mitigating simulation bias during summative usability testing. Proc. Int. Symposium Hum. Factors Ergonomics Health Care 9, 142–144. doi:10.1177/2327857920091058
Usoh, M., Catena, E., Arman, S., and Slater, M. (2000). Using presence questionnaires in reality. Presence Teleoperators Virtual Environ. 9, 497–503. doi:10.1162/105474600566989
Vergara, M., Mondragón, S., Sancho-Bru, J. L., Company, P., and Agost, M.-J. (2011). Perception of products by progressive multisensory integration. A study on hammers. Appl. Ergon. 42, 652–664. doi:10.1016/j.apergo.2010.09.014
Wang, G. G. (2002). Definition and review of virtual prototyping. J. Comput. Inf. Sci. Eng. 2, 232–236. doi:10.1115/1.1526508
Winter, D., Schrepp, M., and Thomaschewski, J. (2015). “Faktoren der User Experience: Systematische Übersicht über produktrelevante UX-Qualitätsaspekte,” in Mensch und Computer 2015 – usability Professionals. Editors A. Endmann, H. Fischer, and M. Krökel (Berlin, Germany: De Gruyter), 33–41.
Wolfartsberger, J. (2019). Analyzing the potential of Virtual Reality for engineering design review. Autom. Constr. 104, 27–37. doi:10.1016/j.autcon.2019.03.018
Wolfartsberger, J., Zenisek, J., and Wild, N. (2020). Supporting teamwork in industrial virtual reality applications. Procedia Manuf. 42, 2–7. doi:10.1016/j.promfg.2020.02.016
Keywords: virtual prototype, usability test, virtual reality (VR), user interface, humantechnology interaction
Citation: Hinricher N, König S, Schröer C and Backhaus C (2023) Effects of virtual reality and test environment on user experience, usability, and mental workload in the evaluation of a blood pressure monitor. Front. Virtual Real. 4:1151190. doi: 10.3389/frvir.2023.1151190
Received: 25 January 2023; Accepted: 26 May 2023;
Published: 13 June 2023.
Edited by:
Glyn Lawson, University of Nottingham, United KingdomReviewed by:
Cristiano Ferreira, Federal University of Santa Catarina, BrazilBranislav Sobota, Technical University of Košice, Slovakia
Copyright © 2023 Hinricher, König, Schröer and Backhaus. This is an open-access article distributed under the terms of the Creative Commons Attribution License (CC BY). The use, distribution or reproduction in other forums is permitted, provided the original author(s) and the copyright owner(s) are credited and that the original publication in this journal is cited, in accordance with accepted academic practice. No use, distribution or reproduction is permitted which does not comply with these terms.
*Correspondence: Niels Hinricher, bmllbHMuaGlucmljaGVyQGZoLW11ZW5zdGVyLmRl