 Pitch Sinlapanuntakul
 Jenna Korentsides
 Barbara S. Chaparro
- 1Department of Human Centered Design & Engineering, University of Washington, Seattle, WA, United States
- 2Department of Human Factors and Behavioral Neurobiology, Embry-Riddle Aeronautical University, Daytona Beach, FL, United States
Augmented reality is an emergent form of technology that allows users to interact with and manipulate virtual objects and information integrated into the physical environment. Whether it is replying to browser-based emails or playing a game, completing such tasks in augmented reality requires the use of hand-tracking gestures or interactions. With the anticipated growth of this technology, future users may experience it for extended periods with a variety of applications (e.g., metaverse). This study explores the perceptions and user experience of individuals when interacting with and maneuvering in a multi-window augmented reality environment, using a range of hand-tracking interactions. The results provide both qualitative and quantitative insights into these interactions, highlighting the impact of perceived usability, subjective user experience, perceived difficulty, and perceived workload on task completion.
1 Introduction
Augmented reality (AR) provides users the ability to interact with elements in the physical and virtual worlds simultaneously. AR headset devices enable the manipulation of virtual elements superimposed on the real-world environment through hand-tracking interaction. Since the advent of these technological advancements, their applications have expanded significantly, attracting the attention of various professional domains seeking to explore their potential to enhance task completion. Assessing the employment of these capabilities in work-related settings to comprehend the effects of the diverse interaction styles and devices is essential. This current study’s purpose is to understand the user experience and perceptions of AR through a set of scenario-based tasks. The results provide valuable insights into the positive and negative experiences that users encounter while working in a multi-window AR environment. In addition, to create a better overall user experience, problematic interactions are highlighted and discussed for future design considerations and implications.
1.1 xReality
Reality-enhanced technology encompasses two forms: virtual reality (VR) and augmented reality (AR), which are distinguished by whether the physical environment is visually part of the user experience; both are under the umbrella term of xReality (Rauschnabel et al., 2022), with “x” representing the type of reality implemented. VR applications fully immerse users in a computer-simulated environment with no visualization of the physical environment and vary in the amount of telepresence. AR applications allow users to perceive virtual objects, as well as their physical environment. AR experiences lie on a continuum based on the amount the virtual objects are present in the physical environment, ranging from virtual information simply overlaid in the physical environment (assisted reality) to virtual content integrated as part of the physical environment (mixed reality; MR). For example, the presence of virtual information about a museum when touring a new city using AR glasses may be considered assisted reality. Virtual information integrated into an exhibit in the museum through spatial mapping of the museum space to the level that it is perceived as part of the physical exhibit reflects mixed reality.
AR solutions are increasingly being adopted and utilized in many domains, including education, engineering, medical/surgical, simulation, and video gaming (Park et al., 2021; Sinlapanuntakul, W. “Pitch” et al., 2022), as well as industrial, organizational, military, and government domains. For instance, in industrial work domains, AR applications have shown great promise with its use to improve efficiency and accuracy while reducing errors and downtime (Ekren et al., 2017). Additionally, in organizational work domains, AR solutions have been employed to enhance collaboration and communication, such as a collaborative system to facilitate remote teams in complex tasks (Cho et al., 2022). Overall, AR is a key form of technology for future work efficiency, yet empirical studies on user experience and evaluation of design issues with this technology are still limited.
1.2 Interacting in an AR environment with an AR headset
With a growing interest in the use of AR in diverse domains, evaluating the hand-tracking capabilities required to control and manipulate the virtual elements is essential, especially when wearing AR headset devices, such as the Microsoft HoloLens™, Magic Leap™, Acer Mixed Reality™, and RealWear™. Previous research studies have focused on assessing the user interaction along with their capabilities in real-world scenarios. For instance, Graichen et al. (2019) investigated the user experience of a gesture-based interaction interface within a car, comparing it with another touch-screen interface typically found in the automotive industry today. Using gesture-based interaction resulted in lower gaze times towards areas of the vehicle other than the windshield compared to direct touch interaction (Graichen et al., 2019). Further studies have investigated the use of AR devices for daily work activities. Shelstad et al. (2019) examined user performance of hand-tracking interaction in a simulated PC desktop environment with the Microsoft HoloLens 1. Results showed that users experienced some difficulty in the manipulation of specific interactions, including selecting, scrolling, and resizing (Shelstad et al., 2019). In a discussion about the future of work using AR, Knierim et al. (2021) note the importance of seamless and effortless interaction to be successful. Research with hybrid AR environments, which comprise physical keyboard, monitor and virtual displays, reveal a combination of physical and virtual displays yields higher productivity than all virtual displays (Pavanatto et al., 2021). Likewise with text input performance, typing on a physical keyboard with an AR display yields faster typing than a soft keyboard on a smartphone (Knierim et al., 2020). As the pervasiveness of AR in the range of work environments continues, it is crucial to examine the user experience of hand-tracking interaction using AR headsets with no physical input devices.
1.3 Purpose
The current study aims at investigating user performance and perceptions using the native Microsoft HoloLens 2 hand-tracking interface in a multi-window AR environment with inexperienced participants. This study offers valuable insights not only to HoloLens users but also to individuals developing their own systems, facilitating their understanding of intuitive and non-intuitive interactions. It was hypothesized that certain interactions may be more intuitive than others, depending on users’ expectations from prior experience using touchscreen devices, such as smartphones, tablets, and trackpad.
2 Methods
2.1 Study design
The study employed a convergent parallel mixed-methods design to investigate multi-window tasks in an AR environment. Qualitative data were collected using think-aloud protocols and user feedback, while quantitative data included user task performance, perceived task difficulty, perceived usability, subjective user experience, perceived workload, and simulator sickness. Both qualitative and quantitative data were collected concurrently, independently analyzed, and compared during the interpretation of the results.
2.2 Participants
A total of twenty participants (10 males, 10 females), with ages ranging from 18 to 28 (M = 22.40, SD = 3.09), were recruited from a university online research participation system and by word of mouth. Participants (N = 20) self-reported having normal or corrected to normal vision, and none reported any disabilities or movement conditions associated with their hands. Eighteen participants self-reported being right-handed, with the remaining two self-reporting as left-handed. Additionally, some participants (n = 17) self-reported some prior usage with an AR or VR device (Mdn = 4.00, IQR = 10.25), of which three participants self-reported having prior minimal exposure of less than 4 hours with the Microsoft HoloLens 2. None of the participants had experience with the multi-window series of tasks in an AR environment used in this study. Participants who consented to participate in the study received either course credit or $15 as compensation for their participation.
2.3 Materials
2.3.1 Microsoft HoloLens 2
The Microsoft HoloLens 2, a mixed reality headset that has been gaining increasing recognition across various industries, was utilized in this study. In particular, its ability to overlay interactive, 3-dimensional elements, similar to a traditional Windows operating system (OS) desktop through spatial mapping technology in the user’s physical environment, which can be manipulated through eye-tracking, hand-tracking, and voice commands (Microsoft, 2023), makes it an ideal testbed for the use of AR headset devices in the workplace. The software version used was Windows Holographic for Business, OS build 10.0.20348.1450 (version 21H2 March 2022 update).
2.3.2 User tasks
A series of task scenarios were designed to mirror a multi-window desktop environment that included multiple applications, in which participants were tasked with completing them in sequence (see Supplementary Table S1, S2 for the list of task scenarios, hand-tracking interactions, and a demonstration video). A range of tasks, including editing a document, communicating with others, browsing the entertainment, and playing games, was chosen to ensure a comprehensive evaluation of interactions, taking into account the potential differences in physical and cognitive demands for different types of tasks. Overall, these tasks incorporated various interactions such as selecting, scrolling, resizing, rotating, and moving objects.
2.4 Measures
2.4.1 User performance
Participants’ performance was evaluated by calculating the task completion rate and the number of attempts. The task completion rate calculated the level of success based on three metrics: success, partial success, and failure. Success indicates the correct and full completion of a task without any assistance requested. Partial success indicates either completion of a task to some extent or the full completion of a task with verbal assistance from a researcher. Failure indicates the omission or unsuccessful completion of a task.
2.4.2 Perceived task difficulty
The perceived task difficulty used a 10-point scale, ranging from (1) very difficult to (10) very easy, to evaluate the difficulty of completing a task upon its completion. The participants were asked to further provide the reasoning behind their ratings.
2.4.3 Perceived usability
The System Usability Scale (SUS) was used to measure participants’ perceived usability of working in mixed reality space. The SUS is an industry-standard, 10-item questionnaire on a 5-point scale, ranging from (1) strongly disagree to (5) strongly agree (Brooke, 1996). A higher total score, compiled from 10 items as a single score between 0 and 100, suggests greater perceived usability. Each item was adjusted by replacing “system” with “mixed reality space”.
2.4.4 Subjective user experience
The User Experience Questionnaire (UEQ) measured the subjective impressions of users toward the user experience of interactions with virtual information in the AR space. The UEQ includes 26 items that use a semantic differential on a 7-point scale and is summarized by six constructs: attractiveness, perspicuity, efficiency, dependability, stimulation, and novelty (Laugwitz et al., 2008). Each item was scaled from (−3) most negative to (+3) most positive, and the order of the terms was randomized.
2.4.5 Perceived workload
The Raw NASA Task Load Index (NASA-RTLX; Hart, 2006) is a recommended alternative to the traditional NASA Task Load Index (NASA-TLX; Hart and Staveland, 1988) that assesses participants’ subjective workload and performance on the tasks (Grier, 2015). The NASA-RTLX only requires participants to rate each of the 6 constructs, without performing the paired comparisons (Hart, 2006). This 6-item questionnaire is scored on a 21-point scale and rates six dimensions: mental demand, physical demand, temporal demand, effort, performance, and frustration. Higher scores indicate a more demanding workload or worse perceived performance.
2.4.6 Simulator sickness
The Simulator Sickness Questionnaire (SSQ) is a 4-point Likert-scale questionnaire, ranging from (0) none to (3) severe for each item, which addresses severity of simulator sickness in three sub-factors: disorientation, nausea, and oculomotor discomfort (Kennedy et al., 1993). Total scores of the overall and each sub-factor can be associated with negligible (<5), minimal (5–10), significant (10–15), concerning (15–20), and bad (>20) symptoms (Stanney et al., 1997).
2.5 Procedure
Upon arriving at the lab and providing consent, participants were given a Microsoft HoloLens 2 device and asked to adjust the fit until it remained securely on their head. They then completed the eye calibration and interactive tutorial for various hand-tracking interactions on the HoloLens 2 prior to engaging in the assigned experimental tasks. The tutorial encompassed the use of direct touch and air tap for several interactions, including selecting or clicking, grabbing, rotating, and resizing or scaling virtual objects. The HoloLens 2 was reset between participants to ensure a uniform starting environment for each participant, including the size and distance at which 3D objects and windows were displayed. Complying with IRB requirements, participants were informed that participation in this study was entirely voluntary and were encouraged to take the headset off and take a break or decide to terminate their participation at any time if they started to experience any discomfort.
Participants were presented with the prompt that they were going to create and work in an AR space through a series of 16 task scenarios (see Supplementary Table S1, S2). No time limit was established to complete the tasks, and participants were encouraged to use the entire lab space (22 × 13 sq. ft.) to position the virtual elements as desired. While conducting each task, participants were asked to verbalize their thoughts, including both positive and negative, using the think-aloud method to gain a greater understanding of the strengths and weaknesses of their interactions in the AR environment. Participants also were informed that they were allowed to move around, sit or stand, rearrange their AR space, and interact with the elements using any hand-tracking interaction they wanted. Some possible interactions included selecting/clicking, scrolling, rotating, resizing, and grabbing to move virtual windows and objects using direct touch, air tap, or both as they worked through the tasks (see Supplementary Table S1, S2 for the list of task scenarios, hand-tracking interactions, and a demonstration video). In addition, participants were allowed to request verbal assistance from the researchers if they struggled and felt that completing a certain task would be impossible. The researchers observed their actions and performance in real-time on a television screen using screen mirroring.
After each task, participants verbally rated the perceived task difficulty on a scale of 1 (very difficult) to 10 (very easy) and stated their rationale behind the selected rating. Upon completion of all the tasks, participants took the headset off and completed a set of questionnaires, including demographic, SUS, UEQ, NASA-RTLX, and SSQ. Finally, participants provided open-ended user feedback pertaining to the learnability and intuitiveness of the hand-tracking interactions from the tutorial and their overall experience with the AR space. They were then debriefed, thanked for their time, and compensated. The study took approximately 75 min per participant to complete.
2.6 Data analyses
2.6.1 Qualitative data
Inductive thematic analyses were conducted to analyze think-aloud and user feedback data. Researchers carefully read through and performed inductive coding on datasets before collaboratively generating a detailed description of user insights. In addition, researchers iteratively discussed agreements and disagreements to minimize the reflexivity effects on data interpretation.
2.6.2 Quantitative data
Statistical analyses were conducted to examine the differences in perceived difficulty between tasks and between subscales in perceived workload. Due to a few instances of normality violation (Shapiro-Wilk test), a non-parametric Friedman test of differences was used.
3 Results and discussion
3.1 Qualitative observation and user feedback
When setting up the AR space, participants tended to group application windows based on their type (e.g., work-related versus entertainment-related), reflecting their behavior and mental models in the physical world. However, participants universally experienced difficulty in grabbing and moving virtual windows. In addition, participants tended to only attend to the window presented in front of them and nothing else outside of their primary field of view, such as a notification on another screen.
Results from the think-aloud method revealed that participants experienced difficulties related to accuracy with selecting or grabbing, scrolling, using the dictation feature, and bringing up the keyboard to type. In particular, participants expressed difficulty to grab or select small-sized virtual elements from afar, indicating that close-interaction or direct touch provided more apparent feedback and most resembled selecting on a touch-based interface. Conversely, performing interactions from afar did not require large physical movements and, thus, it was perceived as less tiring. Participants showed confusion when trying to scroll as they expected the hand-tracking interaction to be similar to scrolling on a laptop trackpad instead of on a touchscreen device. The dictation feature lacked intuitive feedback to let the user know when the audio recording had started and ended, as well as the lack of recognition of different accents and dialects. Participants’ perceptions and speculations upon completion of tasks in the AR space are presented in Table 1, while a depiction of the most problematic interactions is portrayed in Table 2.
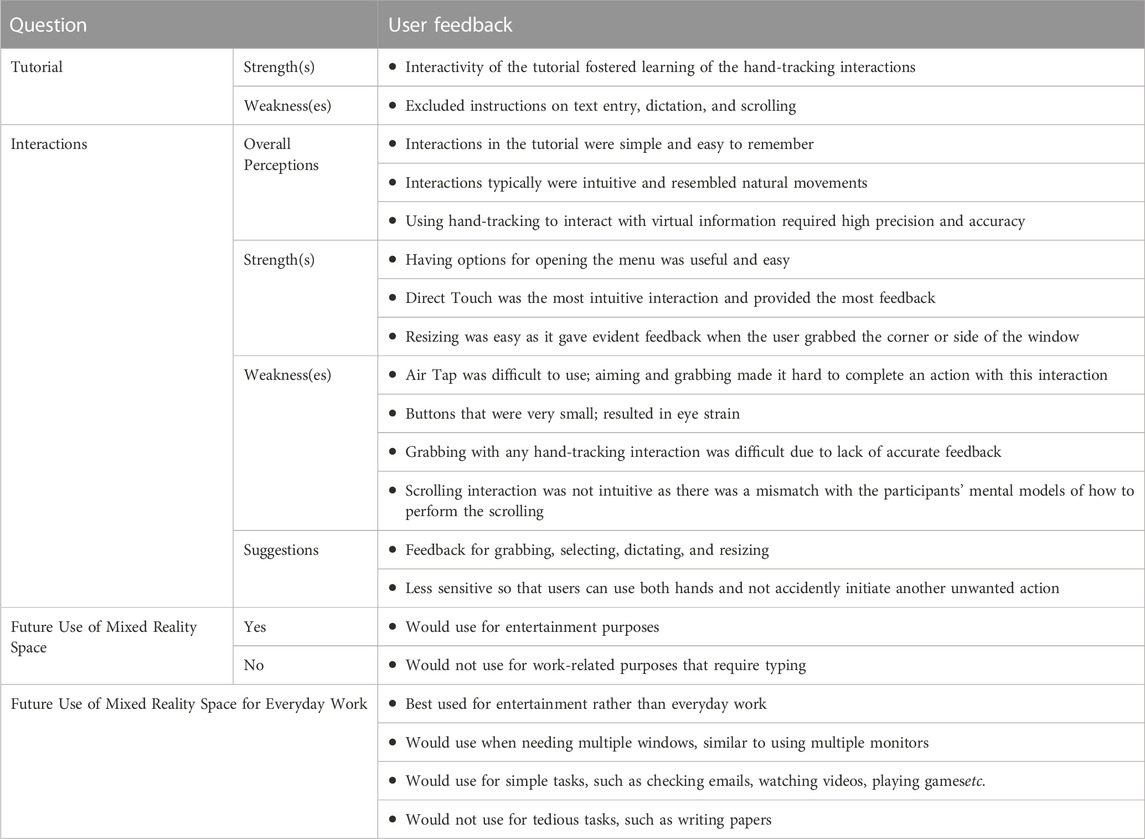
TABLE 1. Major themes of qualitative user feedback.
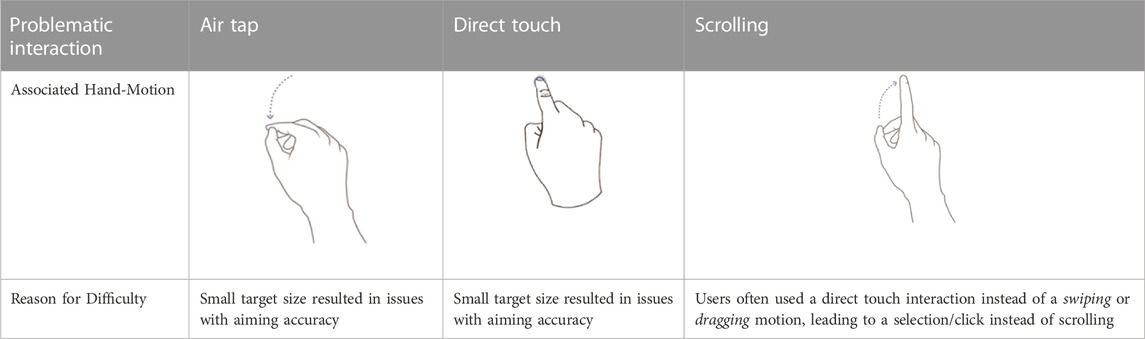
TABLE 2. Hand-tracking interactions: Most problematic.
3.2 Task success and number of attempts
Participants completed 8 out of 16 tasks with a 100% success rate, while the remaining 8 tasks, including moving windows, selecting a tiny-sized button, scrolling on a window, resizing 3D objects and windows, bringing up the keyboard to type, using dictation feature, and rotating 3D objects had partial successes. The task that involved scrolling was the least successful (success, n = 10; partial success, n = 9; failure, n = 1). Similarly, 15 out of 16 tasks were completed with more than one attempt by at least one participant. Interacting with the game simply by touching or selecting on the window interface was the only task that every participant completed on their first attempt.
3.3 Perceived task difficulty
Significant differences were found in the perceived task difficulty, X2 (15) = 124.05, p < .01, across tasks. Post hoc paired comparisons revealed that the most difficult tasks were moving and arranging virtual windows (M = 7.67, SD = 1.59); accurately selecting a small button (M = 7.90, SD = 1.68); scrolling on a virtual window (M = 6.35, SD = 2.52); displaying a virtual keyboard to type (M = 6.90, SD = 2.47); and dictating text (M = 7.25, SD = 2.36). These results are consistent with qualitative feedback related to difficulty in tasks such as the setup of the space, selecting small virtual targets, scrolling, bringing up the keyboard when typing, and lack of feedback in the dictation feature.
3.4 Perceived usability (SUS)
The average perceived usability score (SUS) of working in the AR space (M = 71.25, SD = 18.02) was considered “good” and assigned the grade “C+”, falling between the 60th–64th percentiles, as outlined in the benchmark rating (Lewis and Sauro, 2018). This indicates potential for further improvement in the AR space usability.
3.5 Subjective user experience (UEQ)
The UEQ demonstrated positive results across all constructs. Based on the benchmark (Schrepp et al., 2017), both stimulation (M = 1.84, SD = 0.71) and novelty (M = 2.19, SD = 0.75) were considered excellent, while attractiveness (M = 1.73, SD = 0.88) was deemed good, dependability (M = 1.34, SD = 0.82) was above average, perspicuity (M = 1.15, SD = 0.96) was below average, and efficiency (M = 0.45, SD = 1.40) was considered bad (Figure 1). There was a significant difference between the six constructs, F(5, 114) = 8.34, p < .001, np2 = 0.27. A post hoc pairwise comparison revealed that efficiency was rated lower than perspicuity (p = .009) as well as all other constructs (p < .001) and that perspicuity was significantly lower than attractiveness, stimulation, and novelty, p < .001. These findings suggest that participants were pleased by the AR space and felt somewhat in control of the interaction. They found the AR space to be exciting and motivating due to its innovation and creativity. However, participants felt that solving some tasks required excessive effort and experienced slight difficulty in learning to navigate and familiarizing themselves with the space, reflected in significantly lower scores in efficiency and perspicuity.
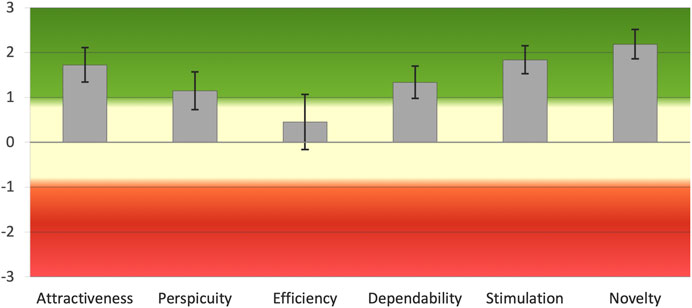
FIGURE 1. Comparison of average subjective user experience constructs. Error bars represent ± 1 standard error. Efficiency demonstrated significantly lower scores compared to all other constructs, p < .01. Perspicuity was significantly lower than attractiveness, stimulation, and novelty constructs, p < .001.
3.6 Perceived workload (NASA-RTLX)
Significant differences were found across the NASA-RTLX subscales, X2 (5) = 32.53, p < .01 (Figure 2). Post hoc paired comparisons revealed that mental demand (M = 9.65, SD = 4.90) was significantly higher than physical demand (M = 5.15, SD = 3.50), p = .001; temporal demand (M = 4.55, SD = 3.72), p = .003; performance (M = 5.25, SD = 3.74), p = .008; and frustration (M = 6.35, SD = 4.79), p = .03. There was no significant difference between mental demand and effort (M = 8.50, SD = 5.29), p = 1.00. Additionally, effort was significantly higher than physical demand (M = 5.15, SD = 3.50), p = .047, and temporal demand (M = 4.55, SD = 3.72), p = .028. Completing tasks in an AR space was perceived as more mentally demanding and effortful due to the cumbersome nature of some interactions.
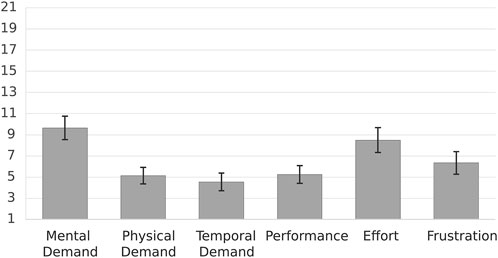
FIGURE 2. Comparison of average perceived workload subscales. A higher score indicates a more demanding experience. Error bars represent ± 1 standard error. With the exception of effort, mental demand exhibited notably significantly higher scores compared to other subscales, p < .05. Effort also showed significantly higher scores than physical demand and temporal demand, p < .05.
3.7 Simulator sickness (SSQ)
The 50-min use of the AR headset in the study led to concerning levels of overall simulator sickness symptoms (M = 18.51, SD = 16.48), with significant levels of nausea (M = 11.93, SD = 12.71) as well as disorientation (M = 23.66, SD = 36.16) and oculomotor discomfort (M = 27.29, SD = 22.59) being classified as bad (Stanney et al., 1997). Despite employing different tasks, this is in line with a previous study (Sinlapanuntakul P. et al., 2022), which found similarly concerning levels of simulator sickness symptoms (M = 18.14, SD = 13.69) among participants (N = 20) using the Microsoft HoloLens 2 for 40 min. These results suggest that the duration of an AR device use may be a major contributor to the development of simulator sickness, even without verbal feedback of frustrations or discomfort caused by it (Stanney et al., 1997).
4 Conclusion and future works
The study investigated the user experience and perceptions of hand-tracking interactions with multiple objects and application windows for a range of tasks in the AR space using the native Microsoft HoloLens 2 as a testbed. Results suggest that interactions that resemble natural movements and provide feedback facilitate ease of use, leading to higher performance accuracy. In contrast, the most difficult interactions included scrolling, bringing up the keyboard for text input, aiming/selecting, and grabbing and moving virtual windows mainly due to a lack of perceived feedback and intuitiveness. Dictation issues and physical side effects were also problematic, all of which represent a need for recommendations for future designs. Design guidelines for future interaction development are discussed below.
Scrolling. To enhance scrolling interaction, a visible scroll bar on the right side of the window can be provided, ensuring easy access and accurate touch input. In addition, a 2-finger scrolling interaction can be implemented within the window body, allowing users to navigate content effortlessly. This interaction style can be incorporated into the interactive tutorial to further assist users in becoming comfortable with scrolling.
Text Input. Improvements for text input functionality include adding an interaction to easily display or hide the virtual keyboard and incorporating a “Keyboard” dictation feature with a prominent keyboard icon on the main menu for better accessibility, control, and ease of use.
Aiming/Selecting/Grabbing. To enhance aiming, selecting, and grabbing, visual and auditory feedback can be enriched to provide clear indications of successful actions, which will provide confidence in performing interactions. A “Zoom” dictation feature or the ability to zoom in and out using one or both hands can also be considered for a more intuitive interface.
Interaction Feedback. Interaction feedback can be improved by enhancing clearer audio and visual cues across all interactions to provide better understanding of own actions and outcomes. Further, aligning the sensitivity of interactions with human actions will ensure that the system’s responsiveness and timing meet user expectations. With these improvements, interactions will result in a more engaging, supporting, seamless, and satisfying user experience.
Physiological Effects. To address the potential physiological effects experienced when using these headset devices, visually emphasizing the nearest virtual window and creating an interaction to view all windows in a gallery can aid in multitasking, easy navigation, and quick identification of active focus. Allowing users to bring windows to the forefront or send them to the background provides greater control over the AR space. Also, including suggestions for recommended AR device usage time and promoting healthy habits through subtle notifications within the user’s field of view will further enhance efficiency, safety, usability, and user wellbeing when using AR devices.
4.1 Limitations
This study was conducted in a controlled lab setting with direct observations from the researchers, which may have influenced participants’ behaviors. The participants were exclusively college-aged (M = 22.40, SD = 3.09), and the results may not be generalizable to other age groups, such as children, older-aged, or other populations who may be less familiar with reality-enhanced technology. Moreover, this study was conducted using only the Microsoft HoloLens 2 device.
4.2 Future research
Future research should assess a wider range of tasks across multiple domains, such as medicine/surgery, architectural planning, and engineering, among others to better understand the potential use of AR technology for future improvement and effectiveness of work attuned to specific needs in each domain. Investigating the user experience and perceptions with AR technology across a variety of demographics and backgrounds can help to design features that promote inclusivity. Furthermore, the comparison of the hand-tracking interactions across different AR headsets with similar tasks should be evaluated. In particular, future research should pay close attention to how the enhancement of audio and/or visual feedback as a supplement to haptic feedback as well as of the system sensitivity can promote more intuitive and naturalistic interactions.
Data availability statement
The datasets presented in this study can be found in an online repository. The name of the repository and accession link can be found here: Open Science Framework (https://osf.io/e3u4n).
Ethics statement
The study involving human participants was reviewed and approved by Embry-Riddle Aeronautical University’s Institutional Review Board (IRB). The participants provided their written informed consent to participate in this study.
Author contributions
PS and BC contributed to the conceptualization and research design of this study. PS was responsible for the IRB, participant recruitment, data curation, and quantitative statistical analysis. PS and JK led the data collection, performed qualitative analysis, and wrote sections of the manuscript. BC supervised the formal analysis. All authors contributed to the article revisions and approved the submitted version.
Funding
This research was partially supported by the Internal Research Grant from the Office of Undergraduate Research at Embry-Riddle Aeronautical University, Daytona Beach, FL.
Acknowledgments
The authors would also like to thank Katlyn Skilton and Aaron Collard for their assistance in facilitating and taking notes in some of the data collection sessions.
Conflict of interest
The authors declare that the research was conducted in the absence of any commercial or financial relationships that could be construed as a potential conflict of interest.
Publisher’s note
All claims expressed in this article are solely those of the authors and do not necessarily represent those of their affiliated organizations, or those of the publisher, the editors and the reviewers. Any product that may be evaluated in this article, or claim that may be made by its manufacturer, is not guaranteed or endorsed by the publisher.
Supplementary material
The Supplementary Material for this article can be found online at: https://www.frontiersin.org/articles/10.3389/frvir.2023.1194019/full#supplementary-material
References
Cho, J., Kim, S., Kim, N., and Kang, S. (2022). Development of a remote collaboration system for interactive communication with building information model in mixed reality. Appl. Sci. 12 (17), 8738. Article 8738. doi:10.3390/app12178738
Ekren, G., Oberer, B., and Erkollar, A. (2017). Augmented reality in Industry 4.0: Enabling technologies and the potential for SMEs. Int. Symposium Prod. Res. 9 (17), 1–3.
Graichen, L., Graichen, M., and Krems, J. F. (2019). Evaluation of gesture-based in-vehicle interaction: User experience and the potential to reduce driver distraction. Hum. Factors 61 (5), 774–792. doi:10.1177/0018720818824253
Grier, R. A. (2015). How high is high? A meta-analysis of NASA-TLX global workload scores. Proc. Hum. Factors Ergonomics Soc. Annu. Meet. 59 (1), 1727–1731. doi:10.1177/1541931215591373
Hart, S. G. (2006). NASA-task Load Index (NASA-TLX); 20 years later. Proc. Hum. Factors Ergonomics Soc. Annu. Meet. 50 (9), 904–908. doi:10.1177/154193120605000909
Hart, S. G., and Staveland, L. E. (1988). Development of NASA-TLX (task Load Index): Results of empirical and theoretical research. Adv. Psychol. 52, 139–183. doi:10.1016/S0166-4115(08)62386-9
Kennedy, R. S., Lane, N. E., Berbaum, K. S., and Lilienthal, M. G. (1993). Simulator Sickness Questionnaire: An enhanced method for quantifying simulator sickness. Int. J. Aviat. Psychol. 3 (3), 203–220. doi:10.1207/s15327108ijap0303_3
Knierim, P., Kosch, T., Groschopp, J., and Schmidt, A. (2020). “Opportunities and challenges of text input in portable virtual reality,” in Extended abstracts of the 2020 CHI conference on human factors in computing systems, 1–8. doi:10.1145/3334480.3382920
Knierim, P., Kosch, T., and Schmidt, A. (2021). The nomadic office: A location independent workspace through mixed reality. IEEE Pervasive Comput. 20 (4), 71–78. doi:10.1109/MPRV.2021.3119378
Laugwitz, B., Held, T., and Schrepp, M. (2008). Construction and evaluation of a user experience questionnaire. Symposium Austrian HCI Usability Eng. Group 5298, 63–76. doi:10.1007/978-3-540-89350-9_6
Lewis, J. R., and Sauro, J. (2018). Item benchmarks for the system usability scale. J. Usability Stud. 13 (3), 158–167. Available at: https://uxpajournal.org/item-benchmarks-system-usability-scale-sus.
Microsoft (2023). HoloLens 2. Available at: https://www.microsoft.com/en-us/hololens.
Park, S., Bokijonov, S., and Choi, Y. (2021). Review of Microsoft HoloLens applications over the past five years. Appl. Sci. 11 (16), 7259. Article 7259. doi:10.3390/app11167259
Pavanatto, L., North, C., Bowman, D., Badea, C., and Stoakley, R. (2021). “Do we still need physical monitors? An evaluation of the usability of AR virtual monitors for productivity work,” in 2021 IEEE virtual reality and 3D user interfaces (VR), 759–767. doi:10.1109/VR50410.2021.00103
Rauschnabel, P. A., Felix, R., Hinsch, C., Shahab, H., and Alt, F. (2022). What is XR? Towards a framework for augmented and virtual reality. Comput. Hum. Behav. 133, 107289. doi:10.1016/j.chb.2022.107289
Schrepp, M., Thomaschewski, J., and Hinderks, A. (2017). Construction of a benchmark for the user experience questionnaire (UEQ). Int. J. Interact. Multimedia Artif. Intell. 4 (4), 40–44. doi:10.9781/ijimai.2017.445
Shelstad, W. J., Benedict, J. D., Smith, J. K., Momo, T., Guliuzo, J. D., Reuss, N. R., et al. (2019). User experience evaluation of the Microsoft HoloLens for student-related tasks [Poster presentation]. Orlando, FL: Human Factors and Applied Psychology Student Conference.
Sinlapanuntakul, P., Skilton, K. S., Mathew, J. N., and Chaparro, B. S. (2022). The effects of background noise on user experience and performance of mixed reality voice dictation. Proc. Hum. Factors Ergonomics Soc. Annu. Meet. 66 (1), 1028–1032. doi:10.1177/1071181322661376
Sinlapanuntakul, W. “Pitch”, Derby, J. L., and Chaparro, B. S. (2022). Understanding the effects of mixed reality on video game satisfaction, enjoyment, and performance. Simul. Gaming 53 (3), 237–252. doi:10.1177/10468781221094473
Keywords: augmented reality, mixed reality, hand-tracking interaction, user experience, user performance, gestures
Citation: Sinlapanuntakul P, Korentsides J and Chaparro BS (2023) Exploring the user experience (UX) of a multi-window augmented reality environment. Front. Virtual Real. 4:1194019. doi: 10.3389/frvir.2023.1194019
Received: 26 March 2023; Accepted: 21 July 2023;
Published: 02 August 2023.
Edited by:
Giacinto Barresi, Italian Institute of Technology (IIT), ItalyReviewed by:
Henrique Galvan Debarba, Aalborg University Copenhagen, DenmarkFederico Manuri, Polytechnic University of Turin, Italy
Copyright © 2023 Sinlapanuntakul, Korentsides and Chaparro. This is an open-access article distributed under the terms of the Creative Commons Attribution License (CC BY). The use, distribution or reproduction in other forums is permitted, provided the original author(s) and the copyright owner(s) are credited and that the original publication in this journal is cited, in accordance with accepted academic practice. No use, distribution or reproduction is permitted which does not comply with these terms.
*Correspondence: Pitch Sinlapanuntakul, d3NwaXRjaEB1dy5lZHU=