 Markku Kilpeläinen
 Jukka Häkkinen
- Department of Psychology and Logopedics, University of Helsinki, Helsinki, Finland
Reading is a crucial aspect of the extended reality (XR) experience across various professional and recreational contexts. Legibility, which is defined as the ease with which a character can be recognized, is an essential determinant of readability. As legibility on a specific device cannot be deduced from technical specifications alone, an efficient perceptual method for measuring legibility is needed to measure the legibility of text presented in XR. In this study, we present a method for comparing the legibility limits of XR devices, where single letter legibility is measured with fast and precise psychophysical methods. We applied the method to compare the legibility in three commercial XR headsets (Varjo VR-2, HTC Vive Pro Eye, Oculus Quest 2) in experiments with human observers. Our results show that the single letter legibility methods presented here provide an effect size approximately ten times higher compared to the widely used method of reading speed. This allows for the use of fewer observers and the detection of smaller differences, making it a more efficient and effective approach for comparing the legibility limits of XR devices.
1 Introduction
Extended reality devices (XR) are increasingly common in professional and recreational settings, where reading text is a relevant part of the user experience (Burova et al., 2020; Kim et al., 2020; Osorto Carrasco and Chen, 2021). However, a major limitation of XR headsets is that reading with them is slower (Baceviciute et al., 2021; Rau et al., 2021), requires more mental effort (Baceviciute et al., 2021), and causes more eye strain (Pölönen et al., 2012) than reading from direct view displays or paper.
The readability of text can be affected by various factors, including text size (Paterson and Tinker, 1929), contrast (Ginsburg, 1978; Legge et al., 1987), line spacing (Paterson and Tinker, 1932; Chung, 2004), line length (Luckiesh and Moss, 1939; Nanavati and Bias, 2005), text complexity (Just and Carpenter, 1980), and even the emotional valence of the text (Arfé et al., 2022). Legibility, which is defined as the ease with which a character can be recognized (Sheedy et al., 2005), is an especially important determinant of readability, and is experimentally measured by determining the recognition threshold for a letter. In previous studies, it has been found that letter size is an important determinant of legibility, but typeface and letter spacing also play a role (Attneave and Arnoult, 1956; Pelli et al., 2006; Legge and Bigelow, 2011; Bigelow, 2019). The benefit of serifs in the typeface has been researched extensively, but the results have been somewhat inconclusive (Tarasov et al., 2015). Other factors affecting legibility are contrast (Luckiesh and Moss, 1939), viewing distance (Sanford, 1888), viewing time (Cattell, 1885), and sharpness of the letters (Weiss, 1917).
Although the legibility of text on digital displays is to a great extent determined by the same factors as printed text, there are some additional factors that need to be considered. The resolution of digital displays can be limited, which can impede letter recognition because the sampling frequency of the display cannot convey all the relevant information. This results in pixelation, broken letters, and lost letter parts, which may lead to reduced reading speed (Ziefle, 1998) and legibility thresholds that are higher than with paper. For example, Hoffmann et al. (2019) showed that the legibility threshold for high contrast letters on a 13.8 ppd display was 45 arc minutes and comfort limit of 70.2 arc minutes (see also Erdmann and Neal, 1968; Wright et al., 1999). That is substantially higher than the thresholds measured under conditions where the display resolution closely resembles that of print on paper (Arditi and Cho, 2005; Legge and Bigelow, 2011). Subpixels can also significantly affect legibility even when the resolution remains the same. This means that nominal resolution is not necessarily equivalent to the effective resolution (Hoffman et al., 2019), further complicating the situation.
Displaying text in XR devices leads to further complexities that need to be considered. One factor that can contribute to reduced legibility is world-referencing. This technique stabilizes text relative to the real world and re-renders it for each frame based on the user’s head movements. As a result, the text moves along the pixel grid, causing the sampling artifacts to change over time. Consequently, the effective resolution of the display is lower than the nominal resolution, requiring oversampling to achieve sufficient legibility (Hoffman et al., 2019). Moreover, the text is rarely frontoparallel in XR, which further complicates letter identification (Solum, 2019; Büttner et al., 2020). The recommended text sizes for comfortable reading in XR have been larger than with conventional displays, with values such as 1.375° suggested (Designing Screen Interfaces for VR, Google I/O ’17, 2017). Solum (2019) recommends 21–23 dmm (1.2–1.3 deg) for comfortable reading and 14–16 (0.8–0.92 deg) for minimum size, while Dingler et al. (2018) recommend 1.8° for comfortable reading.
In summary, the legibility of text presented on displays, particularly XR displays, can be degraded by various technical factors, such as pixelation, motion, and subpixel arrangement. As a result, it is not possible to accurately predict the legibility based solely on display specifications such as spatial resolution or contrast ratio. Additionally, content creators often use various typefaces, colors, and orientations, which further complicates legibility. Therefore, testing with human observers specific to the device and use context is necessary.
Several methods have been proposed for evaluating reading in XR. One of the most reasonable ways is to measure reading rate, i.e., how many words can be read per minute (Sheedy and Bergstrom, 2002). However, it is also important to consider individual differences in reading ability and the strategies the observer adopts during experiments (Brysbaert, 2019), as these can increase the variability of the results. This necessitates the use of large participant groups, screening for any reading or learning difficulties, and establishing a baseline reading rate before testing any device. These procedures may complicate the experiment and increase the required experimentation time.
Hoffmann et al. (2019) proposed a tuning method in which participants gradually increase the size of letters until they perceive the text as barely legible and then further until it becomes comfortable to read. The method appears fast and intuitive, but introduces the possibility of subjective criteria, which may increase variation in the results (Dingler et al., 2018). For instance, Solum (2019), reported that some experiment participants gave feedback that they were unsure about what the text being legible meant when asked to subjectively evaluate the legibility of the text. Similarly, Pastoor (1990) and van Nes (1984) have noted that preference and legibility are not always correlated.
In this study, we present an efficient method for measuring legibility in XR devices and test it by comparing the legibility of text displayed on three VR headsets (Varjo VR-2, VIVE Pro Eye, and Oculus Quest 2). Our method is based on the findings of Pelli et al. (2003), who showed that letter identification is limited by the amount of contrast energy present in the stimulus. This means that legibility is a critical factor in reading, as it determines how much visual information is available to the reader. Pelli et al. (2003) also showed that word identification is not more efficient than letter identification, and that words cannot be recognized as holistic units, but rather are recognized by identifying the component letters. Therefore, legibility and the ability to identify individual letters are crucial for efficient reading, and a legibility experiment can be used to determine letter recognition thresholds that can be generalized to readability.
Our results show that the method for determining legibility is reliable, providing consistent results with a small number of observers within a short experimental session. The results are in agreement with reading speed measurements, but with a vastly superior effect size. Overall, these findings suggest that the proposed method can be a valuable tool for assessing legibility in XR devices and in making readability-related design choices with different display types.
2 Materials and methods
2.1 The single letter legibility method
In this study we suggest that the measurement of single letter legibility is a viable methodological framework for comparing legibility across XR settings. As an example case, we demonstrate its effectiveness by comparing legibility allowed by three different VR headsets. The main components of the methodological framework are the following.
Firstly, we present the use of single letters as a proxy of word legibility. This suggestion is based on the finding of Pelli et al. (2003), that word recognition on conventional displays can be very well predicted by the recognition of its single letter components. The main benefit of this approach is that it simplifies the stimulus set, thus reducing measurement noise due to stimulus set variability and observer literacy level, for example.
Secondly, we measure the legibility thresholds with a highly objective forced choice procedure. When the observer has to choose a response alternative in every trial, they cannot shift their decision criterion from trial to trial, which reduces measurement noise caused by speed–accuracy tradeoffs and other decision criterion fluctuations (Vaegan and Halliday, 1982). In their legibility study, Pelli et al. (2003) had the observer choose the correct answer from all possible letters of the alphabet. We modified the task such that the observer chose from only four alternatives, making the task more suitable to an observer wearing a VR headset. Pilot experiments revealed that it is quite easy for observers to keep fingers on four response keys without seeing the keys (see Section 2.5 Procedure for details).
Thirdly, we combine the forced choice task with an adaptive staircase method (Cornsweet, 1962; Wetherill and Levitt, 1965). In comparison to the method of constant stimuli (MOCS), where predetermined stimulus levels are repeated multiple times, the adaptive staircase is usually more time efficient. This is because the stimulus intensities that are always or never identified are rarely shown and the presented stimulus levels converge near the stimulus threshold values (see Figure 2B). As a result, the method is particularly useful when dealing with a large number of inexperienced participants, which is often the case in XR research. Out of the many adaptive methods, we here chose the simple staircase method, as it involves minimal assumptions regarding the expected stimulus to perception function (see Leek, 2001). Further, both the measurement and the data analysis are very straightforward, facilitating the use of the method for users with little previous experience with psychophysical methods. In our experiments the stimulus level was decreased by Δ after a correct response and increased by 2Δ after an incorrect response. This has been shown to lead to more stable results than a symmetric up-down rule (García-Perez, 2011). This does not make the experiments or analysis more complex, and can readily be changed by the experimenter using our implementation.
We implemented the above-described methodology in the extremely popular Unity environment, which had not (to our knowledge) been previously done. The Unity project with all the code is available in an OSF repository: https://osf.io/8ekta/. A user can get started with the staircase experiments simply by pressing the Play mode button. The main parameters (type of experiment, starting stimulus level, step size etc.,) can easily be changed in the graphical user mode. Instructions for creating a trial table necessary for the MOCS experiments are also provided in the repository.
2.2 Observers
A total of 29 observers (age 19–40 years (mean 23.9 years), 16 women, 13 men) were included in the study. The observers received vouchers for cultural or sport activities for their participation. The study adhered to the principles of the Declaration of Helsinki and was considered ethically acceptable by the Ethics Review Board in the Humanities and Social and Behavioural Sciences of the University of Helsinki. Observers signed written informed consent forms prior to participation. Before the VR experiments, the observers' visual acuity and stereoacuity were tested. Visual acuity was tested with the Lea numbers acuity test and required to be at least 0.5 (20/40) in each eye. Screening for stereovision was done by requiring that the observers correctly pass the first two plates of the TNO test for stereoscopic vision. Our pilot experiments suggested that the legibility experiments’ results are significant within individual observers. Thus, we expected effect size to be high. We therefore conducted power analysis (with R WebPower package) with values f = 0.4, α = 0.05, and power = 0.8, which indicated a required sample size of 21.
2.3 Stimuli
The stimuli were created and presented using Unity 2019.3.14 (Unity Technologies, San Francisco, CA). Text was created using the TextMeshPro 2.0.1 package. Verdana font was used in all experiments. The font size in visual angle was determined by matching the height of different-sized letters to squares, for which the size was known in the same units as the distance of the observer from the letters. To calculate the angular subtense, we used the formula
In the legibility experiment, the stimulus was a single uppercase letter. The letter could be any letter from the standard English alphabet, except I or J. To avoid a floor effect in observer thresholds, a general increase in thresholds was introduced by embedding the target letters in a white noise background (see Figure 1). The white noise patterns had a nominal RMS contrast of 0.32. The noise patterns were generated with Matlab 2021b (MathWorks, Natick, MA) and saved as jpg-files to be applied as material on the background wall.
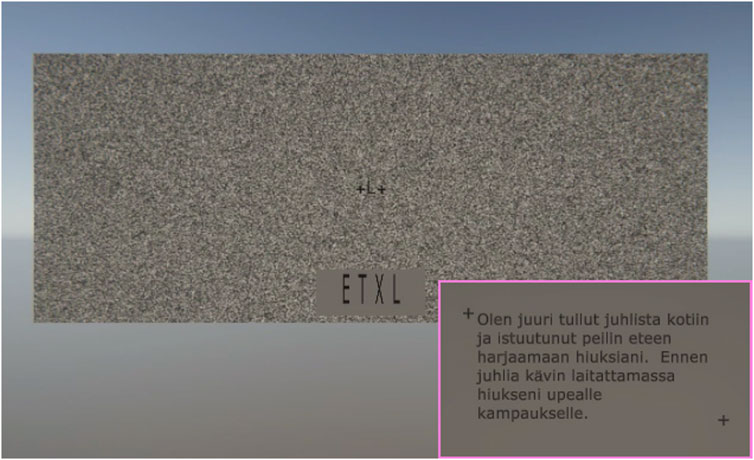
FIGURE 1. Example of the stimulus view. The main image represents the view seen by the observer. The target letter (L) appears between the cross-hairs. Observe that in the experiments, the four response alternatives always appeared after the target letter had disappeared. See also Supplementary Video S1. The inset shows a single text display shown in the reading experiment.
In the reading speed experiment, the stimuli were short stories from the IDEST database (Kaakinen et al., 2022), presented in the Finnish language. We chose 30 stories, ranging in valence from neutral to positive. Those 30 stories were divided into two sets, with 15 stories presented using each of the two devices with eye tracking capabilities (Varjo VR-2 and VIVE Pro Eye). The stories were uniquely divided between the devices for all observers. However, the average valence rating, comprehensibility index (of the English version), and number of characters were always closely matched between the two sets. Finally, the presentation order of the stories was randomized within each observer and device.
2.4 Apparatus
Three different VR headsets were used. The headsets and their main specifications are provided in Table 1. Each headset was linked to a computer with a GPU that clearly surpassed the headset’s performance requirements. The order of wearing the headsets was interleaved and counterbalanced across observers.
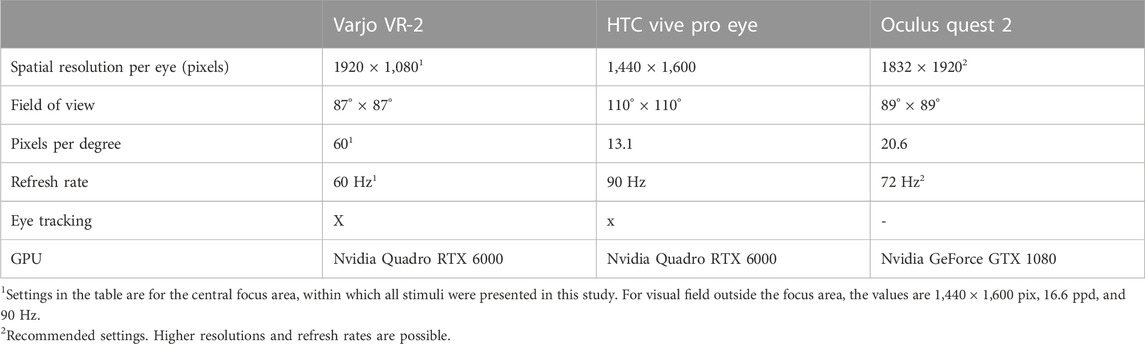
TABLE 1. Technical specifications of the devices compared.
2.5 Procedure
In all experiments, the observers saw a short section of a wall in front of them (see Figure 1), on which stimuli were presented. In the legibility experiment, the wall was covered with a white noise pattern (which changed from trial to trial). In the reading speed experiment, the wall was homogeneously gray. Head tracking was on, so that head movements led to changes in the visual scene, but observers’ head motion was minimized with a chin rest. Eye tracker calibration was conducted for the Varjo and HTC devices at the beginning of each experiment (legibility or reading), as well as after device change.
The legibility experiment began with two cross-hairs appearing centrally on the wall. When ready to begin, the observer started the experiment by pressing space. Upon their doing so, a single uppercase letter was presented between the cross-hairs for a duration of 200 ms. After that, four alternatives (one of them the correct one) appeared near the bottom of the wall and the observers’ task was to indicate with a key press which of the letters they had seen. There was a direct spatial mapping between the alternatives on the screen and the keys. For example, if the observer wanted to choose the leftmost alternative (“E” in the example of Figure 1), they pressed the leftmost of the four response keys. The task was thus very easy to perform without seeing the response keys. The response initiated the next trial.
Three versions of the legibility experiments were conducted, with the first two involving changes to the size of the letter and the third involving changes to the contrast of the letter. In the method of constant stimuli (MOCS) version of the legibility experiment, stimulus levels (font size) changed pseudorandomly between trials. Each block of trials consisted of 70 trials, with 10 repetitions of 7 different intensity levels. In the staircase version of the font size experiment, correct responses led to a 1-unit decrease in font size, and incorrect responses led to a 2-unit increase. In the staircase contrast experiment, corresponding changes were made to letter contrast, keeping font size constant. The block of trials ended after 12 staircase reversals, i.e., reversals of stimulus change direction (generally after about 30 trials). Font size thresholds were always measured before contrast thresholds. The font size used in the contrast measurements was set at 1.5 x each observer’s font size threshold. Contrast was varied by changing the opacity value of the letter object.
The reading speed experiment began with two cross-hairs appearing on the wall, indicating the top left and bottom right corners of the area where the text sections would be displayed. When the observer was ready to begin, they pressed the space bar. The first section of text then appeared and the observer began reading (inset in Figure 1). Each section consisted of 1-2 sentences. The observer was instructed to read as quickly as possible, while also ensuring comprehension, and to press the space bar immediately upon reaching the end of each section. This triggered the appearance of the next text section, until 5–8 such sections had been read and the story reached its end. At that point, the observer could take a short break, while remaining seated with their head on the chin rest, before proceeding to the next story. Each observer read 2-3 stories before the device was changed. The font size used in the experiment was equal to the observer’s font size threshold, but as there was no noise background, the font was quite easily legible.
2.6 Eye tracking
The reading speed experiment relied partly on eye tracking. Both the Varjo VR-2 and the VIVE Pro Eye have integrated eye trackers and automated calibration procedures. We used the standard calibration procedures for the actual calibration of the eye trackers. However, since the standard calibration procedures do not offer any estimate of tracking precision, we always conducted our own precision test after the standard calibration. First, nine circular target stimuli were shown, one at a time, in random order, and the observer was instructed to carefully fixate each, and press space while doing so. Upon the pressing of the space bar, the target started fading, but observers were instructed to keep fixating the target until it had completely disappeared (in 333 ms). The average gaze direction (over 100 ms after space bar pressing), as reported by the tracker, was saved. The procedure was then repeated (with the same target locations, but appearing in a different order), and the difference between the gaze directions in the nine target locations provided the estimate of eye tracker precision. We required an average error smaller than 0.7° and maximum error smaller than 1.3° to allow the actual experiment to continue, but we saved all calibration results and have included them in the analysis here. Each observer’s average precision was calculated as an average of the mean errors over several (mean 12.6) repetitions of the precision test. Test runs with a very large maximum error (>5 deg) were not included, as they are likely to indicate something other than tracker precision (e.g., suboptimal headset placement or observer inattention).
Figure 2A shows the average precision with Vive and Varjo devices for 27 observers. The data points in Figure 2A show that the average precision is generally higher with the Varjo VR-2 device, as most points lie above the diagonal line. This difference in precision is statistically significant (Wilcoxon test: z = 3.58, p < 0.001). Because the precision of the two devices is clearly dissimilar, we did not rely on traditional eye tracking measures for our reading speed experiment analysis. Instead, we analysed the average reading time per section of text (1-2 sentences), which relied only on determining the time that the gaze moved to the first line of each text section.
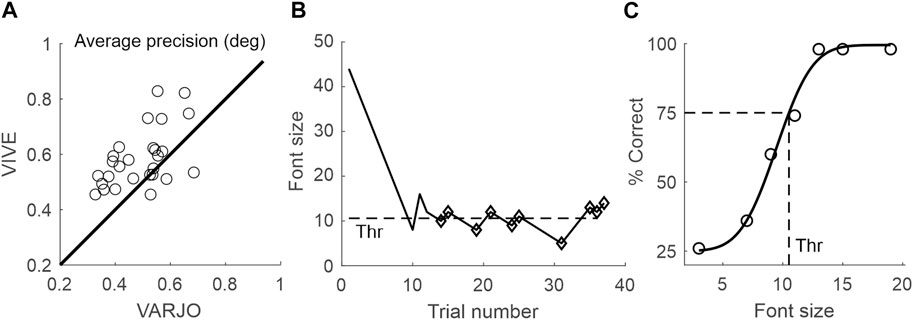
FIGURE 2. (A) Average precision (in degrees of visual angle) of the VIVE Pro Eye against that of the Varjo VR-2. Each data point represents average precision for one observer (N = 27). Data points above the diagonal indicate cases where a better precision (smaller error) was achieved with the Varjo device. (B) Example of a single staircase run, where font size increased after wrong answers, and decreased after correct answers. The threshold font size (in this case 10.6) was calculated as an average of the last 10 reversal points (diamonds). (C) An example of fitting the psychometric function to the MOCS data and extracting the threshold. The threshold was the font size with which the fitted function reached 75% correct level (dashed lines), in this case 10.5.
While our precision test was similar to the calibration-validation procedures used by many research-grade video eye trackers, we did not use it for eye tracker calibration. It is still worth noting that requiring a mean calibration error below 0.5° is common practice in eye tracking research with conventional eye trackers. We found that 5 out of 27 observers would have reached that limit on average with the VIVE Pro Eye’s eye tracking, while 12 out of 27 would have reached it with the Varjo VR-2’s eye tracking.
2.7 Data analysis
Custom unity scripts were used to save observers’ responses and the eye-tracking data into text files, which were subsequently processed with Matlab. The legibility experiment data was processed and analysed in the following steps. First, threshold estimates were extracted. For the staircase experiments, the threshold value for a single staircase run was calculated as the mean over the last 10 staircase reversal points (the stimulus values of trials where stimulus change direction reversed), with the first two reversal points considered practice and excluded (see dashed line in Figure 2B). The estimated threshold for each observer was then calculated as the mean over five such single staircase threshold values. For the MOCS experiments, data from the five stimulus blocks for each observer was pooled, resulting in 50 trials per font size. A psychometric function was constructed by calculating percent correct for each stimulus level and plotting the percent correct values as a function of font size (Figure 2C). The data was then fitted with a cumulative normal distribution function, with location and slope as free parameters, and the threshold estimate was given by the font size, with which the fitted function crossed a criterion percent correct value (dashed lines in Figure 2C). The maximum likelihood fitting was performed using the Palamedes toolbox for Matlab (Prins and Kingdom, 2018).
The study utilized a within-observer design, meaning that every observer repeated the experiments with all devices. Therefore, the statistical significance of device differences in the legibility experiments was analysed with a repeated measures ANOVA, which was conducted with Matlab’s ranova function. Normality was tested with one-sample Kolmogorov-Smirnov tests and sphericity with Mauchly’s test (both were satisfied). Tukey-Kramer correction was applied in the pairwise comparisons following the ANOVAs.
The statistical significance of device differences in font size thresholds were also tested on the level of each individual observer. For the staircase method data, a one-way ANOVA was conducted with device as the independent variable, and the five staircase results per device were treated as independent observations of a given observer’s font size threshold. Regarding data from MOCS, a model fitting approach to statistical testing was adopted. We tested the null hypothesis that a single function fitted (see details above) to the data from all three devices is as good a model for the data as three functions with different mean parameters (i.e., thresholds), while allowing the slope of the psychometric function to vary freely in both cases.
Reading speed was determined by calculating the reading time for each text display. This was measured as the time between the gaze moving to the starting point in the first line of the text and the observer reporting that they had finished reading the text by pressing a key. For each device, the observer read 15 of the 30 stories, and we calculated the average of the single display reading times, provided that we successfully measured the reading time for at least 2 text displays in each story.
The reading speed data was analysed with mixed models to accommodate its more complex structure, including multiple reading time measurements from each observer (within observer design), as well as both fixed factors (like the device) and random factors (like the story). With a linear mixed model, we observed that the residuals were not normally distributed. Consequently, we conducted a generalized linear mixed model using a gamma distribution assumption. Both models provided very similar results. We report both models, as a linear mixed model allows for an effect size estimate (
To compare the efficiency of the different measurement methods (MOCS, staircase, and reading speed) on a population level, we conducted bootstrap simulations. New datasets were resampled with replacements from the observed data. The appropriate analysis, either a repeated measures ANOVA or mixed model, was then performed on the simulated datasets. We also conducted simulations where the datasets included fewer observers than the current study, and where the effect size was smaller than in the current study. The latter was achieved by reducing the difference in threshold or reading time between different devices. For each condition, 500 bootstrap samples were produced.
Most observers had data available for each experiment, but for some, data for a specific experiment had to be excluded due to two main reasons. Firstly, for some observers, the interpolation function could not be fitted to their MOCS data. Secondly, the quality of eye tracking data was insufficient for the reading time analysis to be performed based on it.
The error bars in the data plots represent 95% confidence intervals that have been calculated to remove irrelevant differences in the overall average performance levels between observers. This approach ensures that the error bars align better with the within-observer design of the experiments and the statistical analyses.
The Unity code for all experimental procedures described above, as well as the Matlab code for processing data, are available at https://osf.io/8ekta/.
3 Results
3.1 Single letter legibility thresholds
The results were extremely clear for all the single letter legibility experiments. The Varjo VR-2 performed the best in all legibility thresholds measurements, the difference being especially pronounced compared to the VIVE Pro eye (Figure 3). We first report the results of the staircase measurements. In a repeated measures ANOVA with the size thresholds as the dependent variable, the effect of the device was statistically significant: F (2,50) = 76.53, p < 0.001,
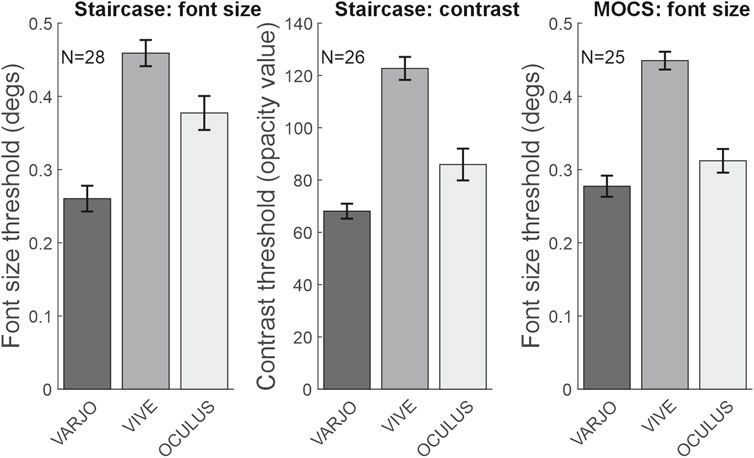
FIGURE 3. Average size and contrast thresholds for each device and measurement method. The X-axis shows the devices used in the experiment, while the panel titles indicate the measurement methods employed. Error bars represent 95% confidence intervals.
In addition to the staircase procedure, font size thresholds were also measured with a method of constant stimuli (MOCS) procedure. In a repeated measures ANOVA with size thresholds as dependent variable, the effect of the device was statistically significant: F (2,48) = 113.23, p < 0.001,
Font size thresholds obtained with the staircase procedure and the method of constant stimuli (MOCS) procedure yielded highly similar results. Specifically, for the 24 observers for whom size thresholds could reliably be determined for all three devices, the staircase thresholds and the MOCS thresholds were highly correlated (Spearman’s rho = 0.665, p < .001).
The legibility results were found to have no correlation with visual acuity in the better or worse eye, or with interocular differences in acuity, with p-values greater than 0.2 in all cases. This suggests that legibility was primarily limited by the device used for the experiments, rather than by the observers’ visual acuity. Therefore, visual acuity was not included in further analyses.
3.2 Measurement efficiency with different measurement methods
The MOCS procedure has traditionally been considered a highly reliable and robust psychophysical method, but also somewhat inefficient. Since we measured the font size thresholds with both the MOCS and the staircase procedures, it is possible to use the data to compare the efficiency of the two methods directly. Regarding time investment, the time to measure one block of trials was clearly shorter with the staircase method (mean 117 s, CI ± 5.5 s) compared to the MOCS method (mean 231 s ± 8.8 s). Considering that it is usually necessary to run at least one block of trials to determine a suitable stimulus range for the MOCS, the MOCS method is thus about twice as time-consuming as the staircase method.
We then investigated whether the extra time investment yielded greater statistical power. We first considered the power on an individual observer level. We found no considerable difference between the two methods when comparing font size thresholds for the three devices using one-way ANOVA within each individual observer. The ANOVA resulted in a p-value lower than 0.05 in all 25 observers with the MOCS method, and 24/25 observers with the staircase method. However, the effect size (
Another way of comparing the efficiency of the different methods is to estimate how the population-level analyses would have turned out if the effect size were smaller, there were fewer observers, or both. To this end, we ran bootstrap simulations with 24 and 12 observers, and varied the effect strength by rescaling the inter-device differences while keeping standard deviations unchanged. Figure 4 shows the proportion of simulations resulting in p-values smaller than 0.05 for different effect strengths and numbers of observers. In agreement with the individual observer level results, the statistical power of the MOCS method is somewhat larger on the population level as well.
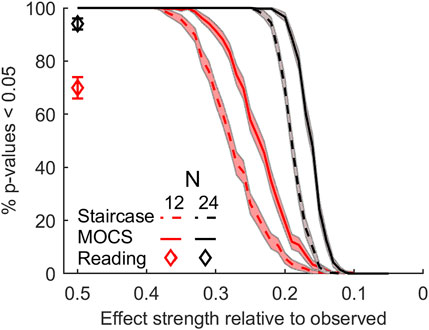
FIGURE 4. Statistical power for different sample sizes and effect strengths, based on bootstrap simulations. The curves and markers represent the probability of an experiment producing a p-value below 0.05 as a function of effect strength. The curves and markers represent the legibility and reading experiments, respectively. Shaded regions and error bars represent 95% CI.
We conclude that, based on statistical power comparisons, the MOCS method seems preferable, but not very dramatically so. Further, it is important to note that all of the legibility measurement methods show very high statistical power, and other factors regarding experimental practice may often dictate which method to choose. In the Discussion section, we will consider some of these factors.
3.3 Reading speed experiment
We compared reading times between the Varjo VR-2 and VIVE Pro Eye devices, which have eye tracking capabilities, and found that reading times (per a 1-2 sentence display) were longer with the VIVE Pro Eye (EMMEAN ± 95CI 6478 ms ± 623 ms) than the Varjo VR-2 (EMMEAN 6063 ± 624 ms), as shown in Figure 5. To investigate the difference in reading times between the two devices, we used a linear mixed model with reading time per text display as the dependent variable, device as a within-observer fixed factor, and device order (i.e., whether the observer started the reading task with the particular device) as a between-observers fixed factor, with observer and story as random factors. The effect of the device was significant [F(1, 626.4) = 41.37, p < 0.001,
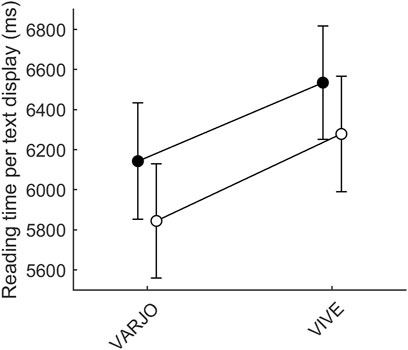
FIGURE 5. Average reading times with Varjo VR-2 and VIVE Pro Eye. Black markers indicate cases in which the device was the observer’s first device used in the reading experiment, while white markers indicate cases where it was not. The connecting lines are included to emphasize the lack of interaction (not a continuous relationship between the connected datapoints). The difference between the devices is practically the same when both were used as the first device, and when both were used as the second device.
The current setup appears to be well-powered, even in the context of the reading speed experiment. To further evaluate the statistical power, we conducted simulations similar to those performed for single-letter legibility (see Figure 4). The results showed that reductions in sample size and effect strength had a greater impact on the reading speed experiment results. While reducing effect strength to half left the percentage of p-values below 0.05 at an acceptable level (94%), as did reducing the sample size from 24 to 12 (95%), halving both the effect strength and sample size led to a clearly lower level (70%). This level of statistical power is clearly unsatisfactory, and poor in comparison to the nearly 100% observed for the same conditions in the simulations based on the single letter legibility study (see diamonds in Figure 4).
Device order, i.e., which device the observers used as the first device in the reading experiment, had a pronounced effect on the reading experiment (see Figure 5). With either device, reading speed was slower for those observers who started the experiment with that device, than for those who did not (Figure 5). On an individual observer level, this caused the reading speed to appear slower with the Varjo device for 5/24 observers, all of whom started the reading experiment with the Varjo device. Due to this strong but irrelevant order effect, testing statistical significance on the level of individual observers is not meaningful for the reading speed experiment.
4 Discussion
In our experiments, we tested the efficiency of four legibility measurement methods across three VR headsets. Three of the methods were derived from the psychophysics tradition and measured single letter legibility, and the fourth method was a simple measurement of reading speed, which has earlier been widely used in legibility measurements. We found that the single letter legibility methods were less noisy and yielded a much larger effect size compared to reading speed.
4.1 The single letter legibility method compared to other methods
Reading is becoming an increasingly necessary part of XR use. As the legibility of text displayed with XR systems is determined by multiple factors, and legibility cannot be predicted from the nominal resolution of the display, a fast and accurate way of measuring legibility is needed. Perhaps the most intuitively appealing method is to simply ask observers to judge the legibility of the text presented to them. For example, in some studies, legibility has been studied with a method where observers increase the font size until it is legible or observers increase text until it is comfortable to read (Hoffman et al., 2019; Büttner et al., 2020). The problem with such methods is that they rely on a subjective criterion of legibility, which often does not correspond to actual performance. In the current study, we did not compare a subjective method to the objective ones, but a large body of literature has established that objective (e.g., forced choice) methods are preferable in terms of accuracy and precision (Vaegan and Halliday, 1982; Higgins et al., 1988; Laming, 2013).
Another straightforward and widely used method is the measurement of reading speed. This method can be considered reasonably objective, especially if conducted with eye tracking (Franken et al., 2015). It is also arguably quite ecologically valid, as fluent reading is certainly a key goal of designing display technology and text presentation guidelines. However, this method is relatively noisy, mainly due to large individual differences in reading speed (Roufs and Boschman, 1997). In the current study, differences between observers explained approximately 59% of all reading time variance. To address this, we adopted a within-observer experimental design. However, when conducting a comparison study, matching stimuli across the compared conditions can be a challenge, as the same stories cannot be repeated. To mitigate this, we matched stories based on readability indices and emotional valence, but even so, differences between stories explained about 14% of reading time variance.
There have been attempts to eliminate sources of text variation by creating a pseudotext task, in which participants search through rows of meaningless text for target letters (Roufs and Boschman, 1997). Although the resulting eye movement patterns resemble reading, the search task suffers from individual differences in capacity and strategy as well as from a long learning period, which means that the task performance gets better even after 78 screens of text (Besuijen and Spenkelink, 1998).
The method utilized in the current study, the measurement of single letter identification thresholds with a four-alternative forced choice task, addresses many of the problems associated with the previously described methods. Firstly, the observers’ subjective legibility criteria do not affect the results. The thresholds measured with, for example, different devices or different typefaces represent the best performance level that the observer can achieve under those conditions. The thresholds are thus certain to be on the same comparable scale. Secondly, unlike in reading speed experiments, the level of measurement noise is usually low, and the use of within-observer design unproblematic. As a result, quite a small number of observers will usually suffice.
The current study unequivocally found that the legibility and readability performance of observers was better with the Varjo VR-2 than the VIVE Pro Eye. However, a closer inspection of the data revealed that the legibility methods were significantly more reliable in measuring this difference. Firstly, the effect size, essentially a measure of signal-to-noise ratio, was approximately 10 times higher in the legibility experiment. Further, in the legibility experiments the difference between the two devices was in the same direction and statistically significant within each individual observer. Analysing the within observer statistical significance of the reading speed differences, in contrast, was precluded by the strong device order effect. Whereas such an effect can be reasonably well controlled on the group level by experimental counterbalancing and statistical methods, neither is possible on the level of an individual observer’s results. Finally, when the number of observers and the effect size were both halved, the statistical power of the legibility methods remained approximately 100%, while the power of the reading speed method experiment dropped to an unsatisfactory 70%. In conclusion, applying rigorous psychophysical methods to the study of XR legibility is advisable as it can distinguish between smaller differences and allows for smaller observer groups.
4.2 Different variants of the single letter legibility method
All three variants of the single letter legibility method provided a superior effect size compared to the reading speed experiment. However, the question arises: how do we choose among the variants? In this study, we used the (adaptive) staircase method to measure both font size and contrast thresholds, as well as the method of constant stimuli (MOCS) to measure size thresholds. The choice between these three methods depends on the task-specific requirements, as well as the use case and context. In addition, the amount of time available for testing may also be a factor to consider. We suggest that the staircase size threshold measurement is probably a reasonable choice in many cases. Firstly, it is usually the quickest method, while either measuring a contrast threshold or using MOCS both require additional steps that make them less efficient. Specifically, measuring contrast requires a preliminary experiment to find a suitable font size for every observer, unless a specific size is predetermined based on the use case. Additionally, using MOCS requires at least one preliminary block of trials to determine a suitable stimulus range, and is generally considered somewhat less efficient (Watson and Fitzhugh, 1990). Secondly, the measurement of font size thresholds is often more directly applicable to the goal of a legibility measurement, which is to find a suitable font size for optimal legibility, rather than finding the lowest visible contrast. Thirdly, the staircase measurement is easy to analyse, as MOCS involves the additional step of fitting a function to the data.
Despite its longer duration and somewhat more complex analysis, MOCS may very well be worthwhile in some cases. Firstly, in the current study the MOCS measurement consistently provided a slightly better effect size. Thus, if time is not a critical constraint, one can probably be somewhat more confident of finding an effect with MOCS, if the effect exists. Secondly, in its simple form, the analysis of the staircase data yields only a single threshold estimate, which corresponds to a predetermined percentage correct level. The measurement of the entire psychometric function with MOCS, in contrast, allows one to extract a threshold estimate corresponding to any percentage correct level of interest. For example, in some cases it might be necessary to find font sizes corresponding both to rare misidentification (e.g., 75% correct in 4AFC task) and to virtually no misidentification (e.g., 95% correct). Both could be determined from the same MOCS data set, but would need to be measured separately with the staircase method. In addition, it is possible to estimate and analyse parameters beyond the threshold, including the slope, guess rate and lapse rate. For example, two conditions (e.g., two background patterns) might lead to roughly the same font size threshold, but for one the identification performance would improve much more gradually as a function of font size. The slope parameters from the MOCS measurement would reveal such a difference, whereas the staircase data would not.
Since the MOCS requires a preliminary experiment to estimate the suitable stimulus range, the MOCS experiment was always conducted in a later session than the staircase in the current study. We can thus not completely rule out the role of a learning effect in the better signal to noise ratio with the MOCS method, although we did not observe any diminishing intersubject variance during the first session of measurements, when the learning effects should be largest.
An additional drawback of the contrast threshold measurement is that determining the physical contrast is much more difficult than determining the angular size of the letters. This is because determining the physical contrast requires, at least, the measurement of the gamma function of the display, which is not currently trivial in XR devices (Penczek et al., 2017). The staircase and MOCS methods can be used to measure not only size and contrast thresholds, but also other types of thresholds. In some research setups where the aim is to measure RGB or alpha value thresholds, the difficulty in determining physical contrast may not pose a problem.
Once the legibility threshold has been measured with one of the methods, it is important to note that it is the lowest value that can be used for reliable letter recognition, and that the comfortable reading threshold is higher than the legibility threshold. Kochurova et al. (2015) suggest that comfortable text size is twice the legibility threshold value for young persons with a normally functioning visual system, and three times the threshold for older persons, or persons with visual abnormalities.
4.3 On the device differences
The differences between the devices were not the primary focus of this study, but have been measured and analysed nevertheless, and thus warrant some consideration. The observed differences are reasonably predictable and qualitatively sensible. Across all measurements, the device with the highest nominal resolution (Varjo VR-2) performed the best. However, the difference in contrast thresholds between the Varjo VR-2 and the Oculus Quest 2 was surprisingly small, considering that there is a very large difference in resolution (see Table 1). Nevertheless, one can draw the conclusion that higher spatial resolution of the device improves legibility quite significantly.
The Oculus Quest 2 showed the largest variance between observers, which may be attributed to its comparably worse fit and smaller eye box. Despite the use of the elite strap accessory, observers frequently reported difficulties in achieving best optical quality with this device. Furthermore, unlike the other two devices, the Oculus Quest 2 lacks an interpupillary distance (IPD) measurement and only has a crude manual IPD setting adjustment.
5 Conclusion
We conclude that the legibility measurement method presented in this paper is a robust and objective tool for determining text legibility in various different XR use cases. Although the results related to legibility in our VR experiments should not be directly extrapolated to any other device types, it is technically straightforward to adapt the methodological approach to a broader range of XR devices, including augmented and mixed reality environments. However, case-specific pilot experiments are likely to be necessary in many instances to confirm the applicability of the method to the particular use case and to determine whether modifications are needed.
Data availability statement
The datasets presented in this study can be found in online repositories. The names of the repository/repositories and accession number(s) can be found below: https://osf.io/8ekta/.
Ethics statement
The studies involving humans were approved by the Ethics Review Board in the Humanities and Social and Behavioural Sciences of the University of Helsinki. The studies were conducted in accordance with the local legislation and institutional requirements. The participants provided their written informed consent to participate in this study.
Author contributions
MK and JH contributed to conception and design of the study. MK performed data collection. MK processed the data and performed the statistical analysis. MK and JH wrote the first draft of the manuscript, revised the manuscript and approved the submitted version. All authors contributed to the article and approved the submitted version.
Funding
The research was funded by Business Finland (project Human Optimized XR 3984/31/2019). The Business Finland project was also funded by: Kone Oyj, Uki Arkkitehdit Oy, Varjo Technologies Oy, and Huawei Technologies Oy (Finland) Co. Ltd. The funders were not involved in the study design, collection, analysis, interpretation of data, the writing of this article, or the decision to submit it for publication.
Acknowledgments
The authors thank Sylvia Talikka for help with data collection and Evan Center for useful discussions throughout the project.
Conflict of interest
The authors declare that the research was conducted in the absence of any commercial or financial relationships that could be construed as a potential conflict of interest.
Publisher’s note
All claims expressed in this article are solely those of the authors and do not necessarily represent those of their affiliated organizations, or those of the publisher, the editors and the reviewers. Any product that may be evaluated in this article, or claim that may be made by its manufacturer, is not guaranteed or endorsed by the publisher.
Supplementary material
The Supplementary Material for this article can be found online at: https://www.frontiersin.org/articles/10.3389/frvir.2023.1243387/full#supplementary-material
References
Arditi, A., and Cho, J. (2005). Serifs and font legibility. Vis. Res. 45, 2926–2933. doi:10.1016/j.visres.2005.06.013
Arfé, B., Delatorre, P., and Mason, L. (2022). Effects of negative emotional valence on readers’ text processing and memory for text: an eye-tracking study. Read. Writ. 36, 1743–1768. doi:10.1007/s11145-022-10362-7
Attneave, F., and Arnoult, M. D. (1956). The quantitative study of shape and pattern perception. Psychol. Bull. 53, 452–471. doi:10.1037/h0044049
Baceviciute, S., Terkildsen, T., and Makransky, G. (2021). Remediating learning from non-immersive to immersive media: using EEG to investigate the effects of environmental embeddedness on reading in virtual reality. Comput. Educ. 164, 104122. doi:10.1016/j.compedu.2020.104122
Bates, D., Mächler, M., Bolker, B., and Walker, S. (2015). Finding patients before they crash: the next major opportunity to improve patient safety. J. Stat. Softw. 67, 1–3. doi:10.1136/bmjqs-2014-003499
Ben-Shachar, M. S., Lüdecke, D., and Makowski, D. (2020). Effectsize: estimation of effect size indices and standardized parameters. J. Open Source Softw. 5, 2815. doi:10.21105/joss.02815
Besuijen, K., and Spenkelink, G. P. J. (1998). Standardizing visual display quality. Displays 19, 67–76. doi:10.1016/S0141-9382(98)00039-0
Bigelow, C. (2019). Typeface features and legibility research. Vis. Res. 165, 162–172. doi:10.1016/j.visres.2019.05.003
Brysbaert, M. (2019). How many words do we read per minute? A review and meta-analysis of reading rate. J. Mem. Lang. 109, 104047. doi:10.1016/j.jml.2019.104047
Burova, A., Mäkelä, J., Hakulinen, J., Keskinen, T., Heinonen, H., Siltanen, S., et al. (2020). “Utilizing VR and gaze tracking to develop AR solutions for industrial maintenance,” in Proceedings of the 2020 CHI conference on human factors in computing systems (New York, NY, USA: Association for Computing Machinery), 1–13.
Büttner, A., Grünvogel, S. M., and Fuhrmann, A. (2020). “The influence of text rotation, font and distance on legibility in VR,” in 2020 IEEE Conference on Virtual Reality and 3D User Interfaces Abstracts and Workshops (VRW), Atlanta, GA, USA, 22-26 March 2020 (IEEE), 662–663. doi:10.1109/VRW50115.2020.00182
Cattell, J. M. (1885). Über die zeit der erkennung und benennung von schriftzeichen, bildern und farben. Philos. Stud. 2, 635–650.
Chung, S. T. L. (2004). Reading speed benefits from increased vertical word spacing in normal peripheral vision. Optom. Vis. Sci. 81, 525–535. doi:10.1097/00006324-200407000-00014
Cornsweet, T. N. (1962). The staircase-method in psychophysics. Am. J. Psychol. 75, 485–491. doi:10.2307/1419876
Dingler, T., Kunze, K., and Outram, B. (2018). “VR reading UIs: assessing text parameters for reading in VR,” in Extended abstracts of the 2018 CHI conference on human factors in computing systems, CHI EA ’18 (New York, NY, USA: Association for Computing Machinery), 1–6. doi:10.1145/3170427.3188695
Erdmann, R. L., and Neal, A. S. (1968). Word legibility as a function of letter legibility, with word size, word familiarity, and resolution as parameters. J. Appl. Psychol. 52, 403–409. doi:10.1037/h0026189
Franken, G., Podlesek, A., and Možina, K. (2015). Eye-tracking study of reading speed from LCD displays: influence of type style and type size. J. Eye Mov. Res. 8, 3. doi:10.16910/jemr.8.1.3
García-Pérez, M. A. (2011). A cautionary note on the use of the adaptive up–down method. The Journal of the Acoustical Society of America 130, 2098–2107. doi:10.1121/1.3628334
Ginsburg, A. P. (1978). “Visual information processing based on spatial filters constrained by biological data. (No. AMRL-TR-78-129),” in Aerospace medical research laboratory, aerospace medical division, air force systems command (Ohio, USA: Wright-Patterson Air Force Base).
Google for Developers (2017). Designing Screen Interfaces for VR (Google I/O ’17). Mountain View, CA: Google.
Higgins, K. E., Jaffe, M. J., Caruso, R. C., and deMonasterio, F. M. (1988). Spatial contrast sensitivity: effects of age, test–retest, and psychophysical method. JOSA A 5, 2173–2180. doi:10.1364/JOSAA.5.002173
Hoffman, D. M., McKenzie, C., Koprowski, B., Iqbal, A., and Balram, N. (2019). Aligning content rendering resolution and feature size with display capability in near-eye display systems. J. Soc. Inf. Disp. 27, 207–222. doi:10.1002/jsid.765
Just, M. A., and Carpenter, P. A. (1980). A theory of reading: from eye fixations to comprehension. Psychol. Rev. 87, 329–354. doi:10.1037/0033-295X.87.4.329
Kaakinen, J. K., Werlen, E., Kammerer, Y., Acartürk, C., Aparicio, X., Baccino, T., et al. (2022). Idest: international database of emotional short texts. PLOS ONE 17, e0274480. doi:10.1371/journal.pone.0274480
Kim, S. K., Yoon, H., Shin, C., Choi, J., and Lee, Y. (2020). Brief paper: design and implementation of a smart glass application for XR assisted training of Core nursing skills. J. Multimed. Inf. Syst. 7, 277–280. doi:10.33851/JMIS.2020.7.4.277
Kochurova, O., Portello, J. K., and Rosenfield, M. (2015). Is the 3× reading rule appropriate for computer users? Displays 38, 38–43. doi:10.1016/j.displa.2015.02.001
Kuznetsova, A., Brockhoff, P. B., and Christensen, R. H. B. (2017). lmerTest package: tests in linear mixed effects models. J. Stat. Softw. 82, 1–26. doi:10.18637/jss.v082.i13
Laming, D. (2013). Contrast discrimination by the methods of adjustment and two-alternative forced choice. Atten. Percept. Psychophys. 75, 1774–1782. doi:10.3758/s13414-013-0544-8
Leek, M. R. (2001). Adaptive procedures in psychophysical research. Perception and Psychophysics 63, 1279–1292. doi:10.3758/BF03194543
Legge, G. E., and Bigelow, C. A. (2011). Does print size matter for reading? A review of findings from vision science and typography. J. Vis. 11, 8. doi:10.1167/11.5.8
Legge, G. E., Rubin, G. S., and Luebker, A. (1987). Psychophysics of reading—V. The role of contrast in normal vision. Vis. Res. 27, 1165–1177. doi:10.1016/0042-6989(87)90028-9
Lenth, R. V. (2022). Emmeans: estimated marginal means, aka least-squares means. Avaliable At: https://github.com/rvlenth/emmeans.
Luckiesh, M., and Moss, F. K. (1939). The visibility and readability of printed matter. J. Appl. Psychol. 23, 645–659. doi:10.1037/h0055273
Nanavati, A. A., and Bias, R. G. (2005). Optimal line length in reading-A literature review. Visible Lang. 39, 121–145.
Osorto Carrasco, M. D., and Chen, P. H. (2021). Application of mixed reality for improving architectural design comprehension effectiveness. Autom. Constr. 126, 103677. doi:10.1016/j.autcon.2021.103677
Pastoor, S. (1990). Legibility and subjective preference for color combinations in text. Hum. Factors 32, 157–171. doi:10.1177/001872089003200204
Paterson, D. G., and Tinker, M. A. (1929). Studies of typographical factors influencing speed of reading. II. Size of type. J. Appl. Psychol. 13, 120–130. doi:10.1037/h0074167
Paterson, D. G., and Tinker, M. A. (1932). Studies of typographical factors influencing speed of reading. VIII. Space between lines or leading. J. Appl. Psychol. 16, 388–397. doi:10.1037/h0074988
Pelli, D. G., Burns, C. W., Farell, B., and Moore-Page, D. C. (2006). Feature detection and letter identification. Vis. Res. 46, 4646–4674. doi:10.1016/j.visres.2006.04.023
Pelli, D. G., Farell, B., and Moore, D. C. (2003). The remarkable inefficiency of word recognition. Nature 423, 752–756. doi:10.1038/nature01516
Penczek, J., Boynton, P. A., Meyer, F. M., Heft, E. L., Austin, R. L., Lianza, T. A., et al. (2017). Absolute radiometric and photometric measurements of near-eye displays. J. Soc. Inf. Disp. 25, 215–221. doi:10.1002/jsid.537
Pölönen, M., Järvenpää, T., and Häkkinen, J. (2012). Reading e-books on a near-to-eye display: comparison between a small-sized multimedia display and a hard copy. Displays 33, 157–167. doi:10.1016/j.displa.2012.06.002
Prins, N., and Kingdom, F. A. A. (2018). Applying the model-comparison approach to test specific research hypotheses in psychophysical research using the Palamedes toolbox. Front. Psychol. 9, 1250. doi:10.3389/fpsyg.2018.01250
R Core Team (2021). R: A language and environment for statistical computing. Vienna, Austria: R Foundation for Statistical Computing.
Rau, P. L. P., Zheng, J., and Guo, Z. (2021). Immersive reading in virtual and augmented reality environment. Inf. Learn. Sci. 122, 464–479. doi:10.1108/ILS-11-2020-0236
Roufs, J. A. J., and Boschman, M. C. (1997). Text quality metrics for visual display units:. Displays 18, 37–43. doi:10.1016/S0141-9382(97)00003-6
Sanford, E. C. (1888). The relative legibility of the small letters. Am. J. Psychol. 1, 402–435. doi:10.2307/1411012
Sheedy, J., and Bergstrom, N. (2002). Performance and comfort on near-eye computer displays. Optom. Vis. Sci. Off. Publ. Am. Acad. Optom. 79, 306–312. doi:10.1097/00006324-200205000-00010
Sheedy, J., Subbaram, M. V., Zimmerman, A. B., and Hayes, J. R. (2005). Text legibility and the letter superiority effect. Hum. Factors 47, 797–815. doi:10.1518/001872005775570998
Singmann, H., Bolker, B., Westfall, J., Aust, F., and Ben-Shachar, M. S. (2021). afex: analysis of Factorial Experiments. Avaliable At: https://afex.singmann.science/.
Solum, H. H. (2019). Readability in virtual reality, an investigation into displaying text in a virtual environment. PhD thesis. Trondheim, Norway: Norwegian University of Science and Technology.
Tarasov, D. A., Sergeev, A. P., and Filimonov, V. V. (2015). Legibility of textbooks: A literature review. Procedia - Soc. Behav. Sci. 174, 1300–1308. doi:10.1016/j.sbspro.2015.01.751
Vaegan, T., and Halliday, B. L. (1982). A forced-choice test improves clinical contrast sensitivity testing. Br. J. Ophthalmol. 66, 477–491. doi:10.1136/bjo.66.8.477
van Nes, F. L. (1984). Limits of visual perception in the technology of visual display terminals. Behav. Inf. Technol. 3, 371–377. doi:10.1080/01449298408901770
Watson, A. B., and Fitzhugh, A. (1990). The method of constant stimuli is inefficient. Psychophys 47, 87–91. doi:10.3758/BF03208169
Wetherill, G. B., and Levitt, H. (1965). Sequential estimation of points on a psychometric function. Br. J. Math. Stat. Psychol. 18, 1–10. doi:10.1111/j.2044-8317.1965.tb00689.x
Wright, S. L., Bailey, I. L., Tuan, K. M., and Wacker, R. T. (1999). Resolution and legibility: A comparison of TFT-LCDs and CRTs. J. Soc. Inf. Disp. 7, 253–256. doi:10.1889/1.1985290
Keywords: XR, VR, legibility, readability, psychophysics, statistical power
Citation: Kilpeläinen M and Häkkinen J (2023) An effective method for measuring text legibility in XR devices reveals clear differences between three devices. Front. Virtual Real. 4:1243387. doi: 10.3389/frvir.2023.1243387
Received: 20 June 2023; Accepted: 28 August 2023;
Published: 07 September 2023.
Edited by:
Doug A. Bowman, Virginia Tech, United StatesReviewed by:
Jiawei Huang, Environmental Systems Research Institute, United StatesWeiya Chen, Huazhong University of Science and Technology, China
Copyright © 2023 Kilpeläinen and Häkkinen. This is an open-access article distributed under the terms of the Creative Commons Attribution License (CC BY). The use, distribution or reproduction in other forums is permitted, provided the original author(s) and the copyright owner(s) are credited and that the original publication in this journal is cited, in accordance with accepted academic practice. No use, distribution or reproduction is permitted which does not comply with these terms.
*Correspondence: Jukka Häkkinen, anVra2EuaGFra2luZW5AaGVsc2lua2kuZmk=