 Antonin Fourcade1,2,3,4*†
 Francesca Malandrone5†
 Lucy Roellecke2
 Anthony Ciston2,3Jeroen de Mooij2
 Arno Villringer1,2,3,4
 Sara Carletto5‡
 Michael Gaebler2,3‡
- 1Max Planck School of Cognition, Leipzig, Germany
- 2Department of Neurology, Max Planck Institute for Human Cognitive and Brain Sciences, Leipzig, Germany
- 3Max Planck Dahlem Campus of Cognition, Max Planck Society, Berlin, Germany
- 4Charité - Universitätsmedizin Berlin, Berlin, Germany
- 5Department of Clinical and Biological Sciences, University of Turin, Turin, Italy
Subjective experience is key to understanding affective states, characterized by valence and arousal. Traditional experiments using post-stimulus summary ratings do not resemble natural behavior. Fluctuations of affective states can be explored with dynamic stimuli, such as videos. Continuous ratings can capture moment-to-moment affective experience, however the rating or the feedback can be interfering. We designed, empirically evaluated, and openly share AffectTracker, a tool to collect continuous ratings of two-dimensional affective experience (valence and arousal) during dynamic stimulation, such as 360-degree videos in immersive virtual reality. AffectTracker comprises three customizable feedback options: a simplified affect grid (Grid), an abstract pulsating variant (Flubber), and no visual feedback. Two studies with healthy adults were conducted, each at two sites (Berlin, Germany, and Torino, Italy). In Study 1 (Selection: n = 51), both Grid and Flubber demonstrated high user experience and low interference in repeated 1-min 360-degree videos. Study 2 (Evaluation: n = 82) confirmed these findings for Flubber with a longer (23-min), more varied immersive experience, maintaining high user experience and low interference. Continuous ratings collected with AffectTracker effectively captured valence and arousal variability. For shorter, less eventful stimuli, their correlation with post-stimulus summary ratings demonstrated the tool’s validity; for longer, more eventful stimuli, it showed the tool’s benefits of capturing additional variance. Our findings suggest that AffectTracker provides a reliable, minimally interfering method to gather moment-to-moment affective experience also in immersive environments, offering new research opportunities to link affective states and physiological dynamics.
Introduction
Affective states, such as emotions, are adaptive responses to external stimuli, such as challenging situations or pleasant social interactions, or to self-generated mental states, such as memories. The most direct way to assess the affective state of humans is to ask them how they feel, that is, to have them report or rate their subjective affective experience (i.e., feelings; Damasio et al., 2000).
Affective states are an essential part of our experience of the world (James, 1884; James, 1894; Seth, 2013) and they are crucial for our physical and mental health (Gross and Muñoz, 1995). Dimensional approaches consider affective experience along the two axes of valence, ranging from negative (or displeasure) to positive (or pleasure), and arousal, ranging from low to high intensity or activation (Wundt, 1897; Duffy, 1957; Russell, 1980; Russell and Barrett, 1999; Kuppens et al., 2013). The rationale is that this latent space better captures the structure of affective states than individual, discrete emotion categories (Russell, 1980; Russell and Barrett, 1999), which have also been difficult to consistently associate with specific response patterns in the autonomic nervous system (Kreibig, 2010; Kragel and LaBar, 2013; Siegel et al., 2018) or in distinct brain regions (Lindquist et al., 2012; but Saarimäki et al., 2016).
Common ways to quantify the arousal and valence of a feeling state are through separate (e.g., 5-, 7- or 9-point) Likert-type scales with numbers or pictures (like the self-assessment manikin, SAM; Bradley and Lang, 1994) as labels, or continuous “visual analogue scales” (VAS; e.g., Kron et al., 2013). Both dimensions can also be combined in a two-dimensional (Cartesian) coordinate system (“affect grid”; Russell et al., 1989), which allows individuals to self-report their affective states by marking a point on a grid, where the perpendicular axes represent the continuum of valence (typically on the x-axis and ranging from “negative” to “positive”) and arousal (typically on the y-axis and ranging from “low” to “high”), with or without a visual aid (e.g., a 5 × 5-, 7 × 7-, 9 × 9-grid).
Assessing both dimensions simultaneously can be considered more comprehensive and nuanced because it (1) captures joint variance (e.g., arousal and valence sometimes show a U-shaped relationship in that more positive or more negative valence is more intense and rated higher along the dimension of arousal; Kuppens et al., 2013; Yik et al., 2023); and (2) facilitates rapid and repeated ratings (Russell et al., 1989), which are essential to capture the dynamics of affective experience.
Psychophysiological experiments of affective states classically involve trial-based (i.e., discrete, sequential, repetitive) designs, such as passive viewing of affective pictures with individual post-stimulus summary ratings (e.g., with SAMs). Such tests create an artificial experience for participants and lack the complexity and context of real-life experiences: in daily life, events do not occur suddenly but are embedded in a continuous sequence, and natural human behavior unfolds over multiple timescales (Huk et al., 2018). It is becoming increasingly clear that humans are in constantly fluctuating states both physiologically (see “resting-state” literature; Fox and Raichle, 2007) and psychologically (e.g., “mind wandering”), which can be influenced by external stimuli. In this vein, humans can be seen as constantly in states of pleasant or unpleasant arousal (‘core affect’; Russell and Barrett, 1999; Lindquist, 2013) that temporally evolve in interactions with complex, dynamic environments. Advances in stimulation and analysis techniques have recently enabled experiments to study the physiological and psychological dynamics, such as the variability of affective response, for example, using movies (Westermann et al., 1996; Hasson et al., 2004; Saarimäki, 2021) or immersive virtual reality (iVR), in which participants are surrounded by interactive, dynamic, computer-generated environments that are often presented in stereoscopic head-mounted displays (HMDs; Riva et al., 2007; Chirico and Gaggioli, 2019).
In summary, the waxing and waning of affective experience to dynamic stimuli may be insufficiently captured by the typical one-time (“summary”) ratings when the stimulation (e.g., the movie or VR experience) is over. Continuous ratings can be assumed to capture the affective experience in a more fine-grained fashion, also because post hoc (hindsight) ratings can be susceptible to distortions and biases (Levine and Safer, 2002; Kaplan et al., 2016).
One possibility is to replay an audiovisual recording of the experience during the post hoc rating to aid recall (McCall et al., 2015; Hofmann et al., 2021) by minimizing biases related to the point of view (Berntsen and Rubin, 2006; Marcotti & St. Jacques, 2018) or timescale (e.g., Fredrickson and Kahneman, 1993). As a replay extends (in case of a 1-to-1 replay “doubles”) the duration of the experiment, we here aim to collect ratings during the experience, that is, in “real-time” or “online”.
A series of open-source frameworks has been developed to enable moment-to-moment and real-time assessment of affective experience across different stimulus types. For audio stimuli, one-dimensional scales have been used, for example, to continuously rate poems via finger movements along a single “liking” dimension (Wagner et al., 2021), or music using mouse or keyboard inputs on similar one-dimensional scales (Vuoskoski et al., 2022). Two-dimensional scales have also been developed for music, involving a squared affect grid with a joystick-controlled worm-like cursor whose facial expressions are mapped onto the two axes (EMuJoy; Nagel et al., 2007 or a circular grid with the color and saturation of the mouse cursor mapped onto valence and arousal, respectively (Emotion Compass; McClay et al., 2023). While viewing 2D videos, one-dimensional scales have been similarly employed, such as mouse- or keyboard-based ratings using vertical sliding scales (CARMA; Girard, 2014). Two-dimensional frameworks for videos include a squared affect grid visually paired with emotion words (DARMA; Girard and C. Wright, 2018), SAM icons (CASE; Sharma et al., 2017; 2019) or a morphing emoticon (Morph A Mood; Krüger et al., 2020), as well as a circular affect grid with a color-coded mouse cursor and emotion words (FeelTrace; Cowie et al., 2000). For immersive 360° VR video stimuli, two-dimensional continuous rating systems have also emerged, typically operated via VR controllers (e.g., real-time input from joystick or touchpad). These include adaptations of the affect grid visually paired with SAM icons (Krüger et al., 2020), or emoticons (AVDOS-VR; Gnacek et al., 2024). A recent alternative to the grid for visual feedback uses a more abstract representation: a circle or halo, with their color, size, and transparency dynamically mapped to valence and arousal (CEAP-360VR; Xue et al., 2021).
Building on these advancements, we developed a highly customizable tool for real-time, continuous, two-dimensional assessment of affective experience in iVR. This tool integrates various features and visual feedback from existing literature and introduces new abstract feedback, which maps low-level visual features to affective dimensions. Additionally, it has not been systematically tested to what extent the existing tools have an impact on the affective experience and ratings.
While real-time continuous ratings promise to effectively study affective dynamics, they may also influence the stimulus perception and the experience itself. For example, the rating (task, activity, feedback) may interfere with participants’ experience, that is, demands of “dual-tasking” may occupy limited cognitive (e.g., attention-based) resources (as reported for working memory; Doherty et al., 2019). In addition, explicitly rating one’s emotions may be a form of implicit emotion regulation just as putting feeling into words can attenuate emotional experiences (Lieberman et al., 2011). It is therefore essential to identify continuous rating methods that minimize potential interference with the subjective experience. From a technical angle, this can also be framed in the context of “user experience”, that is, the assessment of how effectively, efficiently, and satisfactorily a user can interact with a product or system to achieve specific goals (Jordan, 1998), in this case, the rating of affective experience. To maximize user experience and manage attention, design principles of peripheral feedback have been developed, which leverage the human ability to process information in the periphery of attention. That is, peripheral feedback aims to provide users with important information without demanding their full attention or interrupting their primary tasks (Bakker et al., 2016).
Hence, the requirements for our rating tool were to (1) continuously collect both valence and arousal ratings during the experience (in “real-time”) and compare it with summary ratings, while (2) minimizing the rating’s interference on the experience itself.
Methods
We designed a tool, the AffectTracker, to collect continuous or moment-to-moment ratings of two-dimensional affective experiences (valence and arousal) during dynamic stimuli, such as 360-degree videos, while minimizing the rating’s impact on the experience itself. We opted for 360-degree videos—fixed-sequence audiovisual stimuli—over fully interactive content, such as games, to strike a balance between providing an immersive experience while keeping cognitive demands low. This approach allowed participants to remain hands-free and limited their degree of freedom, which was essential to ensuring high-quality data for future physiological recordings.
In Study 1 (“Selection”), we aimed to identify the AffectTacker feedback with the best compromise between validity for continuous measurement and interference with the experience, using brief 1-min videos. Study 2 (“Evaluation”) then tested the selected feedback during longer affective stimulation, extending to 23 min, to assess its performance over extended periods. The materials and procedures common to both studies are described below, while the specifics of each study are reported in dedicated sections. Both studies were conducted both at the Max Planck Institute (MPI) for Human Cognitive and Brain Sciences, Leipzig, Germany (BER) and at the Department of Clinical and Biological Science, University of Turin, Italy (TUR). The research protocol was approved by the local ethics committees.
Common materials
Equipment
All sessions in both sites took place in dedicated rooms for immersive Virtual Reality (iVR) experiments, with participants seated on swivel chairs. HTC Vive Pro headsets (HTC, Taiwan) with headphones were used. The iVR headset offers stereoscopy with two 1400 × 1600-pixel OLED displays (615 PPI), a 110° field-of-view, and a frame rate of 90 Hz. The iVR application was developed in Unity 2022.3.12 and therefore built as an executable that runs on a Windows 10 machine. The rating sampling is set at a frequency of 20 Hz, auto-saving the data every 30 s to disk. Experiments on the BER site were conducted in English, while those on the TUR site were conducted in Italian.
AffectTracker
The AffectTracker has been developed with Unity 2022.3.12 under OpenXR (khronos.org/openxr/). The tool is designed to be easy to implement and work with the touchpad or joystick of an iVR controller of any iVR equipment supported by OpenXR. Real-time visual feedback is provided and can be customized. Researchers and developers using Unity can flexibly integrate this tool with a variety of stimuli, such as images, music, 2D videos, 360° videos, and VR environments, as well as different display types, including VR HMD and 2D screens. We released the AffectTracker (with a manual) as an open-source Unity prefab here: https://github.com/afourcade/AffectTracker.
To continuously rate the moment-to-moment affective state, users simultaneously indicate their arousal and valence experience using the input device of the iVR controller (e.g., in our studies: touchpad of the HTC Vive Pro), onto which an affect grid with horizontal (valence, range [-1 1]) and vertical (arousal, range [-1 1]) axis is mapped (see Figure 1).
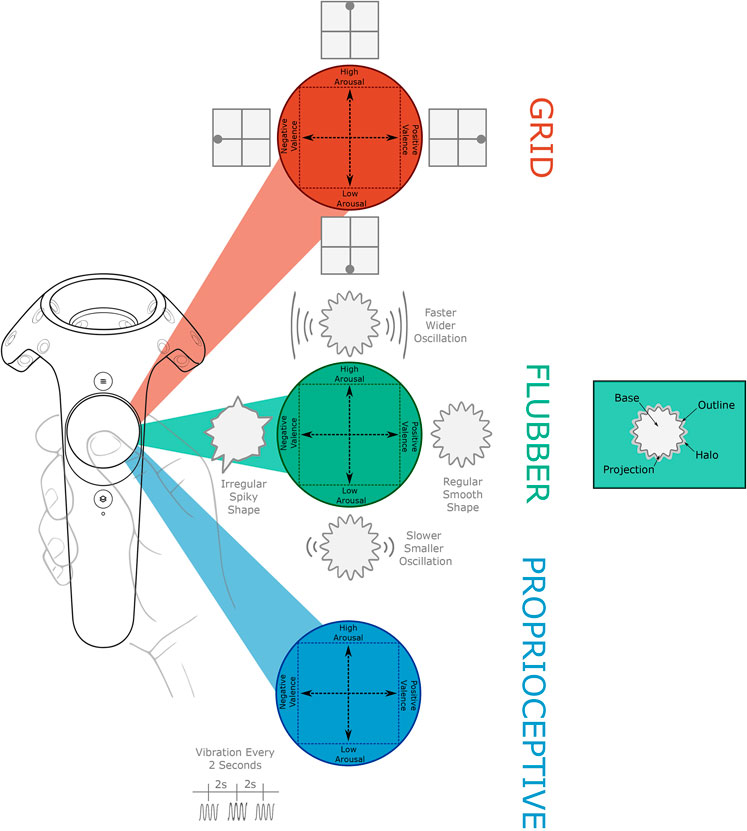
Figure 1. Feedback options used in Study 1: Selection for CR of affective states: Grid, Flubber, and Proprioceptive. Participants continuously assessed their two-dimensional affective experience by using their thumb to navigate a touchpad on the iVR controller, into which an affect grid (horizontal axis: valence, vertical axis: arousal) was fitted. They adjusted their thumb position whenever they felt a change. Different real-time visual feedback were presented. The Grid feedback displayed a four-quadrant grid, with participants’ ratings represented by a dot in the arousal-valence space. The Flubber feedback used a dynamic abstract shape (consisting of a circular base with radiating projections, an outline and a halo) that changed based on participants’ affective ratings, mapping arousal and valence onto its form and oscillation. The Proprioceptive feedback relied on participants’ proprioceptive awareness of their thumb on the touchpad, with no visual feedback, but included periodic vibrations to remind them to continuously rate. A video showcasing the Grid and Flubber feedback options is available in our data repository: https://doi.org/10.17617/3.QPNSJA.
The tool includes customization options with respect to:
• visual user feedback
• enabling haptic vibrations (e.g., to remind users to rate continuously)
• configuring the sampling frequency (up to the refresh rate of the display; e.g., 90 Hz for the HTC Vive Pro)
• recording either single (“summary”) or continuous ratings
• configuring the interval for automatically saving ongoing continuous ratings into a file on disk.
The AffectTracker offers several options for the dynamic visual feedback (see Figure 1) that can be switched on and off independently:.
1. Grid: visualize the valence-arousal space with a simplified version of the affect grid, with four static quadrants, a moving dot/cursor and no text.
2. Flubber: visualize the valence-arousal space as a moving abstract shape, called Flubber, whose low-level visual features are mapped onto the valence-arousal space. The Flubber consists of three parts that can be toggled on and off independently: a base, an outline and a halo. The base is the central circular body with radiating projections, while the outline and halo have been designed to make the base stand out against any background. Many of the visual features, as well as their mapping onto the Cartesian (valence, arousal) and polar (distance, angle) coordinates of the affect grid, can be adjusted. Table 1 describes each customizable feature and indicates its default/recommended values.
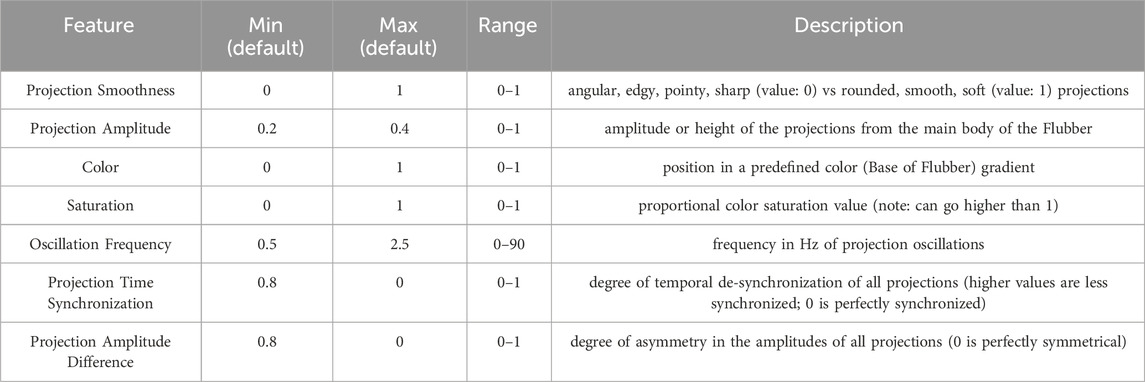
Table 1. Customizable low-visual features for the Flubber feedback. Each feature takes a minimum and a maximum value as inputs, corresponding to extrema of the mapped coordinates in the valence-arousal space. Default values and possible range are described.
Projection Time Synchronization and Projection Amplitude Difference jointly control the degree of regularity in the oscillations of the Flubber (e.g., from chaotic/irregular to symmetrical/regular).
Each feature needs a minimum and a maximum value as inputs, which correspond to extrema of the mapped coordinates. For example, when a feature is mapped to the x-axis, min corresponds to the left-most while max corresponds to the right-most side of the grid. Similarly, when mapped to the y-axis, min refers to the bottom and max to the top.
Both Grid and Flubber are abstract graphical representations that are language-independent (i.e., cross-culturally suitable): they do not require the participants to verbalize potentially complex or mixed emotions (Toet et al., 2020), which could help with minimizing interferences with subjective experience and brain activity (Lieberman et al., 2011).
The goal for Flubber was to design an abstract representation of the affect grid that is as universal and intuitive as possible in order to provide feedback without demanding the users’ full attention and interfering with their experience. For our studies, the Flubber was placed at the center-bottom of the visual field, which allows the feedback to be in the peripheral vision while minimizing blur caused by the lenses of the HTC Vive Pro (peripheral interaction; Bakker et al., 2016). Its size and opacity were also adjusted to achieve a balance between being clearly visible and minimally obstructing the field-of-view. The affect grid’s classical rating format can be challenging for participants to understand and heavily relies on prior instructions and training (Ekkekakis, 2013). A more intuitive and less cognitively demanding rating system, suitable for non-experts, could reduce the need for deliberate reasoning (Evans, 2010), which is crucial for repeated or even continuous ratings. One way to achieve this could be a low-level visual representation of valence and arousal. Previous research investigated the links between these affective dimensions and low-level visual features: Pinilla and colleagues (2021) highlight how visual properties like rounded lines and regular movements are consistently associated with positive valence, while angular shapes and erratic movements are tied to negative valence. Similarly, faster movements correspond to higher arousal, while slower ones denote lower arousal (e.g., Feng et al., 2014). The design of Flubber was informed by these findings and inspired by Emotion-prints (Cernea et al., 2015), a tool to visualize two-dimensional affective dimensions in the context of multi-touch systems, where valence was mapped to the line smoothness and arousal to the color and pulsation frequency of the contour of a touched area. Therefore for our studies, the oscillation frequency and the amplitude of the projections were mapped to arousal. The smoothness and regularity (i.e., synchrony and similarity) of the projections were mapped to valence. A video demonstrating the Grid and Flubber (with the visual-affect mapping used in our studies) feedback options can be found in our data repository here: https://doi.org/10.17617/3.QPNSJA.
As there is accumulating evidence that valence and arousal are correlated (Kuppens et al., 2013; Yik et al., 2023), we added the option to map the features to the polar coordinates (distance and angle) instead of the x- and y-axes of the affect grid.
Of note, given its common use in other tools (e.g., McClay et al., 2023), we provide the option to have an affect-color mapping (e.g., changes in valence/arousal ratings corresponding to changes in RGB values or color saturation). We chose not to map the Flubber’s color in our two studies, as color associations to specific emotions can differ between cultures (Hupka et al., 1997; Madden et al., 2000; Soriano and Valenzuela, 2009) and contexts (Lipson-Smith et al., 2021).
Surveys
In the Selection study, LimeSurvey (LimeSurvey GmbH, n.d.) was chosen for pre- and post-experimental digital surveys, while SoSci Survey (Leiner, 2021) was used in the Evaluation study. Before the experiment, in both Selection and Evaluation studies, the survey included demographic questions (age, gender), a question on prior iVR and gaming experiences and a shortened version of the Simulator Sickness Questionnaire (SSQ; Kennedy et al., 1993). In addition to these instruments, the Evaluation study’s pre-experimental survey also included an additional demographic question (education), the Toronto Alexithymia Scale (TAS; Leising et al., 2009), and the Multidimensional Assessment of Interoceptive Awareness (MAIA; Mehling et al., 2018); to provide a more detailed and comprehensive characterization of the sample.
During the experiment, participants in both studies completed the System Usability Scale (SUS; Brooke, 1996; Brooke, 2013) at the end of each experimental block to assess Usability, as well as the Kunin Scale (Kunin, 1998) to gauge user Satisfaction. Participants also rated the Distraction of the feedback by responding to the statement, “The feedback was distracting and/or disturbing,” using a 7-point Likert scale (1 = strongly disagree, 7 = strongly agree). Additionally, questions assessing the Emotional Representation of the feedback (“How much was the feedback representative of your inner emotions?”) and Sense of Presence (“How strongly did you experience these videos/situations?” and “How much were you aware of the outside world?”) were presented on a 7-point Likert scale.
After the experiment, participants in the Selection study indicated their preferred feedback with the question “Of the three feedback options you used, which did you like best?” and they were also invited to provide general comments on their experience. Similarly, in the Evaluation study, participants were asked to provide their general impression through a post-experimental survey. This included an additional open-ended question, asking participants to reflect specifically on their experience with continuous rating. Both studies concluded with participants completing a final shortened version of the SSQ to assess any symptoms of simulator sickness.
Common procedures
Participants
The sample size for both studies was determined to be at least 50 participants, chosen arbitrarily. Participants were recruited by providing a description of the project and listing its research objectives. Participation was voluntary, and informed consent was collected in written form. Reimbursement was provided to participants at the BER site who were compensated with €12 per hour. The inclusion criteria were being at least 18 years old with normal or corrected-to-normal vision. The exclusion criteria included having suffered from, or currently suffering from, any psychiatric or neurological disorder, as well as having a dependency disorder or being engaged in substance abuse within the last 6 months. For the BER recruitment (through Castellum; Bengfort et al., 2022), proficiency in speaking and understanding English was required. For both Selection and Evaluation studies, participants were informed that some of the videos contained scenes depicting spiders, blood, snakes, dead corpses, or heights. Therefore, individuals with severe phobias or fears related to these stimuli were advised not to participate. Participants were also asked not to consume caffeine and nicotine within 3 h before the experiment.
Preprocessing
All code used for all analyses and plots are publicly available on GitHub at https://github.com/afourcade/AffectiveVR. All data were preprocessed in Python (version 3.10) as follows: Continuous ratings (CRs) were (linearly) resampled to 20 Hz to ensure uniform sampling. As participants typically took a few seconds at the start of each trial to initiate and stabilize their ratings, the first 5 seconds of each trial were discarded. To obtain a singular representation of the CRs and facilitate comparison with the single rating (SR), CRs indices (CRi) were derived from the CRs. This involved computing various characteristics of the CRs distribution over time, including last rating, central tendencies such as mean, median, and mode, dispersion tendencies including maximum (max), minimum (min), standard deviation (std), coefficient of variation (cv), and interquartile range (iqr), shape of the distribution such as skewness (skew) and kurtosis, and area under the curve (auc).
A Sense of Presence score was calculated from the two questions by reverse coding the second question and computing the mean of both questions. An Usability score was calculated from the SUS questionnaire by adapting the standard procedure to a shorter version of the survey and a different Likert scale. As there were 7 questions with responses within the 0–6 range, for each of the even numbered questions (positive), we subtracted 0 from the response; for each of the odd numbered questions (negative), we subtracted their value from 6. We added all the new values together and multiplied this score by 100/(7*6) = 2.38 in order to have a total score within the 0–100 range. iVR experience scores were derived by computing the mean of the two questions about iVR and gaming experience.
Study 1: Selection
The Selection study aimed to design, refine and evaluate our CRs method and the different feedback options, suitable for use in a 360° iVR environment, by assessing their comparability with SR and evaluating Interference and User Experience characteristics, to identify the most effective feedback for the AffectTracker. To support this aim, we selected 60-s videos from YouTube, allowing for multiple repetitions of the experimental conditions (Table 2). These videos were specifically curated to elicit low affective variability (over time), featuring emotional-inducing content with minimal events, and were positioned within distinct affective quadrants of the arousal-valence space. This type of stimulus (i.e., inducing stable - constant over time - affective experiences) was chosen to carefully extend the classical approach of a short event-related stimulus associated with a SR, as an intermediate type of stimulus between static images and long eventful videos.
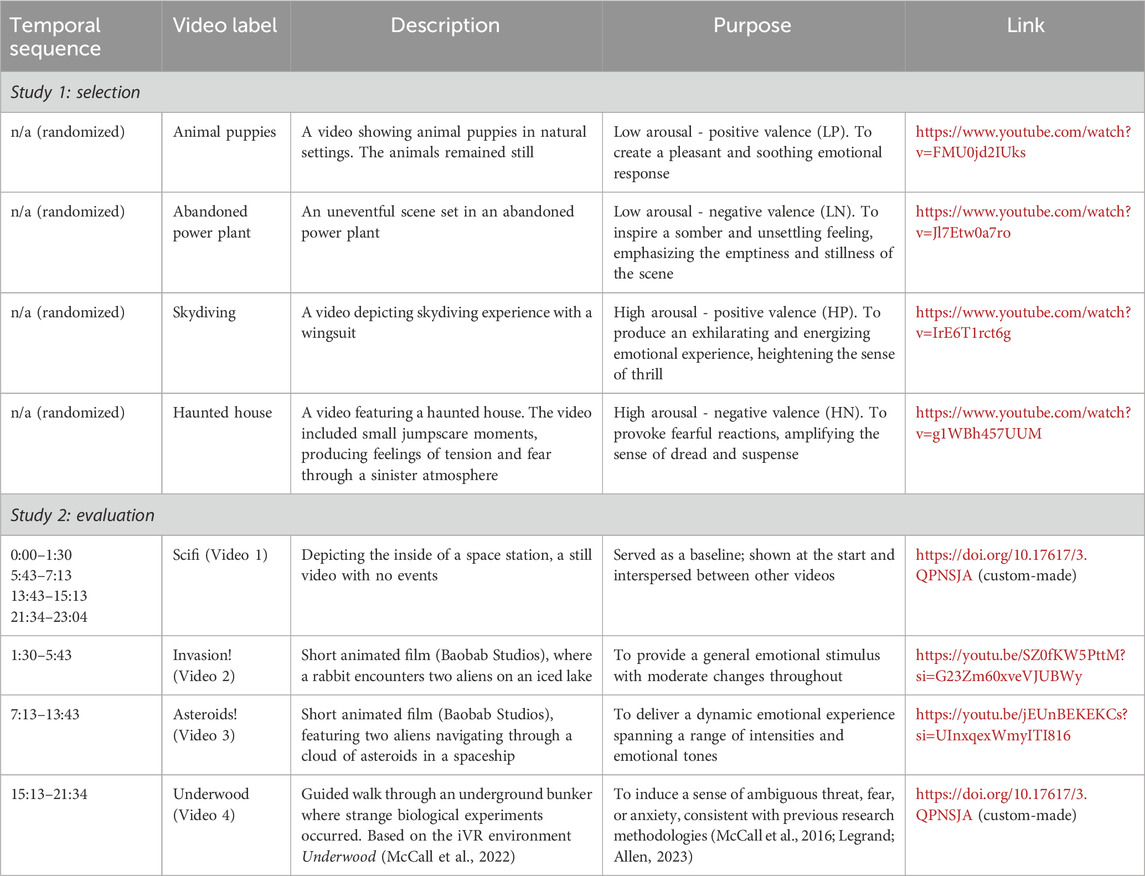
Table 2. Detailed descriptions of the 360° VR videos used in Study 1: Selection and Study 2: Evaluation.
Feedback for continuous rating (CR)
Participants rated their affective state continuously during the video presentation and with a SR after the video, using the touchpad on the iVR controller. The possible range for all ratings on both dimensions was [-1 1]: the square affect grid was fitted (i.e., inscribed) into the circle of the touchpad, that is, input values of the round touchpad were restricted (Mathf.Clamp function in Unity). During the CR, the participant’s thumb trajectory on the touchpad was recorded at a sampling frequency of 20 Hz. In the case their thumb was off the touchpad (e.g., participants inadvertently stop rating for a short period of time), “NaN” values were recorded. During the SR, the participants placed their thumb on the position corresponding to their subjective experience and validated their rating by pressing the trigger button on the iVR controller.
Three prototypes of feedback for CR were tested in a pilot study with 12 participants which was conducted to verify the feasibility of the Selection study and to refine the design and functionality of the different feedback options (see Supplementary Material S1 for a detailed description of the feedback development and the pilot study). The Selection study included the refined feedback options derived from the insights gained in the pilot study (Figure 1).
When using the Grid feedback, participants encountered a simplified version of the affect grid, featuring valence on the x-axis (negative to positive) and arousal on the y-axis (low to high). A dot continuously represented their momentary rating in this valence-arousal space. In case of no rating (thumb off the touchpad), the dot disappeared.
Conversely, the Flubber feedback presented participants with an abstract shape called Flubber, dynamically changing based on their affective ratings. Low-level visual properties were mapped onto the Cartesian coordinates in the grid. Thus, y coordinates corresponded to arousal, with projection’s amplitude (set to defaults values: min: 0.2, max: 0.4) and oscillation frequency (set to defaults values: min: 0.5, max: 2.5) varying with arousal levels. Of note, the frequency of the oscillations was tailored to [0.5 2.5] Hz after experimenting during the pilot. Meanwhile, x coordinates represented valence, with projection’s smoothness (set to defaults values: min: 0, max: 1), projection’s time synchronization (set to defaults values: min: 0.8, max: 0) and projection’s amplitude difference (set to defaults values: min: 0.8, max: 0) reflecting different valence levels. For example, placing their thumb on the lower left side (e.g., −1,-1 coordinate) of the touchpad would thus result in a slowly pulsating Flubber with irregular angular projections, representing the participant’s experience of low arousal and negative valence. Similarly, placing their thumb on the top right side (e.g., 1,1 coordinate) of the touchpad would thus result in a quickly pulsating Flubber with regular smooth projections, representing the participant’s experience of high arousal and positive valence. In case of no rating (thumb of the touchpad), the Flubber turned into a still disk.
Finally, with the Proprioceptive feedback, no visual feedback was given. Participants needed to rely solely on their thumb’s proprioceptive awareness on the touchpad, indicating their position in the valence-arousal space. To ensure participants would not forget to continuously rate when no feedback was provided, the iVR controller vibrated periodically every 2 seconds (0.5 Hz frequency, independent of the ratings) as a reminder.
Study design
The observational study employed a 4x4 within-subjects design with two factors with four levels each: feedback (Grid, Flubber, Proprioceptive and Baseline) and videos that could each elicit affective responses within a different quadrant of the valence-arousal space (high arousal - negative valence [HN], high arousal - positive valence [HP], low arousal - negative valence [LN], and low arousal - positive valence [LP]). A nested randomization of the videos within blocks and blocks across subjects was performed, using custom Python scripts and the numpy.random package.
Experimental design and measured variables
The experimental design is illustrated in Figure 2A. The total duration of the experiment was approximately 1 hour (see Supplementary Material S2 for the detailed session script).
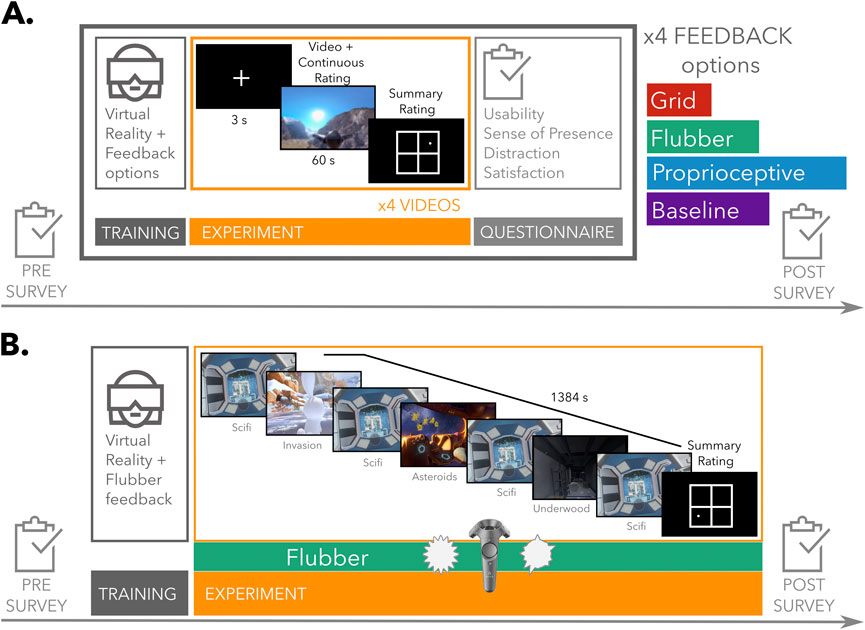
Figure 2. Experimental design of both studies. (A) Study 1: Selection. The experiment lasted approximately 1 hour and consisted of four blocks, each containing one of three continuous rating (CR) feedback conditions—Grid, Flubber, and Proprioceptive—or a Baseline condition without CR. Participants completed a training phase, where they interacted with 2D images from the International Affective Picture System (IAPS), followed by a trial phase with 360° iVR videos that elicited affective responses. CR and summary rating were collected in each trial. After each block, participants evaluated the User Experience and Interference through questionnaires about Distraction, Usability, Satisfaction, Emotional representation, and Sense of Presence. (B) Study 2: Evaluation. Experiment duration was approximately 1 hour and included a training phase followed by a trial involving a 23-min sequence of 360° stereoscopic videos. Participants continuously rated their affective experience using the Flubber feedback and provided a summary rating at the end of the video. Video 1 (Scifi), serving as a neutral baseline, was repeated between the emotionally evocative videos. Before and after the experiment, participants completed surveys, including the SSQ, MAIA, TAS, and questions on User Experience and Interference.
The experiment comprised three conditions in which participants continuously rated their affective experience using different feedback options: Grid, Flubber, and Proprioceptive. Additionally, a Baseline condition with no CR during the videos was included. The four conditions were presented in random order across four blocks of trials. Each block consisted of three phases: training, four trials in which CR and SR scores were collected, and a questionnaire session with in-iVR questions.
During the training, participants were shown four 2D pictures from the International Affective Picture System (IAPS; Bradley and Lang, 2007), each representing one quadrant of the valence-arousal space. These pictures were randomly presented for a maximum of 100 s each, allowing participants to self-pace, and were combined each time with a different feedback. After a welcome screen, participants familiarized with the iVR environment, followed by a brief introduction to the feedback or Baseline condition. A 3-s fixation cross preceded the picture presentation, during which participants could become accustomed to the feedback. The training concluded with a screen summarizing the instructions for reporting affective states for that specific block. At the beginning of the experimental part, participants were instructed to start rating at the beginning of the videos (i.e., place their thumb on the touchpad) and keep their thumb on the touchpad for the entire duration of the videos. Importantly, participants should slide/move their thumb (i.e., update their rating) whenever they perceived a change in their affective state; they were not prompted at fixed intervals. Additionally, they were explicitly instructed to rate how they subjectively felt (moment-to-moment), rather than rating the stimulus itself (i.e., what they perceive the videos to be). For each block, 360° videos with 4K (4096 × 2160 pixels) resolution were used to elicit an affective response. The videos were edited to 60 s each and shown four times overall, once in each of the four blocks, in a randomized order. Each experimental block began with a 3-s fixation cross, followed by one of the videos combined with the feedback or Baseline condition, and concluded with a screen for SR.
Upon completion, a final screen appeared, signaling the end of the procedure and thanking the participants for their involvement.
Statistical analysis
All data were analyzed using custom scripts in R (version 4.1.0) and Python (version 3.11). To examine associations between CRis and SR, Pearson correlations were computed between each CRi and the corresponding SR across all conditions (feedback and videos) and participants. To investigate the influence of the feedback options on these associations, correlation coefficients between each feedback were compared. Specifically, differences in Pearson’s r for each pair of feedback were statistically tested using the cocor package in R (Diedenhofen and Musch, 2015), treating the correlations as two non-overlapping correlations based on dependent groups.
Comparison between feedback options - interference and user experience
The differences in Interference between feedback options were examined both (1) directly, using the Distraction and Sense of Presence questionnaires, and (2) indirectly, investigating differences between SRs during CR rating (i.e., during each feedback condition [SRfeedback]) and no rating (i.e., baseline [SRbaseline]). The differences in User Experience were examined through the Usability, Satisfaction and Emotion Representation questionnaires. Differences in Distraction, Sense of Presence, Usability, Satisfaction, and Emotion Representation scores were tested using a Type 3 ANOVA with the factor feedback (four levels: Grid, Flubber, Proprioceptive, Baseline), followed by post hoc t-tests (with false discovery rate [FDR] correction) to explore specific differences within feedback. For each feedback, differences between SRfeedback and SRbaseline were assessed using paired t-tests.
Equivalence tests were conducted using the TOST (Two One-Sided Tests) approach (Lakens et al., 2018). For the questionnaire comparison, equivalence tests were conducted using a SESOI of 7 points for Usability scores on a 0–100 scale and 0.5 for the other scores. For the SR comparison, a SESOI of 0.125 points (raw effect size) on a scale ranging from −1 to 1 for arousal and valence was chosen.
Study 2: Evaluation
The Evaluation study aimed to assess the selected feedback and compare CR to SR during a longer and more varied 360° iVR stimulus, while also re-evaluating User Experience and Interference factors.
Additionally, data of a subset of participants who performed the experiment in a standing position instead of being seated were collected in the Berlin site only, with the aim to perform a sub-analysis by exploring the effects of body posture on emotion ratings (Nair et al., 2015). Such effects may be subtle for self reports but more pronounced for cardiorespiratory signals (Widmaier and Raff, 2022), which we aimed to acquire in a later phase of the project.
To curate the ideal stimulus, we followed specific requirements: the videos needed to be 360-degree, have a resolution of 4K (minimum 3840x2160 pixels), be stereoscopic (top-bottom), and have a duration of around 20 min. Importantly, the videos had to offer high affective variability (over time) with dynamic storytelling, containing many events to contrast the more stable emotion-inducing or uneventful videos used in the Selection phase. The stimulus needed to cover multiple quadrants of the affect grid, avoiding restriction to just one. Additionally, no language or text should be present to prevent language barriers or emotional labeling. For the sake of immersion and continuity, the videos had to either be fully computer-generated or fully based on real-life captures, with no mixing of the two. As no single video met all these criteria, we created a continuous sequence of videos as a compromise to best meet our requirements and provide the necessary immersive and affectively rich experience for the study (Table 2).
Feedback for continuous rating (CR)
The feedback used in the Evaluation study and subject of the validation was the Flubber already described in the section related to feedback for CR of the Selection study (Figure 1). Similarly, the sampling frequency was set to 20 Hz and the possible range for all ratings on both dimensions was [-1 1]. In the case their thumb was off the touchpad (e.g., participants inadvertently stop rating for a short period of time), “NaN” values were recorded and the Flubber turned into a still disk. To enhance the user experience, some modifications were implemented. Notably, to ensure visibility across various backgrounds, we incorporated an outline and a halo.
Study design
The observational study involved a continuous sequence of videos carefully selected to encompass the entire spectrum of the valence-arousal space (including high arousal - negative valence, high arousal - positive valence, low arousal - negative valence, and low arousal - positive valence). The sequence of videos was 1384 s long.
Experimental design and measured variables
The experimental design is illustrated in Figure 2B. The total duration of the experiment was approximately 1 hour (see Supplementary Material S3 for the detailed session script).
The in-iVR session comprised a training phase and a trial involving a 23-min video, during which participants continuously rated their affective experience using the Flubber feedback and provided a SR at the end of the video.
During the training phase, participants were shown the LP video from the Selection study combined with the Flubber, followed by the SR. The video presentation, allowing participants to become accustomed to the feedback, was preceded by a 3-s fixation cross. The training concluded with a screen summarizing the instructions for reporting affective states for the following trial session.
Before the experimental part, participants were given the same instruction as for Study 1, that is, they were instructed to start rating at the beginning of the sequence of the videos (i.e., place their thumb on the touchpad) and keep their thumb on the touchpad during the entire duration of the videos. Importantly, participants should slide/move their thumb (i.e., update their rating) whenever they perceived a change in their affective state; they were not prompted at fixed intervals. Additionally, they were explicitly instructed to rate how they subjectively felt (moment-to-moment), rather than rating the stimulus itself (i.e., what they perceive the video to be). The experiment began with a 3-s fixation cross, followed by an uninterrupted sequence of videos where participants continuously rated their affective states visualized by the Flubber, and concluded with a screen for SR. Four 360° stereoscopic videos were used for the experiment. Table 2 shows the details of the selected videos. The videos were linked together by 2s fade-in and fade-out to create a continuous sequence. Video 1, chosen for its neutral content to serve as a baseline, was presented at the beginning and in between each of the three more emotionally engaging videos, making it the only video repeated four times. This baseline placement is intended to provide a consistent reference point, which could be especially valuable for future studies involving physiological measures, such as heart rate or skin conductance, to assess the physiological impact of emotional stimuli.
A video of an exemplary participant performing CR during an excerpt of the video sequence (Scifi and Underwood videos) is available here: https://doi.org/10.17617/3.QPNSJA.
Statistical analysis
To analyze associations between the different CRis and SR, Pearson correlations were initially conducted between each CRi and the corresponding SR. Subsequently, to compare correlations between the CR mean and SR for the Flubber feedback between the Selection and Evaluation studies, the correlation coefficients from the two studies were subjected to Fischer r-to-z transformation. This allowed the statistical assessment of the difference between two independent correlation coefficients.
To compare the variability of the CRs between the Selection and Evaluation studies, the standard deviation (std) of the CRs for each participant, each video and each affective dimension was computed and entered into ANOVAs with factor video (5 levels: Selection HN, Selection HP, Selection LN, Selection LP, Evaluation). Post-hoc t-tests (with Bonferroni correction) were then employed to explore specific differences between the videos.
To compare responses between the Selection and Evaluation phases, a Type 3 ANOVA with the factor study (two levels: Selection, Evaluation) was performed. Post-hoc t-tests were then employed to explore specific differences within studies.
Results
Participants
Table 3 shows the baseline characteristics of the participants for both studies. In Study 1: Selection 51 participants were included, while Study 2: Evaluation comprised 82 participants.
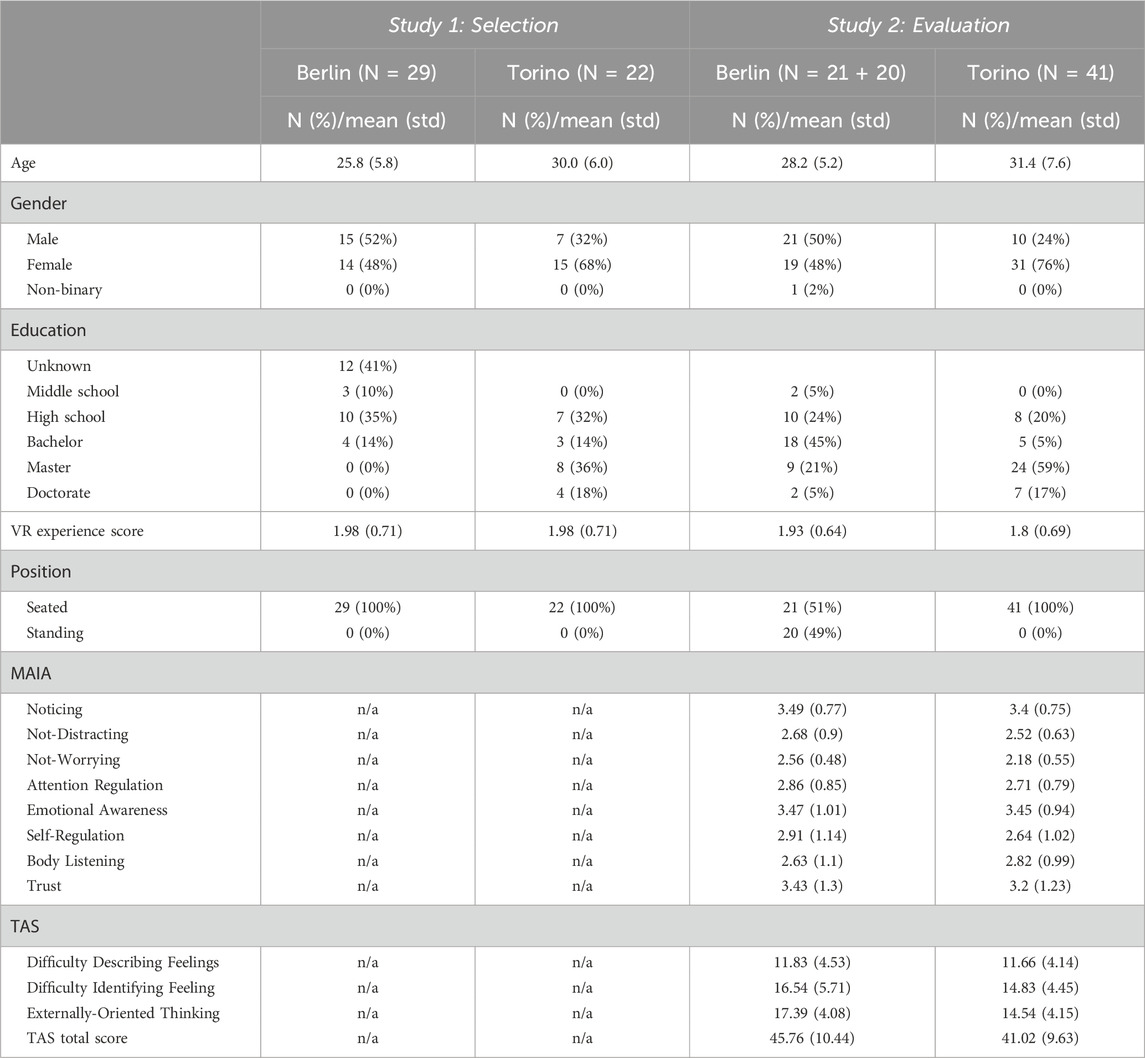
Table 3. Description of the samples for Study 1: Selection and Study 2: Evaluation.
The subset of participants in a standing position in Study 2: Evaluation consisted of 20 subjects. Sub-analyses investigating differences in body posture are reported in the Supplements (see Supplementary Table S8).
The results presented below are from analyses performed on the seated participants only (Study 1: Selection N = 51; Study 2: Evaluation N = 62).
Study 1: Selection
CR and SR
CR mean (over timepoints) and SR are described in Table 4 and illustrated in Figure 3. There were no significant differences between test sites of both CR mean (valence: t (610) = 1.27, p = 0.204; arousal: t (610) = −0.25, p = 0.802) and SR (valence: t (814) = 1.30, p = 0.193; arousal: t (814) = −0.92, p = 0.357) for both affective dimensions. Of note, CR means and SRs for each video were consistent with the quadrants they were selected for. Mean CR time-series across participants are shown in Figure 6.
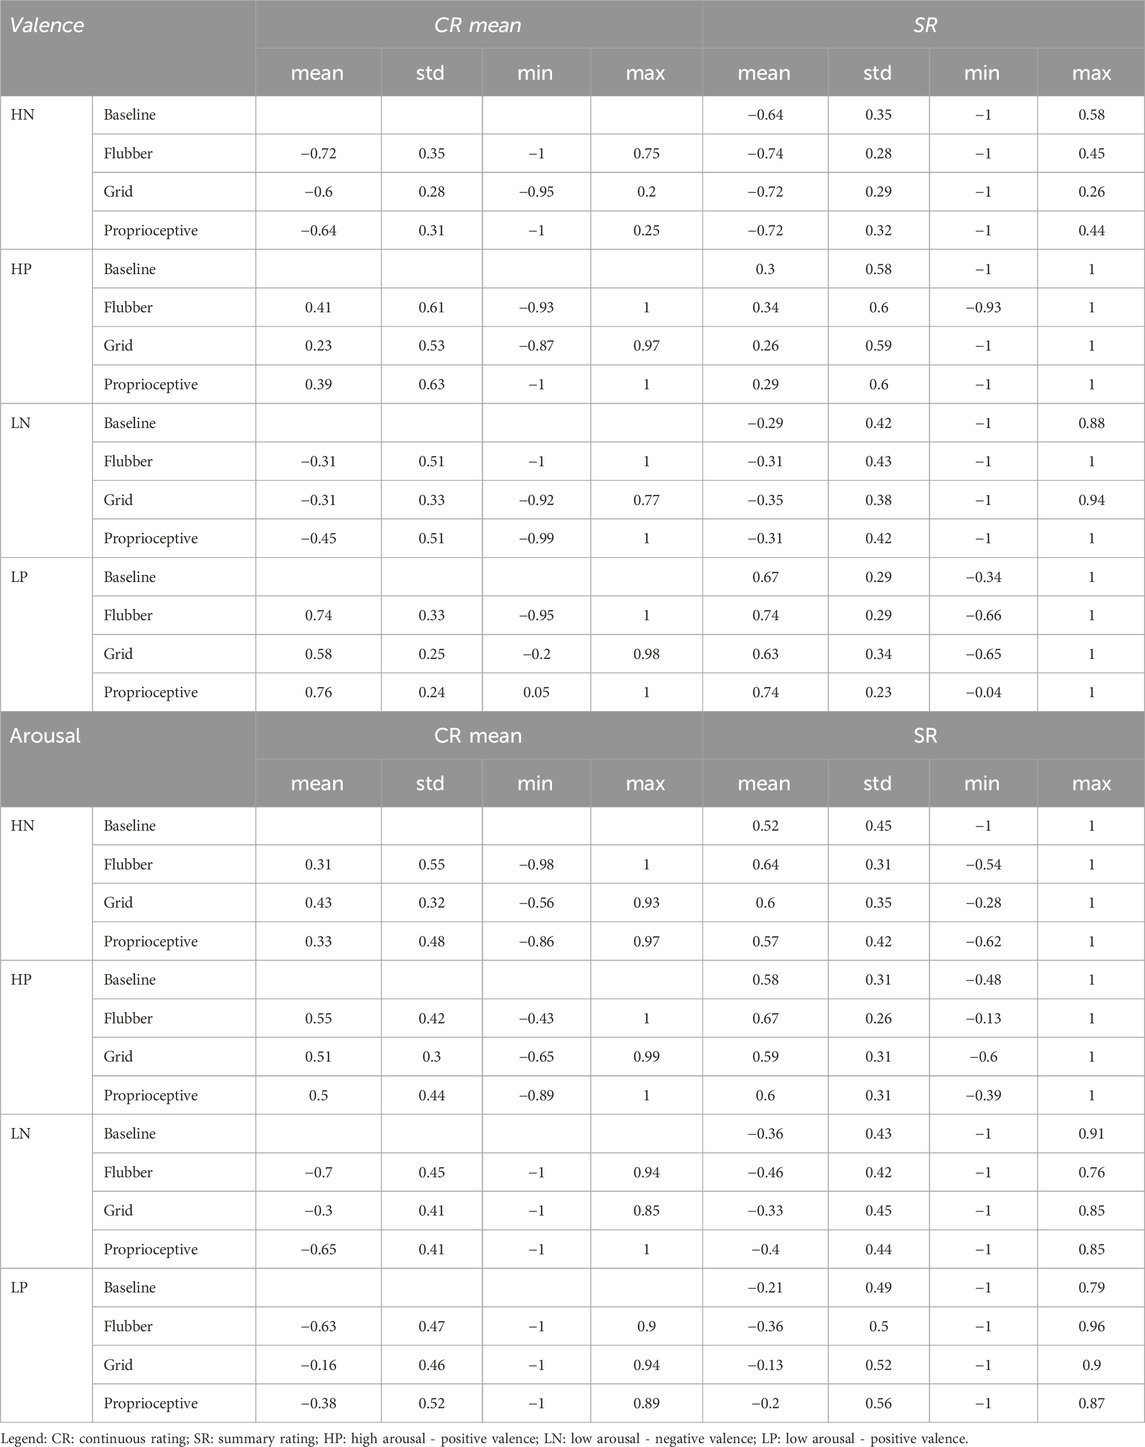
Table 4. Descriptive statistics of CR mean and SR for each feedback and each video in Study 1: Selection.
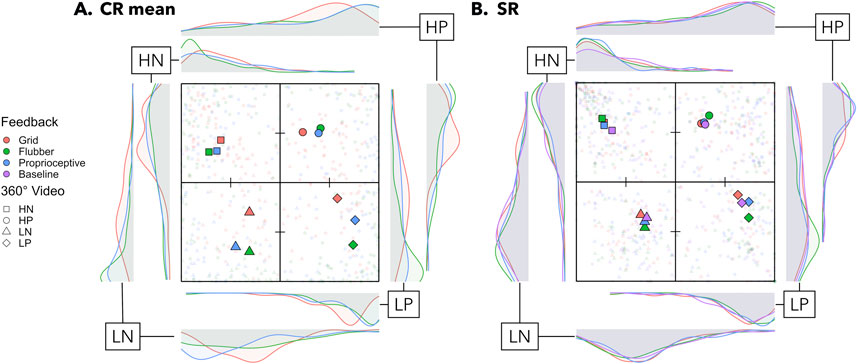
Figure 3. Overview of the ratings in Study 1: Selection. (A) Means across participants of the CR mean (over timepoints) for each feedback (color coded; Grid: red, Flubber: green, Proprioceptive: blue, Baseline: purple) and each video (shape coded). Density plots and individual dots are also shown for each feedback and each video. (B) SRs for each feedback and each video. Density plots and individual dots are also shown for each feedback and each video. CR means and SRs were consistent with the quadrants the videos were selected for. HN: high arousal - negative valence; HP: high arousal - positive valence; LN: low arousal - negative valence; LP: low arousal - positive valence.
For each affective dimension (valence, arousal), we computed Pearson correlations between SR and each CRis across all feedback options, videos, and participants. CR mean was the most correlated to the SR (valence: r (CR_mean-SR) = 0.926, p < 0.001; arousal: r (CR_mean-SR) = 0.873, p < 0 .001, see Table 5). Therefore, for the following analyses comparing the different feedback options, the focus was on the CR mean. More details and other CRis can be found in the Supplementary Material.
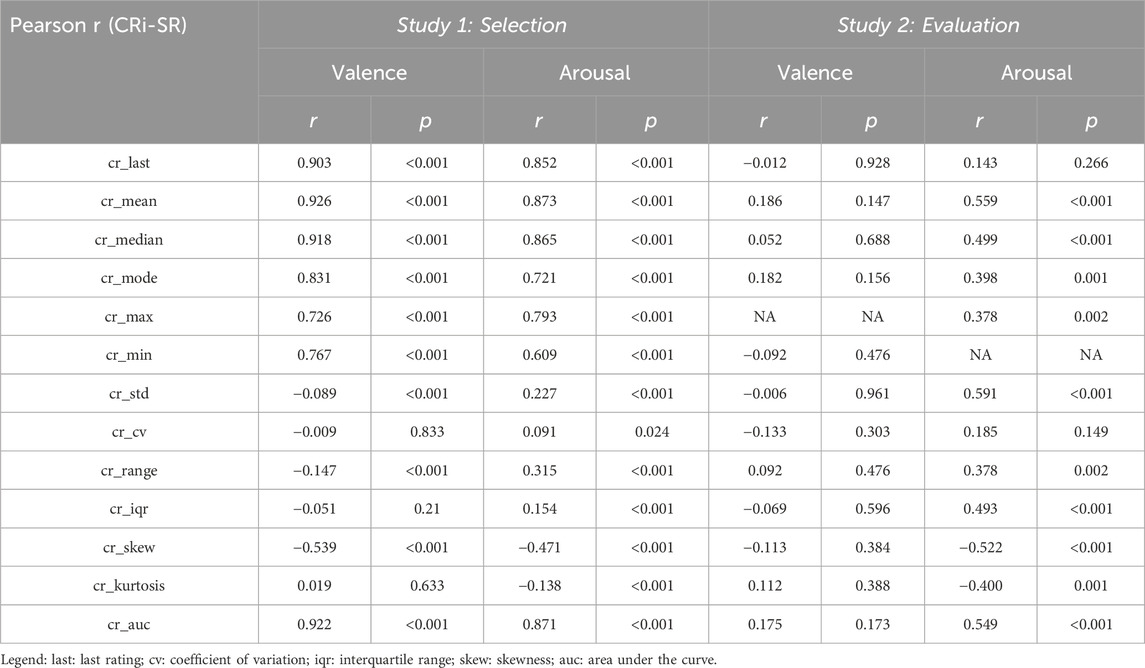
Table 5. Pearson correlations between SR and each CR indices, across all feedback options, videos and participants, in Study 1: Selection and Study 2: Evaluation.
Feedback comparison
CR mean-SR correlation
The CR means were equivalent between Flubber and Proprioceptive (TOST approach, all p > 0.05 for difference; all p < 0.025 for equivalence, see Supplementary Table S4). There was a significant difference between Grid and the other two feedback options (i.e., Flubber and Proprioceptive) for the dimension of arousal (all t > 5.3; all p < 0.001; see Supplementary Table S4), but not for valence. Additional feedback comparison of CR std, skewness and kurtosis can be found in Supplementary Table S4.
The SR for all feedback options and during Baseline were equivalent for both affective dimensions (TOST approach, all p > 0.05 for difference, all p < 0.010 for equivalence, see Supplementary Table S4).
Finally we compared the correlations between CR mean and SR for each feedback and affective dimension. For valence, there were no significant differences in CR mean-SR correlation between feedback options (all z < 1.5; all p > 0.125, see Figure 4;Supplementary Table S4). For arousal, the correlation for Grid was significantly higher than for the other two feedback options (all z > 2.2, all p < 0.025, see Figure 4; Supplementary Table S6).
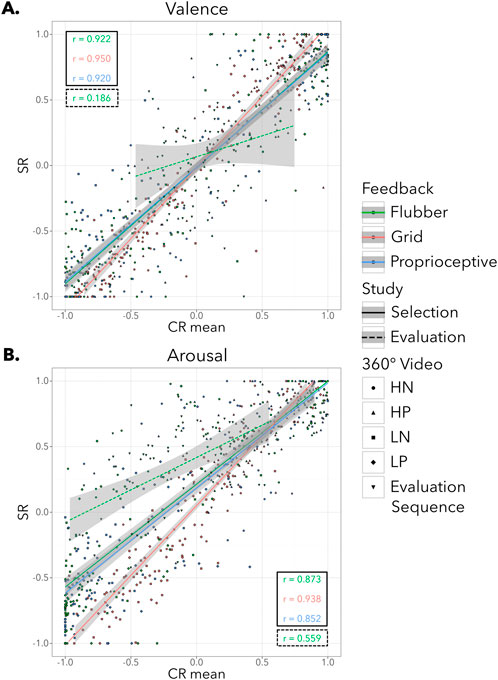
Figure 4. Correlation between continuous rating (CR) mean and summary rating (SR). (A) Valence dimension. SR plotted against CR mean for each feedback (color coded; Grid: red, Flubber: green, Proprioceptive: blue) and each video (shape coded), both for the Selection and Evaluation studies. There were no significant differences in CR mean-SR correlation between feedback options (all z < 1.5; all p > 0.125), in the Selection study. (B) Arousal dimension. The correlation for Grid was significantly higher than for the other two feedback options (all z > 2.2, all p < 0.025), in the Selection study. HN: high arousal - negative valence; HP: high arousal - positive valence; LN: low arousal - negative valence; LP: low arousal - positive valence.
Questionnaires
Scores to each questionnaire are described in Table 6 and illustrated in Figure 5.
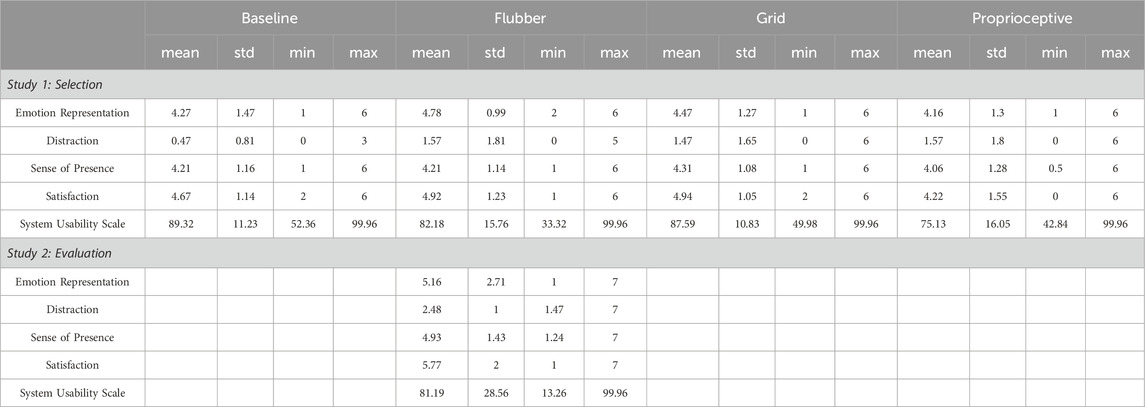
Table 6. Descriptive statistics of each questionnaire for each feedback in Study 1: Selection and Study 2:Evaluation.
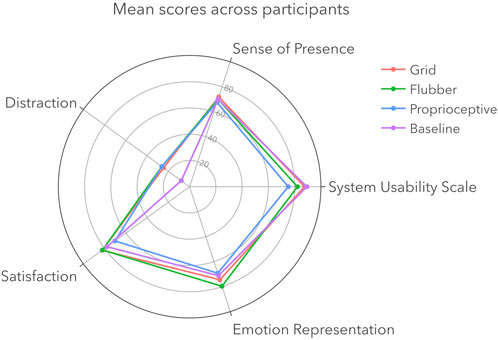
Figure 5. Questionnaires mean scores across participants for each feedback (color coded; Grid: red, Flubber: green, Proprioceptive: blue, Baseline: purple), in Study 1: Selection. Scores are normalized to 0–100 for visualization purposes. Distraction and Sense of Presence were part of the Interference assessment of the feedback options, while Usability, Satisfaction and Emotion Representation were part of the User Experience assessment.
Differences in Distraction, Sense of Presence, Usability, Satisfaction, and Emotion Representation scores were tested comparing participants’ responses to the different questionnaires between the feedback options and including Baseline (i.e., no CR, only SR; see Figure 5; Supplementary Table S7).
For the Distraction questionnaire, there was a significant effect of feedback (F (3) = 6.8, p < 0.001), where no CR during videos (i.e., Baseline condition) was significantly less invasive than CR during videos (i.e., for all of the feedback options; all t > 4.0; all p < 0.001). Importantly, there were no significant differences between the feedback options (all t < 0.33; all p > 0.992). For Sense of Presence, there was no significant effect of feedback (F (3) = 1.23, p = 0.301). The responses were equivalent for all feedback options as well as the Baseline condition (TOST approach, all p > 0.310 for difference, all p < 0.020 for equivalence). For Usability, there was a significant effect of feedback (F (3) = 17.9, p < 0.001). The SUS scores were the highest for Grid and Baseline (all |t| > 2.5, all p < 0.020). The SUS score was also higher for Flubber than Proprioceptive (t (50) = 3.0, p = 0.010). For Emotion Representation, the score was significantly higher for Flubber than for Proprioceptive (t (50) = 3.6, p < 0.001) and equivalent between Grid, Proprioceptive and Baseline (TOST approach, all p > 0.090 for difference, all p < 0.050 for equivalence). For Satisfaction, there was a significant effect of feedback (F (3) = 4.87, p = 0.003). The scores were equivalent for Flubber and Grid (TOST approach, p = 0.920 for difference, all p < 0.010 for equivalence), while scores for Proprioceptive were lower than for Flubber and Grid (all t < 3.01, all p > 0.010). Finally, Flubber was ranked first as preferred feedback (62% of participants) and Grid second (27% of participants). Figure 5 shows a radar plot illustrating the mean scores of questionnaires across participants for each feedback.
Study 2: Evaluation
Sample
The characteristics of the sample that participated in the Evaluation study are illustrated in Table 3. Results of MAIA mean scores indicated that the participants generally had an overall good ability to recognize and understand bodily sensations related to emotions. TAS-20 scores are within the non-alexithymic range.
CR and SR
CR mean (over timepoints) and SR are described in Table 7. There was no significant effect of test site (valence: F (1) = 1.78, p = 0.187; arousal: F (1) = 0.40, p = 0.528) or gender (valence: F (2) = 1.87, p = 0.162; arousal: F (2) = 1.24, p = 0.294) on CR mean for both affective dimensions.
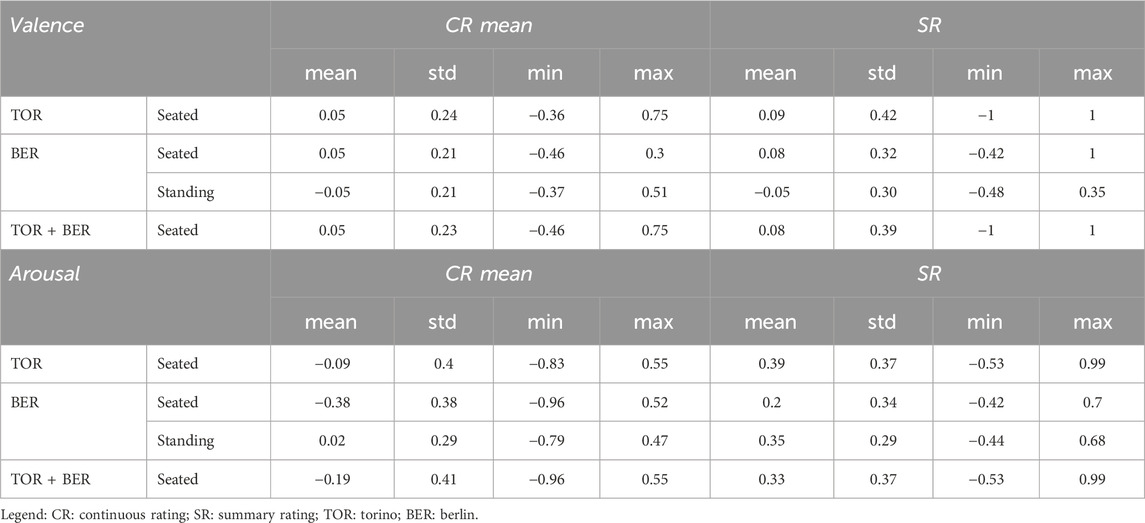
Table 7. Descriptive statistics of CR mean and SR for each test site and each body posture in Study 2: Evaluation.
There was no significant effect of test site (valence: F (1) = 0.10, p = 0.755; arousal: F (1) = 1.93, p = 0.169) or gender (valence: F (2) = 0.91, p = 0.406; arousal: F (2) = 0.18, p = 0.835) on SR for both affective dimensions.
Similar to the Selection study, Pearson correlations between SR and CRis were computed for each affective dimension (Table 5). We found that for valence the CR mean exhibited the highest correlation with the SR (r (CR_mean-SR) = 0.186, p = 0.147), while for arousal it was the CR std (r (CR_std-SR) = 0.591, p < 0.001).
Comparison Selection vs. Evaluation
CR variability
Figure 6 presents the time-series of the CR averaged across participants for both affective dimensions and both phases. As anticipated, there was minimal variability in the ratings during the Selection study, whereas higher variability was observed during the Evaluation study.
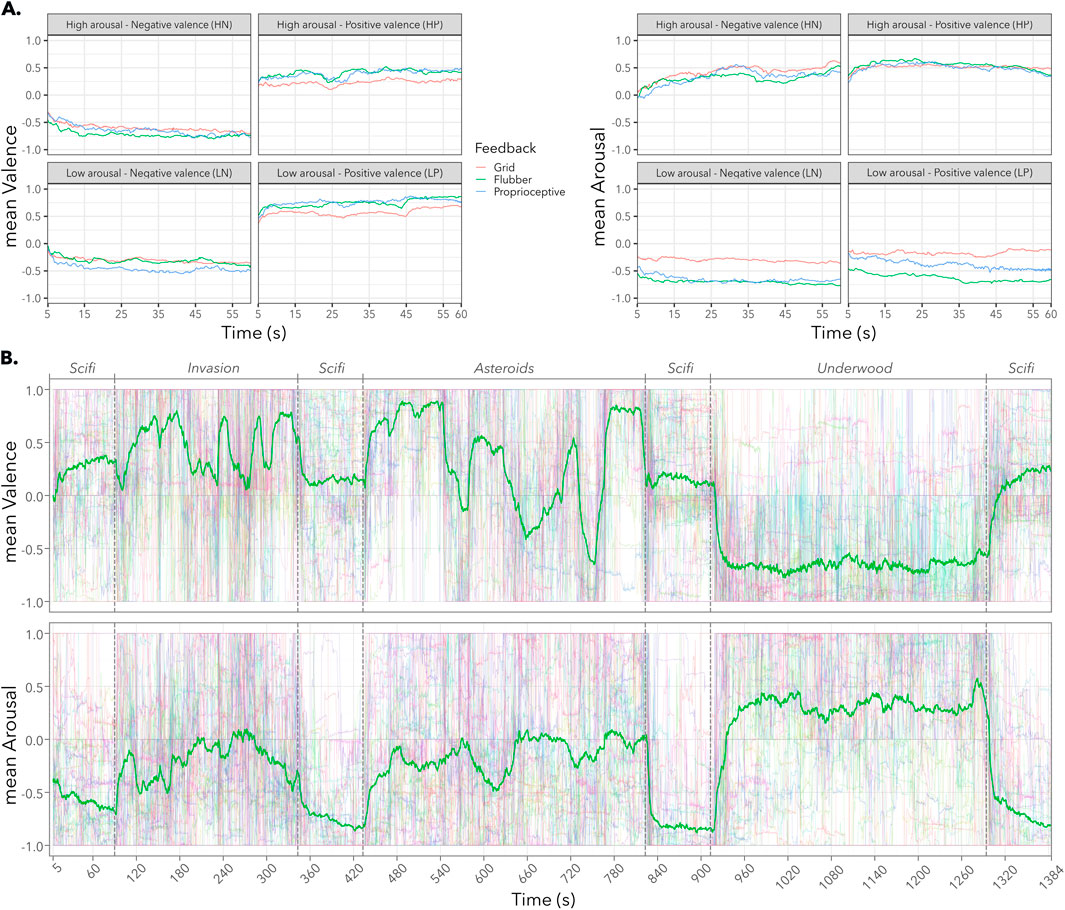
Figure 6. Comparison of time-series of continuous ratings (CRs, possible range for both affective dimensions: [-1 1]). (A) Study 1: Selection. Average across participants for each feedback (color coded; Grid: red, Flubber: green, Proprioceptive: blue) and each video (shape coded), for valence (top) and arousal (bottom). CRs show low affective variability and are in line with the videos’ quadrants. (B) Study 2: Evaluation, with Flubber only. Average across participants for valence (top) and arousal (bottom). CRs show high affective variability over time. Colored lines: individual participants; green line: mean across participants.
To compare the variability of the CRs with the Flubber feedback between the two studies, ANOVAs (type 3) with factor video (five levels: Selection HN, Selection HP, Selection LN, Selection LP, Evaluation Sequence) were performed for CR std, for each affective dimension. There was a significant effect of video (valence: F (4) = 93.0, p < 0.001; arousal: F (4) = 79.3, p < 0.001) on CR std for both affective dimensions. Post-hoc t-tests revealed higher CR variability for Evaluation Sequence compared to the four Selection videos, for both affective dimensions (all |t| > 10.4, p < 0.001, see Figure 7; Supplementary Table S9).
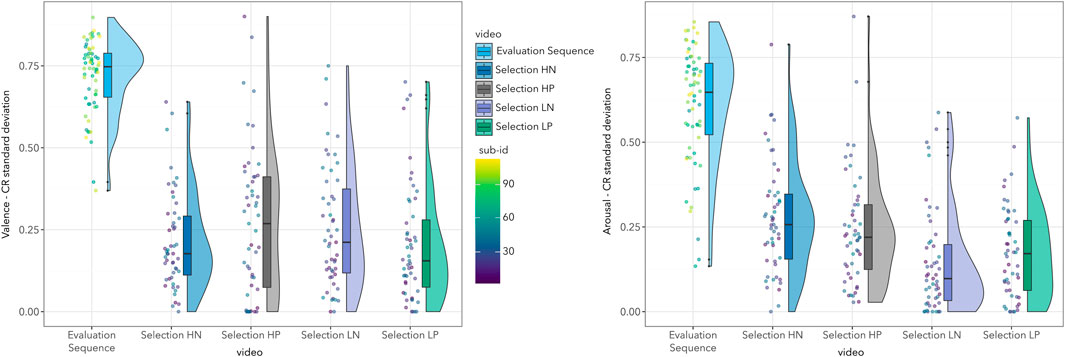
Figure 7. Comparison of variability of continuous ratings (CRs) between Stud1: Selection and Study 2: Evaluation. Standard deviation (std) of the CRs for each video in the two studies, for valence (left) and arousal (right). CRs during the Evaluation Sequence showed higher variability than during the four Selection videos (all |t| > 10.4, p < 0.001, see Supplementary Material). HN: high arousal - negative valence; HP: high arousal - positive valence; LN: low arousal - negative valence; LP: low arousal - positive valence.
CR mean-SR correlation
The highest CRi-SR correlation for Flubber during Study 1: Selection (valence and arousal: r (CR_mean-SR)) was significantly lower than the highest CRi-SR correlation during Study 2: Evaluation (valence: r (CR_mean-SR), arousal: r (CR_std-SR)), for both affective dimensions (valence: z = 9.5, p < 0.001; arousal: z = 4.5, p < 0.001).
Questionnaires
To compare questionnaire responses to Flubber between the two studies (see Table 6), an ANOVA (type 3) with the factor study (two levels: Selection, Evaluation) was conducted. Subsequently, post hoc t-tests were employed to explore specific differences within studies. Notably, there was no significant effect of study on the scores for Distraction, Sense of Presence, Usability, and Satisfaction (all F < 1.53, all p > 0.220, see Supplementary Table S10). For Emotion Representation, we found a significant effect of study (F (1) = 10.95, p < 0.001), with higher responses for Study 1: Selection than for Study 2: Evaluation (t (107) = 3.31, p < 0.001).
Discussion
Summary of main findings
The aim of this study was to develop and empirically evaluate the AffectTracker, a tool to collect continuous valence and emotional arousal ratings (Sabat et al., 2024) during a dynamic affective experience, simultaneously and with minimal interference (Bakker et al., 2016). It comprises three feedback options with adjustable features: a simplified affect grid (Grid; Russell et al., 1989), an abstract pulsating visual variant (Flubber), and a proprioceptive variant without visual feedback. We empirically evaluated the AffectTracker in two studies with 360-degree videos in iVR as stimuli and using the HTC Vive Pro controller’s touchpad (Riva et al., 2007; Chirico and Gaggioli, 2019).
In Study 1 (“Selection”), the three feedback options were compared to each other as well as to a control condition without continuous ratings. Overall, we find that (1) CR in real-time captures variance of affective experience with (2) high user experience, while (3) minimally interfering with the experience itself. Based on the quantitative results and the qualitative assessment, Flubber was selected for Study 2 (“Evaluation”), which included a longer (23-min) and more variable iVR stimulus (stereoscopic 360° video). Overall, the results from Study 1 were confirmed in Study 2, indicating Flubber’s applicability for both shorter and repeated as well as longer and more variable videos. Study 2 differed from Study 1 by (1) involving only one (Flubber) instead of four conditions (Grid, Flubber, Proprioceptive, Baseline) and by (2) stimulation with one longer experience with higher affective variability instead of four repeated videos with less affective variability. These differences in setup led to two notable differences in the results: First, participants in Study 2 rated the Flubber feedback lower in terms of how well it represented their “inner emotions.” Second, the correlation between the SR and the CR mean was lower in Study 2, while the standard deviation emerged as the most correlated CR index. This suggests that CR could capture nuances of affective experience that a single SR may miss, particularly during extended and complex emotional stimuli.
AffectTracker provides flexibility by allowing researchers to choose between feedback options, depending on the specific needs of their study—whether a more engaging, dynamic representation (like the Flubber) or a more precise, structured visualization (as the Grid) is preferred. Its main contribution is to collect CR of affective experience - compared to the more traditional SR - with minimal interference and high user experience.
Comparing continuous and summary ratings
Both the mean and the standard deviation of CRs were significantly correlated with the SR across participants. This suggests that participants integrate or implicitly consider both aspects of their affective experience, that is, the central tendency and the dispersion, when providing SRs rather than the peak or final moments (Fredrickson, 2000; Levine and Safer, 2002; Kaplan et al., 2016).
The correlation between CR and SR was more pronounced for emotional arousal than for valence. This may indicate that emotional arousal, being more dynamic, is easier for participants to track and summarize than valence, which may involve more complex, context-dependent appraisals. This observation can be better understood in light of theoretical and empirical insights into the interplay between arousal and valence. For instance, emotional arousal has been shown to modulate valence by enabling greater variability in valence during high-arousal states (Petrolini and Viola, 2020). This suggests that arousal not only enhances the salience of stimuli but also shapes how valence is experienced and reported. Such a dynamic is consistent with findings indicating that arousal facilitates attentional shifts and enhances visual processing of salient targets (Sutherland and Mather, 2018; Petrolini and Viola, 2020). Together, these insights underscore the distinct but interrelated roles of arousal and valence in shaping affective experiences, highlighting the importance of capturing both dimensions and considering their unique characteristics when interpreting continuous rating data (Kuppens et al., 2013).
For the 1-min videos with low affective variability in Study 1, the mean of CRs were highly correlated to the SRs, indicating that CR with AffectTracker (irrespective of the feedback options) can effectively capture relatively stable affective experiences, that is, experiences that are rather constant over time and whose minimal variance can also be adequately indexed by single SRs.
For the 23-min experience in Study 2, which involved greater affective variability, the correlation between the CR mean and the SR was lower than in Study 1. In this case, the SR was more closely related to the dispersion (i.e., the standard deviation) of the CRs than to their mean. This indicates that for longer and more complex stimuli, the average of CRs may become less representative of the overall experience, likely due to richer and more dynamic emotional fluctuations that are difficult to integrate into a single rating (i.e., the SR). Overall, these results suggest that relying solely on summary ratings can obscure important nuances of emotional experience, especially in contexts involving prolonged and dynamic stimuli.
Overall, our results support the value of using CRs as a complementary method to SR. While SR remains effective and practical for simpler, brief, and less variable stimuli, like static images, the AffectTracker can address the limitations of SR in capturing affective dynamics during complex, continuous, and immersive experiences. CR provides a richer and more granular understanding of how affective states evolve over time, especially in tasks that require ongoing engagement and feature varying emotional content. By integrating both CR and SR, researchers can obtain a more comprehensive picture of affective responses, tailored to the complexity of the stimuli being studied. Time-resolved ratings, for example, of subjective experience, also enable the joint analyses with other time series, for example, collected with electrophysiological methods such as EEG or ECG.
Interference and User Experience
One challenge of real-time CR is that it could interfere with the affective experience (Lieberman et al., 2011). One of our goals was therefore to assess the levels of Interference and User Experience of the AffectTracker. First, we leveraged the advantages of peripheral feedback (Bakker et al., 2016) by positioning the visual feedback at the center-bottom of the field of view. Our empirical assessment showed that in general, continuously rating with the AffectTracker was not interfering, irrespective of the feedback options. While the subjective ratings of Distraction were - expectedly - higher during CR than no ratings (i.e., baseline), the post-stimulation SRs as well as the Sense of Presence were equivalent when continuously rating compared to no rating, suggesting that the affective experience overall was not altered. This may have been facilitated by the excellent Usability of the Grid and Flubber (grade A, SUS score >80.3; Sauro and Lewis, 2016). Of note, the SR equivalence between CR and no rating also suggests that in the context of low affective variability, monitoring one’s emotions is not altering those very emotions (the “observer paradox”). The Proprioceptive feedback had a significantly lower Usability and Satisfaction, suggesting that rating without feedback could be more difficult/demanding and that the Grid and Flubber feedback helped.
Overall our results suggest that the Grid and Flubber can be used interchangeably, depending on the study’s or experimenter’s priority and the target users. While the Grid offers a more classical, precise and structured visualization, the Flubber offers a more intuitive, engaging, and dynamic representation. The ratings on the arousal (but not valence) dimension were significantly different for Grid than for Flubber (and Proprioceptive). On one hand, the ratings with Grid showed a stronger tendency towards the center (i.e., 0,0 coordinate) of the affect grid. While for valence, this center (middle of an unpleasant-to-pleasant gradient) represents a neutral state, this is less clear for the dimension of arousal (medium on a low-to-high gradient). Therefore, it could be that the arousal ratings may be biased by the visual representation of the grid. On the other hand, Flubber ratings showed a stronger tendency towards the extreme. As opposed to Grid, the limits of the ratings are not visualized for Flubber and may have been prone to ceiling effects. Additionally, Emotion Representation was rated higher for Flubber than for Grid. This difference could be attributed to the level of dynamicity between the two feedback. While Grid relies on the movement of a dot within a static grid to abstractly represent the transient affective state, Flubber dynamically changes as a whole. This dynamic behavior could lead to Flubber’s affect-visual mapping being more intuitive and easier to interpret, particularly for “naive” participants who may lack prior experience or expertise.
Comparing the AffectTracker to other tools
The findings from both studies underscore the promise of the AffectTracker as an effective tool for capturing continuous, real-time affective experiences with minimal interference—marking a notable advancement beyond SR. Our design builds upon and extends features already present in the technical (e.g., human-computer interaction) literature (Krüger et al., 2020; Xue et al., 2021; Gnacek et al., 2024). To complement the typical feedback provided through an affect grid (Krüger et al., 2020; Gnacek et al., 2024), the AffectTracker also provides the option for a more abstract visual representation of valence and arousal ratings (Xue et al., 2021) and offers new mappings between low-level visual features and the two affective dimensions. These new mappings, based on motion and not color-dependent, might be better suited for peripheral feedback: peripheral vision is particularly sensitive to motion (Finlay, 1982; McKee and Nakayama, 1984), while color perception is reduced in the periphery (Hansen et al., 2009). While the impact of the existing tools on the affective experience itself has not been systemically assessed, the AffectTracker, particularly with the Flubber feedback, demonstrated a balance between intuitiveness, good user experience and minimal interference, effectively capturing the intricate dynamics of valence and arousal within iVR environments. Our results contribute to the growing body of research advocating for methods that seamlessly integrate into the user’s experience, facilitating precise, real-time emotional assessments without interfering with the immersive nature of VR (Riva et al., 2007; Chirico and Gaggioli, 2019).
By rating valence and arousal with a single thumb gesture and providing different feedback options plus optional haptic nudges, the tool can be flexibly customized to the researchers’ and developers’ needs. Collectively, these technical features extend the methodological landscape and position AffectTracker as an immediately deployable solution for fine-grained, minimally-distracting emotion tracking in iVR.
Limitations and implications for future research
Several limitations should be acknowledged in this study. First, one of the visual features of the Flubber feedback, oscillation frequency - used to map the arousal dimension, has a range (0.5–2.5 Hz) within physiologically possible pulsation frequency (e.g., heart rate). While this could have added to the intuitiveness of the feedback, this could also act as a ‘fake’ biofeedback and the rating could influence heart rate, or vice versa. This should be further examined, for example, by recording participants’ heart activity during the ratings and investigating potential entrainment.
Second, while the AffectTracker tool and its Flubber visual feedback were validated using the touchpad of the HTC Vive Pro headset, the applicability to other input devices, such as joysticks, and compatibility with different VR headsets remain untested. Although technically feasible with various OpenXR-compatible VR equipment, further validation across different platforms is warranted to ensure broader applicability. Additionally, the interactivity of the stimulus was limited to head movement and full body rotation, restricting participants to passive viewing - as compared to more interactive games or tasks. This constraint may have influenced engagement levels and user experience perceptions. Furthermore, the generalizability of the findings may be limited by the relatively young and healthy participants included in the study.
Third, we did not administer a standardized cognitive-load scale, perform learning effects assessment nor did we implement a dual-task paradigm; adding these types of measures in future work will allow us to quantify the mental effort associated with CR and to test whether the different feedback options impose differential workload. Future research could address these limitations by expanding validation to diverse input devices and age groups, thus enhancing the robustness and applicability of the AffectTracker.
The data collected in these studies offer a valuable opportunity to better explore the dynamics of affective states, with a particular focus on subjective experience. Future analyses could examine how fluctuations in CR correspond to specific salient events within the stimuli, investigating different features. Further, exploring the distance and angle between valence and arousal dimensions within the affective space could provide insights into their joint dynamics and potential cross-influences. Additionally, inter-individual differences in interoceptive and emotional awareness could be analyzed to determine whether these factors influence sensitivity to change-points or whether the Flubber feedback remains consistently effective across varying levels of awareness.
In the future, integrating the AffectTracker with physiological recordings could provide insights into the relationship between subjective experience and brain-body activities. With these time-resolved data now available, future work will quantify higher-order temporal dynamics—such as emotional inertia (auto-correlation across successive windows) and decay rates after salient events—and examine how these parameters vary across individuals, contexts, and feedback options. Future work will also apply full time-series and dynamical-systems methods—e.g., change-point detection, autoregressive or hidden-Markov models, and recurrence quantification—similar to recent high-throughput pipelines in animal research (e.g., CEBRA, Schneider et al., 2023; MARBLE; Gosztolai et al., 2025). Coupling these analyses with synchronous physiological signals will make it possible to model brain–body interactions in real time, examine stable individual differences in affective dynamics, and test closed-loop adaptations in interactive VR scenarios. This would enable the study of affective phenomena in healthy subjects and help identify discrepancies in psychopathological contexts, such as interoceptive challenges or difficulties in emotional regulation.
Conclusion
We developed and evaluated the AffectTracker, an open-source tool designed to continuously and simultaneously capture valence and arousal ratings in real-time. The AffectTracker offers flexibility, enabling researchers to select between visual feedback options that could suit their study context, whether a more engaging, dynamic representation - such as the Flubber - or a precise, structured visualization - such as the Grid.
The AffectTracker represents a novel approach to study affective dynamics with minimal interference, while effectively capturing the nuances of subjective affective experience. This tool broadens the scope for investigating the intersection of subjective experience and physiological processes within immersive environments, opening new avenues for research into real-time emotional and physiological interactions.
Data availability statement
The datasets presented in this study can be found in online repositories. The names of the repository/repositories and accession number(s) can be found below: https://doi.org/10.17617/3.QPNSJA.The tool (including manual) is available at https://github.com/afourcade/AffectTracker. All code used for all analyses and plots are publicly available on GitHub at https://github.com/afourcade/AffectiveVR.
Ethics statement
The studies involving humans were approved by the ethics committee of the Psychology Department at the Humboldt-University zu Berlin (2023-21) and by the University Bioethics Committee of the University of Turin (prot. number 0218914). All procedures contributing to this work comply with the ethical standards of the relevant national and institutional committees on human experimentation and with the Helsinki Declaration of 1975, as revised in 2008. Written informed consent was obtained from participants to participate in the study. The studies were conducted in accordance with the local legislation and institutional requirements. The participants provided their written informed consent to participate in this study.
Author contributions
AF: Conceptualization, Data curation, Formal Analysis, Investigation, Methodology, Project administration, Software, Visualization, Writing – original draft, Writing – review and editing. FM: Conceptualization, Investigation, Methodology, Project administration, Writing – original draft, Writing – review and editing. LR: Formal Analysis, Validation, Visualization, Writing – review and editing. AC: Methodology, Software, Writing – review and editing. JD: Methodology, Software, Writing – review and editing. AV: Funding acquisition, Supervision, Writing – review and editing. SC: Conceptualization, Funding acquisition, Methodology, Project administration, Resources, Supervision, Writing – original draft, Writing – review and editing. MG: Conceptualization, Funding acquisition, Methodology, Project administration, Resources, Supervision, Writing – original draft, Writing – review and editing.
Funding
The author(s) declare that financial support was received for the research and/or publication of this article. This work was supported by the German Federal Ministry of Education and Research (BMBF) under grants 13GW0206, 13GW0488, 16SV9156, the Deutsche Forschungsgemeinschaft (DFG) under grants 502864329 and 542559580, and by the cooperation between the Max Planck Society and the Fraunhofer-Gesellschaft (project NEUROHUM). This project was also funded by the Grant for Internationalization of the Department of Clinical and Biological Sciences, University of Turin, Italy (CARS_GFI_22_01_F and CARS_RILO_22_03_F).
Conflict of interest
The authors declare that the research was conducted in the absence of any commercial or financial relationships that could be construed as a potential conflict of interest.
The author(s) declared that they were an editorial board member of Frontiers, at the time of submission. This had no impact on the peer review process and the final decision.
Generative AI statement
The author(s) declare that no Generative AI was used in the creation of this manuscript.
Any alternative text (alt text) provided alongside figures in this article has been generated by Frontiers with the support of artificial intelligence and reasonable efforts have been made to ensure accuracy, including review by the authors wherever possible. If you identify any issues, please contact us.
Publisher’s note
All claims expressed in this article are solely those of the authors and do not necessarily represent those of their affiliated organizations, or those of the publisher, the editors and the reviewers. Any product that may be evaluated in this article, or claim that may be made by its manufacturer, is not guaranteed or endorsed by the publisher.
Supplementary material
The Supplementary Material for this article can be found online at: https://www.frontiersin.org/articles/10.3389/frvir.2025.1567854/full#supplementary-material
References
Allen, M. (2023). The tell-tale heart: interoceptive precision and ecological fear experiences. OSF. doi:10.31234/osf.io/ngamx
S. Bakker, D. Hausen, and T. Selker (2016). Peripheral interaction (Springer International Publishing). doi:10.1007/978-3-319-29523-7
Bengfort, T., Hayat, T., and Göttel, T. (2022). Castellum: a participant management tool for scientific studies. J. Open Source Softw. 7 (79), 4600. doi:10.21105/joss.04600
Berntsen, D., and Rubin, D. C. (2006). Emotion and vantage point in autobiographical. Cognition Emot. 20 (8), 1193–1215. doi:10.1080/02699930500371190
Bradley, M. M., and Lang, P. J. (1994). Measuring emotion: the self-assessment manikin and the semantic differential. J. Behav. Ther. Exp. Psychiatry 25 (1), 49–59. doi:10.1016/0005-7916(94)90063-9
Bradley, M. M., and Lang, P. J. (2007). “The international affective picture system (IAPS) in the study of emotion and attention,” in Handbook of emotion elicitation and assessment (Oxford University Press), 29–46.
Brooke, J. (1996). “SUS: a quick and dirty usability scale,” in Usability evaluation in industry. Available online at: https://rickvanderzwet.nl/trac/personal/export/104/liacs/hci/docs/SUS-questionaire.pdf.
Brooke, J. (2013). SUS: a retrospective. J. Usability Stud. 8 (2). Available online at: http://uxpajournal.org/wp-content/uploads/sites/7/pdf/JUS_Brooke_February_2013.pdf.
Cernea, D., Weber, C., Ebert, A., and Kerren, A. (2015). Emotion-prints: interaction-driven emotion visualization on multi-touch interfaces. Vis. Data Analysis 2015 9397, 93970A–96. doi:10.1117/12.2076473
Chirico, A., and Gaggioli, A. (2019). When virtual feels real: comparing emotional responses and presence in virtual and natural environments. Cyberpsychology, Behav. Soc. Netw. 22 (3), 220–226. doi:10.1089/cyber.2018.0393
Cowie, R., Douglas-Cowie, E., Savvidou, S., McMahon, E., Sawey, M., and Schröder, M. (2000). “Feeltrace: An instrument for recording perceived emotion in real time, ” In Proceedings of the ISCA Workshop on Speech and Emotion (Vol. 1).
Damasio, A. R., Grabowski, T. J., Bechara, A., Damasio, H., Ponto, L. L. B., Parvizi, J., et al. (2000). Subcortical and cortical brain activity during the feeling of self-generated emotions. Nat. Neurosci. 3 (10), 1049–1056. doi:10.1038/79871
Diedenhofen, B., and Musch, J. (2015). Cocor: a comprehensive solution for the statistical comparison of correlations. PLOS ONE 10 (4), e0121945. doi:10.1371/journal.pone.0121945
Doherty, J. M., Belletier, C., Rhodes, S., Jaroslawska, A., Barrouillet, P., Camos, V., et al. (2019). Dual-task costs in working memory: an adversarial collaboration. J. Exp. Psychol. Learn. Mem. Cognition 45 (9), 1529–1551. doi:10.1037/xlm0000668
Duffy, E. (1957). The psychological significance of the concept of “arousal” or “activation.”. Psychol. Rev. 64 (5), 265–275. doi:10.1037/h0048837
Ekkekakis, P. (2013). The measurement of affect, Mood, and emotion: a Guide for health-behavioral research. Cambridge University Press.
Evans, J. S. B. T. (2010). Intuition and reasoning: a dual-process perspective. Psychol. Inq. 21, 313–326. doi:10.1080/1047840X.2010.521057
Feng, C., Bartram, L., and Riecke, B. E. (2014). “Evaluating affective features of 3D motionscapes,” in Proceedings of the ACM Symposium on applied perception, 23–30. doi:10.1145/2628257.2628264
Finlay, D. (1982). Motion perception in the peripheral visual field. Perception 11 (4), 457–462. doi:10.1068/p110457
Fox, M. D., and Raichle, M. E. (2007). Spontaneous fluctuations in brain activity observed with functional magnetic resonance imaging. Nat. Rev. Neurosci. 8 (9), 700–711. doi:10.1038/nrn2201
Fredrickson, B. L. (2000). Extracting meaning from past affective experiences: the importance of peaks, ends, and specific emotions. Cognition and Emot. 14 (4), 577–606. doi:10.1080/026999300402808
Fredrickson, B. L., and Kahneman, D. (1993). Duration neglect in retrospective evaluations of affective episodes. J. Personality Soc. Psychol. 65, 45–55. doi:10.1037/0022-3514.65.1.45
Girard, J. M. (2014). CARMA: Software for continuous affect rating and media annotation. J. Open Res. Softw. 2 (1), e5. doi:10.5334/jors.ar
Girard, J. M., and C. Wright, A. G. (2018). DARMA: Software for dual axis rating and media annotation. Behav. Res. Methods 50 (3), 902–909. doi:10.3758/s13428-017-0915-5
Gnacek, M., Quintero, L., Mavridou, I., Balaguer-Ballester, E., Kostoulas, T., Nduka, C., et al. (2024). AVDOS-VR: affective video Database with physiological signals and continuous ratings collected Remotely in VR. Sci. Data 11 (1), 132–18. doi:10.1038/s41597-024-02953-6
Gosztolai, A., Peach, R. L., Arnaudon, A., Barahona, M., and Vandergheynst, P. (2025). MARBLE: interpretable representations of neural population dynamics using geometric deep learning. Nat. Methods 22, 612–620. doi:10.1038/s41592-024-02582-2
Gross, J. J., and Muñoz, R. F. (1995). Emotion regulation and mental health. Clin. Psychol. Sci. Pract. 2 (2), 151–164. doi:10.1111/j.1468-2850.1995.tb00036.x
Hansen, T., Pracejus, L., and Gegenfurtner, K. R. (2009). Color perception in the intermediate periphery of the visual field. J. Vis. 9 (4), 26. doi:10.1167/9.4.26
Hasson, U., Nir, Y., Levy, I., Fuhrmann, G., and Malach, R. (2004). Intersubject synchronization of cortical activity during natural vision. Science 303 (5664), 1634–1640. doi:10.1126/science.1089506
Hofmann, S. M., Klotzsche, F., Mariola, A., Nikulin, V., Villringer, A., and Gaebler, M. (2021). Decoding subjective emotional arousal from EEG during an immersive virtual reality experience, Elife. 10. e64812. doi:10.7554/eLife.64812
Huk, A., Bonnen, K., and He, B. J. (2018). Beyond trial-based paradigms: continuous behavior, ongoing neural activity, and natural stimuli. J. Neurosci. 38 (35), 7551–7558. doi:10.1523/JNEUROSCI.1920-17.2018
Hupka, R. B., Zaleski, Z., Otto, J., Reidl, L., and Tarabrina, N. V. (1997). The colors of anger, envy, fear, and jealousy: a cross-Cultural study. J. Cross-Cultural Psychol. 28 (2), 156–171. doi:10.1177/0022022197282002
James, W. (1894). Discussion: the physical basis of emotion. Psychol. Rev. 1 (5), 516–529. doi:10.1037/h0065078
Jordan, P. W. (1998). An introduction to usability. London, United Kingdom: CRC Press (Taylor & Francis Group). doi:10.1201/9781003062769
Kaplan, R. L., Levine, L. J., Lench, H. C., and Safer, M. A. (2016). Forgetting feelings: opposite biases in reports of the intensity of past emotion and mood. Emotion 16, 309–319. doi:10.1037/emo0000127
Kennedy, R. S., Lane, N. E., Berbaum, K. S., and Lilienthal, M. G. (1993). Simulator sickness questionnaire: an enhanced method for quantifying simulator sickness. Int. J. Aviat. Psychol. 3 (3), 203–220. doi:10.1207/s15327108ijap0303_3
Kragel, P. A., and LaBar, K. S. (2013). Multivariate pattern classification reveals autonomic and experiential representations of discrete emotions. Emotion 13 (4), 681–690. doi:10.1037/a0031820
Kreibig, S. D. (2010). Autonomic nervous system activity in emotion: a review. Biol. Psychol. 84 (3), 394–421. doi:10.1016/j.biopsycho.2010.03.010
Kron, A., Goldstein, A., Lee, D. H.-J., Gardhouse, K., and Anderson, A. K. (2013). How are you feeling? Revisiting the quantification of emotional qualia. Psychol. Sci. 24 (8), 1503–1511. doi:10.1177/0956797613475456
Krüger, C., Kojić, T., Meier, L., Möller, S., and Voigt-Antons, J. N. (2020). “Development and validation of pictographic scales for rapid assessment of affective states in virtual reality,” in 2020 twelfth international conference on quality of multimedia experience (QOMEX) (IEEE), 1–6.
Kunin, T. (1998). The construction of a new type of Attitude measure. Pers. Psychol. 51 (4), 823–824. doi:10.1111/j.1744-6570.1998.tb00739.x
Kuppens, P., Tuerlinckx, F., Russell, J. A., and Barrett, L. F. (2013). The relation between valence and arousal in subjective experience. Psychol. Bull. 139 (4), 917–940. doi:10.1037/a0030811
Lakens, D., Scheel, A. M., and Isager, P. M. (2018). Equivalence testing for psychological research: a tutorial. Adv. Methods Pract. Psychol. Sci. 1 (2), 259–269. doi:10.1177/2515245918770963
Leising, D., Grande, T., and Faber, R. (2009). The Toronto Alexithymia Scale (TAS-20): a measure of general psychological distress. J. Res. Personality 43 (4), 707–710. doi:10.1016/j.jrp.2009.03.009
Levine, L. J., and Safer, M. A. (2002). Sources of bias in memory for emotions. Curr. Dir. Psychol. Sci. 11 (5), 169–173. doi:10.1111/1467-8721.00193
Lieberman, M. D., Inagaki, T. K., Tabibnia, G., and Crockett, M. J. (2011). Subjective responses to emotional stimuli during labeling, reappraisal, and distraction. Emotion 11 (3), 468–480. doi:10.1037/a0023503
Lindquist, K. A. (2013). Emotions emerge from more basic psychological ingredients: a modern psychological constructionist model. Emot. Rev. 5 (4), 356–368. doi:10.1177/1754073913489750
Lindquist, K. A., Wager, T. D., Kober, H., Bliss-Moreau, E., and Barrett, L. F. (2012). The brain basis of emotion: a meta-analytic review. Behav. Brain Sci. 35 (03), 121–143. doi:10.1017/S0140525X11000446
Lipson-Smith, R., Bernhardt, J., Zamuner, E., Churilov, L., Busietta, N., and Moratti, D. (2021). Exploring colour in context using Virtual Reality: Does a room change how you feel? Virtual Real. 25 (3), 631–645. doi:10.1007/s10055-020-00479-x
Madden, T. J., Hewett, K., and Roth, M. S. (2000). Managing images in different cultures: a cross-national study of color Meanings and preferences. J. Int. Mark. 8 (4), 90–107. doi:10.1509/jimk.8.4.90.19795
Marcotti, P., and St. Jacques, P. L. (2018). Shifting visual perspective during memory retrieval reduces the accuracy of subsequent memories. Memory 26 (3), 330–341. doi:10.1080/09658211.2017.1329441
McCall, C., Hildebrandt, L. K., Bornemann, B., and Singer, T. (2015). Physiophenomenology in retrospect: memory reliably reflects physiological arousal during a prior threatening experience. Conscious. Cognition 38, 60–70. doi:10.1016/j.concog.2015.09.011
McCall, C., Hildebrandt, L. K., Hartmann, R., Baczkowski, B. M., and Singer, T. (2016). Introducing the Wunderkammer as a tool for emotion research: unconstrained gaze and movement patterns in three emotionally evocative virtual worlds. Comput. Hum. Behav. 59, 93–107. doi:10.1016/j.chb.2016.01.028
McCall, C., Schofield, G., Halgarth, D., Blyth, G., Laycock, A., and Palombo, D. J. (2022). The underwood project: a virtual environment for eliciting ambiguous threat. Behav. Res. Methods 55, 4002–4017. doi:10.3758/s13428-022-02002-3
McClay, M., Sachs, M. E., and Clewett, D. (2023). Dynamic emotional states shape the episodic structure of memory. Nat. Commun. 14 (1), 6533. doi:10.1038/s41467-023-42241-2
McKee, S. P., and Nakayama, K. (1984). The detection of motion in the peripheral visual field. Vis. Res. 24 (1), 25–32. doi:10.1016/0042-6989(84)90140-8
Mehling, W. E., Acree, M., Stewart, A., Silas, J., and Jones, A. (2018). The multidimensional assessment of interoceptive awareness, version 2 (MAIA-2). PloS One 13 (12), e0208034. doi:10.1371/journal.pone.0208034
Nagel, F., Kopiez, R., Grewe, O., and Altenmüller, E. (2007). EMuJoy: Software for continuous measurement of perceived emotions in music. Behav. Res. Methods 39 (2), 283–290. doi:10.3758/BF03193159
Nair, S., Sagar, M., Sollers, J., Consedine, N., and Broadbent, E. (2015). Do slumped and upright postures affect stress responses? A randomized trial. Health Psychol. Official J. Div. Health Psychol. Am. Psychol. Assoc. 34 (6), 632–641. doi:10.1037/hea0000146
Petrolini, V., and Viola, M. (2020). Core affect dynamics: arousal as a modulator of valence. Rev. Philosophy Psychol. 11, 783–801. doi:10.1007/s13164-020-00474-w
Pinilla, A., Garcia, J., Raffe, W., Voigt-Antons, J.-N., Spang, R. P., and Möller, S. (2021). Affective visualization in virtual reality: an integrative review. Front. Virtual Real. 2, 630731. doi:10.3389/frvir.2021.630731
Riva, G., Mantovani, F., Capideville, C. S., Preziosa, A., Morganti, F., Villani, D., et al. (2007). Affective interactions using virtual reality: the link between presence and emotions. CyberPsychology and Behav. 10 (1), 45–56. doi:10.1089/cpb.2006.9993
Russell, J. A. (1980). A circumplex model of affect. J. Personality Soc. Psychol. 39 (6), 1161–1178. doi:10.1037/h0077714
Russell, J. A., and Barrett, L. F. (1999). Core affect, prototypical emotional episodes, and other things called emotion: dissecting the elephant. J. Personality Soc. Psychol. 76 (5), 805–819. doi:10.1037/0022-3514.76.5.805
Russell, J. A., Weiss, A., and Mendelsohn, G. A. (1989). Affect Grid: a single-item scale of pleasure and arousal. J. Personality Soc. Psychol. 57 (3), 493–502. doi:10.1037/0022-3514.57.3.493
Saarimäki, H. (2021). Naturalistic stimuli in affective neuroimaging: a review. Front. Hum. Neurosci. 15, 675068. doi:10.3389/fnhum.2021.675068
Saarimäki, H., Gotsopoulos, A., Jääskeläinen, I. P., Lampinen, J., Vuilleumier, P., Hari, R., et al. (2016). Discrete neural signatures of basic emotions. Cereb. Cortex 26 (6), 2563–2573. doi:10.1093/cercor/bhv086
Sabat, M., Dampierre, C. de, and Tallon-Baudry, C. (2024). Evidence for domain-general arousal from semantic and neuroimaging meta-analyses reconciles opposing views on arousal. bioRxiv, 2024. doi:10.1101/2024.05.27.594944
Sauro, J., and Lewis, J. R. (2016). Quantifying the user experience: practical statistics for user research. Cambridge, United States: Morgan Kaufmann (Elsevier). Available online at: https://books.google.com/books?hl=fr&lr=&id=USPfCQAAQBAJ&oi=fnd&pg=PP1&dq=Sauro+%26+Lewis+2016&ots=VzZd0_8qMm&sig=vQotURtESC3T9DjsSxULWygXzUM.
Schneider, S., Lee, J. H., and Mathis, M. W. (2023). Learnable latent embeddings for joint behavioural and neural analysis. Nature 617 (7960), 360–368. doi:10.1038/s41586-023-06031-6
Seth, A. K. (2013). Interoceptive inference, emotion, and the embodied self. In Trends Cogn. Sci., 17). 565, 573. doi:10.1016/j.tics.2013.09.007
Sharma, K., Castellini, C., Stulp, F., and van den Broek, E. L. (2017). Continuous, real-time emotion annotation: a novel joystick-based analysis framework. IEEE Trans. Affect. Comput. 11 (1), 78–84. doi:10.1109/TAFFC.2017.2772882
Sharma, K., Castellini, C., van den Broek, E. L., Albu-Schaeffer, A., and Schwenker, F. (2019). A dataset of continuous affect annotations and physiological signals for emotion analysis. Sci. Data 6, 196. doi:10.1038/s41597-019-0209-0
Siegel, E. H., Sands, M. K., Van den Noortgate, W., Condon, P., Chang, Y., Dy, J., et al. (2018). Emotion fingerprints or emotion populations? A meta-analytic investigation of autonomic features of emotion categories. Psychol. Bull. 144 (4), 343–393. doi:10.1037/bul0000128
Soriano, C., and Valenzuela, J. (2009). Emotion and colour across languages: implicit associations in Spanish colour terms. Soc. Sci. Inf. 48 (3), 421–445. doi:10.1177/0539018409106199
Sutherland, M. R., and Mather, M. (2018). Arousal (but not valence) amplifies the impact of salience. Cognition Emot. 32 (3), 616–622. doi:10.1080/02699931.2017.1330189
Toet, A., Heijn, F., Brouwer, A.-M., Mioch, T., and van Erp, J. B. F. (2020). An immersive self-report tool for the affective appraisal of 360° VR videos. Front. Virtual Real. 1, 552587. doi:10.3389/frvir.2020.552587
Vuoskoski, J. K., Zickfeld, J. H., Alluri, V., Moorthigari, V., and Seibt, B. (2022). Feeling moved by music: investigating continuous ratings and acoustic correlates. PLOS ONE 17 (1), e0261151. doi:10.1371/journal.pone.0261151
Wagner, V., Scharinger, M., Knoop, C. A., and Menninghaus, W. (2021). Effects of continuous self-reporting on aesthetic evaluation and emotional responses. Poetics 85, 101497. doi:10.1016/j.poetic.2020.101497
Westermann, R., Spies, K., Stahl, G., and Hesse, F. W. (1996). Relative effectiveness and validity of mood induction procedures: a meta-analysis. Eur. J. Soc. Psychol. 26 (4), 557–580. doi:10.1002/(SICI)1099-0992(199607)26:4<557::AID-EJSP769>3.0.CO;2-4
Widmaier, E., and Raff, H. (2022). Vander’s human physiology. Available online at: https://www.mheducation.com/highered/product/Vanders-Human-Physiology-Widmaier.html.
Xue, T., El Ali, A., Zhang, T., Ding, G., and Cesar, P. (2021). CEAP-360VR: a continuous physiological and behavioral emotion annotation dataset for 360$^\circ$ VR videos. IEEE Trans. Multimedia 25, 243–255. doi:10.1109/tmm.2021.3124080
Keywords: affective states, emotion, virtual reality, dynamics, moment-to-moment, self-reports
Citation: Fourcade A, Malandrone F, Roellecke L, Ciston A, Mooij Jd, Villringer A, Carletto S and Gaebler M (2025) AffectTracker: real-time continuous rating of affective experience in immersive virtual reality. Front. Virtual Real. 6:1567854. doi: 10.3389/frvir.2025.1567854
Received: 28 January 2025; Accepted: 26 August 2025;
Published: 23 September 2025.
Edited by:
Manuela Chessa, University of Genoa, ItalyReviewed by:
Valentina Mancuso, eCampus University, ItalyViviana Mascardi, University of Genoa, Italy
Copyright © 2025 Fourcade, Malandrone, Roellecke, Ciston, Mooij, Villringer, Carletto and Gaebler. This is an open-access article distributed under the terms of the Creative Commons Attribution License (CC BY). The use, distribution or reproduction in other forums is permitted, provided the original author(s) and the copyright owner(s) are credited and that the original publication in this journal is cited, in accordance with accepted academic practice. No use, distribution or reproduction is permitted which does not comply with these terms.
*Correspondence: Antonin Fourcade, YW50b25pbi5mb3VyY2FkZUBtYXhwbGFuY2tzY2hvb2xzLmRl
†These authors share first authorship
‡These authors share senior authorship