 Phurpa Dema Thungon1,2
 Hui Wang1
 Sergei I. Vagin3
 Colin Van Dyck4Pranab Goswami2B. Rieger3
 Alkiviathes Meldrum1*
- 1Department of Physics, University of Alberta, Edmonton, AB, Canada
- 2Department of Biosciences and Bioengineering, Indian Institute of Technology Guwahati, Guwahati, India
- 3Wacker Chair of Macromolecular Chemistry, Technical University of Munich, Munich, Germany
- 4Department of Physics, University of Mons, Mons, Belgium
A paper-based microfluidic detection device for the detection of ethanol is demonstrated in this work. The method is based on a fluorophore consisting of short-chain conjugated molecular unit susceptible to the protonation of its terminal pyridine groups, along with a carboxyl-functionalized sidechain that acts as a binder and renders it water-soluble. The resulting fluorescent paper device yields large fluorescence changes when exposed to reactions that yield H2O2 in aqueous solutions. Using an enzyme-catalyzed rection that produces H2O2 from ethanol, we developed a two-zone, cut-out paper device containing a reaction zone in which the ethanol-containing analyte is placed, and an adjacent sensor zone where we observe a fluorescence color shift proportional to the ethanol concentration. The limit of detection of the fluidic ethanol biosensor was 0.05 v/v% and the dynamic range was 0.05–2 v/v%. This method was employed to detect the alcohol concentration of consumer vodkas using only a paper sensor and a smartphone camera.
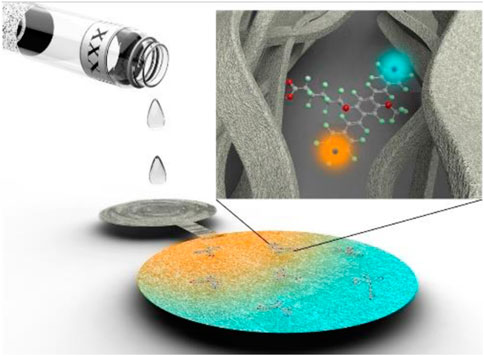
GRAPHICAL ABSTRACT
Introduction
Paper based analytical devices have several advantages for sensing applications, including low cost and ease-of-use (Martinez et al., 2010; Robidillo et al., 2019; Wang et al., 2020). Paper is biocompatible and can be modified with various functional groups to covalently bind proteins (Song et al., 2019), DNA (Seed, 1982), and other biomolecules (Mahadeva et al., 2015). In this work, the detection of ethanol (EtOH) will be accomplished via an enzymatic ethanol reaction and subsequent detection of produced hydrogen peroxide on a paper sensor. Owing to the importance of H2O2 in many technologies (Laloi et al., 2004; Rhee, 2006; Dröge and Schipper, 2007; Giorgio et al., 2007; Trachootham et al., 2009; Chen et al., 2012; Liu et al., 2015; Teodoro et al., 2019), numerous sensing strategies have been developed (Wen et al., 2011; Chen et al., 2013; Hitomi et al., 2013; Hu et al., 2013; Jia et al., 2013; Li et al., 2014; Zhang et al., 2015; Narayanaswamy et al., 2016; Xiao et al., 2016; Zhao et al., 2016; Shamkhalichenar and Choi, 2017; Khan and Cho, 2018; Ragavan et al., 2018; Liu et al., 2019; Sánchez-Calvo et al., 2020; Shamkhalichenar and Choi, 2020; Sharma et al., 2020). Importantly for this work, it is produced in biochemical reactions catalyzed by enzymes and hence is a useful secondary analyte for the indirect detection of glucose (Hu et al., 2013; You and Pak, 2014; Singh et al., 2017; Chang et al., 2018), alcohols (Chinnadayyala et al., 2014; Thungon et al., 2017; Aymerich et al., 2018; Thepchuay et al., 2020), and cholesterol (Tsai et al., 2008; Saxena and Goswami, 2012; Sekretaryova et al., 2014). The paper-based sensor developed here uses this enzyme-catalyzed reaction method in combination with a new fluorophore to demonstrate a novel paper-based EtOH detection strategy.
The detection mechanism for many fluorescence-based sensors developed so far has utilized a change in the fluorescence intensity (Wen et al., 2011; Hitomi et al., 2013; Li et al., 2014; Zhang et al., 2015), while colorimetric paper-based sensing has been reported for H2O2 (Xu et al., 2011; Sánchez-Calvo et al., 2020; Priyanga et al., 2021). Quenching-based methods often suffer from photo-bleaching and are subject to power drift of the excitation source, while colorimetric methods, which are affected by the ambient lighting, can be difficult to quantify in a consumer setting. In contrast, color-change fluorescent devices permit the utilization of a ratiometric approach to the sensing signal, which can sidestep the issues associated with quenching or fluorescence turn-on methods. Paper-based fluorescent color-change detection has, to our knowledge, never applied to consumer alcohols even though this type of optical behaviour can offer a robust detection signal.
The detection of ethanol is important for forensic sectors, and for the clinical, chemical, pharmaceutical and fermentation industries. Simple, inexpensive EtOH sensors are also needed to verify the alcohol content of commercial liquors and to help ensure their authenticity. With ethanol possibly becoming a legislated biofuel in many countries, a simple and rapid system for detection of ethanol in solution may become increasingly important (Thungon et al., 2017). Most paper-based alcohol sensors work on the electrochemical method (Cinti et al., 2017; Kaushik and Goswami, 2018; Sánchez-Calvo et al., 2020) only few use colorimetric techniques [e.g., Ref (Thepchuay et al., 2020)], and none are fluorescent enzyme-based sensors to the best of our knowledge. Some fluorescence-based alcohol sensors have been developed, however. For example, silica-coated cellulose strips with a fluorescent chemical probe grafted to them can detect EtOH in gasoline with a 0.5 v/v% limit of detection (Gotor et al. 2019). A carborane derivative film showed turn-on fluorescence whose strength and recovery rate was different for ethanol and methanol (MeOH), showing that the relative fraction of these two alcohols could be distinguished to about 1% (Han et al., 2021). Another sensor film with similar turn-on behavior also was shown in Ref. (Duan et al., 2021), in which the fluorescence spectrum for the two alcohols was similar but the rate of increase was again faster for MeOH. Several additional sensors are summarized in Table 1. This work will demonstrate a simple, cost-effective fluorescent paper sensor for detection of EtOH via an H2O2–producing enzymatic reaction sensitive to alcohols but not to other VoCs.
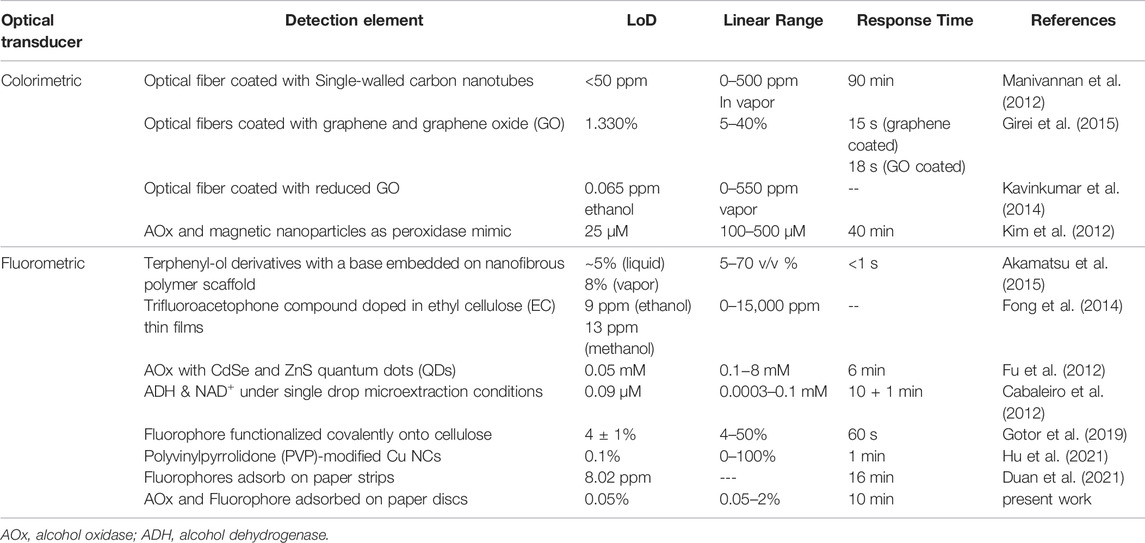
TABLE 1. Literature comparison of optical alcohol sensors.
Results and Discussion
Structure and Basic Optical Properties of np-P4VB and c-P4VB
The fluorescence sensing will be performed with c-P4VB (suggested IUPAC name: carboxy-bis(4-pyridyl)dineopentoxyl-p-phenylenedivinylene), a new fluorescent molecule derived from the non-functional np-P4VB (neopentyl) form. The basic structure of P4VB is illustrated in Figure 1, showing the 3-ring conjugated backbone with the sterically accessible nitrogen atoms on the pyridine end-groups. In contrast to the np-P4VB with its bulky neopentyloxy side-groups, the carboxy-functionalized form (c-P4VB) has a methoxy side-group and an oxy-hexanoate group at the central benzene ring that presents an additional reactive site. When the pyridine groups are protonated, the fluorescence undergoes a large redshift from teal-blue to orange (Wang et al., 2020). Whereas the np-P4VB formed prismatic solid crystals with a greenish-yellow fluorescence, the c-P4VB showed a similar greenish-yellow emission but instead formed much smaller aggregates of fibrous or needle-like crystals in the solid form (Figure 1D).
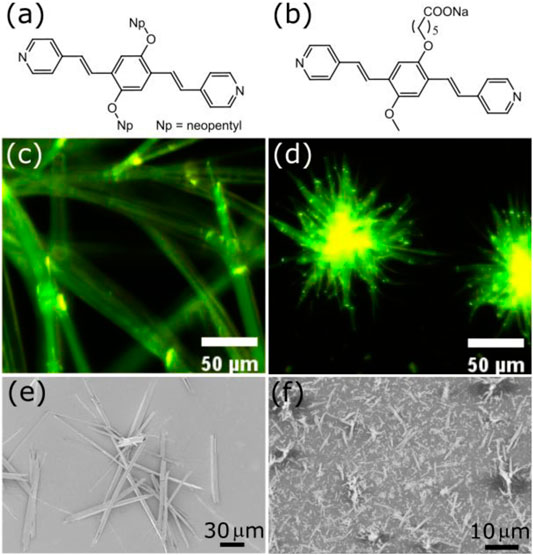
FIGURE 1. Molecular structure of (A) np-P4VB and (B) c-P4VB. Corresponding fluorescence images are shown in (C) and (D) of crystals formed after evaporation from ethanol at room temperature. Secondary electron SEM images are shown in (E) np-P4VB and (F) c-P4VB.
A comparison of the protonation equilibria in np-P4VB and c-P4VB was performed first. The fluorophore was protonated with strong acid (toluenesulfonic acid) in ethanol, producing the overall blue-to-orange color shift in the fluorescence and corresponding changes in the absorption maxima. The absorption spectra in EtOH for both P4VB molecular types show a double-peaked structure (Figure 2A) consistent with the S1 and S2 excited states. The absorbance curves were modeled as a combination of double-Gaussians and the un-protonated and doubly-protonated peaks were found by fitting the un-protonated starting spectra and the fully saturated (i.e., fully protonated) spectra, respectively. The means and standard deviations for these cases were then fixed for every subsequent measurement. The mono-protonated absorption peaks were found by modeling the spectrum that was shifted halfway between the un-protonated and doubly-protonated states by including one additional pair of Gaussian peaks to best fit the spectrum, which were then also fixed for every subsequent measurement. Only the relative intensities were allowed to vary. The peak positions for all three contributions and their ratios at different acid concentrations are summarized in Table 2 and Figure 2, respectively. The results suggest that the first protonation constant is approximately an order of magnitude higher than the second protonation constant of the P4VB fluorophores. Thus, first one of the pyridines is protonated and then, at higher acid concentration, the second one becomes protonated. The protonation of c-P4VB occurs at a higher concentration as compared to that in np-P4VB.
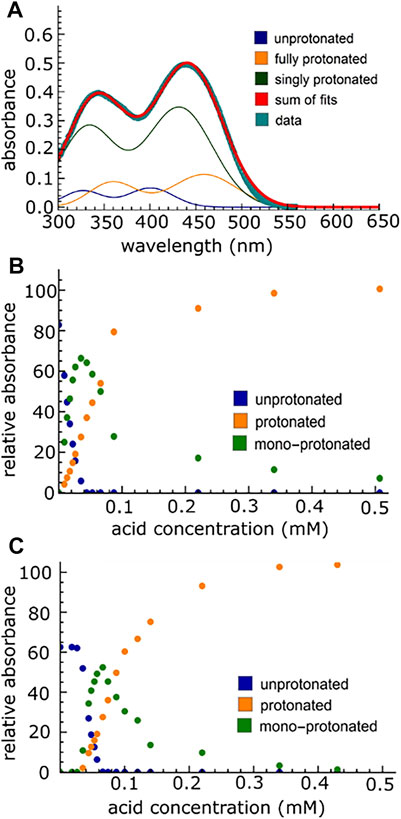
FIGURE 2. (A) Absorption spectra of 0.02 mM c-P4VB in ethanol, with the double Gaussian fit. This sample contains 0.057 mM toluenesulfonic acid. The relative strength of each of the absorptions (relative absorption) was found by taking the area under the peaks, and the results are shown as a function of acid concentration for np-P4VB in (B) and c-P4VB in (C). The onset of protonation occurs at higher acid concentrations) for the c-P4VB due to the presence of the carboxylic group.
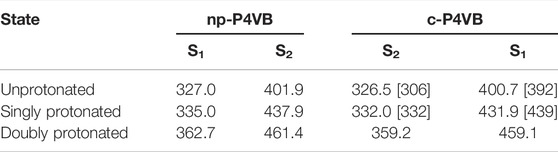
TABLE 2. Measured S1 and S2 absorption peak wavelengths for np-P4VB and the functionalized counterpart c-P4VB. Wavelength units are in nm. In brackets are given the positions of the absorption peaks, as computed from DFT.
A quantum chemical analysis was performed on the c-P4VB in order to understand its electronic structure and solvent interactions relevant to its sensing performance. The calculations were based on density functional theory (DFT), performed using the Gaussian software package with the CAM-B3LYP exchange-correlation functional and a 6–31++G (d,p) Gaussian basis set, accounting for solvent effects with the implicit polarizable continuum solvation model. The absorption spectra were simulated in ethanol using time-dependent DFT for the optimized ground and first excited state structures. Similar to the case for the np-P4VB, the vinylene groups in the conjugated backbone of c-P4VB can form cis and trans isomers (Figures 3A,B), (Wang et al., 2020) but a third stable structure was identified where the counter-ion interacts with the carboxylate group (Figure 3C). The cis isomer allows a sharing of the counter-ion between the carboxyl tail and the pyridine site, which may stabilize it and affect the prevalence of the trans isomer (Figure 3A). For c-P4VB with a sodium counter-ion, the trans form is more stable by about 15 meV in ethanol, in agreement with the NMR results (see Supplementary Figure S1; using methanol) which indicated only a trans component at room temperature. Additionally, there was little experimental evidence for the cis-related absorption peaks at 292 and 363 nm as calculated by DFT. The un-protonated absorption maxima in implicit ethanol were calculated to occur at 306 and 392 nm for the most stable situation in which the Na+ counter-ion is bound to the carboxylate group, which are reasonably close to the values of 326 and 400 nm observed experimentally (Supplementary Figure S2, c-P4VB in ethanol).
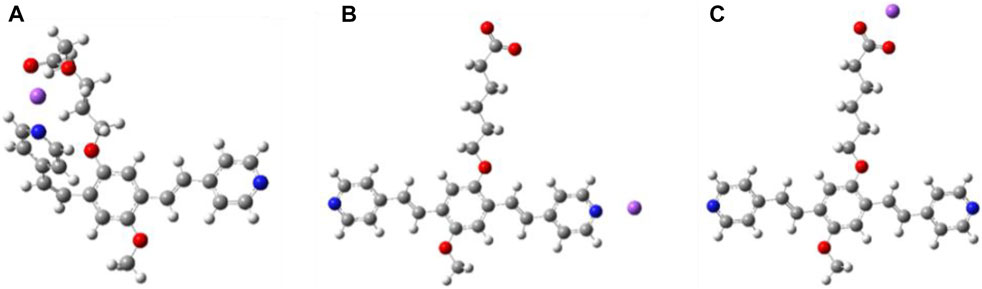
FIGURE 3. Simulated structures of c-P4VB with a sodium counter-ion. (A) “twisted” cis with the ion shared between the carboxyl tail and the pyridine site, (B) trans with the ion interacting with pyridine site only, (C) trans with the ion interacting with carboxyl tail. (C) is the most stable form; (A,B) are higher in free energy by 15 and 87 meV, respectively, in EtOH. These differences change significantly in other solvents or with different counter-ions (e.g., H+) but the trans form shown in (C) is always the most stable. Blue represents nitrogen, red is oxygen, gray is carbon, white is hydrogen, and the sodium is violet.
Relevant to the sensing behavior of the functionalized c-P4VB, the molecular properties for the three configurations were investigated with a proton replacing the sodium counter-ion. In this case as well, a single proton prefers to neutralize the COO− site directly, with the second most favorable option represented by a twisting of the alkyl chain toward a cis-oriented pyridine, such that the two sites (pyridine and the hexanoate arm) effectively share the proton (Figure 3A). Thus, the DFT results conclude that a single counter-ion (Na+ or H+) interacting with c-P4VB prefers to neutralize the COO−site, and when that site is saturated, then excess counter-ions can bind to the pyridine. Thus, the protonation of the pyridines will be require a higher concentration in c-P4VB until the carboxylic group has been neutralized. This protonation effect is observable in absorbance and fluorescence (Supplementary Figure S3) spectra, in which the singly protonated state of c-P4VB reaches maximum intensity at higher acid concentration than it does for np-P4VB.
Optical Properties of c-P4VB in Aqueous Solutions
The as-synthesized c-P4VB is soluble in water up to ∼2 g L−1, which is advantageous for developing sensors for aqueous analytes. The absorption and fluorescence response of aqueous c-P4VB solutions to H2O2 was next tested, since the development of the paper-based ethanol sensor depends on the proxy detection of H2O2. Various concentration of H2O2 prepared in fresh milliQ were added to 0.02 mM c-P4VB dissolved in ethanol for absorbance and fluorescence study respectively, to form a (1:1) solution by volume. The addition of small concentration of H2O2 (0.2 v/v%) caused the long-wavelength protonation-related absorption tail to appear, while the fluorescence shifted from teal-blue to orange (Figure 4), consistent with the protonation of the pyridine groups. H2O2 is widely known to behave as a weak acid yet yields suitable protonation of c-P4VB at reasonably low concentrations, presenting an opportunity to seize on the acidic nature of H2O2 as an alternative to the usual oxidation methods.
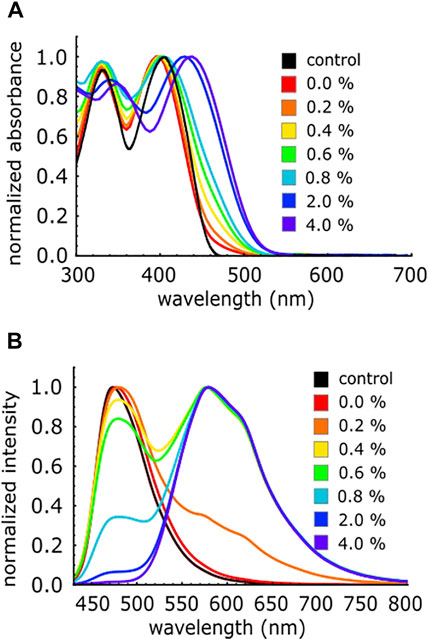
FIGURE 4. (A) Absorbance spectra for different concentration (v/v%) of H2O2 in aqueous solutions of 0.02 mM c-P4VB (B) Fluorescence spectra of aqueous H2O2 solutions in 0.2 mM c-P4VB in ethanol. In all cases the reaction solution had a 1:1 volume ratio of ethanol and water. The control refers to pure ethanol solution with c-P4VB and 0% means that only pure water was used. The aqueous H2O2 solutions were prepared by dilution of commercial 30% aqueous H2O2 with milliQ water. All spectra are normalized for visual clarity.
Properties of c-P4VB-Infused Paper
To create a disposable microsensor, c-P4VB was immobilized into Whatman no. 1 filter paper (see the Experimental section). The dye could not be removed even after 30 min of sonication in methanol. In contrast to c-P4VB, the non-functionalized np-P4VB was effectively removed by a single methanol wash (Supplementary Figure S4), indicating its much poorer affinity towards cellulose. Indeed, cellulose is known to show excellent adsorption or hydrogen bonding to materials that contain carboxylic groups (Chami Khazraji and Robert, 2013), ensuring minimal leaching of adsorbed c-P4VB upon exposure to aqueous solutions. The efficiency of infiltration of c-P4VB in the paper depended on experimental parameters such as its concentration, volume of solution, and solvent, as well as the type of paper used (likely because different paper production methods or aging result in modifications of the cellulose structure). Thus, the same batch of filter paper was initially used in the experiments, to guarantee the reproducibility and avoid side reactions. We subsequently used papers from different boxes with different dates, without finding any significant differences. Different brands of paper were also tested, but the porosity, “stickiness,” and white coloring of the Whatman No. 1 made it the easiest to work with. The c-P4VB papers can be used immediately after preparation but must be stored in dark and low humidity conditions.
The c-P4VB-infused paper disks emitted blue fluorescence under UV light but responded to different analytes by turning green when treated with zinc nitrate, yellow-orange with HCl, and reddish when treated with H2O2 (Figure 5). This indicates at least some level of distinction in the fluorescence response of H2O2 as compared to other possible interferents. The originally blue-fluorescent c-P4VB paper could be turned yellow-orange by placing a drop of HCl in the center and allowing it to dry, and it could then be deprotonated using a low concentration (0.1 mM) of NaOH solution, which recovered the blue fluorescence (Figure 6). The red fluorescence for H2O2 could be due to the aggregation of the protonated dye molecules originating from the formation of contact ion pairs between the weak acids and the fluorophore (e.g., through hydrogen bonding), which does not occur in case of strong acids. This aggregation can slowly lead to a precipitation of c-P4VB from aqueous solutions (Supplementary Figure S5). Aggregation seems to be an important factor explaining the sensitivity of c-P4VB to hydrogen peroxide, since intermolecular interactions are known to cause an extended red emission in aggregates of conjugated polymers or dyes (Nguyen et al., 1999).
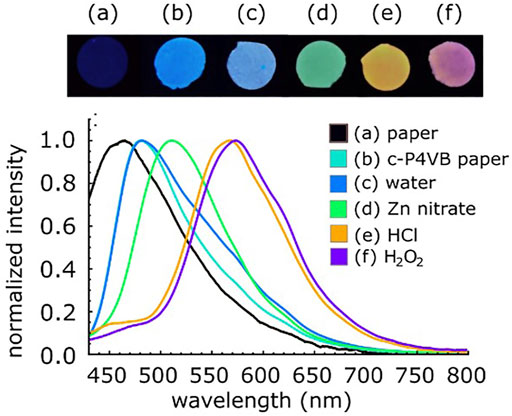
FIGURE 5. Photographs taken under a blacklight (top) and corresponding fluorescence spectra of c-P4VB treated with different analytes (bottom). The photographs were taken with a smartphone camera with no filtering applied. (a) blank filter paper; (b) c-P4VB paper only and treated with: (c) water; (d) zinc nitrate (500 mM); (e) HCl (5 mM) and (f) H2O2 (10 v/v%).
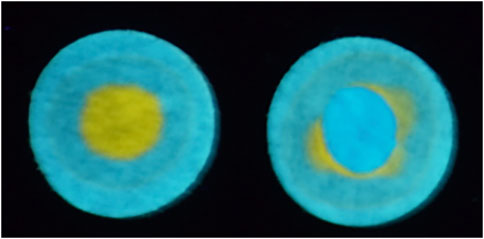
FIGURE 6. Photographs under a blacklight showing (left) teal-fluorescent c-P4VB-infused filter paper with a drop of HCl placed in the center. Subsequently adding a drop of NaOH rejuvenated the disk to the original color. This process could be repeated many times.
Hydrogen Peroxide Paper Sensor Performance
To understand the response of the paper sensor, 20 µL of different concentrations of aqueous H2O2 were dropped on different c-P4VB paper disks and the fluorescence change was observed on each separate disk (Figure 7A). A ratiometric signal given by S = I605/I470, where I605 and I470 are the measured fluorescence intensities at wavelengths of 605 and 470 nm, respectively, was used to extract the sensitivity. A ratiometric equation in which the two wavelengths shift linearly with concentration was chosen to model the data, given by
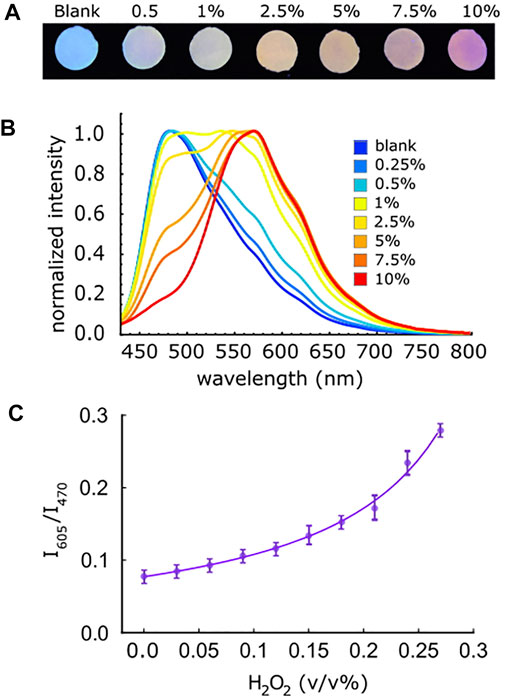
FIGURE 7. (A) Photographs of c-P4VB paper treated with different concentration of H2O2, taken under a blacklight using a smartphone camera without any filtering. (B) Normalized fluorescence spectra corresponding to the images of the c-P4VB paper under UV light when treated with various concentrations (v/v%) of H2O2. (C) Calibration curve of the paper sensor for low concentrations of H2O2 in aqueous solution. The error bars represent the calculated standard error from measurements on three separate disks.
The limit of detection (LoD) for H2O2 in the paper sensor was estimated as three times the standard deviation from 50 consecutive measurements of the blank divided by the slope of the working curve at low concentration (Morrish et al., 2018). The LoD for H2O2 in these paper-sensors was 0.057 v/v% with a dynamic range up to 10 v/v% H2O2 for a single paper sensor (Figures 7B,C). At higher concentrations where the slope of the signal increases, the ability to detect changes in the H2O2 concentration was roughly an order of magnitude better due to the increased sensitivity in this range. Variations amongst different individual c-P4VB paper sensors were nearly three times larger than the standard errors taken from 50 measurements of the blank. This is likely due to variation in paper disks, the amount of solution added, and other normal experimental variables.
Paper-Based Sensors for Ethanol
After characterizing the behavior of c-P4VB upon exposure to H2O2 and demonstrating that the paper sensors can detect relevant concentrations of H2O2, we then proceeded to the main objective to show a paper-based ethanol biosensor. A µPAD system was prepared by linking two paper disks by a paper channel as described in the materials and method section (Figure 8). The reaction disk was first permeated with immobilized alcohol oxidase, while the sensor disk was infused with c-P4VB. Next, 10 µL of aqueous samples with various concentrations of reaction-grade ethanol were dropped onto the reaction disk (R) and allowed to incubate for 5 min; 20 µL of milliQ was then dropped onto the same disk to move the reaction-produced H2O2 to the sensor disk (S) (see the Experimental section). After 5 min’ wait time, the papers were photographed under a blacklight, using a OnePlus 7 smartphone. In order to mimic consumer usage, the signal was measured by selecting 5000 pixels in the sensor zone near the input channel and taking the hue (hRGB) values, defined as (Preucil, 1953)
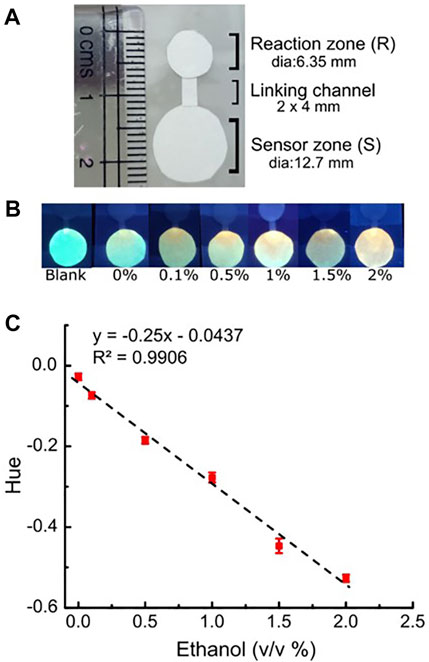
FIGURE 8. (A) Calibration image of the paper-based alcohol sensor; (B) Photographs taken using a smart phone after the 5-min reaction with different concentration of ethanol (v/v %); (C) Calibration plot for the raw hRGB values (in radians) with a linear model fit. The error bars represent the standard deviations from three separate disks.
The first step was to calibrate the response to prepared ethanol solutions. The signal changed monotonically with the concentration of ethanol up to 2% by volume, consistent with the enzyme-catalyzed conversion of ethanol to H2O2. The hRGB data fit well to a linear calibration curve (R2 = 0.99) although we note that the linear model is purely a matter of convenience. Blanks using this sensing device without enzyme loading did not show any response to ethanol. As before, the LoD (for ethanol) was estimated as three times the standard deviation from separate paper sensors divided by the slope of the working curve. The data yielded a LoD of 0.05 v/v% using the smartphone sensor. This comparatively low LoD compared to the one for H2O2 sensing was surprising. It could be owing to the relatively small number of sample-to-sample repeats (in other words, the true uncertainty could be larger than that reported from a few samples) and/or because of the different sensing method (ratios of selected wavelengths vs. RGB image analysis from several thousand pixels). When using ethanol concentrations above 2% the response of the sensor became erratic, likely because the abundant H2O2 produced in the reaction zone denatures the enzyme, which can lead to a decreased enzyme activity (Cicek et al., 2014). The enzyme was found to be functional for a period of 2 weeks, after which sensor performance began to degrade.
We finally demonstrate a “real world” sensing application in two alcoholic beverages. Two vodka brands commercially available in India, Smirnoff (SM) and Magic Moments (MM), were chosen for this study. Both liquors have a stated 42.8% alcohol content on the bottle. The samples were diluted by a factor of 100 and were analyzed by placing 10 µL onto the reaction zone following the same procedure described in the previous paragraph. In addition, we performed a separate check of the ethanol concentration in these beverages using the enzyme assay method (Table 3). We also measured the pH of MM and SM using a Mettler Toledo benchtop pH meter and obtained values of 7.18 and 7.26 for these two vodkas, respectively, indicating that acid-related interferences are absent from the measurements. While there is some minor scatter in the data, we find that the simple paper-based ethanol sensor developed here performed quite well given its simplicity, yielding ethanol contents of 43.3 ± 0.9% and 42.5 ± 0.4% for these two liquors, respectively.

TABLE 3. Measurement of ethanol concentration in two commercial liquors. The errors represent one SD from three repeats of each measurement. Quantification used the linear hue model.
This inexpensive paper-based sensor that could potentially work in consumer alcohol sensing applications. Perhaps surprisingly, it is founded on the acidic rather than on the oxidizing nature of the hydrogen peroxide reaction product. However, there are at least two caveats that need to be acknowledged. First, the signal is prone to interference from acids that may be present in some consumer liquors or other samples of interest. For acidic samples, the same paper-based ethanol sensor technique would require extra steps; for example, calibrating the sensor at a similar pH to that of the analyte or by first neutralizing the acidic species in the liquor. Another potential option would be to removing any excess H+ in the sample using an anion exchange resin, which has been reported to remove organic acids in biological and alcohol solutions (Cren et al., 2009; Cui et al., 2016). The second drawback is that the enzyme catalysis is sensitive to short chain alcohols (Mangos and Haas, 1996). This means that the method would not easily distinguish toxic alcohols such as methanol. However, when comparing sensor response to MeOH and EtOH, we observed a faster response for the MeOH, which tended to quickly saturate the response even at low concentrations (Mangos and Haas, 1996). Despite this drawback which is common to all alcohol oxidase reactions, we note that automated benchtop analyzers for alcohol detection using these enzyme catalyzed reactions are being aggressively developed (Azevedo et al., 2005) and laboratory detection kits based on this method have become commercially available.
Conclusion
In this work, we first developed a functionalized color-change fluorophore designed to be soluble in aqueous solutions and sticky to cellulose. The carboxyl functionalization provides a reaction site for organic molecules for chemical binding or physisorption processes, as well as for making the fluorophore soluble in water (Wang et al., 2019). Protonation of the pyridine groups causes the fluorescence to shift from blue to orange or red, enabling stable ratio-based analysis approaches. The basic photophysics of the new fluorophore were investigated by fluorescence and absorption spectroscopy and by DFT simulations, which indicated that c-P4VB should, in practice, be a good fluorescence-based sensor for protonation, while also showing excellent aqueous solubility and good binding to paper.
The basic optical properties of the c-P4VB fluorophore allowed the development of a paper-based fluorescent ethanol sensor via the proxy detection of H2O2. To accomplish this, we infused c-P4VB into a standard filter paper from which it could not be removed by aqueous solutions. The sensor responded well to plain hydrogen peroxide: by simply placing a few drops into the c-P4VB infused paper, a fluorescence color change is quickly observed. We employed this feature to build an ethanol biosensor by connecting a reaction paper infused with an enzyme catalyst through a thin channel to a fluorescent sensor zone. The catalyst converts ethanol to H2O2 in the reaction zone, which was then detected via fluorescence changes in the sensor zone. The detection was performed by analysis of images captured with a standard smartphone camera. Trial devices showed that reasonable results can be obtained for commercial liquors, potentially presenting a simple a paper-based check against the stated ethanol content. Although sensitive to certain interferents, it demonstrates a good limit of detection and because of its low cost and simplicity it could potentially be used in consumer applications in which the net alcohol content of a sample needs to be quickly estimated.
Materials and Methods
Chemical and Reagents
All solvents and reagents used in the synthesis were purchased from commercial sources and were applied without additional purification unless stated otherwise.
Preparation of Functionalized Fluorophore c-P4VB
The synthesis of c-P4VB was performed according to the following protocol. First, 6-(4-methoxyphenoxy)hexanoic acid 1 was prepared via the Williamson ether synthesis approach under optimized reaction conditions starting from 4-methoxyphenol and 6-bromohexanoic acid. This was subsequently bromomethylated with paraformaldehyde and HBr in acetic acid using a standard protocol. Thus obtained 6-[2,5-bis-(bromomethyl)-4-methoxyphenoxy]hexanoic acid 2 was reacted with excess of triethyl phosphite at 150°C to yield ethyl 6-(2,5-bis-((diethoxyphosphoryl)-methyl)-4-methoxyphenoxy)hexanoate 3, which was further converted to sodium 6-(4-methoxy-2,5-bis((E)-2-(pyridin-4-yl)vinyl)phenoxy)hexanoate 4 (c-P4VB) by reaction with 4-pyridincarboxaldehyde (Horner-Wadsworth-Emmons reaction conditions), producing a fine yellow to orange powder after purification (see SI for details). Nuclear magnetic resonance spectroscopy (Supplementary Figure S1) was consistent with the molecular structure shown in Figure 1B. The c-P4VB was then dissolved in DMSO, EtOH or MeOH (0.2 mM) for optical investigations. Different concentrations of H2O2 were subsequently added to some of the solutions to measure the fluorescence response. For comparative purposes, np-P4VB was also synthesized using previously-described methods (Lane et al., 2018).
Optical Characterization
UV-vis spectroscopy was performed using a model Cary-50 single beam spectrophotometer from Varian. The solution-based fluorescence spectroscopy was excited with the combined 351 and 364 nm lines of an Ar + ion laser (∼1.25 kW/m2), while the paper-based setup generally used a 405-nm pulsed diode laser at lower power densities, which minimized the weak fluorescence inherent to paper under UV excitation. The fluorescence was collected directly with an optical fiber (numerical aperture = 0.5), passed through a 400 or 450 nm longpass filter, and measured with an intensity-calibrated miniature spectrometer from Ocean Optics. Fluorescence microscopy was performed with a Nikon TE 2000e inverted epifluorescence microscope.
Preparation of c-P4VB-Functionalized Paper
Paper disks (0.5 inch diameter) made from Whatman No. 1 filter paper (pore size 11 μm and thickness of 180 μm). were prepared by using a puncher or simple cutting. A reaction solution was prepared, consisting of 0.1 ml of 0.5 mM c-P4VB (in EtOH) added to 0.9 ml of pH 8 potassium phosphate buffer (50 mM). A slightly basic pH was chosen to prevent protonation and to improve the fluorophore solubility compared to buffers with lower pH. The solubility of the fluorophore in the buffer solution depends on buffer concentration, with a lower solubility at higher buffer concentration (e.g., above 500 mM it becomes nearly insoluble). 10 paper disks were incubated in this reaction solution for 1 h. Next, they were rinsed separately in water twice and then methanol. Finally, the treated disks were sonicated for 30 min in methanol in order to remove the excess fluorophore. After the sonication, the disks were placed in a fume hood to dry for 15 min.
Hydrogen Peroxide Sensing With c-P4VB-Paper
To test the response of c-P4VB-paper, 20 µL of different concentrations of H2O2 solution was dropped on the paper disks and the fluorescence color changes were measured immediately. To test whether the stabilizers (which are sometimes acidic) in commercial H2O2 solutions interfered with the response, H2O2 was distilled using a rotary vacuum evaporator and the optical experiments were confirmed with this “clean” hydrogen peroxide. The final concentration of the distilled solution was measured using enzyme assay.
Ethanol Sensor
A µPAD ethanol sensor was prepared using two zones connected by a microfluidic channel. The first paper disk was the micro-reaction zone (R) (0.25 inch in diameter) with immobilized alcohol oxidase (AOx: an enzyme that catalyzes the oxidation of primary alcohol to the corresponding aldehyde and H2O2). The R zone was pre-treated by dropping 10 µL of alcohol oxidase (20 U mL−1 in water) onto it and allowing it to dry under a laminar flow hood for 1 h. The second disk was the sensor zone (S) (0.5 inch in diameter) infused with c-P4VB. The entire set-up was prepared on scotch tape for attaching the two zones with a linking channel (Figure 7A). Next, 10 µL of ethanol (0–2% v/v) in water was dropped on the reaction disk and allowed to incubate for 5 min to complete the reaction with AOx to produce H2O2, followed by 20 µL of milliQ to carry the reaction products into the S zone. After 5 min photographs of the treated S zone were taken using a smart phone. The signal was found by choosing a group of 5000 pixels near the input channel where the signal was strongest, splitting the image into the three-color channels (RGB), and dividing the average intensity in the blue channel by that in the red. Error bars represent the standard deviation of three separate measurements.
Vodka Sample Analysis
Two commercially available Vodka brands, Smirnoff (SM) and Magic Moments (MM), were procured from a local liquor store in India. Samples were taken from each bottle and were diluted by adding 10 µL of each liquor to 990 µL of milliQ water. 10 µL of the diluted samples were dropped from a pipette onto the reaction zone and incubated for 5 min to allow the enzymatic reaction sufficient time. Next, 20 µL of water was dropped on the reaction zone to carry the products to the sensor zone. After another 5 min, images of the S zone were taken under UV light using a OnePlus 7 smartphone. The pixel intensity of the S zones was then analyzed as described in ethanol sensor experimental section. The pH of the samples was measured using Mettler Toledo Benchtop pH meter. A further confirmation of the alcohol content was done using an enzyme oxidase assay 1. The chromogen for the assay was 2,2′-Azinobis (3-ethylbenzthiazoline-6-sulfonic acid) (ABTS) along with peroxidase enzyme (62.5 ml−1). The reaction solution consisted of 930 µL ABTS solution (2 mM in 100 mM phosphate buffer, pH 7.5), 3 µL peroxidase (62.5 ml−1) and 30 µL AOx (0.2 ml−1). 30 µL of varying concentration of ethanol and consumer vodkas (either SM and MM) were added to the reaction solution and the final solution was incubated for 10 min in room temperature. The alcohol concentration is given by the absorbance at 405 nm, which was performed with a Cary 300 Bio UV–vis spectrophotometer. The blank for this assay was prepared by using water instead of ethanol solution.
Data Availability Statement
The original contributions presented in the study are included in the article/Supplementary Material, further inquiries can be directed to the corresponding author.
Author Contributions
PD performed the experiments and analyses and contributed to the writing. HW assisted with experiments. SV did chemical synthesis and assisted with wrting. CD performed the MD simulations. PG assisted with the writing and concept. AM contributed to the writing and concept.
Conflict of Interest
The authors declare that the research was conducted in the absence of any commercial or financial relationships that could be construed as a potential conflict of interest.
Publisher’s Note
All claims expressed in this article are solely those of the authors and do not necessarily represent those of their affiliated organizations, or those of the publisher, the editors, and the reviewers. Any product that may be evaluated in this article, or claim that may be made by its manufacturer, is not guaranteed or endorsed by the publisher.
Acknowledgments
The authors thank DFG (IRTG 2022; project number 245845833) and NSERC (CREATE grant 463990-2015) for financial support of the Alberta/Technische Universität München Graduate School for Functional Hybrid Materials (ATUMS) and Future Energy Systems. PD acknowledges the Govt. of India for the SERB-UAlberta Overseas Visiting Doctoral Fellowship support for her visit to the Department of Physics, University of Alberta. CD thanks the Laboratory for Chemistry of Novel Materials at the Université de Mons in Belgium for access to computing facilities. ToC drawing by Tomas Spasiuk.
Supplementary Material
The Supplementary Material for this article can be found online at: https://www.frontiersin.org/articles/10.3389/fsens.2022.840130/full#supplementary-material
Footnotes
1https://www.sigmaaldrich.com/IN/en/technical-documents/protocol/protein-biology/enzyme-activity-assays/enzymatic-assay-of-alcohol-oxidase.
References
Akamatsu, M., Mori, T., Okamoto, K., Komatsu, H., Kumagai, K., Shiratori, S., et al. (2015). Detection of Ethanol in Alcoholic Beverages or Vapor Phase Using Fluorescent Molecules Embedded in a Nanofibrous Polymer. ACS Appl. Mater. Inter. 7, 6189–6194. doi:10.1021/acsami.5b00289
Aymerich, J., Márquez, A., Terés, L., Muñoz-Berbel, X., Jiménez, C., Domínguez, C., et al. (2018). Cost-effective Smartphone-Based Reconfigurable Electrochemical Instrument for Alcohol Determination in Whole Blood Samples. Biosens. Bioelectron. 117, 736–742. doi:10.1016/j.bios.2018.06.044
Azevedo, A., Prazeres, D., Cabral, J., and Fonseca, L. (2005). Ethanol Biosensors Based on Alcohol Oxidase. Biosens. Bioelectron. 21, 235–247. doi:10.1016/j.bios.2004.09.030
Cabaleiro, N., de la Calle, I., Bendicho, C., and Lavilla, I. (2012). Enzymatic Single-Drop Microextraction for the Assay of Ethanol in Alcohol-free Cosmetics Using Microvolume Fluorospectrometry Detection. Analytica Chim. Acta 733, 28–33. doi:10.1016/j.aca.2012.04.039
Chami Khazraji, A., and Robert, S. (2013). Interaction Effects between Cellulose and Water in Nanocrystalline and Amorphous Regions: A Novel Approach Using Molecular Modeling. J. Nanomater. 2013, 1–10. doi:10.1155/2013/409676
Chang, J., Li, H., Hou, T., Duan, W., and Li, F. (2018). Paper-based Fluorescent Sensor via Aggregation Induced Emission Fluorogen for Facile and Sensitive Visual Detection of Hydrogen Peroxide and Glucose. Biosens. Bioelectron. 104, 152–157. doi:10.1016/j.bios.2018.01.007
Chen, S., Yuan, R., Chai, Y., and Hu, F. (2013). Electrochemical Sensing of Hydrogen Peroxide Using Metal Nanoparticles: A Review. Microchim. Acta 180, 15–32. doi:10.1007/s00604-012-0904-4
Chen, W., Cai, S., Ren, Q.-Q., Wen, W., and Zhao, Y.-D. (2012). Recent Advances in Electrochemical Sensing for Hydrogen Peroxide: A Review. Analyst 137, 49–58. doi:10.1039/c1an15738h
Chinnadayyala, S. R., Kakoti, A., Santhosh, M., and Goswami, P. (2014). A Novel Amperometric Alcohol Biosensor Developed in a 3rd Generation Bioelectrode Platform Using Peroxidase Coupled Ferrocene Activated Alcohol Oxidase as Biorecognition System. Biosens. Bioelectron. 55, 120–126. doi:10.1016/j.bios.2013.12.005
Cinti, S., Basso, M., Moscone, D., and Arduini, F. (2017). A Paper-Based Nanomodified Electrochemical Biosensor for Ethanol Detection in Beers. Analytica Chim. Acta 960, 123–130. doi:10.1016/j.aca.2017.01.010
Cren, É. C., Cardozo Filho, L., Silva, E. A., and Meirelles, A. J. A. (2009). Breakthrough Curves for Oleic Acid Removal from Ethanolic Solutions Using a strong Anion Exchange Resin. Sep. Purif. Tech. 69, 1–6. doi:10.1016/j.seppur.2009.06.027
Cui, S., Zhao, J., Zhang, H., and Chen, W. (2016). High-density Culture of Lactobacillus Plantarum Coupled with a Lactic Acid Removal System with Anion-Exchange Resins. Biochem. Eng. J. 115, 80–84. doi:10.1016/j.bej.2016.08.005
Dröge, W., and Schipper, H. M. (2007). Oxidative Stress and Aberrant Signaling in Aging and Cognitive Decline. Aging Cell 6, 361–370. doi:10.1111/j.1474-9726.2007.00294.x
Duan, Y., Liu, Y., Han, H., Zhang, X., Zhang, M., Liao, Y., et al. (2021). A Donor-π-Acceptor Aggregation-Induced Emission Compound Serving as a Portable Fluorescent Sensor for Detection and Differentiation of Methanol and Ethanol in the Gas Phase. Spectrochimica Acta A: Mol. Biomol. Spectrosc. 252, 119515. doi:10.1016/j.saa.2021.119515
Fong, J. K., Dansby-sparks, R. N., Lamb, A. C., Owen, T. W., Mushfiq, M., Sampathkumaran, U., et al. (2014). Fluorescent-Dye Doped Thin-Film Sensors for the Detection of Alcohol Vapors. Ajac 05, 566–580. doi:10.4236/ajac.2014.59064
Fu, X., Zhang, H., Xiao, J.-p., and Liu, S.-q. (2012). Enzymatic Detection of Ethanol Based on H2O2-Sensitive Quantum Dots. J. Cent. South. Univ. 19, 3040–3045. doi:10.1007/s11771-012-1376-8
Giorgio, M., Trinei, M., Migliaccio, E., and Pelicci, P. G. (2007). Hydrogen Peroxide: A Metabolic By-Product or a Common Mediator of Ageing Signals? Nat. Rev. Mol. Cel Biol. 8, 722–728. doi:10.1038/nrm2240
Girei, S. H., Shabaneh, A. A., Ngee-Lim, H., Hamidon, M. N., MAhdi, M. A., and Yaacob, M. H. (2015). Tapered Optical Fiber Coated with Graphene Based Nanomaterials for Measurement of Ethanol Concentrations in Water. Opt. Rev. 22, 385–392. doi:10.1007/s10043-015-0075-8
Gotor, R., Bell, J., and Rurack, K. (2019). Tailored Fluorescent Solvatochromic Test Strips for Quantitative On-Site Detection of Gasoline Fuel Adulteration. J. Mater. Chem. C 7, 2250–2256. doi:10.1039/c8tc04818e
Han, T., Yang, J., Miao, R., Liu, K., Li, J., Wang, D., et al. (2021). Direct Distinguishing of Methanol over Ethanol with a Nanofilm‐Based Fluorescent Sensor. Adv. Mater. Technol. 6, 2000933. doi:10.1002/admt.202000933
Hitomi, Y., Takeyasu, T., and Kodera, M. (2013). Iron Complex-Based Fluorescent Probes for Intracellular Hydrogen Peroxide Detection. Chem. Commun. 49, 9929–9931. doi:10.1039/c3cc44471f
Hu, L., Yuan, Y., Zhang, L., Zhao, J., Majeed, S., and Xu, G. (2013). Copper Nanoclusters as Peroxidase Mimetics and Their Applications to H2O2 and Glucose Detection. Analytica Chim. Acta 762, 83–86. doi:10.1016/j.aca.2012.11.056
Hu, X., Cao, H., Dong, W., and Tang, J. (2021). Ratiometric Fluorescent Sensing of Ethanol Based on Copper Nanoclusters with Tunable Dual Emission. Talanta 233, 122480. doi:10.1016/j.talanta.2021.122480
Jia, X., Hu, G., Nitze, F., Barzegar, H. R., Sharifi, T., Tai, C.-W., et al. (2013). Synthesis of Palladium/helical Carbon Nanofiber Hybrid Nanostructures and Their Application for Hydrogen Peroxide and Glucose Detection. ACS Appl. Mater. Inter. 5, 12017–12022. doi:10.1021/am4037383
Kaushik, S., and Goswami, P. (2018). Bacterial Membrane Depolarization-Linked Fuel Cell Potential Burst as Signal for Selective Detection of Alcohol. ACS Appl. Mater. Inter. 10, 18630–18640. doi:10.1021/acsami.8b01838
Kavinkumar, T., Sastikumar, D., and Manivannan, S. (2014). Reduced Graphene Oxide Coated Optical Fiber for Methanol and Ethanol Vapor Detection at Room Temperature. Proc. SPIE 9270, 1–6. doi:10.1117/12.2071841
Kekec, N. C., Kanik, F. E., Udum, Y. A., Hizliates, C. G., Ergun, Y., and Toppare, L. (2014). A Novel Conducting Polymer Based Platform for Ethanol Sensing. Sensors Actuators B: Chem. 193, 306–314. doi:10.1016/j.snb.2013.12.007
Khan, M. M., and Cho, M. H. (2018). Positively Charged Gold Nanoparticles for Hydrogen Peroxide Detection. BioNanoSci. 8, 537–543. doi:10.1007/s12668-018-0503-x
Kim, M. I., Shim, J., Parab, H. J., Shin, S. C., Lee, J., and Park, H. G. (2012). A Convenient Alcohol Sensor Using One-Pot Nanocomposite Entrapping Alcohol Oxidase and Magnetic Nanoparticles as Peroxidase Mimetics. J. Nanosci. Nanotechnol. 12, 5914–5919. doi:10.1166/jnn.2012.6375
Laloi, C., Apel, K., and Danon, A. (2004). Reactive Oxygen Signalling: The Latest News. Curr. Opin. Plant Biol. 7, 323–328. doi:10.1016/j.pbi.2004.03.005
Lane, S., Vagin, S., Wang, H., Heinz, W. R., Morrish, W., and Zhao, Y. (2018). Wide-Gamut Lasing from a Single Organic Chromophore. Light Sci. Appl. 7, 1–9. doi:10.1038/s41377-018-0102-1
Li, H., Guo, Y., Xiao, L., and Chen, B. (2014). A Fluorometric Biosensor Based on H2O2-Sensitive Nanoclusters for the Detection of Acetylcholine. Biosens. Bioelectron. 59, 289–292. doi:10.1016/j.bios.2014.03.054
Liu, B., Sun, Z., Huang, P.-J. J., and Liu, J. (2015). Hydrogen Peroxide Displacing DNA from Nanoceria: Mechanism and Detection of Glucose in Serum. J. Am. Chem. Soc. 137, 1290–1295. doi:10.1021/ja511444e
Liu, M.-M., Lian, X., Liu, H., Guo, Z.-Z., Huang, H.-H., Lei, Y., et al. (2019). A Colorimetric Assay for Sensitive Detection of Hydrogen Peroxide and Glucose in Microfluidic Paper-Based Analytical Devices Integrated with Starch-Iodide-Gelatin System. Talanta 200, 511–517. doi:10.1016/j.talanta.2019.03.089
Mahadeva, S. K., Walus, K., and Stoeber, B. (2015). Paper as a Platform for Sensing Applications and Other Devices: A Review. ACS Appl. Mater. Inter. 7, 8345–8362. doi:10.1021/acsami.5b00373
Mangos, T. J., and Haas, M. J. (1996). Enzymatic Determination of Methanol with Alcohol Oxidase, Peroxidase, and the Chromogen 2,2'-Azinobis(3-Ethylbenzthiazoline-6-Sulfonic Acid) and its Application to the Determination of the Methyl Ester Content of Pectins. J. Agric. Food Chem. 44, 2977–2981. doi:10.1021/jf960274z
Manivannan, S., Saranya, A. M., Renganathan, B., Sastikumar, D., Gobi, G., and Park, K. C. (2012). Single-walled Carbon Nanotubes Wrapped Poly-Methyl Methacrylate Fiber Optic Sensor for Ammonia, Ethanol and Methanol Vapors at Room Temperature. Sensors Actuators B: Chem. 171-172, 634–638. doi:10.1016/j.snb.2012.05.045
Martinez, A. W., Phillips, S. T., Whitesides, G. M., and Carrilho, E. (2010). Diagnostics for the Developing World: Microfluidic Paper-Based Analytical Devices. Anal. Chem. 82, 3–10. doi:10.1021/ac9013989
Morrish, W., Riesen, N., Stobie, S., François, A., and Meldrum, A. (2018). Geometric Resonances for High-Sensitivity Microfluidic Lasing Sensors. Phys. Rev. Appl. 10, 051001. doi:10.1103/physrevapplied.10.051001
Narayanaswamy, N., Narra, S., Nair, R. R., Saini, D. K., Kondaiah, P., and Govindaraju, T. (2016). Stimuli-responsive Colorimetric and NIR Fluorescence Combination Probe for Selective Reporting of Cellular Hydrogen Peroxide. Chem. Sci. 7, 2832–2841. doi:10.1039/c5sc03488d
Nguyen, T.-Q., Doan, V., and Schwartz, B. J. (1999). Conjugated Polymer Aggregates in Solution: Control of Interchain Interactions. J. Chem. Phys. 110, 4068–4078. doi:10.1063/1.478288
Preucil, F. (1953). Color Hue and Ink Transfer:Their Relation to Perfect Reproduction. TAGA Proceedings, 102–110.
Priyanga, N., Raja, A. S., Pannipara, M., Al-Sehemi, A. G., Phang, S.-M., Xia, Y., et al. (2021). Hierarchical MnS@MoS2 Architectures on tea Bag Filter Paper for Flexible, Sensitive, and Selective Non-enzymatic Hydrogen Peroxide Sensors. J. Alloys Comp. 855, 157103. doi:10.1016/j.jallcom.2020.157103
Ragavan, K. V., Ahmed, S. R., Weng, X., and Neethirajan, S. (2018). Chitosan as a Peroxidase Mimic: Paper Based Sensor for the Detection of Hydrogen Peroxide. Sensors Actuators B: Chem. 272, 8–13. doi:10.1016/j.snb.2018.05.142
Rhee, S. G. (2006). H 2 O 2 , a Necessary Evil for Cell Signaling. Science 312, 1882–1883. doi:10.1126/science.1130481
Robidillo, C. J. T., Wandelt, S., Dalangin, R., Zhang, L., Yu, H., Meldrum, A., et al. (2019). Ratiometric Detection of Nerve Agents by Coupling Complementary Properties of Silicon-Based Quantum Dots and Green Fluorescent Protein. ACS Appl. Mater. Inter. 11, 33478–33488. doi:10.1021/acsami.9b10996
Sánchez-Calvo, A., Costa-García, A., and Blanco-López, M. C. (2020). Paper-based Electrodes Modified with Cobalt Phthalocyanine Colloid for the Determination of Hydrogen Peroxide and Glucose. Analyst 145, 2716–2724. doi:10.1039/c9an02413a
Saxena, U., and Goswami, P. (2012). Electrical and Optical Properties of Gold Nanoparticles: Applications in Gold Nanoparticles-Cholesterol Oxidase Integrated Systems for Cholesterol Sensing. J. Nanopart Res. 14, 1. doi:10.1007/s11051-012-0813-9
Seed, B. (1982). Diazotizable Arylamine Cellulose Papers for the Coupling and Hybridization of Nucleic Acids. Nucleic Acids Res. 10, 1799–1810. doi:10.1093/nar/10.5.1799
Sekretaryova, A. N., Beni, V., Eriksson, M., Karyakin, A. A., Turner, A. P. F., and Vagin, M. Y. (2014). Cholesterol Self-Powered Biosensor. Anal. Chem. 86, 9540–9547. doi:10.1021/ac501699p
Shamkhalichenar, H., and Choi, J.-W. (2017). An Inkjet-Printed Non-enzymatic Hydrogen Peroxide Sensor on Paper. J. Electrochem. Soc. 164, B3101–B3106. doi:10.1149/2.0161705jes
Shamkhalichenar, H., and Choi, J.-W. (2020). Review-Non-Enzymatic Hydrogen Peroxide Electrochemical Sensors Based on Reduced Graphene Oxide. J. Electrochem. Soc. 167, 037531. doi:10.1149/1945-7111/ab644a
Sharma, L., Gouraj, S., Raut, P., and Tagad, C. (2020). Development of a Surface-Modified Paper-Based Colorimetric Sensor Using Synthesized Ag NPs-Alginate Composite. Environ. Tech. 42, 3441–3450. doi:10.1080/09593330.2020.1732471
Singh, S., Mitra, K., Singh, R., Kumari, A., Sen Gupta, S. K., Misra, N., et al. (2017). Colorimetric Detection of Hydrogen Peroxide and Glucose Using Brominated Graphene. Anal. Methods 9, 6675–6681. doi:10.1039/c7ay02212c
Song, J., Guo, J., Liu, Y., Tan, Q., Zhang, S., and Yu, Y. (2019). A Comparative Study on Properties of Cellulose/Antarctic Krill Protein Composite Fiber by Centrifugal Spinning and Wet Spinning. Fibers Polym. 20, 1547–1554. doi:10.1007/s12221-019-8725-2
Teodoro, K. B. R., Migliorini, F. L., Christinelli, W. A., and Correa, D. S. (2019). Detection of Hydrogen Peroxide (H2O2) Using a Colorimetric Sensor Based on Cellulose Nanowhiskers and Silver Nanoparticles. Carbohydr. Polym. 212, 235–241. doi:10.1016/j.carbpol.2019.02.053
Thepchuay, Y., Sonsa-ard, T., Ratanawimarnwong, N., Auparakkitanon, S., Sitanurak, J., and Nacapricha, D. (2020). Paper-based Colorimetric Biosensor of Blood Alcohol with In-Situ Headspace Separation of Ethanol from Whole Blood. Analytica Chim. Acta 1103, 115–121. doi:10.1016/j.aca.2019.12.043
Thungon, P. D., Kakoti, A., Ngashangva, L., and Goswami, P. (2017). Advances in Developing Rapid, Reliable and Portable Detection Systems for Alcohol. Biosens. Bioelectron. 97, 83–99. doi:10.1016/j.bios.2017.05.041
Trachootham, D., Alexandre, J., and Huang, P. (2009). Targeting Cancer Cells by ROS-Mediated Mechanisms: A Radical Therapeutic Approach? Nat. Rev. Drug Discov. 8, 579–591. doi:10.1038/nrd2803
Tsai, Y.-C., Chen, S.-Y., and Lee, C.-A. (2008). Amperometric Cholesterol Biosensors Based on Carbon Nanotube-Chitosan-Platinum-Cholesterol Oxidase Nanobiocomposite. Sensors Actuators B: Chem. 135, 96–101. doi:10.1016/j.snb.2008.07.025
Wang, H., Vagin, S. I., Lane, S., Lin, W., Shyta, V., Heinz, W. R., et al. (2019). Metal-Organic Framework with Color-Switching and Strongly Polarized Emission. Chem. Mater. 31, 5816–5823. doi:10.1021/acs.chemmater.9b01897
Wang, H., Vagin, S. I., Rieger, B., and Meldrum, A. (2020). An Ultrasensitive Fluorescent Paper-Based CO2 Sensor. ACS Appl. Mater. Inter. 12, 20507–20513. doi:10.1021/acsami.0c03405
Wen, F., Dong, Y., Feng, L., Wang, S., Zhang, S., and Zhang, X. (2011). Horseradish Peroxidase Functionalized Fluorescent Gold Nanoclusters for Hydrogen Peroxide Sensing. Anal. Chem. 83, 1193–1196. doi:10.1021/ac1031447
Xiao, H., Li, P., Hu, X., Shi, X., Zhang, W., and Tang, B. (2016). Simultaneous Fluorescence Imaging of Hydrogen Peroxide in Mitochondria and Endoplasmic Reticulum during Apoptosis. Chem. Sci. 7, 6153–6159. doi:10.1039/c6sc01793b
Xu, M., Bunes, B. R., and Zang, L. (2011). Paper-based Vapor Detection of Hydrogen Peroxide: Colorimetric Sensing with Tunable Interface. ACS Appl. Mater. Inter. 3, 642–647. doi:10.1021/am1012535
You, X., and Pak, J. J. (2014). Graphene-based Field Effect Transistor Enzymatic Glucose Biosensor Using Silk Protein for Enzyme Immobilization and Device Substrate. Sensors Actuators B: Chem. 202, 1357–1365. doi:10.1016/j.snb.2014.04.079
Zhang, R., He, S., Zhang, C., and Chen, W. (2015). Three-dimensional Fe- and N-Incorporated Carbon Structures as Peroxidase Mimics for Fluorescence Detection of Hydrogen Peroxide and Glucose. J. Mater. Chem. B 3, 4146–4154. doi:10.1039/c5tb00413f
Keywords: paper, fluorescence, hydrogen peroxide, ethanol, sensor, alcohol
Citation: Thungon PD, Wang H, Vagin SI, Dyck CV, Goswami P, Rieger B and Meldrum A (2022) A Fluorescent Alcohol Biosensor Using a Simple microPAD Based Detection Scheme. Front. Sens. 3:840130. doi: 10.3389/fsens.2022.840130
Received: 20 December 2021; Accepted: 18 March 2022;
Published: 04 May 2022.
Edited by:
Chatchawal Wongchoosuk, Kasetsart University, ThailandReviewed by:
Daniel S. Correa, Brazilian Agricultural Research Corporation (EMBRAPA), BrazilChalongrat Daengngam, Prince of Songkla University, Thailand
Copyright © 2022 Thungon, Wang, Vagin, Dyck, Goswami, Rieger and Meldrum. This is an open-access article distributed under the terms of the Creative Commons Attribution License (CC BY). The use, distribution or reproduction in other forums is permitted, provided the original author(s) and the copyright owner(s) are credited and that the original publication in this journal is cited, in accordance with accepted academic practice. No use, distribution or reproduction is permitted which does not comply with these terms.
*Correspondence: Alkiviathes Meldrum, YW1lbGRydW1AdWFsYmVydGEuY2E=