 Hamed Taheri Gorji1
 Jo Ann S. Van Kessel2
 Bradd J. Haley2
 Kaylee Husarik1,3Jakeitha Sonnier2
 Seyed Mojtaba Shahabi4Hossein Kashani Zadeh3Diane E. Chan2
 Jianwei Qin2
 Insuck Baek2Moon S. Kim2Alireza Akhbardeh3Mona Sohrabi3Brick Kerge3Nicholas MacKinnon3Fartash Vasefi3Kouhyar Tavakolian1*
- 1Biomedical Engineering Program, University of North Dakota, Grand Forks, ND, United States
- 2USDA/ARS Environmental Microbial and Food Safety Laboratory, Beltsville Agricultural Research Center, Beltsville, MD, United States
- 3SafetySpect Inc., Grand Forks, ND, United States
- 4School of Electrical Engineering & Computer Science, College of Engineering and Mines, University of North Dakota, Grand Forks, ND, United States
Precise, reliable, and speedy contamination detection and disinfection is an ongoing challenge for the food-service industry. Contamination in food-related services can cause foodborne illness, endangering customers and jeopardizing provider reputations. Fluorescence imaging has been shown to be capable of identifying organic residues and biofilms that can host pathogens. We use new fluorescence imaging technology, applying Xception and DeepLabv3+ deep learning algorithms to identify and segment contaminated areas in images of equipment and surfaces. Deep learning models demonstrated a 98.78% accuracy for differentiation between clean and contaminated frames on various surfaces and resulted in an intersection over union (IoU) score of 95.13% for the segmentation of contamination. The portable imaging system’s intrinsic disinfection capability was evaluated on S. enterica, E. coli, and L. monocytogenes, resulting in up to 8-log reductions in under 5 s. Results showed that fluorescence imaging with deep learning algorithms could help assure safety and cleanliness in the food-service industry.
Introduction
Eating at restaurants or institutional dining facilities is a part of our lives worldwide. U.S. restaurant industry sales were $780 billion in 2016 (Bartsch et al., 2018). The National Restaurant Association says 47% of every 2016 food dollar was spent in a restaurant, and the average American dined out five times per week (Bartsch et al., 2018). Restaurants handle a variety of raw foods, presenting a risk of cross-contamination leading to foodborne illness. Cross-contamination can happen at any stage of food handling, from food processing to food serving, and in domestic kitchens following an unintentional transfer of bacteria or other microorganisms from contaminated surfaces to another surface (Giaouris et al., 2014). In restaurants, cross-contamination can occur during food preparation stages due to poor cleaning and sanitization procedures, improper hand hygiene, or improper separation of ready-to-eat foods (e.g., salad and fresh fruits) from foods requiring cooking (e.g., meat) (Weinstein, 1991; Jackson et al., 2000).
Foodborne illness outbreaks occur when people eat food contaminated with a disease-causing agent (Hedberg, 2013). Since restaurants allow people to gather for shared food experiences, they also provide opportunities for outbreaks to happen. Restaurants are more often linked to food illness outbreaks than other food preparation sites. In 2017, 841 foodborne disease outbreaks were reported in the U.S., with restaurants accounting for two-thirds of these (Firestone et al., 2021). The impact of these outbreaks is significant in the cost of human health and mortality and the economic impact on commercial establishments. The economic impact comes from loss of revenue and damage to brand strength. Loss of income is due to the cost of a facility shutdown while investigating and remediating the problem, lost customers, and lawsuits (Bartsch et al., 2018).
In 2015 the share value of a reputable restaurant chain in the U.S. decreased by 18% in the first 2 months of an E. coli outbreak, and their brand strength index fell by 27% (Brand Finance, 2018). A 2013 study in the International Journal of Hospitality Management reported that the negative impact on investment value expressed as cumulative abnormal return (CAR) for multiple publicly traded firms was significant in magnitude (Seo et al., 2013). A 2018 study conducted by Brand Finance estimating the impact on business equity showed that “Businesses in the Restaurant & Food Services industry face a risk of losing up to 19% of their Enterprise Value as a result of a food safety incident.” Using the example of Darden Restaurants Group, they calculated the business value at risk for Darden to be $2.4 billion and for the industry as a whole, the business risk to be $104 billion (Brand Finance, 2018).
During meal preparation, residues left on food processing surfaces or equipment can create a favorable environment for microorganisms to grow, often forming biofilms (Jun et al., 2010). Foodborne pathogens associated with food poisoning include Salmonella enterica, Listeria monocytogenes, and Escherichia coli O 157:H7, which form robust biofilms (Giaouris et al., 2014). Bacterial cells can easily release from biofilms and quickly spread to other surfaces in the food preparation environment (Trachoo, 2003). Release of pathogenic bacteria from biofilms leads to cross-contamination from preparation surfaces to prepared food. Effective sanitization methods and food handling procedures must be implemented to reduce the spread of foodborne pathogens.
Currently, retail food and food-service businesses in the U.S. are regulated by more than 3,000 state, local, and tribal entities, responsible for maintaining oversight and inspection of over one million food establishments (Food and Drug Administration, 2021). The most common testing method for microorganism contamination is swabbing of food contact surfaces and equipment for Adenosine Triphosphate (ATP) testing or laboratory culturing (Verran et al., 2010). These methods can be time-consuming and do not provide real-time detection of potentially harmful microorganisms, allowing additional spread of microorganisms through a food preparation facility. Swabbing methods cannot test large surface areas even when swiped back and forth (up to 100 cm2). More effective solutions are needed to combat cross-contamination in restaurants and institutional kitchens. Optical fluorescence imaging can provide this improved confidence. Fluorescence imaging can play an essential role in food safety and provide a fast and effective method to detect biofilms and organic residues that are less visible or invisible to the human eye. Real-time analysis to identify invisible biofilms and organic residues, followed by immediate disinfection, could reduce foodborne illnesses in restaurants and institutional kitchens.
Image processing and machine learning algorithms have rapidly increased in food safety and food security applications, especially in meat processing (Li et al., 2021; Shi et al., 2021). Several studies have used threshold-based algorithms to detect contaminated areas, but determining threshold values is challenging, and inappropriate thresholds can contribute to false-positive and false-negative results. Many fluorescence imaging applications using thresholding were performed in the absence of ambient light or self-illuminated instrument displays, and fluorescence intensity thresholding can be implemented more straightforwardly. Trying to accomplish fluorescence imaging under ambient light conditions creates additional complexity in establishing suitable thresholds (Seo et al., 2019; Sueker et al., 2021).
More sophisticated and reliable algorithms are needed. Deep neural network (DNN) algorithms, especially convolutional neural network (CNN) algorithms, have become popular machine learning methods in many fields (Taheri Gorji and Kaabouch, 2019; Zuo et al., 2019; Gao et al., 2020; Rezaee et al., 2020; Rezaee et al., 2022), including food safety (Zhou et al., 2019; Zhu et al., 2021). CNN models are advantageous because they can automatically extract information from images and videos and learn from them. Learned weights of a trained CNN model can be saved and reused with a new dataset without re-training the model (Ribani and Marengoni, 2019). DNN algorithms have many food safety applications, including food recognition and classification, calorie estimation, supply chain monitoring, food quality assessment, and contamination detection (Pouladzadeh et al., 2016; Nayak et al., 2020; Chen et al., 2021; Gorji et al., 2022). Food-related applications of DNN algorithms have been studied, but we know of no study on detection and segmentation of organic residue or biofilm contamination in institutional kitchens and restaurants.
Here, we use a new fluorescence imaging system developed by SafetySpect Inc. (Grand Forks, ND) and two state-of-the-art deep learning algorithms developed by Google researchers, Xception, to identify video frames with contamination and then DeepLabv3+, to precisely segment and label the associated regions of contamination in a frame identified as contaminated. A portable fluorescence imaging system for “contamination, sanitization inspection, and disinfection” (CSI-D) has been developed by SafetySpect (Sueker et al., 2021). It provides mobility and flexibility for contamination identification and disinfection on surfaces in institutional kitchens and restaurants, even under bright ambient light. However, to tap the enormous potential of this technology for use in the food and food-service industries, the fluorescence video or image frames captured by the system must be processed and interpreted.
An automated method for analyzing these video frames and detecting contamination will make work easier for inspectors. After CSI-D detects contamination missed during cleaning, CSI-D’s UVC germicidal illumination can disinfect the missed area. CSI-D is not intended to provide primary sanitization but can disinfect small areas missed during cleaning. We used several bacterial strains, S. enterica, E. coli, and L. monocytogenes, to evaluate the efficacy of the CSI-D system’s disinfection performance and characterized the killing percentage based on a range of UVC dosages to evaluate the effectiveness of this additional safety barrier during food processing.
Materials and methods
Contamination detection and disinfection technology
Much of the fluorescence in biofilms and food residues comes from a limited number of organic compounds characterized by conjugated double bonds (alternating single and double bonds) that can fluoresce. Polyaromatic hydrocarbons, heterocyclic compounds, and several highly unsaturated aliphatic molecules comprise intrinsic fluorescent components (Valeur and Berberan-Santos, 2012; Sikorska et al., 2019). The CSI-D is a fast, convenient, and easy-to-use handheld automated imaging inspection device that offers mobility and flexibility for fluorescence-based detection of intrinsic fluorophore residues on various surfaces (Sueker et al., 2021). CSI-D provides detection, disinfection, and documentation of contaminants on surfaces that might spread pathogens and cause disease. Novel aspects of the CSI-D solution include the combination of contamination identification and immediate remediation of the potential threat (bacteria, virus) using UVC light disinfection and image- or video-based documentation of this process to provide traceable evidence of disinfection. At a distance of 20 cm, the field of view (FOV) of the RGB camera used for fluorescence imaging is 30 cm. Its lighting module consists of 275-nm and 405-nm light-emitting diode (LED) arrays and a heatsink for heat dissipation from the LEDs and driver circuits. SafetySpect designed the CSI-D illumination system to ensure adequate illumination uniformity and intensity at the desired working distance (between 12.5 and 20 cm) for fluorescence detection and effective disinfection using the 275-nm LEDs for treatments of 2–5 s. Wireless communication enables remotely placed staff to supervise inspections in real-time and instantly respond to inspection concerns. Figure 1 shows the CSI-D device.
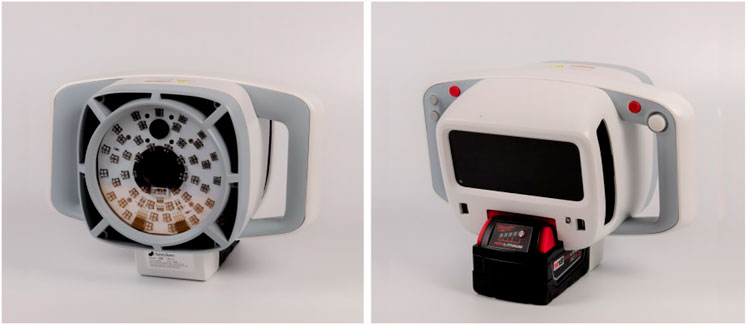
FIGURE 1. CSI-D device, Front view, and Rear view.
Contamination detection data collection
We collected data at six Edgewood long-term care facility (LTCF) institution kitchens in North Dakota and two restaurants in Los Angles, California, United States. Before data acquisition, we had detailed discussions with each facility manager to better understand their high-touch and high-risk areas, the cleaning methods used, and any perceived sanitization concerns. The CSI-D system was used to record video from multiple high-risk areas. We scanned all identified high-risk areas such as trash bins, fridge door handles, cutting boards, and preparation tables. We captured the videos at 1,024 × 768 resolution and 24 frames per second (FPS). 1 h and 35 min of video scans were used for further analysis.
Figure 2A,B show examples of clean and contaminated surfaces. Since many materials fluoresce naturally, clean surfaces can show both green and red fluorescence. It is insufficient to simply look for different colors in the dual-band fluorescence images. What is important is to look for fluorescence differences in the image that are different from the background objects. Figure 2A, columns 4 and 5 show some fluorescence differences that follow the background object’s shape and are not contamination. In Figure 2B, we see fluorescence differences in the form of spray and splash patterns that are clearly different from the background object fluorescence and are likely contamination. Depending on the excitation wavelength, fluorescing food components can include aromatic amino acids, vitamins A, E, B2, and B6, NADH coenzymes, phenolic compounds, chlorophylls, and porphyrins. Process-derived elements that also fluoresce consist of Maillard reaction products, food additives, and contaminants, including antibiotics, pesticide residues, mycotoxins and aflatoxins, and fecal contamination (Sikorska et al., 2019).
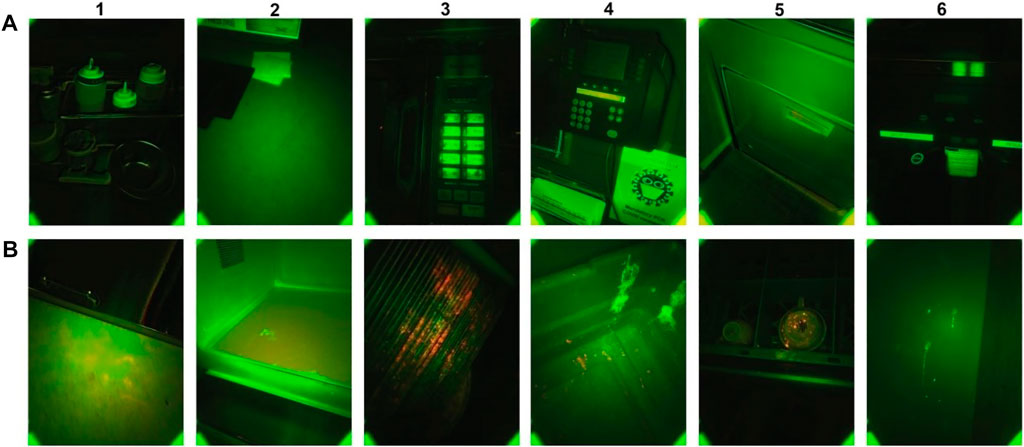
FIGURE 2. Fluorescence images captured by CSI-D (A) CSI-D fluorescence images of surfaces without indications of contamination. (B) CSI-D fluorescence images of surfaces with indications of contamination.
Contamination detection and segmentation
We set out to accomplish two aims with our investigation. Using a DNN model, we initially sought to distinguish between images showing contamination on different surfaces (contamination) and those showing no contamination (clean). The precise locations of the contamination in the images we previously classified as contamination images were subsequently detected using a semantic segmentation approach.
A total of 72,381 frames were used for clean and contamination classification, comprising 35,858 clean frames and 36,523 contamination frames. Video segments containing contamination were identified by two experts who were present throughout the data collection. These segments contained many frames, and many of these were sequential frames from video of the same contamination but at different positions, angles, and distances. This allowed faster labeling of video frames as contamination and clean while providing different views for the training of the algorithm. The frames, once reviewed, were transferred to separate clean and contamination digital file folders to later be used for training the model.
For the image segmentation, a total of 12,500 frames were labeled at the pixel level by four image labelers under the supervision of two experts present throughout the data collection and another expert who provided review and training remotely.
Contamination detection model architecture
For the image classification aim, we used a state-of-the-art CNN model named Xception to classify the video frames recorded using the CSI-D device into two categories: clean and contamination. Before feeding the data to the model, we extracted frames from videos.
The Xception model was developed by Google (Chollet, 2017) by modifying modules of Inception (Szegedy et al., 2015) with depthwise separable convolutions (DSC). Xception’s high-performance architecture depends on two key components: DSC and residual connections between convolution blocks. Using DSC increases representational efficiency while generating fewer parameters than standard CNNs, reducing computational cost and memory requirements. Using residual connections (He et al., 2015) addresses the vanishing gradient problem (Hochreiter, 1998) common in very deep networks, which causes architecture performance to saturate or degrade.
The backbone of Xception’s feature extraction is its 36 convolutional layers. These layers are divided into 14 modules connected by linear residual connections, except for the first and last modules. The network performs channel-wise pooling or cross-channel downsampling with each residual 1 × 1 convolution layer block (Lin et al., 2013). The 1 × 1 convolution layer acts as a projection layer, aggregating information across channels and reducing dimensionality. This layer reduces the number of filters while adding non-linearity and retaining crucial, feature-related information. In the Xception architecture, the 1 × 1 convolution layer has a stride of 2 × 2, reducing the feature map size in the residual path to match it with the feature map size of the max pooling layer.
Figure 3 shows the Xception model’s architecture where the data enters the input flow, then passes to the middle flow for eight iterations, and finally, the exit flow. All convolution and SeparableConvolution layers are followed by batch normalization and a Rectified Linear Unit (ReLU) activation function (Ioffe and Szegedy, 2015; Agarap, 2018). The batch normalization can stabilize the learning process and significantly reduce the number of training epochs needed by reducing the internal covariate shift when training a deep learning model (Ioffe and Szegedy, 2015). The default input image size for Xception is (299, 299, 3), and the images will pass through the entry flow.
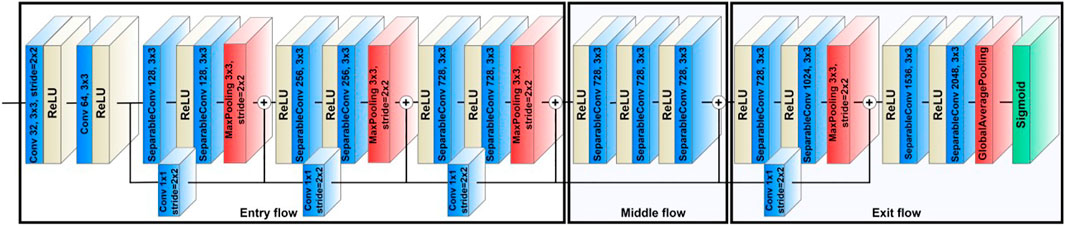
FIGURE 3. The architectures of Xception model (Conv stands for convolutional layer).
The entry flow comprises four modules, including one module of convolutional layers and three modules of SeparableConvolution layers. The first module comprises a layer of 32 filters with a kernel size of 3 × 3 and a stride of 2 × 2, and a layer of 64 filters with a kernel size of 3 × 3. For the other three entry flow modules, each has two SeparableConvolution layers and one max-pooling layer. The filter sizes in these three modules are 128, 256, and 728, used in that order. The kernel sizes are 3 × 3, and the strides are 2 × 2. The input image dimensions change from 299 × 299 × 3 on entry to 19 × 19 × 728 on exit from the entry flow.
The feature maps then pass to the middle flow, consisting of eight repeated modules, each of which includes three SeparableConvolution layers with a filter size of 728 and a kernel size of 3 × 3. The middle flow mainly learns the correlations and optimizes the features after the feature spatial dimensions are reduced in the entry flow.
In the final stage, the feature maps proceed to the exit flow consisting of two modules, a residual block, and a non-residual block. The residual block consists of two SeparableConvolution layers, with filter sizes of 728 and 1,024 used in that order, followed by a max-pooling layer to reduce the dimensions of the feature maps. The non-residual block also comprises two SeparableConvolution layers, with filter sizes of 1,536 and 2048 used in that order. However, instead of using a max-pooling layer, the two SeparableConvolution layers are followed by a global average pooling layer that can minimize model overfitting by reducing the final number of parameters in the model. The model will use these final 2048 features for classification. Since the first aim of this study is to classify frames as Clean or Contamination, a binary classification task, we used a sigmoid function as the activation function for the output layer of the model. The sigmoid function is a nonlinear activation function that squashes all values to a range between 0 and 1, providing the probability of belonging to either the Clean or Contamination classes. We selected binary cross-entropy as the model loss function due to our task’s binary nature. The cross-entropy loss between the predicted and actual labels is calculated using the binary cross-entropy method, and the results can be either 0 or 1. The cross-entropy loss will increase if the predicted labels deviate from the actual ones. The binary cross-entropy loss is defined as follows:
Where N denotes the training samples size,
After defining the loss function, the model needs an optimization algorithm to enhance the model performance by changing the model weights and learning rate while minimizing overall loss. We employed the Adam optimizer (Kingma and Ba, 2014), a stochastic gradient descent approach that estimates the first- and second-order moments to calculate individual adaptive learning rates for different parameters. Adam is computationally efficient, has low memory demand, is invariant to diagonal rescaling of gradients, and is useful for problems with big data and parameters.
Contamination segmentation model architecture
Accurate segmentation of contaminated areas on a range of different surfaces is very important because just identifying contamination frames using the method described above does not necessarily result in finding all the contamination. Contaminated areas can be spread sporadically across the surface, and it can be challenging to identify every single area of contamination in the field of view. Organic residue and biofilms may also contaminate minute areas on a surface, making it difficult to detect even when contamination is identified in a video frame during an inspection procedure. This difficulty is why we focused on the segmentation of contaminated regions in the video frames already identified as contamination as the second aim of this study.
Segmenting and pseudo-coloring contaminated regions can make it easier for inspectors to identify and not overlook any contamination. The many different types of objects and surfaces in restaurants and kitchens can produce different background fluorescence and reflections. There may be many varying kinds of contamination present at the same time, so the combination of these can make it likely that an inspector could miss some area of contamination during an inspection. Pseudo-coloring the contaminations—in our case, green for green fluorescence and red for red fluorescence—can increase the inspector’s discrimination of contamination during monitoring. An effective model that accurately segments contaminated regions for a range of surfaces in real-time needs to be developed. The segmentation of the contamination can also be helpful for both restaurant cleaning crews and new health inspectors learning to recognize potential contamination areas and understand how to address potential sources of contamination and avoid cross-contamination during their work. This knowledge can be beneficial for assessing and improving cleaning processes and sanitation standard operating procedures (SSOPs).
In this research, instead of using traditional threshold-based algorithms to segment the contamination, we used a semantic segmentation method to conduct pixel-level classification for each frame to precisely segment contaminated regions on various surfaces. The first step requires pixel-level annotation to assign each pixel of a frame into a specific class. A deep CNN is then trained on the annotated data to classify clean, green fluorescent, and red fluorescent pixels. Later the trained model is tested on an unseen data test set to predict the pixel class. Since we are dealing with three classes in this research, the segmentation task can be considered a multi-class pixel-wise classification. We used MATLAB image labeler to label each video frame pixel to create the semantic segmentation training and testing datasets. The MATLAB image labeler provides a swift and easy way to annotate images by drawing shapes that can be assigned region of interest (ROI) labels. Our study only segmented the contamination regions on the surfaces, and the remaining pixels were labeled as background. The ground-truth-labeled pixels were categorized as background, green fluorescent, and red fluorescent.
To carry out the semantic segmentation task, we employed DeepLabv3+ (Chen et al., 2018), a state-of-the-art semantic segmentation algorithm designed by Google. Figure 4 shows how DeepLabv3+ is composed of an encoder and decoder architecture. The encoder can encode multi-scale contextual information, and the decoder module provides for a more precise and accurate recovery of object boundaries. The encoder section consisted of three key components: the ResNet architecture, Atrous convolutions, and Atrous Spatial Pyramid Pooling. The ResNet is used as the network backbone to extract the features. In this study, we used ResNet50. The Atrous convolution, also called dilated convolution, is a powerful approach in dense prediction applications. When using a deep CNN, Atrous convolution enables the model to fine-tune the resolution at which feature responses are generated. It also enables the model to efficiently expand the field of view of the filters to include more context without increasing the number of parameters and computing requirements. DeepLabv3+ also employs Atrous Spatial Pyramid Pooling (ASPP) applied on top of the extracted features from the backbone network. Parallel ASPP layers, with an increasing dilation rate, are used to aggregate multi-scale context, which can robustly segment objects while considering picture context at multiple scales. Since the contamination can be either a tiny or extensive area in this study, we used the default DeepLabv3+ dilation rate of 6. In order to acquire the final segmented mask for the input image, the output of the ASPP layers is first concatenated and then fed through a 1 × 1 convolution layer with 256 filters that generate rich semantic information.
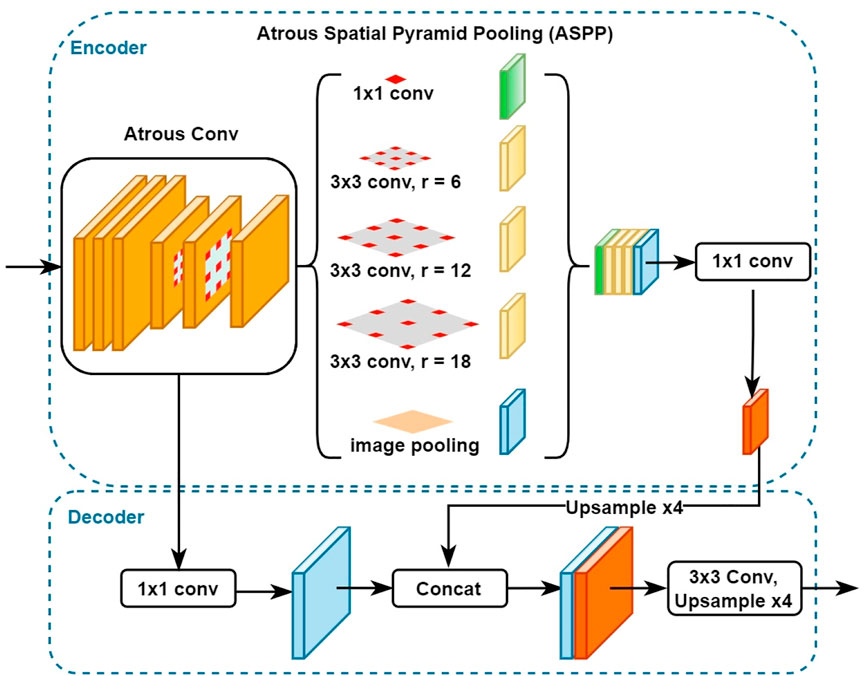
FIGURE 4. The architectures of DeepLabv3+ model.
For the decoder section, the features generated by the encoder are bilinearly upsampled by a factor of four before being concatenated with the equivalent low-level features from the network backbone that have the same spatial resolution. A 1 × 1 convolution layer is applied to the low-level features extracted by the backbone network to reduce the channel numbers and avoid outweighing the importance of the encoder features and making the training process more difficult. Finally, after concatenating the low-level features with the rich features from the encoder, a few 3 × 3 convolution layers are applied to achieve sharper segmentation, and then upsampling by a factor of 4 is performed to generate the final segmented image output.
Bacteriological methods
Strains
Four strains each of Escherichia coli, Salmonella enterica subspecies enterica, and Listeria monocytogenes were selected for the study (Supplementary Information). E. coli strains included one non-pathogenic strain (ATCC 25922 (American Type Culture Collection, Manassas, VA)), one antimicrobial-susceptible strain with few virulence factors, and two pathogenic strains (one O157:H7 strain and one multi-drug resistant strain). Salmonella strains representing four serotypes were selected: Enteritidis, Infantis, Typhimurium LT2, and Heidelberg. To represent L. monocytogenes, strains from serotypes 1/2a and 1/2b were selected, along with two hypervirulent serotype 4b strains.
Culture methods
Bacterial strains were streaked from frozen biomass onto selective agar and confirmed by transferring isolate biomass onto a panel of selective agars. E. coli was streaked on MacConkey agar (BD, Franklin Lakes, NJ) and confirmed on MacConkey agar, MacConkey agar with sorbitol, Simmons Citrate agar, and L-agar (Lennox LB Broth base with 1.5% agar; Neogen, Lansing, MI); plates were incubated at 37°C for 18–24 h. Salmonella strains were streaked onto XLT4 agar (XLT4 agar base and supplement, Neogen), incubated at 37°C, and scored at 24 and 48 h. Isolates were confirmed on XLT4, Brilliant Green, and Lennox LB agars (Neogen), which were incubated for 18–24 h at 37°C. L. monocytogenes strains were streaked on Modified Oxford agar (“MOX”, Neogen) and incubated for 48 h at 37°C, with plates scored at 24 and 48 h. Isolates were confirmed on MOX, Palcam (BD), an L. monocytogenes chromogenic agar (R&F products, Downers Grove, IL), and tryptic soy agar with yeast extract (“TSA-YE”; tryptic soy broth with 1.5% agar and 0.6% yeast extract; Neogen), and incubated for 24 h at 37°C.
For E. coli and Salmonella, biomass from L-agar (<7 days old) was transferred to L-broth (10 ml) and incubated at 37°C overnight (18–24 h). For L. monocytogenes, tryptic soy broth (10 ml) was inoculated with biomass from TSA-YE and incubated at 37°C for 48 h, with the tube caps loosened.
Disinfection
Within 1–1.5 h prior to UVC exposure, broth cultures were serially diluted in 1X Phosphate Buffered Saline, pH 7.4 (Gibco Laboratories, Gaithersburg, MD), and 100 µl of two consecutive dilutions was manually spread plated onto agar plates. For E. coli and Salmonella, 1:105 and 1:106 dilutions were plated onto L-agar. For L. monocytogenes, 1:104 and 1:105 dilutions were plated onto TSA-YE. Four replicates per set of experimental conditions were plated, along with four control plates per strain. Initial S. enterica concentrations were 1.7 × 10⁸–1.0 × 10⁹, initial E. coli concentrations were 4.6 × 10⁸–8.1 × 10⁸, and initial L. monocytogenes concentrations were 2.2 × 10⁷–5.3 × 10⁷.
Inoculated agar plates were exposed to UVC at two intensities (10 mW/cm2 or 5 mW/cm2), for durations of 1, 3, or 5 s. The distance of the light from the agar was 12 cm for the high-intensity samples and 20 cm for low-intensity samples. To ensure colonies would not be too large or crowded to count the next day, all plates were incubated first at room temperature for 2–3 h, and then at 37°C for 18–20 h for E. coli and S. enterica, and at 37°C for 48 h for L. monocytogenes, scoring at 24 and 48 h. Colony counts were performed manually. Experiments were conducted on three separate days, each focusing on one species.
Contamination detection system setup
To implement the models for classification and segmentation, we used the Keras framework as a high-level API for neural network development. We used a Tensorflow-GPU v2.7.0 backend on a GPU-enabled workstation with an NVIDIA GeForce RTXTM 3090 with 24 GB of G6X memory. We used the Windows 10 operating system.
Results
Model performance for identification between clean and contamination frames
We used two approaches for evaluation. First, we randomly chose 70% of the frames for training and 20% to validate the model for each epoch, holding out the remaining 10% of the frames to test the model performance. Secondly, we used leave-one-out cross-validation (LOOCV), but applied it to the facility level rather than the image frame level. From eight institutional kitchens and restaurants, we trained and validated our model on seven facilities, tested it on one facility, and iterated this eight times. Each facility was part of training, validation, and testing, so we could evaluate how well the model could generalize when facing a new facility and environment.
The model was trained and validated over 100 epochs, choosing categorical cross-entropy as the loss function and Adam as the model optimizer, with a learning rate of 0.0001. The model batch size, or the number of frames utilized in one iteration during the training process, was set to 32.
We evaluated the model performance using six metrics: accuracy, precision, recall, F-score, and area under the curve (AUC). The first five metrics are described in Eqs 2, 3 below:
Here TP, TN, FP, and FN represent true positive, true negative, false positive, and false negative, respectively. The accuracy shows how accurate the model is at differentiating clean and contamination frames. The precision shows what proportion of the positive samples (in our case, contamination) were identified correctly. The recall or sensitivity is the number of the true predicted positives divided by the total number of true positives and false-negative predictions and indicates the proportion of actual positive observations (contamination class) that were detected correctly. F-score is a harmonic mean of precision and recall used to evaluate model performance. We used the area under the curve (AUC) of the receiver operating characteristic (ROC) to assess the model’s ability to differentiate between clean and contamination classes.
We trained and validated the model over 100 epochs and monitored accuracy and loss, as shown in Figures 5A,B. We then applied the model to the test set. The Xception model achieved an accuracy of 98.78%, precision of 99.12%, recall of 98.47%, specificity of 98.44%, F-score of 98.80%, and AUC of 99.91%. Figure 5C shows the confusion matrix representing the model’s classification performance.
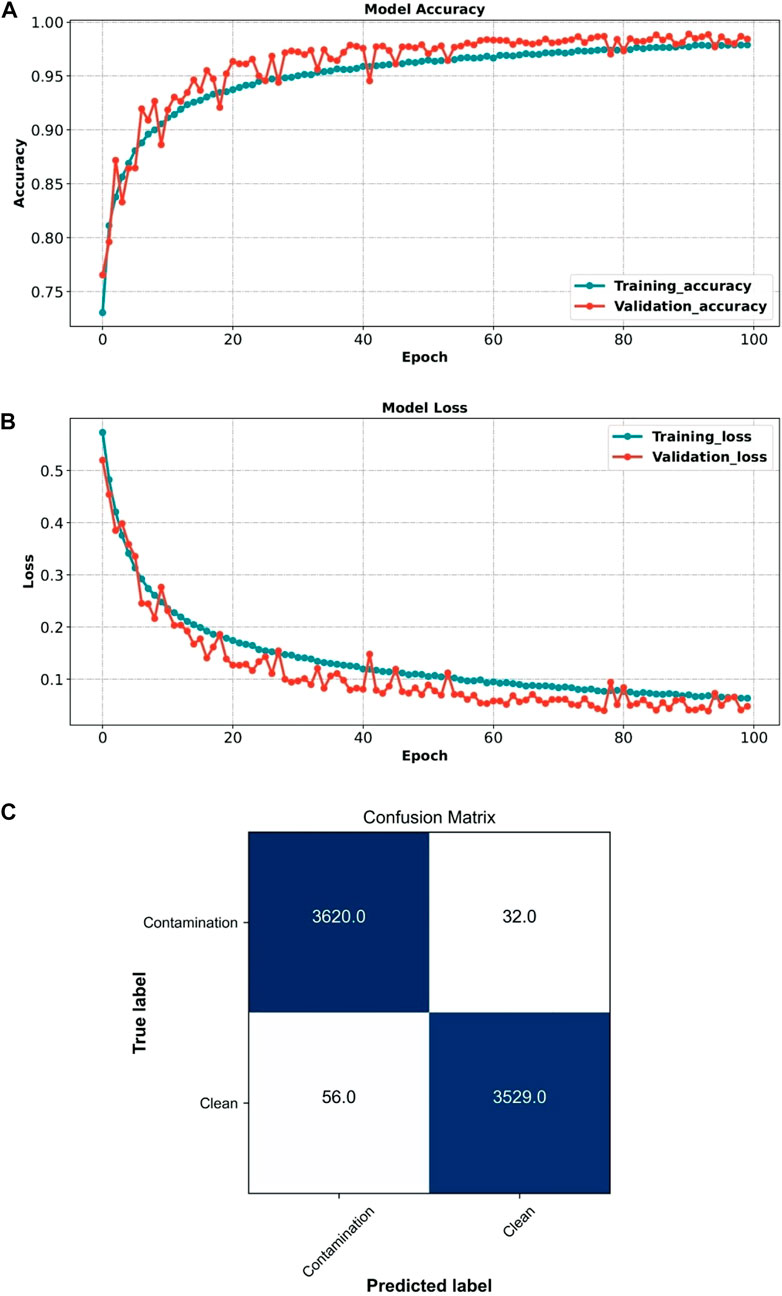
FIGURE 5. Performance of the Xception model (clean vs. contamination frames) (A) Xception model accuracy during training and validation. (B) Xception model loss during training and validation. (C) Xception model confusion matrix when applied to the test set.
Table 1 shows the results of the LOOCV approach where each time, we removed one facility from the training process, trained the model on the seven remaining facilities, and then tested on the removed facility. As expected, the lowest performances resulted when we removed either of the two facilities with the most frames (Facility No. 6 or 7). By withholding facility no. 6, 20,526 frames (28.35% of the total frames) were removed from training and validation, and similarly, by withholding facility no. 7, 17,527 frames (24.21% of the total frames) were removed from training and validation. The drop in performance from removing these facilities with relatively large numbers of frames shows that they contained meaningful information. These could include the facility architecture, ambient light, variety of the background, and a greater variety of contamination patterns, which can help the model learn more robustly.
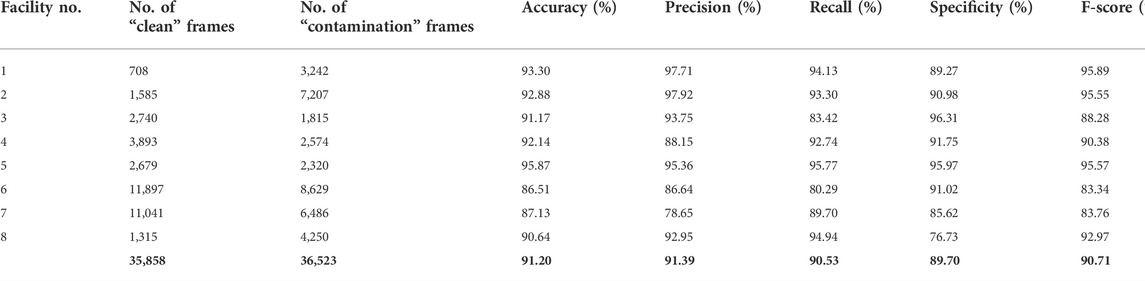
TABLE 1. The Xception model performance for differentiation between clean and contamination frames using the LOOCV approach.
Image segmentation of contamination
We used the DeepLabv3+ semantic segmentation model to identify precise areas of contamination on a variety of surfaces in 12,000 image frames that had been annotated for contamination by four experts. We used 70% of the data for training, 20% for validation, and 10% for testing, over 100 epochs. Since the task is a multi-class pixel-wise classification (background, green fluorescence, and red fluorescence), we chose categorical cross-entropy for the model loss function. We used Adam (learning rate of 0.0001) for the model optimizer and a batch size of 32.
To evaluate the DeepLabv3+ performance, we used the same metrics as for classification evaluation. However, we employed a different metric to evaluate the segmentation performance, replacing accuracy with intersection over union (IoU). Since contamination is often a tiny part of the image, accuracy is commonly greater than 99%, making it less suitable for evaluating performance. IoU, also known as the Jaccard index, quantifies the percentage overlap between the regions annotated by human experts (ground truth) and the model prediction. The following equation defines IoU:
Eq. 5 shows how we also used false positive rate (FPR) and false-negative rate (FNR) to evaluate the segmentation model performance.
The model was able to segment contamination on multiple surfaces into background, green-fluorescence, and red-fluorescence classes, with a mean IoU of 95.13%. Background IoU was 99.65%, green-fluorescence IoU 92.57%, and red-fluorescence IoU 93.18%. The model segmented contamination with 98.99% precision, 99.89% recall, 99.95% specificity, 99.89% F-score, 0.05% FPR, and 0.11% FNR.
A visual representation of how accurately our model could segment the red and green fluorescence contaminations on different surfaces shows example images from our test set selected randomly from six types of surfaces (Figure 6). CSI-D fluorescence image frames are shown in the first row, segmentation by the model in the second row, and segmentation by our human experts (ground truth) in the last row.
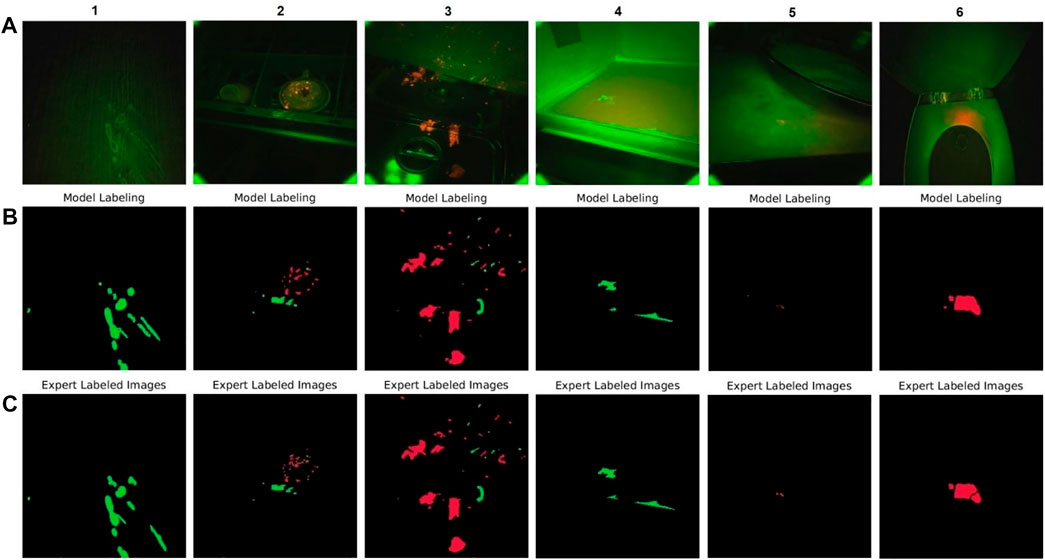
FIGURE 6. DeepLabv3+ model performance on selected test set video frames (A) CSI-D fluorescence image frames input to DeepLabv3+. (B) DeepLabv3+ segmented image output. (C) Same images segmented and labeled by human experts.
Comparing ground truth with model output shows that the model accurately segments green and red fluorescence from contamination on various surfaces, including a cabinet door, cup rack, kitchen range, microwave oven, counter-top, and toilet seat. The images show that the model can address contamination in the form of tiny droplets, sprays, splashes, and larger areas like spills or smears. They also show that the model can detect green fluorescence, red fluorescence, or red-green combinations.
Bacterial disinfection
When plated cultures of the four strains of E. coli were subjected to high intensity (10 mW/cm2) UVC for 1, 3, or 5 s, complete growth inactivation was observed. Similarly, complete inactivation was observed for all strains exposed to lower intensity (5 mW/cm2) UVC for 3 and 5 s. Some growth was observed for two strains exposed to the low-intensity UVC for 1s; however, this treatment reduced the final colony count by 90–99%.
Similar results were observed when S. enterica was exposed to UVC. Growth was completely inactivated when the Enteriditis strain was subjected to UVC under all conditions. As with the E. coli, the growth of the other three S. enterica serovars was completely inactivated under all intensity/time combinations except when exposed to low-intensity UVC for 1 s.
Complete growth inactivation was also observed for L. monocytogenes strains subjected to high-intensity UVC at all exposure durations except for strain LM3, where growth was reduced by 2.3 Logs (>99%) after 1s. As with the S. enterica and E. coli strains, at the low UVC intensity, L. monocytogenes growth was completely inactivated when exposure was 3 or 5 s, but some cells grew after the 1s exposure. Additional strain details and treatment results can be found in the Supplementary Information.
Discussion
Inspection of institutional kitchens and restaurants plays a critical role in preventing foodborne disease outbreaks. Visual inspection is the most common method for cleanliness assurance, although inspection results vary depending on the person performing the inspection’s food safety knowledge, hygiene, and diligence (Kassa et al., 2001). Because contamination may not be perceptible or due to location, low concentration, or interference by surface reflections, the inspecting person misses some areas of contamination (false negative) or identifies some areas as contaminated that are not (false positive). The impact of false positive is that would be insufficient trust that the system is cost-effective because of unnecessary recleaning or delays in the start-up of a food processing plant. The impact of false negatives would be an increase in contamination that could result in food illness outbreaks and damage to brand reputation and brand value.
This study aims to improve cleanliness assurance in institutional kitchens and restaurants by combining new imaging technology and state-of-the-art deep learning algorithms. For accurate, reliable, and speedy inspections, automated analysis of potential contamination is needed, and we have shown that deep learning-based models can swiftly identify contamination using a portable handheld scanning technology.
Using CSI-D to identify contamination in institutional kitchens and restaurants allows fast detection and immediate response to clean contaminated areas. In addition to visual inspection, swab-based methods such as adenosine triphosphate (ATP) testing are the most frequent scientific methods used to ensure environmental cleanliness in institutional kitchens and restaurants (Sanna et al., 2018). CSI-D can complement swab-based methods by providing guidance on where to swab, thereby increasing swab analysis efficiency and reducing costs and production downtime waiting for cleanliness assessment. Since CSI-D is a handheld device with automated contamination detection, it can substantially decrease person-hours and costs required for sanitization inspection.
CSI-D technology can also be used to train inexperienced health inspectors (and managers) to identify and locate contamination that is less visible to the eye during visual inspections. It is extremely important for managers to know these patterns as well so that cleaning and sanitation are done in the most efficient, effective manner. Identification of contamination on surfaces with a variety of colors or background textures can be tricky, even with fluorescence-based imaging. Sometimes the contaminated area can be a tiny area on a big surface or many contaminated spots across multiple views, which can increase risk. Materials fluoresce to varying degrees, so just looking for something glowing is insufficient; an observer must consider how the fluorescence pattern differs from the background. With deep learning and an effective and reliable detection model, CSI-D provides a precise and consistent method for detecting contamination, making the inspection process faster and more effective.
Protection from contamination for inspectors and staff while addressing sanitization issues is the goal of the CSI-D’s disinfection capability. E. coli, S. enterica, and L. monocytogenes are diverse species, and the strains tested in this study may not represent the range of within-species responses to UVC exposure. However, under laboratory-based conditions in this study, the UVC system is highly effective for inactivating these common foodborne pathogens. More work is needed to explore environments (matrices, densities, mixed populations, etc.) where food production and preparation systems encounter bacteria, and the appropriate UVC intensity/time combinations required to inactivate them.
Conclusion
This study presents a fluorescence-imaging technology combined with deep learning algorithms to capture images, identify video frames with contamination, segment the contamination in identified video frames, and disinfect organic-based residue and biofilms. We used CSI-D, a handheld fluorescence imaging device (SafetySpect Inc.), to collect data from eight institutional kitchens and restaurants. To classify “clean” and “contamination” frames, we used a state-of-the-art deep convolutional neural network architecture, Xception. Classification results for 72,381 “clean” and “contamination” frames yielded a 98.78% accuracy. To precisely segment contamination, we used a semantic segmentation algorithm, DeepLabv3+, on 12,000 “contamination” frames achieving an IoU score of 89.34%. We verified the CSI-D’s UVC disinfection ability on three foodborne illness-associated pathogens, including S. enterica, E. coli, and L. monocytogenes. All were deactivated in less than 5 s after being exposed to UVC illumination from the CSI-D, achieving log reductions of up to 8.0 for active bacteria.
We have demonstrated that fluorescence-imaging technology combined with deep learning algorithms can improve the level of safety and cleanliness, protecting staff and customers of companies and institutions in the food-service industry.
Data availability statement
The raw data supporting the conclusion of this article will be made available by the authors, without undue reservation.
Author contributions
Conceptualization, HT, JV, NM, MK, FV, AA, and KT; methodology, HT, BH, JS, JV, and KT; validation, MK, FV, AA, JQ, and KT; formal analysis, HT, JS; investigation, NM, FV, KT, and MK; resources, MK, NK, DC, and JQ; data collection, and curation, HT, JS, KH, HK; writing—original draft preparation, HT, JV, KH; writing—review and editing, NM, HT, DC, MS, BK, FV, KT, JQ, AA, and IB.; visualization, SS, and HT; supervision, KT, NM, FV, MK, and IB; project administration, FV and KT; funding acquisition, NM, FV, and KT. All authors have read and agreed to the published version of the manuscript.
Funding
This research was partially funded by the United States Department of Agriculture’s National Institute of Food and Agriculture (Grant number 2020-33610-32479) and by the North Dakota Department of Agriculture (grant number 20-340) and by the Bioscience Innovation Grant Program (BIG) (grant number 21-282).
Acknowledgments
The authors would like to thank Richard Glynn, Executive Director of the North Dakota Bioscience Association, and Jim L. Albrecht, President and Business Development Manager of ComDel Innovation, Wahpeton, ND, for their advice and support. The authors thank Patrick Marek and Joshua Magnone of the US Army Combat Capabilities Development Command for their advice and feedback on implementing CSI technology in US Army facilities. The author would also like to thank Phil Gisi, Michael Johnson, and Melanie Metz for their support and guidance and for providing access to Edgewood long-term care facilities.
Conflict of interest
FV, NM, KT, KH, HK, MS, BK, and HT owns stocks or stock options in SafetySpect Inc. FV, NM are inventors on US patent application US20210228757A1.
The remaining authors declare that the research was conducted in the absence of any commercial or financial relationships that could be construed as a potential conflict of interest.
Publisher’s note
All claims expressed in this article are solely those of the authors and do not necessarily represent those of their affiliated organizations, or those of the publisher, the editors and the reviewers. Any product that may be evaluated in this article, or claim that may be made by its manufacturer, is not guaranteed or endorsed by the publisher.
Supplementary material
The Supplementary Material for this article can be found online at: https://www.frontiersin.org/articles/10.3389/fsens.2022.977770/full#supplementary-material.
References
Agarap, A. F. (2018). Deep learning using rectified linear units (relu). arXiv preprint arXiv:1803.08375.
Bartsch, S. M., Asti, L., Nyathi, S., Spiker, M. L., and Lee, B. Y. (2018). Estimated cost to a restaurant of a foodborne illness outbreak. Public Health Rep. 133, 274–286. doi:10.1177/0033354917751129
Brand Finance (2018). Food safety 2018 [online]. Brand finance. Available: https://brandirectory.com/download-report/Food%20Safety%20Report.pdf (Accessed 07 04, 2022 2022).
Chen, H., Chen, Z., Lin, F., and Zhuang, P. (2021). Effective management for blockchain-based agri-food supply chains using deep reinforcement learning. IEeE Access 9, 36008–36018. doi:10.1109/access.2021.3062410
Chen, L.-C., Zhu, Y., Papandreou, G., Schroff, F., and Adam, H. (2018). “Encoder-decoder with atrous separable convolution for semantic image segmentation,” in Proceedings of the European conference on computer vision (ECCV)), 801–818.
Chollet, F. (2017). “Xception: Deep learning with depthwise separable convolutions,” in Proceedings of the IEEE conference on computer vision and pattern recognition), 1251–1258.
Firestone, M. J., Rajamani, S., and Hedberg, C. W. (2021). A public health informatics solution to improving food safety in restaurants: Putting the missing piece in the puzzle. Online J. Public Health Inf. 13, e5. doi:10.5210/ojphi.v13i1.11087
Food and Drug Administration, (2021). Retail food protection [online]. Available: https://www.fda.gov/food/guidance-regulation-food-and-dietary-supplements/retail-food-protection (Accessed 07 04, 2022 2022).
Gao, Z., Luo, Z., Zhang, W., Lv, Z., and Xu, Y. (2020). Deep learning application in plant stress imaging: A review. AgriEngineering 2, 430–446. doi:10.3390/agriengineering2030029
Giaouris, E., Heir, E., Hébraud, M., Chorianopoulos, N., Langsrud, S., Møretrø, T., et al. (2014). Attachment and biofilm formation by foodborne bacteria in meat processing environments: Causes, implications, role of bacterial interactions and control by alternative novel methods. Meat Sci. 97, 298–309. doi:10.1016/j.meatsci.2013.05.023
Gorji, H. T., Shahabi, S. M., Sharma, A., Tande, L. Q., Husarik, K., Qin, J., et al. (2022). Combining deep learning and fluorescence imaging to automatically identify fecal contamination on meat carcasses. Sci. Rep. 12, 1–11. doi:10.1038/s41598-022-06379-1
He, K., Zhang, X., Ren, S., and Sun, J. (2015). “Deep residual learning for image recognition,” in Proceedings of the IEEE conference on computer vision and pattern recognition), 770–778.
Hedberg, C. W. (2013). Explaining the risk of foodborne illness associated with restaurants: The environmental health specialists network (ehs-net). J. food Prot. 76, 2124–2125. doi:10.4315/0362-028x.jfp-13-270
Hochreiter, S. (1998). The vanishing gradient problem during learning recurrent neural nets and problem solutions. Int. J. Unc. Fuzz. Knowl. Based. Syst. 6, 107–116. doi:10.1142/s0218488598000094
Ioffe, S., and Szegedy, C. (2015). “Batch normalization: Accelerating deep network training by reducing internal covariate shift,” in International conference on machine learning: PMLR), 448–456.
Jackson, L. A., Keene, W. E., Mcanulty, J. M., Alexander, E. R., Diermayer, M., Davis, M. A., et al. (2000). Where's the beef?: The role of cross-contamination in 4 chain restaurant–associated outbreaks of Escherichia coli O157: H7 in the pacific northwest. Arch. Intern. Med. 160, 2380–2385. doi:10.1001/archinte.160.15.2380
Jun, W., Kim, M. S., Cho, B.-K., Millner, P. D., Chao, K., and Chan, D. E. (2010). Microbial biofilm detection on food contact surfaces by macro-scale fluorescence imaging. J. food Eng. 99, 314–322. doi:10.1016/j.jfoodeng.2010.03.005
Kassa, H., Harrington, B., Bisesi, M., and Khuder, S. (2001). Comparisons of microbiological evaluations of selected kitchen areas with visual inspections for preventing potential risk of foodborne outbreaks in food service operations. J. Food Prot. 64, 509–513. doi:10.4315/0362-028x-64.4.509
Kingma, D. P., and Ba, J. (2014). Adam: A method for stochastic optimization. arXiv preprint arXiv:1412.6980.
Li, Z., Liu, F., Yang, W., Peng, S., and Zhou, J. (2021). A survey of convolutional neural networks: Analysis, applications, and prospects. IEEE Trans. Neural Netw. Learn. Syst., 1–21. doi:10.1109/tnnls.2021.3084827
Nayak, J., Vakula, K., Dinesh, P., Naik, B., and Pelusi, D. (2020). Intelligent food processing: Journey from artificial neural network to deep learning. Comput. Sci. Rev. 38, 100297. doi:10.1016/j.cosrev.2020.100297
Pouladzadeh, P., Kuhad, P., Peddi, S. V. B., Yassine, A., and Shirmohammadi, S. (2016). “Food calorie measurement using deep learning neural network,” in 2016 IEEE international instrumentation and measurement technology conference proceedings: IEEE) (IEEE), 1–6.
Rezaee, K., Badiei, A., and Meshgini, S. (2020). “A hybrid deep transfer learning based approach for COVID-19 classification in chest X-ray images,” in 2020 27th National and 5th International Iranian Conference on Biomedical Engineering (ICBME): IEEE) (IEEE), 234–241.
Rezaee, K., Savarkar, S., Yu, X., and Zhang, J. (2022). A hybrid deep transfer learning-based approach for Parkinson's disease classification in surface electromyography signals. Biomed. Signal Process. Control 71, 103161. doi:10.1016/j.bspc.2021.103161
Ribani, R., and Marengoni, M. (2019). “A survey of transfer learning for convolutional neural networks,” in 2019 32nd SIBGRAPI Conference on Graphics, Patterns and Images Tutorials (SIBGRAPI-T): IEEE), (IEEE), 47–57.
Sanna, T., Dallolio, L., Raggi, A., Mazzetti, M., Lorusso, G., Zanni, A., et al. (2018). ATP bioluminescence assay for evaluating cleaning practices in operating theatres: Applicability and limitations. BMC Infect. Dis. 18, 583–587. doi:10.1186/s12879-018-3505-y
Seo, S., Jang, S. S., Miao, L., Almanza, B., and Behnke, C. (2013). The impact of food safety events on the value of food-related firms: An event study approach. Int. J. Hosp. Manag. 33, 153–165. doi:10.1016/j.ijhm.2012.07.008
Seo, Y., Lee, H., Mo, C., Kim, M. S., Baek, I., Lee, J., et al. (2019). Multispectral fluorescence imaging technique for on-line inspection of fecal residues on poultry carcasses. Sensors 19, 3483. doi:10.3390/s19163483
Shi, Y., Wang, X., Borhan, M. S., Young, J., Newman, D., Berg, E., et al. (2021). A review on meat quality evaluation methods based on non-destructive computer vision and artificial intelligence technologies. Food Sci. Anim. Resour. 41, 563–588. doi:10.5851/kosfa.2021.e25
Sikorska, E., Khmelinskii, I., and Sikorski, M. (2019). “Fluorescence spectroscopy and imaging instruments for food quality evaluation,” in Evaluation technologies for food quality (Elsevier), 491–533.
Sueker, M., Stromsodt, K., Gorji, H. T., Vasefi, F., Khan, N., Schmit, T., et al. (2021). Handheld multispectral fluorescence imaging system to detect and disinfect surface contamination. Sensors 21, 7222. doi:10.3390/s21217222
Szegedy, C., Liu, W., Jia, Y., Sermanet, P., Reed, S., Anguelov, D., et al. (2015). “Going deeper with convolutions,” in Proceedings of the IEEE conference on computer vision and pattern recognition (IEEE), 1–9.
Taheri Gorji, H., and Kaabouch, N. (2019). A deep learning approach for diagnosis of mild cognitive impairment based on MRI images. Brain Sci. 9, 217. doi:10.3390/brainsci9090217
Valeur, B., and Berberan-Santos, M. N. (2012). Molecular fluorescence: Principles and applications. John Wiley & Sons.
Verran, J., Redfern, J., Smith, L., and Whitehead, K. (2010). A critical evaluation of sampling methods used for assessing microorganisms on surfaces. Food Bioprod. Process. 88, 335–340. doi:10.1016/j.fbp.2010.09.011
Weinstein, J. (1991). The clean restaurant. II: Employee hygiene. Restaur. Inst. 101, 138. 9, 142, 144 passim, 142, 144 passim.
Zhou, L., Zhang, C., Liu, F., Qiu, Z., and He, Y. (2019). Application of deep learning in food: A review. Compr. Rev. Food Sci. Food Saf. 18, 1793–1811. doi:10.1111/1541-4337.12492
Zhu, L., Spachos, P., Pensini, E., and Plataniotis, K. N. (2021). Deep learning and machine vision for food processing: A survey. Curr. Res. Food Sci. 4, 233–249. doi:10.1016/j.crfs.2021.03.009
Keywords: deep learning, semantic segmentation, fluorescence imaging, contamination detection, food service industry
Citation: Gorji HT, Van Kessel JAS, Haley BJ, Husarik K, Sonnier J, Shahabi SM, Zadeh HK, Chan DE, Qin J, Baek I, Kim MS, Akhbardeh A, Sohrabi M, Kerge B, MacKinnon N, Vasefi F and Tavakolian K (2022) Deep learning and multiwavelength fluorescence imaging for cleanliness assessment and disinfection in Food Services. Front. Sens. 3:977770. doi: 10.3389/fsens.2022.977770
Received: 24 June 2022; Accepted: 22 August 2022;
Published: 22 September 2022.
Edited by:
Pedro Rodríguez-López, Spanish National Research Council (CSIC), SpainReviewed by:
Christopher James Harrison, Swinburne University of Technology, AustraliaChristian Bur, Saarland University, Germany
Michael Wiederoder, Combat Capabilities Development Command United States Army, United States
Copyright © 2022 Gorji, Van Kessel, Haley, Husarik, Sonnier, Shahabi, Zadeh, Chan, Qin, Baek, Kim, Akhbardeh, Sohrabi, Kerge, MacKinnon, Vasefi and Tavakolian. This is an open-access article distributed under the terms of the Creative Commons Attribution License (CC BY). The use, distribution or reproduction in other forums is permitted, provided the original author(s) and the copyright owner(s) are credited and that the original publication in this journal is cited, in accordance with accepted academic practice. No use, distribution or reproduction is permitted which does not comply with these terms.
*Correspondence: Kouhyar Tavakolian, a291aHlhckB1bmQuZWR1