 Sebastian Preusser1*
 Patrick Liebmann2
 Andres Stucke1
 Johannes Wirsching1
 Karolin Müller1,3
 Robert Mikutta4
 Georg Guggenberger2
 Axel Don5
 Karsten Kalbitz6
 Jörg Bachmann2
 Sven Marhan1
 Christian Poll1
 Ellen Kandeler1
- 1University of Hohenheim, Institute of Soil Science and Land Evaluation, Soil Biology, Stuttgart, Germany
- 2Leibniz Universität Hannover, Institute of Soil Science, Hannover, Germany
- 3Institute for Crop and Soil Science, Julius Kühn-Institut (JKI), Braunschweig, Germany
- 4Martin Luther University Halle-Wittenberg, Soil Science and Soil Protection, Halle (Saale), Germany
- 5Thünen Institute of Climate-Smart Agriculture, Braunschweig, Germany
- 6Technische Universität Dresden, Institute of Soil Science and Site Ecology, Tharandt, Germany
Litter-derived dissolved organic carbon (DOC) is considered to be a major source of stabilised C in soil. Here we investigated the microbial utilisation of litter-derived DOC within an entire soil profile using a stable isotope labelling experiment in a temperate beech forest. The natural litter layer of a Dystric Cambisol was replaced by 13C enriched litter within three areas of each 6.57 m−2 for 22 months and then replaced again by natural litter (switching-off the 13C input). Samples were taken continuously from 0 to 180 cm depths directly after the replacement of the labelled litter, and 6 and 18 months thereafter. We followed the pulse of 13C derived from aboveground litter into soil microorganisms through depth and over time by analysing 13C incorporation into microbial biomass and phospholipid fatty acids. Throughout the sampling period, most of the litter-derived microbial C was found in the top cm of the profile and only minor quantities were translocated to deeper soil. The microbial 13C stocks below 30 cm soil depth at the different samplings accounted constantly for only 6–12% of the respective microbial 13C stocks of the entire profile. The peak in proportional enrichment of 13C in subsoil microorganisms moved from upper (≤ 80 cm soil depth) to lower subsoil (80–160 cm soil depth) within a period of 6 months after switch-off, and nearly disappeared in microbial biomass after 18 months (< 1%), indicating little long-term utilisation of litter-derived C by subsoil microorganisms. Among the different microbial groups, a higher maximum proportion of litter-derived C was found in fungi (up to 6%) than in bacteria (2%), indicating greater fungal than bacterial dependency on litter-derived C in subsoil. However, in contrast to topsoil, fungi in subsoil had only a temporarily restricted increase in litter C incorporation, while in the Gram-positive bacteria, the C incorporation in subsoil raised moderately over time increasingly contributing to the group-specific C stock of the entire profile (up to 9%). Overall, this study demonstrated that microorganisms in topsoil of a Dystric Cambisol process most of the recently deposited aboveground litter C, while microbial litter-derived C assimilation in subsoil is low.
Introduction
Dissolved organic carbon (DOC) is the most bioavailable and mobile soil organic carbon (SOC) fraction within the entire soil profile and a major C source in subsoil (1). Dissolved OC in forest soils originates mainly from the organic layer, is relocated within the soil profile by percolating soil water, and becomes partially immobilised in mineral soil horizons. With passage through the soil profile, both the concentration of DOC decreases and its composition changes to lower proportions of labile C compounds (2). The highest concentrations of DOC are generally found directly below the O horizon, decreasing steeply with increasing depth in most soils. Michalzik et al. (3) reported net reductions of up to 90% in DOC concentration in the first metre of the soil profile. Major processes contributing to DOC dynamics within soil profiles are temporal and selective immobilisation (sorption, co-precipitation) as well as repeated microbial processing and re-mobilisation (desorption, dissolution) of the organic compounds (4–6). However, the contribution of microbial DOC retention to the SOC pool within the soil profile is as yet poorly understood (7).
The activity of soil microorganisms strongly affects DOC dynamics within the soil profile. During passage through the soil, large proportions of DOC are consumed by microorganisms for anabolic and catabolic processes, contributing to a continuous decrease in DOC concentration in the soil solution with increasing depth (8). The preferential microbial utilisation of easily assimilable OC compounds, as well as preferential sorptive retention of lignin-derived polymeric molecules, alters DOC composition and leads to an increase in proportions of more complex and microbially-derived OC compounds from topsoil to subsoil (5, 9, 10). However, not only does microbial activity change the quantity and composition of DOC as soil depth increases, but, in turn, changes in DOC concentration and properties also affect microbial community biomass, composition, and activity. The considerably lower microbial biomass in subsoil than in topsoil is largely related to the generally steep decline in available SOC with increasing soil depth (11). The typically heterogeneous distribution of microbial biomass in subsoil further reflects increasing spatial and seasonal heterogeneity in DOC fluxes with increasing soil depth (e.g., preferential flow paths vs. matric soil), with resulting greater variability in microbially available SOC (12).
Besides abiotic factors such as bulk density and water content, changes in microbial community composition with soil depth are mainly attributable to changes in the composition of SOC and associated microbial group-specific feeding strategies (13, 14). A large portion of the microbial communities inhabiting near-surface environments are adapted for rapid metabolism of labile OC compounds (e.g., root exudates and/or recent litter-derived C); these communities have proportionally high abundances of fungi and Gram-negative bacteria (11). Along with a decrease in the availability of more labile C sources with soil depth, the microbial communities shift towards an increasing proportion of microorganisms with low metabolic activity. These microorganisms are better adapted to resource-limited conditions, feed on previously processed C sources, and are predominantly found among Gram-positive bacteria (15, 16). The small proportion of labile SOC, facilitated by mineral-organic interactions, and the concomitant low metabolic activity of microbial communities in deeper soil depth is reflected in greatly reduced turnover rates and greater stability of subsoil C as indicated by radiocarbon ages of up to several thousand years (17, 18). The C sequestration potential of soils is further affected by the fungal:bacterial ratio, whereby enhanced C storage has been related to a greater abundance of fungi (19). Although still under debate, this relationship between prolonged and increased C storage and higher fungal abundance is thought to be attributable to higher carbon use efficiency (CUE), more recalcitrant necromass, and longer C residence time in the living biomass of fungi than of bacteria (20, 21). While the actual residence time of C in bacteria is estimated to range from days to weeks, in fungi it is on the scale of months (22, 23).
All these results have most often been obtained through separate studies of top- and subsoils, and have not considered the temporal dynamics of DOC downward migration within entire soil profiles (12). More specifically, we are not aware of studies comprehensively investigating the dynamics of microbial DOC utilisation during DOC transport through soil profiles. The aim of our experiment was thus to determine the allocation and incorporation of litter-derived DOC in different C pools throughout an entire soil profile. Whereas, Liebmann et al. (24) characterised the fate of the litter-derived C in chemical pools of OM (e.g., particulate and mineral-associated OM), in the present study we focused primarily on the extent and persistence of microbial utilisation of litter-derived C across depths and over time. More specifically, we investigated the respective roles of different microbial groups (bacteria and fungi) in this process. We tested the following hypotheses: (1) Litter-derived C is largely retained in the upper centimetres of the soil profile due to an active microbial community in near surface soil horizons; (2) A small quantity of litter-derived as well as microbially processed C migrates into deeper soil horizons and acts as an important C source for the local microbial community; (3) Bacteria and fungi in subsoil differ in their C utilisation patterns, with a longer C persistence in fungi than in bacteria. To address these hypotheses, we conducted a plot-scale stable isotope labelling experiment where the natural litter layer of a temperate beech forest was temporarily replaced by 13C-labelled litter for a period of 22 months. The labelled litter was then replaced by the natural litter, and soil samples were taken from 0 to 180 cm soil depths immediately after replacement of the labelled litter, and 6 and 18 months thereafter. By 13C analyses of microbial biomass (13Cmic) and phospholipid fatty acids (13C-PLFA) we followed the incorporation and persistence of the labelled litter-derived C into the different microbial C pools across depth and over time.
Materials and Methods
Site Description
The experiment was conducted in a ~100-year old European beech (Fagus sylvatica L.) forest 40 km northwest of Hannover in Lower Saxony, Germany (Grinderwald; 52° 34' 22” N, 9° 18' 51” E; 100 m.a.s.l.). Besides the stand-forming European beech, the Grinderwald site has only few other vegetation and little understory. The climate is temperate and humid with mean annual temperature and precipitation for the period from 1981 to 2010 of 9.7°C and 762 mm, respectively (data obtained from the closest German Meteorological Service weather station in Nienburg/Weser). During the experimental period, precipitation was measured by a local weather station directly at the experimental site (Supplementary Figure 1). Soil parent materials are fluvial and aeolian deposits from the Saale glaciation (25). The soil has been classified as an acid and sandy Dystric Cambisol (26) and pH values increased from 3.3 in topsoil to 4.5 in subsoil. Podsolization characteristics within the soil profile are only weakly expressed or absent. The predominant humus form is moder, and mean proportions of sand, silt, and clay are 77.2, 18.4, and 4.4%, respectively. During the establishment of the soil observatories and the various soil samplings we did not observe any signs of bioturbation by earthworms in the acidic soil of the Grinderwald. Additional soil properties of the Grinderwald site are listed in Supplementary Table 1 [adopted from Preusser et al. (27)].
Soil Observatories
Three subsoil observatories were installed on the study site (12). The soil observatories are circular polyethylene shafts of diameter 150 cm, providing access to each undisturbed soil profile to a depth of 200 cm. Each soil observatory is equipped with soil moisture probes to continuously measure the volumetric water content at 10, 30, 50, 90, 150, and 180 cm soil depths within the undisturbed soil profiles (Supplementary Figure 1).
Experimental Design
In January 2015, the original litter layer, in circular areas surrounding the three soil observatories, each with a radius of 150 cm, was removed. Following removal of the natural litter, 13C-labelled beech leaf litter was applied to one half and non-labelled litter to the other half (each 6.57 m−2) of the surface area surrounding each soil observatory, in consideration of the initial litter amount (275 g per m−2) and thickness (Figure 1). The applied 13C-labelled beech leaf litter was prepared by mixing highly labelled litter (10 atom-%; provided by IsoLife B.V., Wageningen, The Netherlands) with unlabelled litter, achieving a final δ13C enrichment of 1,241‰ at observatory I and 1,880‰ at observatories II and III (δ13C differences were due to restrictions in litter production capacity). To avoid windblown dispersal, the applied litter was covered with coarse mesh nets. After 22 months of field exposure (November 2016), the enriched litter was replaced by non-labelled litter originating from the study site (switch-off). This exchange allowed us to follow the persistence of the temporally distinct 13C signal in the different C pools within the soil profile.
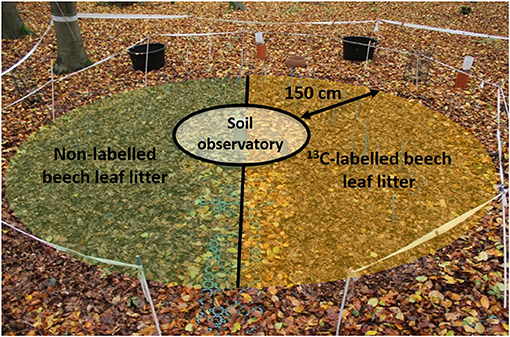
Figure 1. Top view on the experimental area with 13C-labelled beech leaf litter on one half (yellow) and non-labelled litter on the other half (green) of the area surrounding each of the three accessible soil observatories (Ø 150 cm). The experimental areas directly adjacent to the soil observatories have a radius of 150 cm.
Soil Sampling and Preparation
In total, three sampling campaigns were carried out, with the first sampling the day of the labelled litter replacement with non-labelled litter (November 2016), the second one 6 months (May 2017), and the third one 18 months (May 2018) later. At the first and third samplings, three replicate soil samples on each side of the circle (with 13C-labelled litter and non-labelled litter) were taken from 0 to 180 cm soil depths by percussion drilling at the three soil observatories. Each of the obtained soil cores was divided into 15 subsamples (0–5, 5–10, 10–20, 20–30, 30–40, 40–50, 50–60, 60–70, 70–80, 80–90, 90–100, 100–120, 120–140, 140–160, and 160–180 cm soil depth) and mixed with the respective subsamples of the two other soil cores taken from the same side of the soil observatory. Due to limitations in surface area around the observatories (avoidance of soil compaction and damage to the installed soil probes), the second soil sampling was only possible by vertical sampling of six depth increments, from the soil surface down to 50 cm soil depth and by horizontal sampling at discrete depths of 60–70, 80–90, and 140–160 cm from the inner wall of the soil observatories using a drill rod. Sample partitioning and number of replicates were analogous to the two other soil samplings. This resulted in a total number of 90 samples (15 depth levels × 3 observatories × 2 litter treatments) at the first and third sampling date each, and of 54 samples (9 depth levels × 3 observatories × 2 litter treatments) at the second sampling date. All samples were sieved <2 mm immediately after sampling to remove larger particles. On one aliquot the gravimetric water content of the samples was determined, while the other aliquot was frozen at −23°C until further analysis.
Soil Organic C
The labelled litter-derived SOC stocks (g labelled litter C m−2) were calculated for each sampling date based on the concentration of labelled litter-derived C (ng g−1 dry soil) and the depth-specific bulk density (data not shown) for each depth increment of the soil profile. The stocks for the missing depth increments at the second sampling were interpolated based on the respective stocks above and below.
SOC data for the first and third sampling dates was obtained from Liebmann et al. (24). To determine the SOC at the second sampling date, 0.3 g of each soil sample was dried at 60°C for 72 h and ground with a ball mill. Subsamples of 15–25 mg each were weighed into tin capsules and measured for total SOC and isotopic composition by dry combustion using an elemental analyzer (EA, Euro EA 3000, Euro Vector, Milan, Italy) coupled with an isotope ratio mass spectrometer (IRMS, Delta Plus XP, Thermo Finnigan MAT, Bremen, Germany) as described by Müller et al. (28).
The calculation of labelled litter-derived C (%) was done using the following equation:
where δsample is the δ13C value of the respective sample, δreference is the δ13C mean value of the respective non-13C-addition samples, δlitter is the average δ13C value of the applied beech leaf litter and δsoil is the average δ13C value of the respective soil depth.
The concentration of labelled litter-derived C (ng g−1 dry soil) was calculated based on the proportion of labelled litter C to total SOC.
Microbial Biomass C and Extractable Organic C
Microbial biomass C (Cmic) was determined using the chloroform fumigation extraction (CFE) method of Vance et al. (29). In brief, 10 g of each soil sample was fumigated with ethanol-free chloroform for 24 h to release Cmic. After removing the chloroform, 40 ml of 0.025 M K2SO4 solution was added to each of the subsamples, which were then shaken for 30 min on a horizontal shaker at 250 rev min−1 and centrifuged for 30 min at 4,420 × g. A second 10 g subsample of each soil sample was treated similarly but without fumigation to determine extractable organic C (EOC). The measurement of organic C in the clear supernatants of both fumigated and non-fumigated subsamples was conducted on a TOC-TNb Analyzer Multi-N/C 2100S (Analytik Jena, Jena, Germany) as described by Marhan et al. (30). The Cmic content was calculated by subtraction of the C content of the non-fumigated sample from the C content of the corresponding fumigated sample using a kEC factor of 0.45 (31). The EOC content was calculated based on the non-fumigated samples only. For δ13C determination in Cmic, 10 ml of the fumigated and non-fumigated extracts were evaporated at 60°C in a rotatory evaporator (RVC 2-25, Martin Christ, Osterode am Harz, Germany). The residues were ground and weighed into tin capsules with minimum 10 mg C per sample and measured for isotopic composition as described above.
The calculation of δ13C of the microbial biomass was done as described by Marhan et al. (30) using the following equation:
where Cf and Cnf are extracted organic C content (μg C g−1 dry soil) of the fumigated and non-fumigated samples and δf and δnf are the corresponding δ13C values.
Calculation of the percentage (%), content (ng g−1 dry soil), and stocks (g m−2) of labelled litter-derived C in Cmic and EOC was done as described for SOC.
Phospholipid Fatty Acid Analyses
For lipid extraction and fractionation according to the method of Frostegård et al. (32), four g field-moist topsoil (0–20 cm soil depth) and 2 × 12 g field-moist subsoil (20–180 cm soil depth) were used. The two replicates of each subsoil depth increment were combined before fractionation. In brief, the phospholipid fatty acids (PLFAs) were transformed into fatty acid methyl esters (FAMEs) using alkaline methanolysis as described by Kramer et al. (33). The resulting FAMEs were measured using an AutoSystem XL gas chromatograph (Perkin-Elmer, Norwalk, CT, USA) equipped with a capillary column HP-5 (crosslinked 5% phenyl methyl siloxane; 50 m × 0.2 mm, film thickness of 0.33 μm) and a flame ionisation detector. Identification of FAMEs was based on their retention time assessed with a fatty acid methyl ester- and a bacterial acid methyl ester-mix (Sigma-Aldrich, St. Louis, MO, USA). Quantification was calculated with an internal fatty acid methyl ester-standard (Sigma-Aldrich, St. Louis, MO, USA) which was added to the samples before methanolysis. The abundances of individual FAMEs were expressed in nmol g−1 dry soil. Following Kandeler et al. (34), Frostegård and Bååth (35), and Zelles (36), the fatty acids i15:0, a15:0, i16:0, 16:1ω7, i17:0, cy17:0, 18:1ω7, and cy19:0 were considered bacterial PLFAs (PLFAbac). Of these, i15:0, a15:0, i16:0, and i17:0 represented Gram-positive bacteria (PLFAGram+) and cy17:0 and cy19:0 represented Gram-negative bacteria (PLFAGram−) The PLFA 18:2ω6,9 was considered as fungal-derived (PLFAfun) (37).
The δ13CPLFA values were determined with an HP 6,890 gas chromatograph (Agilent Inc., Santa Clara, CA, USA) coupled with a combustion III Interface (Thermo Finnigan, Waltham, MA, USA) to a Delta Plus XP mass spectrometer (Thermo Finnigan MAT, Bremen, Germany) as described by Müller et al. (28). The δ13C values of all FAMEs were corrected for the addition of a methyl group by using a mass balance equation (38). The methanol used for methylation had a δ13C value of −40.23 ‰. Calculation of labelled litter-derived C (%) was done as described for SOC. Mean labelled litter-derived C (%) in the different microbial groups was calculated according to the relative proportions of the respective fatty acids to the total of the microbial group-associated fatty acids. The content of labelled litter-derived C (ng g−1 dry soil) incorporated into the different microbial groups was determined based on the relative proportion of labelled litter-derived C to the total C of the group-specific fatty acids and the molecular weight of C (12.011 g mol−1). Calculations of microbial group-specific labelled litter-derived C stocks (g m−2) were done as described for SOC.
Statistical Analyses
The effects of sampling date, soil depth, and their interactions on the variables SOC, EOC, Cmic, PLFA, and on the relative and absolute labelled leaf litter-derived C incorporation into SOC (SO13C), EOC (EO13C), Cmic (13Cmic), and PLFAs (13C-PLFA) were performed in SAS Version 9.4 (SAS Institute Inc., Cary, NC, 2016) using the GLIMMIX procedure for mixed linear models. Due to the experimental design, observatory was set as random factor. Significance was tested at p < 0.05 in all cases.
Results
Soil Organic Carbon and Contribution of Litter-Derived 13C
SOC content was highest in 0–5 cm soil depth at all sampling dates (up to 95.3 mg g−1 dry soil) and steeply decreased with increasing soil depth to a lowest value of 0.2 mg g−1 dry soil in the 160–180 cm soil depth; SOC content differed slightly by sampling date (date × depth; F = 7.40, p < 0.001; Supplementary Figure 2A).
The depth gradient was more pronounced for the content of labelled litter-derived C, which decreased sharply from the topsoil to the subsoil (Supplementary Figure 2B). Litter-derived 13C concentration did not exceed 1.8 μg g−1 dry soil below 30 cm soil depth, but did slightly increase below 60 cm soil depth at the second compared to the first sampling (date × depth; F = 2.08, p < 0.05). The overall lowest content of litter-derived C in SOC was observed at the third sampling.
The total SO13C stock within the soil profile decreased from the first to the third sampling from a mean of 17.7 g to 3.25 g m−2, respectively (Figure 2A). Over time, most of the litter-derived 13C was retained in the top 5 cm (from 55.3 to 82.2% of total retained labelled litter C) followed by 5–30 cm soil depth (from 14.3 to 38.3%) and the subsoil below 30 cm (from 3.5 to 6.5%). At the third sampling, the highest proportion of the initially litter-derived SO13C stock measured at the first sampling was found in 5–30 cm (49.2%) followed by the subsoil below 30 cm (33.7%) and the top 5 cm (12.4%) (Figure 3A).
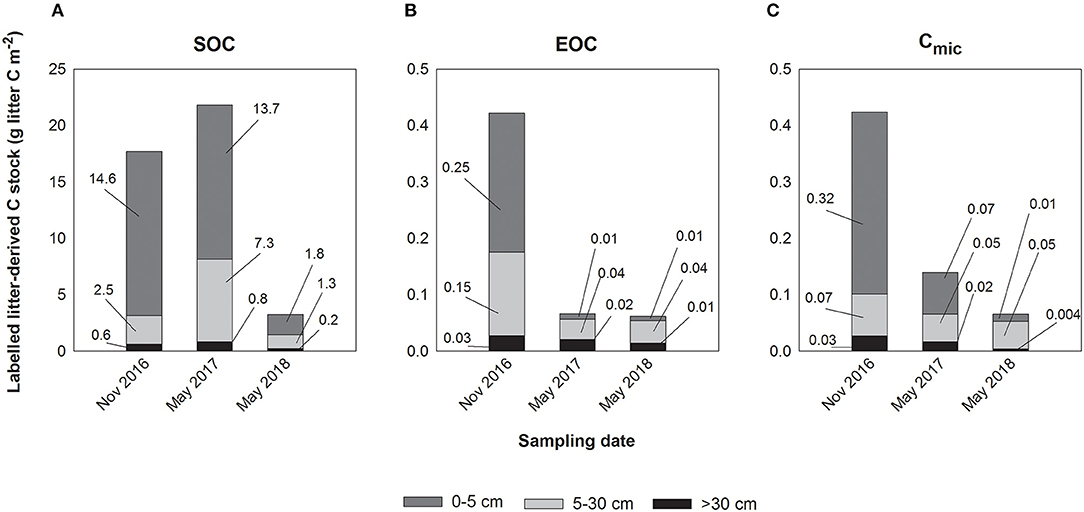
Figure 2. (A) Mean litter-derived C stocks (g litter C m−2) in soil organic carbon (SOC) of the depth increments 0–5 cm, 5–30 cm, and below 30 cm soil depth for the sampling dates November 2016 (first sampling), May 2017 (second sampling), and May 2018 (third sampling). (B) Mean litter-derived C stocks (g litter C m−2) in extractable organic carbon (EOC) of the depth increments 0–5 cm, 5–30 cm, and below 30 cm soil depth for the sampling dates November 2016 (first sampling), May 2017 (second sampling), and May 2018 (third sampling). (C) Mean litter-derived C stocks (g litter C m−2) in microbial biomass (Cmic) of the depth increments 0–5 cm, 5–30 cm, and below 30 cm soil depth for the sampling dates November 2016 (first sampling), May 2017 (second sampling), and May 2018 (third sampling).
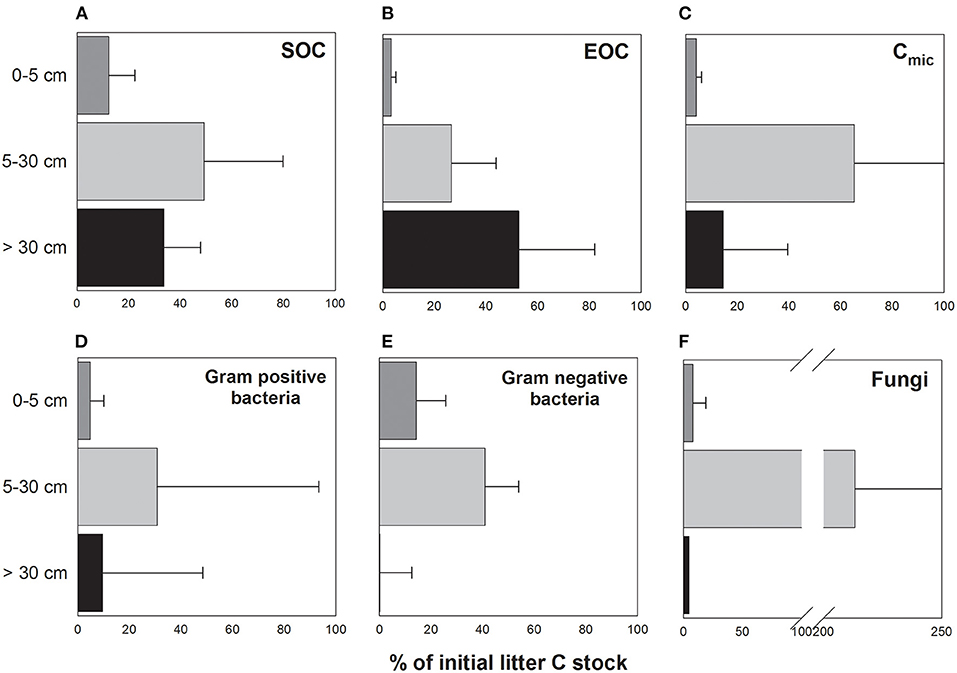
Figure 3. Relative proportion (%) of the litter-derived C stocks in (A) SOC, (B) EOC, (C) Cmic, (D) Gram-positive bacteria, (E) Gram-negative bacteria, and (F) fungi of the depth increments 0–5 cm, 5–30 cm, and below 30 cm soil depth at the sampling date in May 2018 (third sampling) in relation to the respective litter-derived C stocks in November 2016 (first sampling). Error bars indicate standard error (n = 3).
The negligible importance of the litter-derived C for SOC stocks in the different depths was indicated by the proportion (%) of labelled litter-derived C, which was highest (up to 0.5%) in 0–5 cm soil depth at each sampling date (Supplementary Figure 2C). With increasing soil depth, the relative proportion of litter-derived C generally decreased, although to a lesser extent than for content of litter-derived C. Maximum values in the subsoil (below 30 cm soil depth) were slightly higher at the second than at the first sampling (date: F = 5.44, p < 0.01; depth: F = 3.34, p < 0.01). The third sampling had overall the smallest proportion of litter-derived C within the entire soil profile (max. 0.1%).
Extractable Organic Carbon and Contribution of Litter-Derived 13C
EOC decreased sharply from the topsoil (max. 244.6 μg g−1 dry soil in 0–5 cm soil depth) to the subsoil (min. 2.9 μg g−1 dry soil in 80–90 cm soil depth) and varied between the three sampling dates with the most pronounced seasonal variations at shallower soil depths (date × depth; F = 20.13, p < 0.001; Supplementary Figure 3A).
Labelled litter-derived C in EOC substantially declined from the topsoil (max. 4.9 μg g−1 dry soil) to the subsoil (≤ 0.1 μg g−1 dry soil below 30 cm soil depth) at the first sampling date. At the second and third samplings, litter-derived C declined strongly (max. 0.25 μg g−1 dry soil) in the topsoil, but remained relatively unchanged in the subsoil (date × depth; F = 18.18, p < 0.001; Supplementary Figure 3B).
In contrast to the total SO13C stocks, total EO13C stocks were more evenly distributed within the top 30 cm (0–5 cm: 58.4%, 5–30 cm: 35.1%) and contributed most to the total EOC while the subsoil below 30 cm soil depth contributed only 6.5% at the first sampling (Figure 2B). Total EO13C stocks at the second and third sampling were similar to one another but considerably lower than at the first sampling, with a stronger reduction in the top 5 cm than in deeper soil depth. Comparing the EO13C stocks at the third with those at the first sampling indicated a proportional increase with soil depth from 3.3% in the top 5 cm to 52.7% below 30 cm soil depth (Figure 3B).
The proportion (%) of labelled litter-derived C in EOC was generally highest in the topsoil, although it decreased over time (date × depth; F = 14.53, p < 0.001; Supplementary Figure 3C). In contrast, in the subsoil the largest contribution of labelled litter-derived C to EOC was measured at the second sampling.
Microbial Biomass and Contribution of Litter-Derived 13C
Microbial biomass steeply decreased with increasing soil depth at all sampling dates and showed substantial seasonal variation in the three samplings, especially in the topsoil samples (date × depth; F = 4.31, p < 0.001; Supplementary Figure 4A).
Concentration of labelled litter-derived Cmic was highest in the topsoil (max. 6.4 μg g−1 dry soil in 0–5 cm soil depth) and steeply decreased with soil depth at the first sampling. Over time, it decreased steeply in top- and subsoil (date × depth; F = 4.96, p < 0.001; Supplementary Figure 4B), although the decrease in the topsoil was less pronounced than for EOC.
The labelled litter-derived Cmic stocks of the entire soil profile decreased from 0.42 g litter C m−2 at the first sampling to 0.06 g litter C m−2 at the third sampling, but again at a slower rate than for EOC (Figure 2C). In contrast to EOC, the build-up of microbial 13C stocks was more pronounced in the top 5 cm compared to 5–30 cm. This observed large contribution of the stocks in the top 5 cm to overall profile litter-derived Cmic stocks decreased over time (from 76.1 to 20.0%), while that of the stocks in 5–30 cm increased (from 17.6 to 74.2%). In the subsoil below 30 cm, the contribution of litter-derived 13C to total Cmic stocks remained mostly stable at 5.9–11.9%, with the highest proportion at the second sampling. Microbial 13C stocks strongly decreased from the first to the third sampling in the top 5 cm and below 30 cm soil depth, representing only 4.1 and 14.5% of the initial stocks, respectively, while Cmic in the 5–30 cm soil depth still harboured 65.3% of the initial 13C at the third sampling (Figure 3C).
In general, labelled litter-derived C contributed <3% to microbial biomass C, in most cases even <1% (Supplementary Figure 4C). The only exception was the 20–50 cm soil depth at the second sampling, with values of up to 6.4%, although this effect was not significant.
Phospholipid Fatty Acids and Contribution of Litter-Derived 13C
The abundances of PLFAGram+, PLFAGram−, and PLFAfun were highly variable between the samplings and steeply decreased from the topsoil to the subsoil (Supplementary Figure 5A) (date × depth; PLFAGram+: F = 6.47, p < 0.001; PLFAGram−: F = 2.75, p < 0.001; PLFAfun: F = 3.86, p < 0.001).
The quantity of labelled litter-derived C incorporated into PLFAs decreased even more sharply with depth and had already, in the 10–20 cm depth, reached levels similar to those in subsoil (Supplementary Figure 5B). Accordingly, the decrease with time was most pronounced in the topsoil (date × depth; PLFAGram+: F = 2.62, p < 0.01; PLFAGram−: F = 2.66, p < 0.01; PLFAfun: F = 2.32, p < 0.01). From the first to the second sampling, the maximum concentrations of 13C in PLFAs in the deeper subsoil (below 30 cm soil depth) shifted from 40 to 90 cm (e.g., up to 1.4 ng g−1 dry soil for PLFAGram+) to 80–90 and 140–160 cm (e.g., up to 1.6 ng g−1 dry soil for PLFAfun). At the third sampling, only very small quantities of litter-derived C were present in PLFAs in the subsoil.
The temporal patterns of 13C stocks in microbial groups differed among the three soil depths 0–5 cm, 5–30 cm, and below 30 cm (Supplementary Figure 6). Gram-negative bacteria incorporated most 13C in the top 5 cm throughout the experiment, while the relative share of 13C in PLFAGram+ and PLFAfun in 0–5 cm strongly decreased over time while increasing in the 5–30 cm soil depth. The incorporation of litter-derived C into PLFAs in the deeper subsoil below 30 cm soil depth decreased clearly for PLFAGram− and PLFAfun and increased slightly for PLFAGram+. Accordingly, at the third sampling the microbial groups had the smallest proportional 13C reduction compared to the first sampling at 5–30 cm soil depth, with fungi roughly doubling their 13C stocks at this depth over time (Figures 3D–F).
The proportion of labelled litter-derived C in the PLFAs of bacteria and fungi provides an indicator of substrate preferences in microbial groups. At the first two samplings, the proportions steeply decreased from the topsoil to a depth of 40 cm (Figure 4). However, although neither sampling date nor soil depth significantly influenced the proportions of litter-derived C in the different microbial groups, a temporal pattern with specific maxima at depths below 40 cm, similar to that for litter-derived C content, was apparent. While at the first sampling the greatest proportion of labelled litter-derived C (e.g., up to 1.7% for PLFAfun) appeared within the upper 80 cm of the soil profiles, this maximum (e.g., up to 6.3% for PLFAfun) shifted to deeper soil depth (80 to 160 cm) by the second sampling, and almost disappeared at the third sampling with a maximum 13C retention of only 0.5% (PLFAGram−).
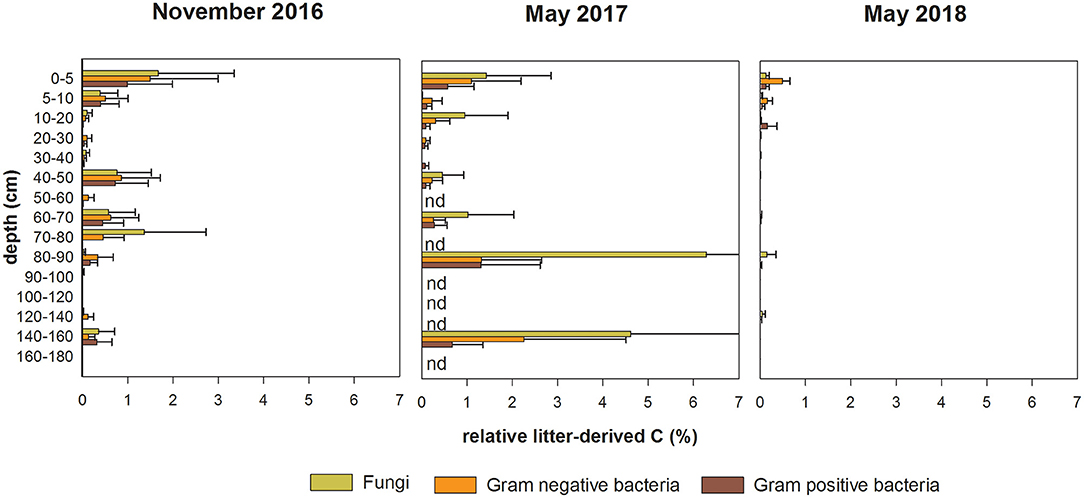
Figure 4. Mean proportion (%) of 13C-litter-derived C in PLFAGram+, PLFAGram− and PLFAfun in soil samples from 0 to 180 cm soil depth for the sampling dates November 2016 (first sampling), May 2017 (second sampling), and May 2018 (third sampling). Error bars indicate standard error (n = 3).
Discussion
Our study investigated the microbial utilisation of leaf litter-derived C within a soil profile to 180 cm depth over 18 months. Primarily, we found that most litter C was incorporated by microorganisms within the topsoil. Fungi in particular incorporated litter C for a prolonged time within the top cm of the profile. Our study provides an estimate for the upper limit of microbial assimilation of actively circulating (and accessible) litter C (that is, not long-term stabilised in other C pools) in subsoil on the months to years scale. The small C quantities migrating into deeper soil led to a temporally restricted increase in litter C incorporation but contributed less than one percent to the total microbial C pool 18 months after stopping the DO13C input from the added litter into the mineral soil. This indicates an overall slow rate of microbially mediated SOC formation from aboveground litter in the subsoil.
Litter-Derived Carbon Utilisation Across Depth and Over Time
Microbial utilisation of litter-derived C was, by far, greatest in the mineral soil near the soil surface (0–30 cm) throughout the entire 18-month period. Microorganisms in near-surface environments are expected to be in a state of high metabolic activity, thus enhancing C turnover compared to those in deeper soil depth (39). This suggests rapid and direct microbial assimilation of recently introduced DOC (40) as a main driver of the high initial incorporation rates of labelled litter C in microorganisms in the top cm of the soil profile. Over time, however, microbial 13C stocks (g litter C m−2) in topsoil (0–30 cm) remained much higher than those in deeper soil, although they generally decreased, and continuously accounted for ~90% of the microbial 13C stocks in the entire soil profile throughout the experimental period. As suggested by the observed more rapid reduction of 13C stocks in the labile EOC fraction than in SOC, direct 13C assimilation from DOC in topsoil likely decreased over time. However, two other pathways may be of importance for the long-term microbial labelled litter C acquisition: recycling of microbial necromass C, and assimilation of previously mineral-bound C. Microbial necromass has been shown to contribute greatly to the SOC pool and can be utilised by the microbial community either directly or after binding to reactive soil minerals (41–43). Reactive soil minerals are hotspots for C transformation and decomposition, playing a major role in sustaining the microbial C supply in both topsoil and subsoil (44). In line with this, Liebmann et al. (24) found, in the same experiment as that of the present study, that a substantial part of the newly formed mineral-associated OC was labile. Pronounced C retention in topsoil has been further explained by preferential sorption of newly introduced C to already present organo-mineral clusters in a DOC injection experiment (45). Nevertheless, soil mineralogy and related physico-chemical properties can control the extent and temporal pattern of microbial assimilation of formerly mineral-bound C, but this may vary substantially between different soil types (46–48).
Over the experimental period, peaks of proportional (%) and absolute (ng g−1 dry soil) microbial incorporation of labelled litter C occurred at different soil depths, suggesting a downward movement of some litter C over time in the form of DOC. Preliminary evaluation of the DOC fluxes for the period November 2016 to May 2018 amounted to litter-derived DOC fluxes of about 0.265 (± 0.129) g m−2 in 10 cm, 0.013 (± 0.002) g m−2 in 50 cm, and 0.008 (± 0.008) g m−2 in 150 cm soil depth (Liebmann, unpublished), which showed a similarly strong decrease with soil depth, and seasonal variability as observed at the Grinderwald site for the period August 2014 to November 2015 (12). Small-scale litter C translocation within the topsoil environment was evidenced by the fact that microorganisms in the top 5 cm initially contributed 76% and in the 5–30 cm 18% to the total litter-derived microbial C stock, while this pattern was almost reversed 18 months later. This increasing contribution of the 5–30 cm soil depth to the total microbial 13C stock over time could be explained either by persistence of microbially assimilated litter C or by a more balanced input/output ratio of litter C on the months to years scale. Both processes are also indicated by the distinctly high proportion of litter-derived microbial C stock in the 5–30 cm soil depth at the third sampling relative to the initial stock (65%).
We found no evidence for an increased proportion of litter-derived 13C in microbial biomass C in subsoil, contradicting our hypothesis proposing that the low concentration of litter-derived 13C measured in the subsoil SOC and EOC pools are of major importance for the microbial community. The only exception was the 20–50 cm soil depth at the second sampling, when up to 6% of the microbial C was labelled litter-derived. This was accompanied by a substantial decrease over time in the EO13C stocks in topsoil (by appr. 90%), which may indicate that some of this labile and mobile C fraction was translocated into deeper soil depth where it was assimilated by soil microorganisms. The time period between the first two samplings experienced higher soil water content than most of the experimental period, suggesting increased DOC fluxes (e.g., leaf litter leachate) to deeper soil depth. Microbial processing of litter C entering the 20–50 cm soil depth may thus have contributed to the moderate increase in the SO13C stock below 30 cm soil depth at that time.
Overall, during the entire sampling period, the concentrations of labelled litter C found in both the SOC as well as in the microbial fraction were very small in the deeper soil depth as compared to those found in the top cm of the soil profile. In accordance with other studies on C translocation within soil profiles, this indicates that only a minor portion of the C input from aboveground litter is transported into deeper soil depth (49–51). At the third sampling date (May 2018), incorporation rates of the labelled litter C in C pools within the entire soil profile were very low, with the litter C contribution in subsoil even lower than in topsoil. Here, the maximum relative contribution of the labelled litter C to the microbial C pool in subsoil was less than one percent, 18 months after switch-off of the DO13C input, providing an estimate for the upper limit of long-term microbial assimilation of actively cycling C derived from aboveground litter in sandy subsoils. This low long-term contribution of the labelled litter C may be explained by (interactions of) different mechanisms. The labelled litter C may have been largely, first, displaced with the soil solution into soil depths below the maximum sampling depth (translocation); second, replaced by new litter C introduced into the soil profile after removal of the labelled litter (dilution); and/or, third, used for catabolic (energy production) rather than for anabolic (growth) processes by the microbial community (consumption). The last could apply in particular to the microbial community in the subsoil, where new litter-derived C inputs were found to be used primarily to overcome microbial energy limitation in decomposition processes (17). High C loss by respiration due to lower microbial CUE in subsoil (39) also offers an explanation for the rather short and low litter C incorporation in the microbial C pool of the subsoil (e.g., 0.004 g litter C m−2 resp. 5.9% of the total microbial 13C stock at the third sampling). These microbial anabolic constraints are driven both by decreasing C content and greater proportions of more complex compounds following repeated processing of aboveground litter-derived DOC as it passes through the soil profile (5, 7). This, in turn, implies a rather slow rate of microbial SOC formation in subsoil from aboveground litter C, which, 18 months after the end of the labelled litter C input, accounted for only 0.2 g litter C m−2 or ~0.01% of the total SOC pool below 30 cm soil depth. However, we must keep in mind that we found no evidence of bioturbation in the acidic forest soil that limits the pathways by which litter-derived C can be translocated to the subsoil, and we assume that the rate and extent of litter-derived C transport to the subsoil may be much higher in soils with pronounced bioturbation by, for example, earthworms or other soil-dwelling fauna (52).
Microbial Group-Specific Carbon Utilisation
In previous studies, microbial community structure and activity were found to undergo major changes with increasing soil depth, explained primarily by changes in OM composition and accessibility (11). The microbial group-specific proportions in 13C incorporation in our study indicated that fungi respond more to recent aboveground litter-derived C than bacteria, and this was more evident in the subsoil than in the topsoil. In near-surface soil, neither Gram-positive and Gram-negative bacteria nor fungi had litter-derived 13C proportions in their biomass higher than 2% at any of the three sampling dates. In contrast, fungi in subsoil strongly increased their proportional uptake of up to 6%, while the two bacterial groups remained at similar or slightly increased levels compared to bacteria in topsoil. The similar proportions of labelled litter-derived C across the three different microbial groups in the topsoil may have been due to the broad availability of C sources other than the labelled litter-derived DOC, such as high belowground C inputs from root exudation and decomposition in this densely rooted environment (53, 54). However, the dynamics of the group-specific 13C stocks within the top 30 cm showed major differences between bacteria and fungi. Stocks of 13C incorporated into bacterial biomass generally decreased over time, while that of fungi decreased only in the top 5 cm but roughly doubled in the 5–30 cm soil depth from the first to the third sampling. The increased fungal litter-derived C storage suggests this soil depth as the primary location for fungal-driven C retention and underlines the importance of fungi for (microbial) C stabilisation in topsoil (21). Here, an important pathway for C translocation from upper to lower topsoil may be the hyphal network (55), which probably contributed to the more balanced input/output ratio of litter C at 5–30 cm depth. In addition, the higher persistence of fungal necromass than of bacterial necromass (56, 57) may have contributed to the comparatively slow decrease in the SO13C stock at this depth.
In the subsoil, however, the relative and absolute incorporation patterns indicated differences between bacteria and fungi in their dependency on litter-derived DOC and/or in the ability of these microbial groups to exploit this heterogeneously distributed C source in the subsoil environment. In previous studies by Kramer and Gleixner (13, 15), Gram-positive bacteria were found to predominantly utilise “older,” more processed SOC and to maintain these C preferences with increasing soil depth, while Gram-negative bacteria and fungi preferentially use more recent plant-derived C fractions. In line with this, Gram-positive bacteria were the only microbial group to moderately increase their proportion (up to 9%) of the subsoil 13C stock to the 13C stock of the entire soil profile, while fungi exhibited only a temporarily restricted increase in relative 13C incorporation during the major stage of litter-derived C migration into deeper soil. This indicates that fungi in subsoil, in contrast to Gram-positive bacteria, depend more strongly on the low but periodically occurring litter-derived C inputs, but are not able to store it for long periods under subsoil conditions due to, e.g., low CUE. This contradicts the importance of fungi for C stabilisation at the 5–30 cm soil depth as suggested in our study, and as was previously proposed for C-rich near-surface environments (19). Despite similar substrate preferences, differences in the incorporation of litter-derived C between fungi and Gram-negative bacteria in subsoil may to some extent have been driven by the prevailing moisture conditions and DOC fluxes. Seasonal variability and total DOC fluxes are of major relevance, as they strongly affect diffusive as well as convective transport and thus DOC availability to soil microorganisms in the soil matrix (8). Throughout the entire experimental period, soil moisture in the subsoil was lower than in the topsoil, with major water fluxes in deeper soil depths most likely limited to intense precipitation periods (e.g., November 2017 to January 2018). This assumption is supported by results from Leinemann et al. (12), who observed occasional strongly reduced total water fluxes in subsoil compared to topsoil at the experimental site. Under such conditions, hyphal growth may have given fungi a competitive advantage over Gram-negative bacteria in exploiting the leaf litter-derived C, as was also shown in a previous study at the same experimental site for root litter-derived C (54). Whereas, fungi can grow towards sparsely distributed resources in the subsoil (58), bacteria depend, for the most part, on solute transport and thus respond more strongly to decreasing soil water content (59–61). Microbial utilisation of specific C substrates is consequently determined by microbial group-specific preferences as well as by accessibility to C substrates within the soil matrix. Microbial access is thus not only controlled by the availability of C sources in the soil volume but also strongly by the microbial group-specific adaptations to prevailing habitat conditions (e.g., soil moisture and texture).
Conclusion
In this study, we demonstrated the dynamics of microbial group-specific C utilisation as well as the downward movement of aboveground litter-derived C within an undisturbed sandy soil profile under beech forest. Most of the recently deposited litter-derived C was processed in the top cm of the soil profile. The decoupling of the temporal dynamics of litter-derived C in EOC and Cmic in this soil depth indicated internal recycling of microbial-bound C as well as microbial utilisation of previously mineral-bound C. Presumably, only a small proportion of the DOC input during the previous 2 years was further transported to the subsoil and served as a scarce but essential C source for microorganisms, especially for fungi. During the experimental period, the primary downward movement of the labelled litter C in the microbial fraction from topsoil to subsoil occurred over a period of 6 months. Our study provides an estimate for the upper limit of actively cycling litter-derived C (that is, not long-term stabilised in other C pools), which can be incorporated into microbial C pools of sandy forest subsoils; only 0.2 g m−2 or ~0.01% of total SOC below 30 cm soil depth were litter-derived 18 months after 13C-labelled litter was removed. Fungi seemed to be most important for this slow microbial C incorporation, although 13C stabilisation in fungal biomass in subsoil was ephemeral. Overall, our study thus suggests that on annual timescales, microbial C assimilation may be of minor relevance for the stabilisation of aboveground litter-C in subsoil of sandy soils.
Data Availability Statement
The raw data supporting the conclusions of this article will be made available by the authors, without undue reservation.
Author Contributions
GG, RM, AD, KK, SM, CP, and EK contributed to conception and design of the study. SP, PL, AS, JW, and KM conducted the field work and sample analysis. JB provided data on precipitation. GG and PL provided data on SOC content at the first and third sampling date. SP conducted the data evaluation and statistics with contributions of JW and AS. SP wrote the manuscript with contributions of EK, SM, and CP. All authors read and approved the submitted manuscript.
Funding
This project was part of the Research Unit The Forgotten Part of Carbon Cycling: Organic Matter Storage and Turnover in Subsoils (SUBSOM) and funded by the Deutsche Forschungsgemeinschaft DFG (FOR1806, KA 1590/11-2, MA 4436/3-2, PO 1578/4-2, GU 406/28-2, DO 1734 4-2, KA 1737/15-2).
Conflict of Interest
The authors declare that the research was conducted in the absence of any commercial or financial relationships that could be construed as a potential conflict of interest.
The reviewer SS declared a current collaboration at the time of review with one of the authors GG to the handling editor.
Acknowledgments
We would like to thank the editor and the three reviewers for constructive comments, Sabine Rudolph for her assistance in the laboratory, Julian Heitkötter and Bernd Marschner at the Institute of Geography at Ruhr-Universität Bochum for the project coordination, Wolfgang Armbruster at Institute of Food Chemistry at University of Hohenheim for IRMS measurements, Hans-Peter Piepho at the Biostatistics Department at University of Hohenheim for statistical support, and Kathleen Regan for English corrections. For support with field work and sampling we thank Frank Hegewald.
Supplementary Material
The Supplementary Material for this article can be found online at: https://www.frontiersin.org/articles/10.3389/fsoil.2021.666950/full#supplementary-material
Supplementary Figure 1. Mean monthly precipitation (mm) at the field site and mean monthly soil water content (%) at six different soil depths (10, 30, 50, 90, 150, and 180 cm) from November 2016 to May 2018.
Supplementary Figure 2. (A) Mean soil organic carbon (SOC) contents (mg g−1 dry soil) of soil samples from 0 to 180 cm soil depth for the sampling dates November 2016 (first sampling), May 2017 (second sampling), and May 2018 (third sampling). Error bars indicate standard error (n =3). (B) Mean contents (μg g−1 dry soil) of 13C-litter-derived C in SOC of soil samples from 0 to 180 cm soil depth for the sampling dates November 2016 (first sampling), May 2017 (second sampling), and May 2018 (third sampling). Error bars indicate standard error (n = 3). (C) Mean proportion (%) of 13C-litter-derived C in SOC of soil samples from 0 to 180 cm soil depth for the sampling dates November 2016 (first sampling), May 2017 (second sampling), and May 2018 (third sampling). Error bars indicate standard error (n = 3).
Supplementary Figure 3. (A) Mean extractable organic carbon (μg EOC g−1 dry soil) in soil samples from 0 to 180 cm soil depth for the sampling dates November 2016 (first sampling), May 2017 (second sampling), and May 2018 (third sampling). Mean values with standard error (n = 3). (B) Mean contents (μg g−1 dry soil) of 13C-litter-derived C in EOC of soil samples from 0 to 180 cm soil depth for the sampling dates November 2016 (first sampling), May 2017 (second sampling), and May 2018 (third sampling). Error bars indicate standard error (n = 3). (C) Mean proportion (%) of 13C-litter-derived C in EOC of soil samples from 0 to 180 cm soil depth for the sampling dates November 2016 (first sampling) May 2017 (second sampling), and May 2018 (third sampling). Error bars indicate standard error (n = 3).
Supplementary Figure 4. (A) Mean microbial biomass C (μg Cmic g−1 dry soil) of soil samples from 0 to 180 cm soil depth for the sampling dates November 2016 (first sampling), May 2017 (second sampling), and May 2018 (third sampling). Mean values with standard error (n = 3). (B) Mean contents (μg g−1 dry soil) of 13C-litter-derived C in Cmic of soil samples from 0 to 180 cm soil depth for the sampling dates November 2016 (first sampling), May 2017 (second sampling), and May 2018 (third sampling). Error bars indicate standard error (n = 3). (C) Mean proportion (%) of 13C-litter-derived C in Cmic of soil samples from 0 to 180 cm soil depth for the sampling dates November 2016 (first sampling), May 2017 (second sampling), and May 2018 (third sampling). Error bars indicate standard error (n = 3).
Supplementary Figure 5. (A) Mean abundance (nmol g−1 dry soil) of Gram-positive bacteria (PLFAGram+), Gram-negative bacteria (PLFAGram−), and fungi (PLFAfun) in soil samples from 0 to 180 cm soil depth for the sampling dates November 2016 (first sampling), May 2017 (second sampling), and May 2018 (third sampling). Error bars indicate standard error (n = 3). (B) Mean contents (ng g−1 dry soil) of 13C-litter-derived C in PLFAGram+, PLFAGram− and PLFAfun in soil samples from 0 to 180 cm soil depth for the sampling dates November 2016 (first sampling), May 2017 (second sampling), and May 2018 (third sampling). Error bars indicate standard error (n = 3).
Supplementary Figure 6. (A) Mean litter-derived C stocks (g litter C m−2) in Gram-positive bacteria of the depth increments 0–5 cm, 5–30 cm, and below 30 cm soil depth for the sampling dates November 2016 (first sampling), and May 2018 (third sampling). (B) Mean litter-derived C stocks (g litter C m−2) in Gram-negative bacteria of the depth increments 0–5 cm, 5–30 cm, and below 30 cm soil depth for the sampling dates November 2016 (first sampling), and May 2018 (third sampling). (C) Mean litter-derived C stocks (g litter C m−2) in fungi of the depth increments 0–5 cm, 5–30 cm, and below 30 cm soil depth for the sampling dates November 2016 (first sampling), and May 2018 (third sampling). Due to the different numbers of fatty acids assigned, it is not possible to directly compare the absolute stock quantities (g litter C m−2) of the different microbial groups.
Supplementary Table 1. Soil properties of the field site.
References
1. Rumpel C, Kögel-Knabner I. Deep soil organic matter – a key but poorly understood component of terrestrial C cycle. Plant Soil. (2011) 338:143–58. doi: 10.1007/s11104-010-0391-5
2. Kaiser K, Guggenberger G, Zech W. Isotopic fractionation of dissolved organic carbon in shallow forest soils as affected by sorption. Eur J Soil. (2001) 52:585–97. doi: 10.1046/j.1365-2389.2001.00407.x
3. Michalzik B, Kalbitz K, Park JH, Solinger S, Matzner E. Fluxes and concentrations of dissolved organic carbon and nitrogen – a synthesis for temperate forests. Biogeochemistry. (2001) 52:173–205. doi: 10.1023/A:1006441620810
4. Yano Y, Lajtha K, Sollins P, Caldwell BA. Chemistry and dynamics of dissolved organic matter in a temperate coniferous forest on andic soils: effects of litter quality. Ecosystems. (2005) 8:286–300. doi: 10.1007/s10021-005-0022-9
5. Kaiser K, Kalbitz K. Cycling downwards - dissolved organic matter in soil. Soil Biol. Biochem. (2012) 52:29–32. doi: 10.1016/j.soilbio.2012.04.002
6. Scott EE, Rothstein DE. The dynamic exchange of dissolved organic matter percolating through six diverse soils. Soil Biol Biochem. (2014) 69:83–92. doi: 10.1016/j.soilbio.2013.10.052
7. Sokol NW, Bradford MA. Microbial formation of stable soil carbon is more efficient from belowground than aboveground input. Nat Geosci. (2019) 12:46–53. doi: 10.1038/s41561-018-0258-6
8. Marschner B, Kalbitz K. Controls of bioavailability and biodegradability of dissolved organic matter in soils. Geoderma. (2003) 113:211–35. doi: 10.1016/S0016-7061(02)00362-2
9. Cleveland CC, Neff JC, Townsend AR, Hood E. Composition, dynamics, and fate of leached dissolved organic matter in terrestrial ecosystems: results from a decomposition experiment. Ecosystems. (2004) 7:275–85. doi: 10.1007/s10021-003-0236-7
10. Liang C, Balser TC. Preferential sequestration of microbial carbon in subsoils of a glacial-landscape toposequence, Dane County, WI. USA. Geoderma. (2008) 148:113–9. doi: 10.1016/j.geoderma.2008.09.012
11. Fierer N, Schimel JP, Holden PA. Variations in microbial community composition through two soil depth profiles. Soil Biol Biochem. (2003) 35:167–76. doi: 10.1016/S0038-0717(02)00251-1
12. Leinemann T, Mikutta R, Kalbitz K, Schaarschmidt F, Guggenberger G. Small scale variability of vertical water and dissolved organic matter fluxes in sandy Cambisol subsoils as revealed by segmented suction plates. Biogeochemistry. (2016) 131:1–15. doi: 10.1007/s10533-016-0259-8
13. Kramer C, Gleixner G. Variable use of plant- and soil-derived carbon by microorganisms in agricultural soils. Soil Biol Biochem. (2006) 38:3267–78. doi: 10.1016/j.soilbio.2006.04.006
14. Hao J, Chai JN, Lopez DL, Ordóñez RA, Wright EE, Archontoulis S, et al. The effects of soil depth on the structure of microbial communities in agricultural soils in Iowa (United States). Appl Environ Microbiol. (2021) 87:e02673–20. doi: 10.1128/AEM.02673-20
15. Kramer C, Gleixner G. Soil organic matter in soil depth profiles: distinct carbon preferences of microbial groups during carbon transformation. Soil Biol Biochem. (2008) 40:425–33. doi: 10.1016/j.soilbio.2007.09.016
16. Wang Q, Wang Y, Wang S, He T, Liu L. Fresh carbon and nitrogen inputs alter organic carbon mineralization and microbial community in forest deep soil layers. Soil Biol Biochem. (2014) 72:145–51. doi: 10.1016/j.soilbio.2014.01.020
17. Fontaine S, Barot S, Barré P, Bdioui N, Mary B, Rumpel C. Stability of organic carbon in deep soil layers controlled by fresh carbon supply. Nature. (2007) 450:277–80. doi: 10.1038/nature06275
18. Schmidt MWI, Torn MS, Abiven S, Dittmar T, Guggenberger G, Jannsens IA, et al. Persistence of soil organic matter as an ecosystem property. Nature. (2011) 478:49–56. doi: 10.1038/nature10386
19. Trivedi P, Anderson IC, Singh BK. Microbial modulators of soil carbon storage: integrating genomic and metabolic knowledge for global prediction. Trends Microbiol. (2013) 21:641. doi: 10.1016/j.tim.2013.09.005
20. Six J, Frey SD, Thiet RK, Batten KM. Bacterial and fungal contributions to carbon sequestration in agroecosystems. Soil Sci Soc Am J. (2006) 70:555–69. doi: 10.2136/sssaj2004.0347
21. Strickland MS, Rousk J. Considering fungal:bacterial dominance in soils – methods, controls, ecosystem implications. Soil Biol Biochem. (2010) 42:1385–95. doi: 10.1016/j.soilbio.2010.05.007
22. Bååth E. Measurement of protein-synthesis by soil bacterial assemblages with the leucine incorporation technique. Biol Fertil Soils. (1994) 17:147–53. doi: 10.1007/BF00337747
23. Rousk J, Bååth E. Fungal biomass production and turnover in soil estimated using the acetate-in-ergosterol technique. Soil Biol Biochem. (2007) 39:2173–7. doi: 10.1016/j.soilbio.2007.03.023
24. Liebmann P, Wordell-Dietrich P, Kalbitz K, Mikutta R, Kalks F, Don A, et al. Relevance of aboveground litter for soil organic matter formation – a soil profile perspective. Biogeosciences. (2020) 17:3099–113. doi: 10.5194/bg-17-3099-2020
25. Angst G, Kögel-Knabner I, Kirfel K, Hertel D, Mueller CW. Spatial distribution and chemical composition of soil organic matter fractions in rhizosphere and non-rhizosphere soil under European beech (Fagus sylvatica L.). Geoderma. (2016) 264:179–87. doi: 10.1016/j.geoderma.2015.10.016
26. IUSS Working Group WRB. World reference base for soil resources 2014. in International Soil Classification System for Naming Soils and Creating Legends for Soil Maps. World Soil Resources Reports Vol. 106, Rome: FAO (2014)
27. Preusser S, Marhan S, Poll C, Kandeler E. Microbial community response to changes in substrate availability and habitat conditions in a reciprocal subsoil transfer experiment. Soil Biol Biochem. (2017) 105:138–52. doi: 10.1016/j.soilbio.2016.11.021
28. Müller K, Kramer S, Haslwimmer H, Marhan S, Scheunemann N, Butenschön O, et al. Carbon transfer from maize roots and litter into bacteria and fungi depends on soil depth and time. Soil Biol Biochem. (2016) 93:79–89. doi: 10.1016/j.soilbio.2015.10.015
29. Vance ED, Brookes PC, Jenkinson DS. An extraction method for measuring soil microbial biomass C. Soil Biol Biochem. (1987) 19:703–7. doi: 10.1016/0038-0717(87)90052-6
30. Marhan S, Kandeler E, Rein S, Fangmeier A, Niklaus A. Indirect effects of soil moisture reverse soil C sequestration responses of a spring wheat agroecosystem to elevated CO2. Glob Chang Biol. (2010) 16:469–83. doi: 10.1111/j.1365-2486.2009.01949.x
31. Joergensen RG, Mueller T. The fumigation-extraction method to estimate soil microbial biomass: calibration of the ken value. Soil Biol Biochem. (1996) 28:33–7. doi: 10.1016/0038-0717(95)00101-8
32. Frostegård A, Tunlid A, Bååth E. Microbial biomass measured as total lipid phosphate in soils of different organic content. J Microbiol Methods. (1991) 14:151–63. doi: 10.1016/0167-7012(91)90018-L
33. Kramer S, Marhan S, Haslwimmer H, Ruess L, Kandeler E. Temporal variation in surface and subsoil abundance and function of the soil microbial community in an arable soil. Soil Biol Biochem. (2013) 61:76–85. doi: 10.1016/j.soilbio.2013.02.006
34. Kandeler E, Mosier AR, Morgan JA, Milchunas DG, King JY, Rudolph S, et al. Transient elevation of carbon dioxide modifies the microbial community composition in a semi-arid grassland. Soil Biol Biochem. (2008) 40:162–71. doi: 10.1016/j.soilbio.2007.07.018
35. Frostegård A, Bååth E. The use of phospholipid fatty acid analysis to estimate bacterial and fungal biomass in soil. Biol Fertil Soils. (1996) 22:59–65. doi: 10.1007/BF00384433
36. Zelles L. Fatty acid patterns of phospholipids and lipopolysaccharides in the characterisation of microbial communities in soil: a review. Biol Fertil Soils. (1999) 29:111–29. doi: 10.1007/s003740050533
37. Frostegård A, Tunlid A, Bååth E. Phospholipid fatty acid composition, biomass, and activity of microbial communities from two soil types experimentally exposed to different heavy metals. Appl Environ Microbiol. (1993) 59:3605–17. doi: 10.1128/AEM.59.11.3605-3617.1993
38. Denef K, Bubenheim H, Lenhart K, Vermeulen J, van Cleemput O, Boeckx P, et al. Community shifts and carbon translocation within metabolically-active rhizosphere microorganisms in grasslands under elevated CO2. Biogeosciences. (2007) 4:769–79. doi: 10.5194/bg-4-769-2007
39. Spohn M, Klaus K, Wanek W, Richter A. Microbial carbon use efficiency and biomass turnover times depending on soil depth - implications for carbon cycling. Soil Biol Biochem. (2016) 96:74–81. doi: 10.1016/j.soilbio.2016.01.016
40. Wang M, Tian Q, Liao C, Zhao R, Wang D, Wu Y, et al. The fate of litter-derived dissolved organic carbon in forest soils: results from an incubation experiment. Biogeochemistry. (2019) 144:133–47. doi: 10.1007/s10533-019-00576-3
41. Simpson AJ, Simpson MJ, Smith E. Microbially derived inputs to soil organic matter: are current estimates too low? Environ Sci Technol. (2007) 41:8070–6. doi: 10.1021/es071217x
42. Creamer CA, Foster AL, Lawrence C, McFarland J, Schulz M, Waldrop MP. Mineralogy dictates the initial mechanism of microbial necromass association. Geochim Cosmochim Acta. (2019) 260:161–76. doi: 10.1016/j.gca.2019.06.028
43. Liang C, Amelung W, Lehmann J, Kästner M. Quantitative assessment of microbial necromass contribution to soil organic matter. Glob Chang Biol. (2019) 25:3578–90. doi: 10.1111/gcb.14781
44. Leinemann T, Preusser S, Mikutta R, Kalbitz K, Cerli C, Mueller CW, et al. Multiple exchange processes on mineral surfaces control the transport of dissolved organic matter through soil profiles. Soil Biol Biochem. (2018) 118:79–90. doi: 10.1016/j.soilbio.2017.12.006
45. Kalks F, Liebmann P, Wordell-Dietrich P, Guggenberger G, Kalbitz K, Mikutta R, et al. Fate and stability of dissolved organic carbon in topsoils and subsoils under beech forests. Biogeochemistry. (2020) 148:111–28. doi: 10.1007/s10533-020-00649-8
46. Heckman K, Welty-Bernard A, Rasmussen C, Schwartz E. Geologic controls of soil carbon cycling and microbial dynamics in temperate conifer forests. Chem Geol. (2009) 267:12–23. doi: 10.1016/j.chemgeo.2009.01.004
47. Heckman K, Welty-Bernard A, Vasquez-Ortega A, Schwartz E, Chorover J, Rasmussen C. The influence of goethite and gibbsite on soluble nutrient dynamics and microbial community composition. Biogeochemistry. (2013) 112:179–95. doi: 10.1007/s10533-012-9715-2
48. Kothawala DN, Moore TR, Hendershot WH. Soil properties controlling the adsorption of dissolved organic carbon to mineral soils. Soil Sci Soc Am J. (2009) 73:1831–42. doi: 10.2136/sssaj2008.0254
49. McCracken KL, McDowell WH, Harter RD, Evans CV. Dissolved organic carbon retention in soils: comparison of solution and soil measurements. Soil Sci Soc Am J. (2002) 66:563–8. doi: 10.2136/sssaj2002.5630
50. Fröberg M, Jardine PM, Hanson PJ, Swanston CW, Todd DE, Tarver JR, et al. Low dissolved organic carbon input from fresh litter to deep mineral soils. Soil Sci Soc Am J. (2007) 71:347–54. doi: 10.2136/sssaj2006.0188
51. Fröberg M, Hanson PJ, Trumbore SE, Swanston CW, Todd DE. Flux of carbon from 14C-enriched leaf litter throughout a forest soil mesocosm. Geoderma. (2009) 149:181–8. doi: 10.1016/j.geoderma.2008.11.029
52. Taylor AR, Lenoir L, Vegerfors B, Persson T. Ant and earthworm bioturbation in cold-temperate ecosystems. Ecosystems. (2019) 22:981–94. doi: 10.1007/s10021-018-0317-2
53. Koranda M, Schnecker J, Kaiser C, Fuchslueger L, Kitzler B, Stange CF, et al. Microbial processes and community composition in the rhizosphere of European beech - the influence of plant C exudates. Soil Biol Biochem. (2011) 43:551–8. doi: 10.1016/j.soilbio.2010.11.022
54. Preusser S, Poll C, Marhan S, Angst G, Mueller CW, Bachmann J, et al. Fungi and bacteria respond differently to changing environmental conditions within a soil profile. Soil Biol Biochem. (2019) 137:107543. doi: 10.1016/j.soilbio.2019.107543
55. Sun YP, Unestam T, Lucas SD, Johanson KJ, Kenne L, Finlay R. Exudation-reabsorption in a mycorrhizal fungus, the dynamic interface for interaction with soil and soil microorganisms. Mycorrhiza. (1999) 9:137–44. doi: 10.1007/s005720050298
56. Guggenberger G, Frey SD, Six J, Paustian K, Elliott ET. Bacterial and Fungal Cell-Wall Residues in Conventional and No-Tillage Agroecosystems. Soil Sci Soc Am J. (1999) 63:1188–98. doi: 10.2136/sssaj1999.6351188x
57. Clemmensen E, Bahr A, Ovaskainen O, Dahlberg A, Ekblad A, Wallander H, Stenlid J, et al. Roots and associated fungi drive long-term carbon sequestration in boreal forest. Science. (2013) 339:1615–8. doi: 10.1126/science.1231923
58. Lindahl BD, Ihrmark K, Boberg J, Trumbore SE, Högberg P, Stenlid J, et al. Spatial separation of litter decomposition and mycorrhizal nitrogen uptake in a boreal forest. New Phytol. (2007) 173:611–20. doi: 10.1111/j.1469-8137.2006.01936.x
59. Drenovsky RE, Vo D, Graham KJ, Scow KM. Soil water content and organic carbon availability are major determinants of soil microbial community composition. Microb Ecol. (2004) 48:424–30. doi: 10.1007/s00248-003-1063-2
60. Brockett BF, Prescott CE, Grayston SJ. Soil moisture is the major factor influencing microbial community structure and enzyme activities across seven biogeoclimatic zones in western Canada. Soil Biol Biochem. (2012) 44:9–20. doi: 10.1016/j.soilbio.2011.09.003
Keywords: soil profile, European beech, litter-derived carbon, temporal dynamics, subsoil, microbial carbon utilisation, acid soil
Citation: Preusser S, Liebmann P, Stucke A, Wirsching J, Müller K, Mikutta R, Guggenberger G, Don A, Kalbitz K, Bachmann J, Marhan S, Poll C and Kandeler E (2021) Microbial Utilisation of Aboveground Litter-Derived Organic Carbon Within a Sandy Dystric Cambisol Profile. Front. Soil Sci. 1:666950. doi: 10.3389/fsoil.2021.666950
Received: 11 February 2021; Accepted: 20 April 2021;
Published: 20 May 2021.
Edited by:
Timothy I. McLaren, ETH Zürich, SwitzerlandReviewed by:
Sandra Spielvogel, University of Kiel, GermanyMunch Jean Charles, Technical University of Munich, Germany
Xiaojuan Feng, Institute of Botany, Chinese Academy of Sciences, China
Copyright © 2021 Preusser, Liebmann, Stucke, Wirsching, Müller, Mikutta, Guggenberger, Don, Kalbitz, Bachmann, Marhan, Poll and Kandeler. This is an open-access article distributed under the terms of the Creative Commons Attribution License (CC BY). The use, distribution or reproduction in other forums is permitted, provided the original author(s) and the copyright owner(s) are credited and that the original publication in this journal is cited, in accordance with accepted academic practice. No use, distribution or reproduction is permitted which does not comply with these terms.
*Correspondence: Sebastian Preusser, cy5wcmV1c3NlckB1bmktaG9oZW5oZWltLmRl