 Minxia Liu
 Ruixin Yu
 Liang Li
- College of Geography and Environmental Science, Northwest Normal University, Lanzhou, China
In this study, the effects of slope aspects and depths on soil organic carbon (SOC), soil total nitrogen (STN), and soil total phosphorus (STP) were quantified in disturbed restoration regions of Gaolan County, located in the Gansu Province of semi-arid loess Plateau of China. Soil samples were collected at 0–10, 10–20, 20–40, 40–60, 60–80, and 80–100 cm on southern, southwestern, western, northwestern, and northern slope aspects of three hills. A total of 75 soil profiles and 450 soil samples were analyzed. Results showed that the SOC, STN, and STP content varied from 1.65 to 12.87 g/kg, 0.45 to 1.53 g/kg, and 0.07 to 0.78 g/kg, and the SOCD, STND, and STPD at 0–100 cm varied from 3.9 to 9.5 kg/m2, 0.58 to 1.35 kg/m2, and 0.33 to 0.56 kg/m2, which increased from the southern to northern slope aspects. The SOC, STN, and STP contents and SOCD, STND, and STPD were mainly in the 0–60 and 60–100 cm soil layers. The vertical descent rate was γSOC > γSTN > γSTP for both content and density. For a single soil nutrient, the decline rate of its content and density on the northern slope aspect was greater than that on the southern slope aspect, that is γN > γ All > γS. The correlation degree between soil properties and SOC and STN content were above 0.6, the overall correlation with STP content was <0.6. These results confirmed that topography (slope aspects) was the most significant factor controlling the distribution patterns of SOC, STN, and STP in hill ecosystems. Overall, the northern slope aspect (vs. southern slope aspect) was more favorable to the preservation of SOC, STN, and STP. Accordingly, in the Loess Plateau and similar fragile environments, soil nutrient protection and vegetation restoration are selective to some extent.
Introduction
The semi-arid area of the Loess Plateau is one of the most fragile zones in the Chinese Loess Plateau region, but it is also a key area of vegetation construction in the Loess Plateau (1). Wind and water erosion has occurred in as much as 80% of the region (2), in order to control soil erosion and improve the surface ecological environment, restoration of vegetation is an important way to improve soil quality and fertility, as well as a tool to prevent soil erosion and restore the physical condition and stability of slope (3). SOC, STN, and STP are the core components of soil nutrients, and also the main sources of important elements for plant growth and development and physiological and ecological activities (4). The content of soil organic matter, litter redistribution, and long-term accumulation of soil nutrients will affect the carbon process of community and ecosystem and the biochemical cycle of mineral elements (5, 6), and affect the stability and sustainability of the whole ecosystem.
In hilly ecosystems, topography is the most significant factor in generating differences in ecosystem characteristics (7). Topography affects soil structural stability and SOC and STN pools (8), and affects soil properties and spatial variability, which in turn affects surface vegetation biomass (9). Topographic indexes can also well justify the spatial variability of crops, indicating the importance of these factors by influencing the distribution of moisture during the process of crop production in the study region. The enhancements of crop components in the lower slope positions could be attributed to an increase in soil depth and plant available water as well as to the accumulation of further soil organic matter and nutrient elements, including nitrogen and potassium, in such positions as a result of soil redistribution (10). Microbial communities play a seminal role in biogeochemical cycles and can be influenced by both biotic and abiotic factors. Topographic attributes and vegetation indexes were to be influential parameters and would be an indication of soil microorganisms for soil quality assessment and management practices (11).
Slope aspect, an important topographic variable in small-scale space, substantially modifies both the solar radiation intensity and the ecological processes on hillside, and creates microclimates that differ significantly from the regional climatic conditions (12). Differences in the amount of solar radiation received by surfaces with different topographic aspects would lead to differences in near-surface temperatures, evaporative demand, and soil moisture (13). Vegetation communities and species are also modified by these microclimatic conditions on different slope aspects, and it also affects the distribution and characteristics of soil nutrients (14). The changing climatic, hydrological, and ecological conditions result in high variability in SOC, STN, and STP at smaller scales in the semi-arid area of the Loess Plateau, which leads to great uncertainty in the accurate estimation of SOC, STN, and STP. Research by Qin et al. (15) shows that the SOC, vegetation coverage, and above-ground biomass significantly increased from the southern to northern slope aspect, and their values on the northern slope aspect were around two times greater than on the southern slope aspect, and Huang et al. (3) also found similar results in the Loess Plateau of China. Qin et al. (16) found that the spatial distribution of STN and STP in hilly areas mainly came from random factors, and STN and STP were negatively correlated with slope aspects. Zhang et al. (17) found in the Loess area that slope aspect mainly affected the STND in 0–20 cm soil layer, and STN in semi-shady slopes were significantly higher than that in semi-sunny slopes. Due to the temperature difference caused by slope aspect, higher soil temperature will directly change the phosphatase activity in the soil and indirectly change the P demand of surface plants and microorganisms, and then regulate the phosphatase secretion to regulate the organic carbon mineralization and affect the STP content.
Soil depth is an important variable to simulate the vertical distribution pattern of SOCD, STND, and STPD at a regional scale. Vertical distribution pattern is an important method for many researchers to estimate SOCD, STND, and STPD in the subsoil by topsoil data, and the contents of SOC, STN, and STP in soil layer has a functional relationship with soil depth (18). For the semi-arid region of the Loess Plateau, the spatial variability of soil water content on different soil depths is largely due to low annual precipitation and high evaporation intensity, which affects the contents and accumulation of SOC, STN, and STP in the soil (19, 20).
The complex topography and slope aspect differences of the Loess Plateau provide an ideal spatial location for the study of SOC, STN, and STP in the soil (3, 21). The study of the density distribution characteristics of SOC, STN, and STP and the influence of topographic factors on their contents change in the semi-arid disturbed restoration area of the Loess Plateau has important feedback effects for understanding the mechanism and law of soil nutrient cycling and surface vegetation restoration in this area. Slope aspect, as one of the important topographic factors, may significantly affect the accumulation of SOC, STN, and STP in semi-arid soils. However, the distribution characteristics of SOC, STN, and STP on the slope aspect scale is less understood, especially in relation to soil depths (3, 15, 17). Therefore, the main goals of this study are: (1) to study the changes of SOC, STN, STP, and vegetation composition on different slope aspects. (2) to discuss the vertical distribution characteristics of SOC, STN, STP, and soil physical and chemical factors, and (3) to analyze the dominant factors affecting the differences of SOC, STN, and STP on different slope aspects.
Materials and Methods
Study Area
The study area (Figure 1) is located in Shuifu Township of Gaolan County, Gansu province, China, located in the hilly and gully region of Loess Plateau (36°16' N, 103°49' E), with an average altitude of 1,825 m. The region has a temperate semi-arid climate with an annual average temperature of 7.2°C. The annual average precipitation is about 266 mm, the annual average evaporation is 1,660 mm, the annual average sunshine is 2,768 h, and the frost-free period is 144 d. Rainfall is concentrated between July and September. The main soil types are calcareous soil, red clay, and alluvial soil, with mainly calcareous soil, with loose soil aggregate structure, poor water and fertilizer holding capacity, and poor fertilizer and water storage capacity. The main perennial vegetation includes: Reaumuria songarica, Caragana, Zygophyllum mucronatum, and Peganum harmala. The main annual vegetation is Setaria viridis, Enneapogon borealis, and Polypogon fugax.
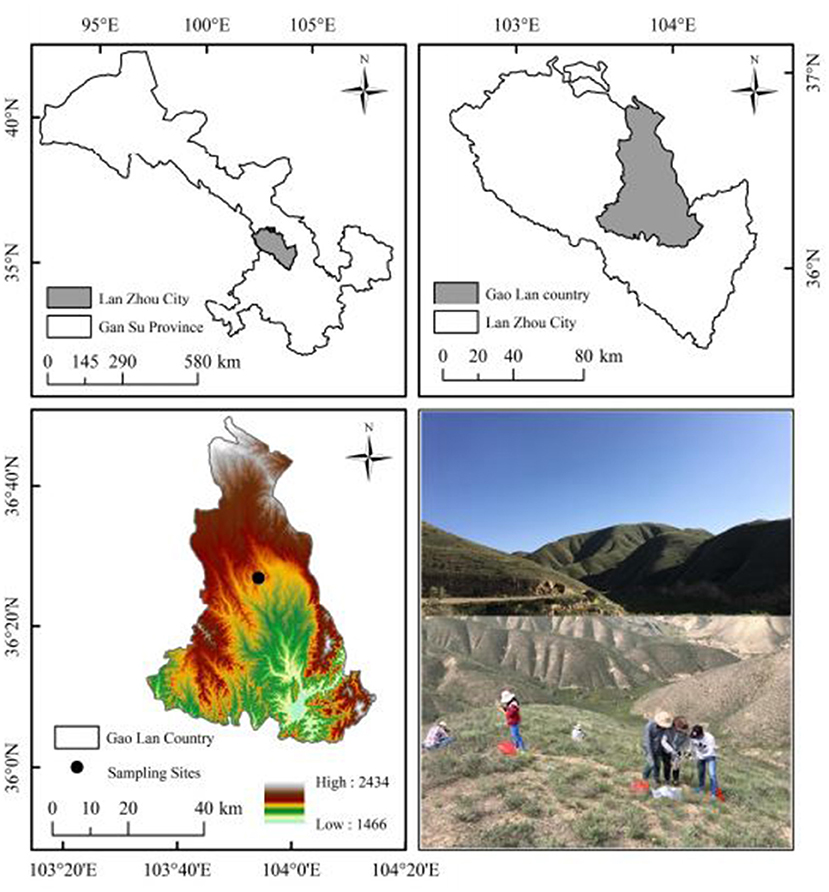
Figure 1. Location of soil sampling sites in Gaolan County, Gansu Province, China.
Experimental Design
In late August 2019, we used GPS to locate and select the sampling sites. We selected three hills (hill A, B, and C) as the spatial repetitions with similar landscape type, elevation (the relative elevation of three hills no more than 50 m), and slope aspect, which enabled us to control the effect of elevations on the SOC, STN, and STP and to focus on the variation of SOC, STN, and STP along the slope aspect gradients. The cross sections of the southern slope aspect (azimuth Angle 180°), southwestern slope aspect (225°), western slope aspect (270°), northwestern slope aspect (315°), and northern slope aspect (360° or 0°) of each hill were examined. In the middle of each hill (the altitude about 1,800 m) five soil sample points were randomly sited. Soil samples were collected for each soil profile using a soil auger (3.5 cm in diameter) at 0–10, 10–20, 20–40, 40–60, 60–80, and 80–100 cm, three replicates were excavated from each layer, and a total of 450 soil samples were collected at 75 soil profiles. Soil profiles were excavated at each standard sample point, and undamaged soil was collected on the left- and right-side walls and front surfaces of each layer with a volume of 100 cubic centimeters for the determination of soil bulk density. The collected soil samples were taken back to the laboratory, removed from the impurities, dried naturally, ground through 0.25 mm fine sieve, and stored for analysis of SOC, STN, STP, and other contents indicators.
Soil Analysis
The soil water content (θ, %) was measured gravimetrically by weighing the soil sample, drying it in an oven at 105°C for 24 h, and then reweighing the sample. The bulk density of soil (ρ, g/cm3) was determined from undisturbed core segment as the mass of soil per unit volume. The pH of a 2:5 soil: water suspension represents the pH of the soil, measured with pH acidometer. Fresh above-ground biomass (BMag) samples were oven-dried at 80°C to a constant weight (48 h), and biomass was expressed in dry weight (g/m2). The SOC (g/kg) of each soil layer was determined by titration with ferrous sulfate after oxidizing and boiling 0.5 g of airdried and sieved soil samples with concentrated sulfuric acid-potassium dichromate (15). STN content was measured with the Kjeldahl method (22). STP content was measured by molybdenum-antimony and scandium colorimetric method (23). These indexes (θ, ρ, pH, SOC, STN, and STP) were determined by referring to the data standards of soil Agricultural Chemical Analysis (24). The 50% parallel samples were set for each batch of samples, and two blank samples were added at the same time to control the accuracy of sample determination and eliminate the errors caused by reagents, instruments, and environment that may occur in the sample determination process.
Data Analysis
We calculated the content (g/kg) of SOC, STN, and STP for each of the six soil layers for each site. We then calculated the SOC, STN, and STP densities (SOCD, STND, and STPD) of each layer using Equation (1).
In Equation (1), BD and G represent the bulk density (g/cm3), and the fractional percentage (%) of gravel larger than 2 mm in diameter of layer n, respectively.
Following Jobbágy and Jackson (25), we applied the following equation to describe the general vertical distribution patterns of SOC, STN, and STP.
which can be log-transformed to
In Equation (3), Y represents the content or density of SOC, STN, and STP, and D represents soil depth measured as the midpoint depth of each layer, i.e., 5, 15, 30, 50, 70, and 90 cm. The coefficient γ stands for the rate of decrease in SOC, STN, and STP with depth, and a larger value indicates a larger difference between surface and bottom soils in nutrient contents or densities. We applied Equation (3) with all sites pooled together to calculate the overall rates of decrease in SOC, STN, and STP on each slope aspects, and we also applied this equation to every site where soil depth reached 100 cm to obtain site-specific γ values.
For the calculation formula of Grey Correlation the SOC, STN, and STP contents of soil layers 0–10, 10–20, 20–40, 40–60, 60–80, and 80–100 cm were used as the reference sequence. X0 was used for correlation degree analysis, and other soil physical and chemical properties were used as the comparison sequence Xi. Since the factors are inconsistent with the target results, the mean value of the data is compared before calculating the correlation degree, and the formula is as follows:
In which av (x0) and av (xi) are the average values of X0 and Xi, respectively.
The formula for calculating the correlation coefficient is as follows:
In Equation (5), ρ is the discrimination coefficient and range of 0 < ρ < 1, generally ρ is 0.5, I (k) is the absolute difference between X0 and Xi.
Correlation degree Ri:
Results and Analysis
Variation of SOC, STN, and STP Contents and SOCD, STND, and STPD With Soil Depth on Different Slope Aspects
As is shown in Figure 2, the contents of SOC, STN, and STP at 0–100 cm varied from 1.65–12.87, 0.45–1.53, and 0.07–0.78 g/kg, and the variations were significant (p < 0.05). The SOC content showed a significantly decreasing trend with soil depth at all sampling positions, and the SOC content at 0–10 cm was about 2–3 times larger than that at 80–100 cm. STN content decreased first and then increased with depth, and 80 cm was the cut-off point. STP content increased significantly (p < 0.05) with depth, and STP content at 80–100 cm was 4–6 times that of surface layer. The STN and STP content showed an increasing trend along the southern to northern slope aspect, except for SOC content (Figure 2).
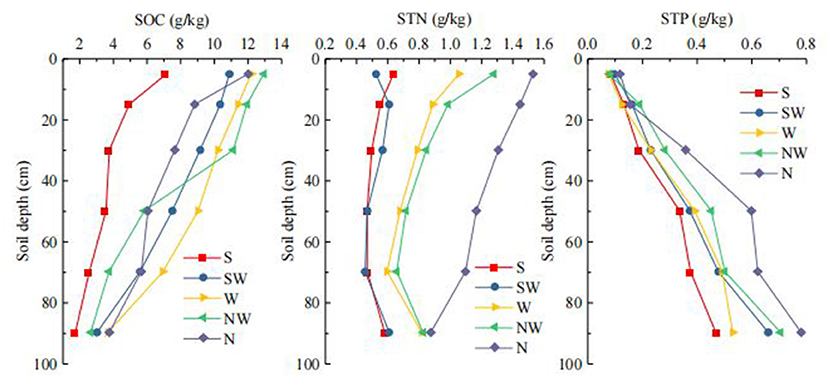
Figure 2. Variation of SOC, STN, STP contents with soil depth on different slope aspects. S, southern aspect; SW, southwest aspect; W, western aspect; NW, northwest slope aspect; N, northern slope aspect. The same to bellow.
As is shown in Figure 3, SOCD, STND, and STPD ranges between 3.9–9.5, 0.58–1.35, and 0.33–0.56 kg/m2 in the 0–100 cm soil layer for all the slope aspects. There were significant differences among different slope aspects (p < 0.05). In the 0–60 cm, the SOCD and STND accounted for more than 75 and 64% of the total soil layer (0–100 cm). Below 40 cm, the STPD accounted for more than 81% of 0–100 cm and showed an overall increasing trend with the increase of soil depth.
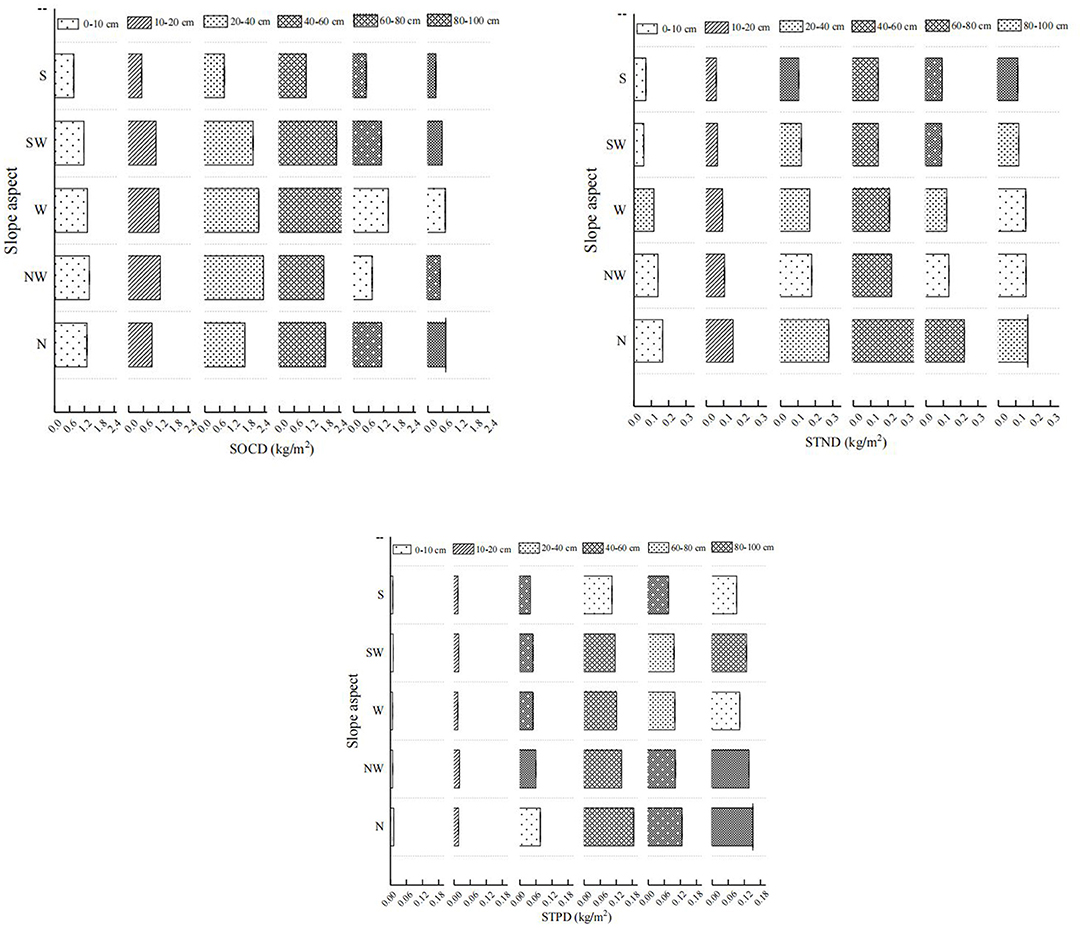
Figure 3. Variation of SOCD, STND, and STPD with soil depth on different slope aspects.
Variations of Soil Properties and Vegetation Along the Slope Aspects
Significant differences between the two slope aspects were found in soil properties and vegetation (Table 1). θ, SOC, SOCD, STN, STP, Ri, VC, and BMag on the northern slope aspect were higher than those on the southern slope aspect except for ST, and their average values were 1.35, 1.70, 1.78, 2.32, 1.69, 1.75, 2.12, and 1.93 times higher than those on the southern slope aspect. ST on the northern slope aspect was 6.77 °C lower than the southern slope aspect. Although the value of pH and ρ on the southern slope aspect was greater than on the northern slope aspect, the difference was not significant (Table 1).
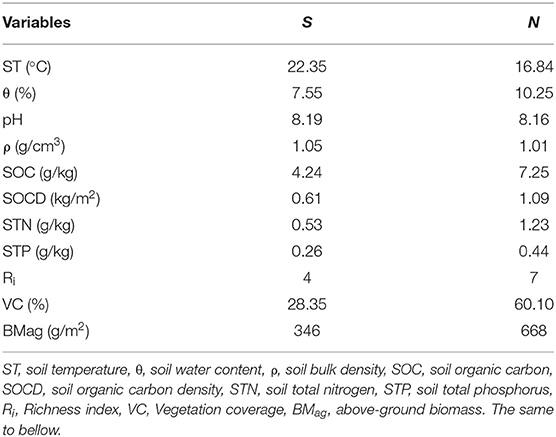
Table 1. The average value of soil variables to a 100 cm soil depth and vegetation on the southern and northern slope aspects.
Vertical Variation of Soil Properties
On the northern slope aspect, θ (0–0.1 m) was significantly greater than θ in the other soil layers. On the southern slope aspect, a decreasing trend in θ occurred, where θ (0.2–0.4 m) was minimum, followed by an increasing trend in θ with a further increase in depth. On both the southern and northern slope aspects, soil pH showed an increasing trend with soil depth. Soil pH on the southern slope aspect were all greater than on the northern slope aspect. On both the southern and northern slope aspects, ρ decreased with soil depth from the surface to 100 cm. For all soil layers there was no significant difference in ρ between the two slope aspects. In terms of nutrient content, the contents of SOC, STN, and STP in each soil depth were all higher on the northern than southern slope aspect. The contents of SOC and STN decreased gradually with soil depth, while the content of STP increased gradually. The SOC and STN contents of 0-40 cm northern slope aspect were significantly different from those of the southern slope aspect. There was no difference in STP content between the two slope aspects at 0–20 cm, but the difference between 40 and 100 cm was more and more significant (Figure 4).
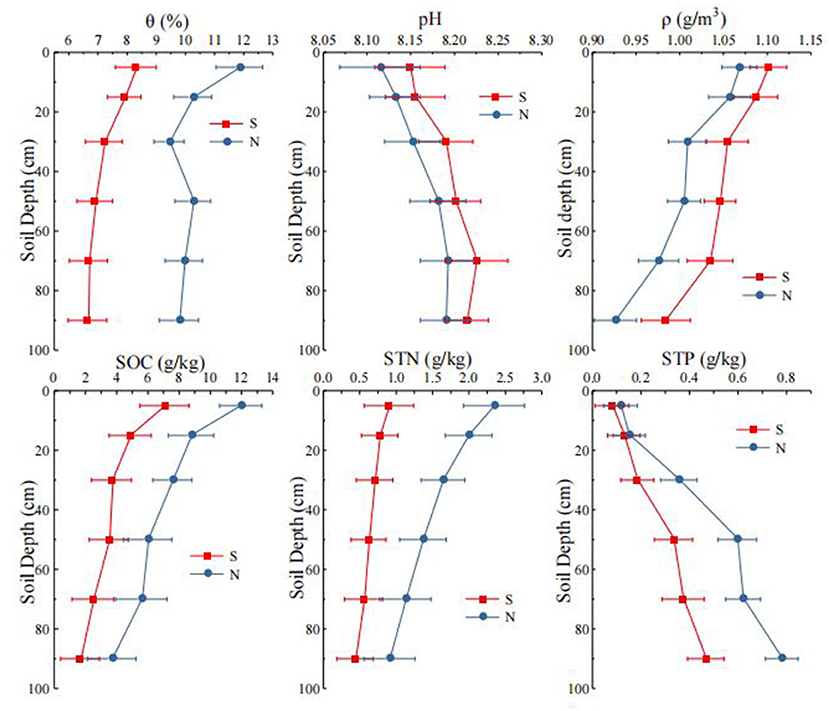
Figure 4. Vertical distribution of soil properties on different slope aspects. θ, soil water content, ρ, soil bulk density, S, southern slope aspect, N, northern slope aspect. The same to bellow.
The Rates of Decrease in SOC, STN, and STP Contents and SOCD, STND, and STPD With Soil Depth
With all slope aspects sites pooled, the average decreasing rates γ for SOC, STN, and STP contents were 0.38, 0.36, and −0.47, respectively (Figure 5), and γ for SOC, STN, and STP densities were 0.39, 0.35, and −0.52, respectively (Figure 6). As the STP content gradually increases with soil depth, the γSTP is negative. After calculating specific-slope aspect γ for SOC, STN, and STP, we found γSOC > γSTN > γSTP for both content and density (Figure 7). This meant that the difference between deep soil and surface soil was larger in SOC. Although γSTP is negative, the size of the value indicates that there is a great difference between surface soil and deep soil both content and density. For a single soil nutrient, we found that both the content and density of γN > γ All > γS (Figure 7), which also indicated that there were significant differences between the southern and northern slope aspect in terms of both the content and the decreasing rates.
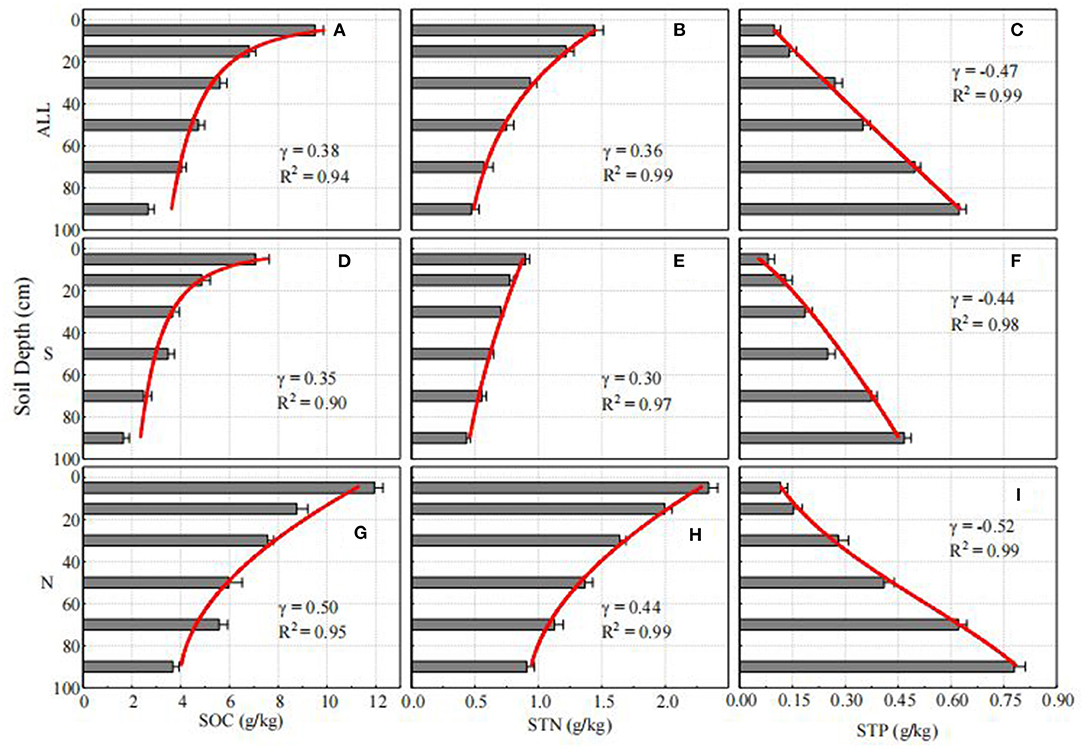
Figure 5. Vertical distributions of contents and the decreasing rate of SOC, STN, and STP along depth in the top 100 cm for all slope aspects (A–C), the southern slope aspects (D–F), and the northern slope aspects (G–I).
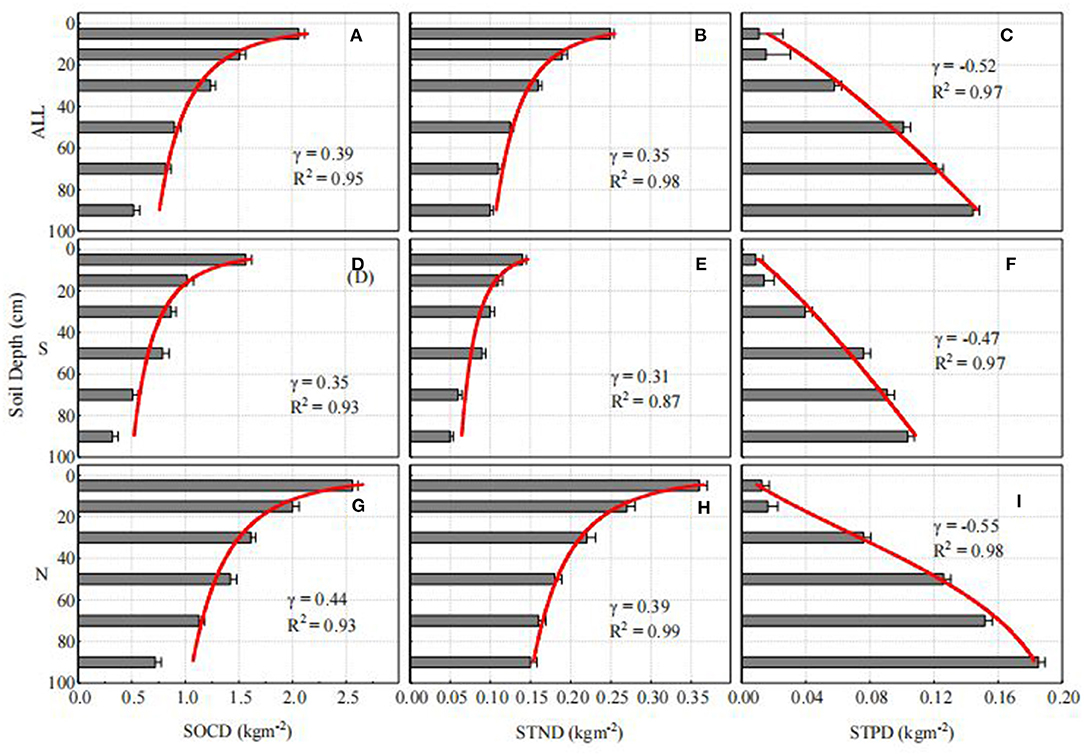
Figure 6. Vertical distributions of SOCD, STND, STPD and the decreasing rate along depth in the top 100 cm for all slope aspects (A–C), the southern slope aspects (D–F), and the northern slope aspects (G–I).
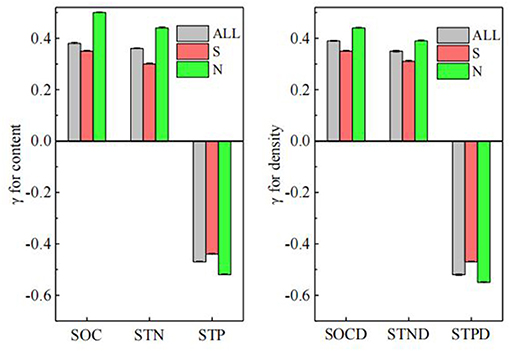
Figure 7. Comparisons of decreasing rates in soil nutrients along depth (γ) among all slope aspects and between the southern slope aspects and the northern slope aspects.
The Effects of Factors to SOC, STN, and STP on Different Slope Aspects
According to the gray correlation degree results (Tables 2–4), the correlation degree between soil physical and chemical properties and SOC, STN, and STP contents on different slope aspects was between 0.59–0.88, 0.57–0.83, and 0.52–0.89, respectively. On the whole, soil physical and chemical properties have a high correlation degree with SOC and STN contents, with a high possibility of comprehensive influence, but a low degree of overall correlation with STP content. The correlation degree of SOC and STN content with soil physical and chemical properties was the highest on the northern slope, and the correlation degree of SOC content with electrical conductivity (EC), ST, ρ, θ, and STN content was above 0.8. The correlation degree of STN content with EC, ST, ρ, and SOC content was above 0.8. There was a high correlation between STP content and soil physical and chemical properties on the southern slope. From the perspective of single soil factor, the correlation degree of EC, ρ, STN, and SOC content on five slope aspects is above 0.73. The correlation degree of ST, EC, ρ, SOC, and STN content on five slope aspects were all above 0.7. On the five slope aspects, only pH and STP content had a correlation degree above 0.81, and other influencing factors had no significant effect on STP content.
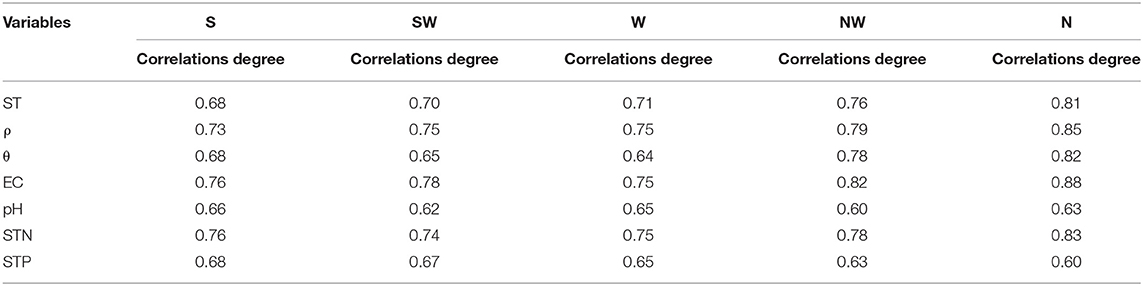
Table 2. Correlations between soil physical and chemical factors and SOC on different slope aspects.
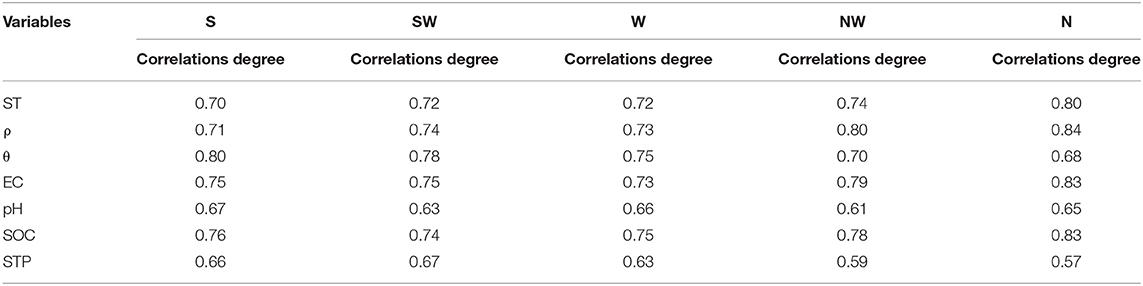
Table 3. Correlations between soil physical and chemical factors and STN on different slope aspects.
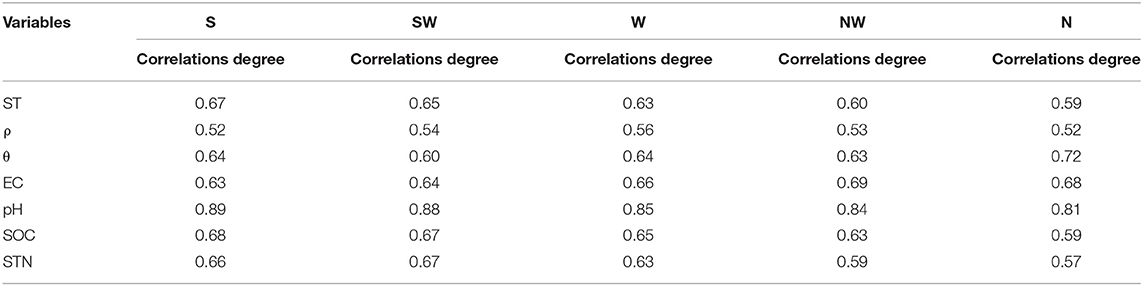
Table 4. Correlations between soil physical and chemical factors and STP on different slope aspects.
Discussion
Distribution Pattern of SOC, STN, and STP Contents and SOCD, STND, and STPD
The results show (Figures 2, 3) that the SOC, STN, and STP contents and SOCD, STND, and STPD on the northern slope aspects are significantly higher than other slope aspects, and STN and STP gradually increase from the southern to northern slope aspects, which is consistent with the research results of Lenka et al. (26) and Huang et al. (3). This distribution pattern was probably due to the heterogeneity of the ST on the slope aspects. Topographic obstructions and aspects affect the radiation distribution (12). The potential annual direct incident radiation on the southern slope aspect was about 8, 37, and 93% higher than on the southwestern, western, and northern slope aspect, respectively (27). Higher radiation resulted in higher ST, which led to faster decomposition of soil organic matter, and consequently less accumulation of the SOC in soil on the southern slope aspect compared with the northern slope aspect (7), the northern slope aspect received less solar radiation, humidity, and low ST, which inhibited the decomposition of organic matter by soil microorganisms, leading to increased accumulation of SOC, STN, and STP (15). Chen et al. (7) found lower SOC and STN contents on the southern slope aspect rather than the relatively more shaded northern slope aspect. A relatively high P content was observed in the soils on the relatively cool northern slope aspect, suggesting that vegetation on the southern slope aspect absorbed a relatively higher amount of P in order to obtain a richer biomass (28).
The current research found that the SOC and STN contents decreased with soil depth (Figure 2), and the decrease of STN content was related to organic matter (29). STP content increased with soil depth (Figure 2), the results indicated that the vegetation litter had little influence on STP in the topsoil, and the main source of STP in soil is mineral weathering. The content of STP on the surface is too low, which is mainly due to the uptake of P by the growth of surface plants, because the roots of plants are mainly distributed in the 0–30 cm soil layer. Vegetation under semi-arid climatic conditions is principally controlled by soil water storage capacity and soil depth (30). With the deepening of soil layers, the soil environment becomes relatively closed, the variation range of soil density decreases, the input amount of organic matter and microbial activities weaken, the content of organic carbon in deep soil decreases and the change is more stable than that in surface soil, and the SOC, STN, and STP in soil with different slope aspects show obvious vertical distribution characteristics. And we found that the 0–60 cm SOCD and STND accounted for more than 75 and 64% of 0–100 cm, indicating that SOC and STN had similar surface aggregation phenomenon (31). The important reason for this phenomenon is that the vertical distribution pattern of plant roots and the accumulation of organic residues and microbial activities occurred in the first 30 cm of the soil layer (29, 32). Compared with the deep soil, the surface soil has a large amount of plant litter, which makes the organic matter returned to the soil increase, and the surface soil has a better structure, which is conducive to water and air permeability, which provides the basic conditions for the decomposition of litter and indirectly improves the quality of surface SOC (33), this is also consistent with the research results of Li et al. (34) and Quan et al. (35). In this study, STP content increased with soil depth, while STP content in surface layer was low, which may be due to the absorption of P by roots of surface vegetation (36, 37). Meanwhile, it also reflected that SOC, STN, and STP contents had no significant interaction in terms of soil depth.
Potential Cause for the Difference and Vertical Distribution of Soil Properties on Different Slope Aspects
The large differences in microclimate induced by aspect had resulted in large variability in vegetation patterns (Table 1), which in turn affected the patterns of SOC, STN, and STP (38). ST and θ are the most important driving factors affecting soil properties and soil structure in hill ecosystems, as well as affecting carbon cycle, nitrogen mineralization, and nitrification rates, and the conversion rate of organic matter to P, and thus play an important role in regulating soil SOC, STN, and STP balance (39). As shown in Table 1, the ST and θ of the northern slope aspect were significantly different from that of the southern slope aspect, which was an important reason for the significant difference in SOC, STN, and STP contents between the two slope aspects. Although Sonmez et al. (40) found that soil pH decreased with soil depth, the current study revealed a different pattern (Figure 4). This was likely due to the litterfall decomposition in the study area, which contributed organic acids to the topsoil, lowering soil pH (59). However, soil pH is greater in the deeper layers due to the breakdown of the organic acids in the topsoil (42). The decreasing trend of ρ with soil depth may be related to the issue of the declining effects of compaction and soil hardening from the surface (43).
The SOC content decreased with soil depth, as was found by most studies (20, 44, 45, 58). The greater SOC in upper soil layers was related to above-ground litter (46), along with plant roots and their exudates (47, 48). With an increase of soil depth, the influence of litter weakened, and root presence also decreased. However, below 0.6 m, SOC increased slightly. This may be due to the stability of deeper SOC. Chang et al. (49) found that the sub soil environment was not favorable to decomposition. Powlson et al. (50) and Ussiri and Lal (51) also showed that SOC in topsoil is more sensitive to soil perturbations than SOC in sub soil. The vegetation coverage and biomass of the northern slope aspect were higher than that of the southern slope aspect (Table 1), the plants had deeper roots, and the relatively rich vegetation coverage could reduce the loss of SOC, STN, and STP caused by the rainy season precipitation. The higher soil water content on the northern slope aspect can effectively improve the habitat of soil microorganisms, enrich the quantity and diversity of soil microorganisms, and create favorable conditions for litter decomposition and soil nutrient release. On the southern slope aspect, plants have shallow roots, sufficient illumination, high temperature, large evaporation and low water content, which affect the storage and accumulation of SOC, STN, and STP.
We found that the declining rates of SOC and STN on the southern slope were lower than the mean, indicating that the surface soil of the southern slope was more vulnerable to soil organic matter loss because of their lower plant coverage and more severe surface soil weathering (52). Since the main source of STP is parent material weathering, the P on the soil surface is used for plant absorption and natural weathering (53), resulting in a higher phosphorus content in deeper soil than the surface, resulting in a negative reduce rate.
The Effect Factors on SOC, STN, and STP
The results show that the correlation degree between soil physical and chemical factors and SOC content was above 0.6 on different slope aspects, and it has influence on SOC in different degrees (Table 2). Soil density, porosity, and other properties will affect soil texture, change soil permeability and water holding capacity, change the growth and development of plant roots and microbial activity conditions, and then affect the SOC and STN contents (32). Wang et al. (54) found that SOC as the cementing agent of soil aggregates has a direct effect on soil capillary porosity and soil density by affecting soil texture and structure. The influence of EC and soil plant roots show higher response relationship with SOC content, which is similar to the conclusion drawn by Zhao et al. (55). STN mainly comes from the accumulation and decomposition of organic matter. SOC as an important energy source of microbial activities that affects the decomposition of organic matter and then affects STN content, especially the available nitrogen in the soil (56). STP comes from soil organic matter and soil-forming minerals. After organic carbon mineralization, most of the soil phosphorus finally exists in inorganic form in soil for plant use. Soil pH was closely related to soil microbial activity. Too high or too low pH values will affect the activity of soil microorganisms and reduce the conversion rate of organic carbon (57) and the rate of mineralization of soil-forming minerals. Therefore, soil pH is the main factor affecting STP content.
Conclusions
In this study, the SOC, STN, and STP contents and SOCD, STND, and STPD on the northern slope were greater than those on the southern slope aspect and the differences were significant. The three vegetation indices (Ri, VC, and BMag) on the northern slope aspect were greater than those on the southern slope aspect. The SOC, STN, and STP contents and SOCD, STND, and STPD were mainly in the 0–60 and 60–100 cm soil layers. Slope aspect was the most important factor affecting SOC, STN, and STP contents. γSOC > γSTN > γSTP for both content and density. For a single soil nutrient, both the content and density was γN > γ All > γS, which also indicated that there were significant differences between the southern and northern slope aspect in terms of both the content and the decreasing rates. The correlation degree between soil properties and SOC and STN is above 0.6, the overall correlation with STP content was <0.6. Therefore, the management of ecosystems for conservation and restoration should pay special attention to soil protection.
Data Availability Statement
The original contributions presented in the study are included in the article/supplementary material, further inquiries can be directed to the corresponding author/s.
Author Contributions
ML: funding acquisition, supervision, writing—review, and editing. RY: writing—original draft and conceptualization. LL: visualization. LX: data curation. RM: formal analysis. GZ: resources. All authors contributed to the article and approved the submitted version.
Funding
This research was supported by the National Natural Science Foundation of China (No.31760135).
Conflict of Interest
The authors declare that the research was conducted in the absence of any commercial or financial relationships that could be construed as a potential conflict of interest.
Publisher's Note
All claims expressed in this article are solely those of the authors and do not necessarily represent those of their affiliated organizations, or those of the publisher, the editors and the reviewers. Any product that may be evaluated in this article, or claim that may be made by its manufacturer, is not guaranteed or endorsed by the publisher.
Acknowledgments
Thanks to our graduate team for their assistance in collecting and preparing soil samples for laboratory measurements.
References
1. Yu BW, Liu GH, Qing S. Effects of land use changes for ecological restoration on soil moisture on the chinese loess plateau: a meta-analytical approach. J Forest Res. (2020) 31:109–18. doi: 10.1007/s11676-018-0760-0
2. Fu BJ, Yu L, Lu YH, He CS, Yuan Z, Wu BF. Assessing the soil erosion control service of ecosystems change in the Loess Plateau of China. Ecol. Complex. (2018) 8:284–93. doi: 10.1016/j.ecocom.2011.07.003
3. Huang YM, Liu D, An S. Effects of slope aspect on soil nitrogen and microbial properties in the Chinese Loess region. Catena. (2015) 125:135–45. doi: 10.1016/j.catena.2014.09.010
4. Tang ZY, Xu WT, Zhou GY. Patterns of plant carbon, nitrogen, and phosphorus concentration in relation to productivity in China's terrestrial ecosystems. Proc Natl Acad Sci USA. (2018) 115:4033–8. doi: 10.1073/pnas.1700295114
5. Siepel H, Vogels J, Bobbink R, Bijlsma RJ, Jongejans E, Waal R, et al. Continuous and cumulative acidification and N deposition induce P limitation of the micro-arthropod soil fauna of mineral-poor dry heathlands. Soil Biol Biochem. (2018) 119:128–34. doi: 10.1016/j.soilbio.2018.01.025
6. Wang J, Wang XT, Liu GB, Wang GL, Wu Y, Zhang C. Responses of soil microbial resource limitation to multiple fertilization strategies. Geoderma. (2020) 363:1–10. doi: 10.1016/j.geoderma.2019.114148
7. Chen LF, He ZB, Zhu X, Du J, Yang J. Impacts of afforestation on plant diversity, soil properties and soil organic carbon storage in a semi-arid grasslands of northwestern China. Catena. (2016) 147:300–7. doi: 10.1016/j.catena.2016.07.009
8. Ayoubi S, Mokhtari Karchegani P, Mosaddeghi MR, Honarjoo N. Soil aggregation and organic carbon as affected by topography and land use change in western Iran. Soil Tillage Res. (2012) 121:18–26. doi: 10.1016/j.still.2012.01.011
9. Norouzi M, Ayoubi S, Jalalian A, Khademi H, Dehghani AA. Predicting rainfed wheat quality and quantity by artificial neural network using terrain and soil characteristics. Acta Agric Scand Sec B Soil Plant Sci. (2010) 60:341–52. doi: 10.1080/09064710903005682
10. Ajami M, Heidari A, Khormali F, Zeraatpisheh M, Gorji M, Ayoubi S. Spatial variability of rainfed wheat production under the influence of topography and soil properties in loess-derived soils, Northern Iran. Int J Plant Product. (2020) 14, 597–608. doi: 10.1007/s42106-020-00106-4
11. Tajik S, Ayoubi S, Lorenz N. Soil microbial communities affected by vegetation, topography and soil properties in a forest ecosystem. Appl Soil Ecol. (2020) 149:103–14. doi: 10.1016/j.apsoil.2020.103514
12. Zhang YL, Li X, Bai YL. An integrated approach to estimate shortwave solar radiation on clearsky days in rugged terrain using modis atmospheric products. Solar Energy. (2015) 113:347–57. doi: 10.1016/j.solener.2014.12.028
13. Zhang XF, Adamowski JF, Liu C, Zhou J. Which slope aspect and gradient provides the best afforestation-driven soil carbon sequestration on the china's loess plateau? Ecol Eng. (2020) 147:105782. doi: 10.1016/j.ecoleng.2020.105782
14. Amezaga I, Onaindia M. Grazing intensity, aspect, and slope effects on limestone grassland structure. Rangel Ecol Manag. (2009) 57:606–16. doi: 10.2307/4004016
15. Qin YY, Feng Q, Holden NM, Cao J. Variation in soil organic carbon by slope aspect in the middle of the Qilian Mountains in the upper Heihe River Basin,China. Catena. (2016) 147:308–16. doi: 10.1016/j.catena.2016.07.025
16. Qin S, Fan Y., Liu H. Correlation between topographic factors and spatial distribution of soil nutrients. Res Soil Water Conserv. (2008) 15:46–9. doi: 10.1163/156939308783122788
17. Zhang K, Xu HM, Li YY. Effects of slope aspect and plant community on soil organic carbon and nitrogen in the ecotone of water and wind erosion. J Soil Water Conserv. (2018) 32:158–67.
18. Tischer A, Potthast K, Hamer U. Land-use and soil depth affect resource and microbial stoichiometry in a tropical mountain rainforest region of southern Ecuador. Oecologia. (2014) 175:375–93. doi: 10.1007/s00442-014-2894-x
19. Li Y, Huang ML, Hua JL, Zhang ZT, Ni LX, Li P, et al. Field observations of soil water content and nitrogen distribution on two hillslopes of different shape. Hydrology. (2015) 525:694–705. doi: 10.1016/j.jhydrol.2015.04.028
20. Cao JJ, Tian H, Adamowski JF, Zhang XF, Cao ZJ. Inflfluences of afforestation policies on soil moisture content in China's arid and semi-arid regions. Land Use Policy. (2018) 75:449–58. doi: 10.1016/j.landusepol.2018.04.006
21. Liu ZP, Shao MA, Wang YQ. Spatial patterns of soil total nitrogen and soil total phosphorus across the entire Loess Plateau region of China. Geoderma. (2013) 197:67–78. doi: 10.1016/j.geoderma.2012.12.011
22. Qin L, Ma XZ, Wu SR, Tan L, Fan YC, Guo W. Characteristics of soil microbial biomass nitrogen and soluble nitrogen between typical native broad-leaved and Eucalyptus plantations in southern subtropical China. Chin J Appl Environ Biol. (2017) 23:678–84.
23. Lu RK. Methods of Soil Agricultural Chemistry Analysis. Beijing: Chinese Agricultural Science and Technology Press (1999).
24. Bao SD. Agricultural Chemistry Analysis of Soil (in Chinese). Beijing: China Agriculture Press (2000).
25. Jobbágy, EG, Jackson RB. The vertical distribution of soil organic carbon and its relation to climate and vegetation. Ecol Appl. (2000) 10:423–36. doi: 10.2307/2641104
26. Lenka NK, Sudhishri S, Dass A, Choudhury PR, Lenka S, Patnaik U. Soil carbon sequestration as affected by slope aspect under restoration treatments of a degraded alfisol in the Indian sub-tropics. Geoderma. (2013) 204:102–4. doi: 10.1016/j.geoderma.2013.04.009
27. Zhu M, Feng Q, Qin Y. Soil organic carbon as functions of slope aspects and soil depths in a semiarid alpine region of northwest china. Catena. (2017) 152:94–102. doi: 10.1016/j.catena.2017.01.011
28. Li TY, Zeng JM, He BH, Chen ZP. Changes in soil C, N, and P concentrations and stoichiometry in karst trough valley area under ecological restoration: the role of slope aspect, land use, and soil depth. Forests. (2021) 12:144. doi: 10.3390/f12020144
29. Schargel RP, Marvaez. Estudio de los suelos y la vegetacióegeestructura, composicióomflorística y diversidad) en bosques macrotérmicos noinundables, Estado Amazonas, Venezuela. Biollania. (2009) 9:99–109.
30. Mehnatkesh AM, Ayoubi S, Jalalian A, Sahrawat KL. Relationships between soil depth and terrain attributes in a semi arid hilly region in western Iran. J Mountain Sci. (2013) 10:163–72. doi: 10.1007/s11629-013-2427-9
31. Wang WJ, Wang BT, Li L. Responses of so different forests in Taiyue Mountain. J Arid Land Resour Environ. (2013) 27:811–20.
32. Zhou L, Li BG, Zhou GS. Advances in controlling factors of soil organic carbon. Adv Earth Sci. (2005) 20:99–107.
33. Zhao JY, Sun XY, Li SY. Soil organic carbon storage and vertical distribution of carbon and nitrogen under different forest types in the Laotudingzi Mountain of Liaoning. J Northeast Forest Univ. (2016) 44:65–74.
34. Li L, Yao YF, Qin F. Distribution characteristics of soil organic carbon density of different forests in Huanghuadianzi Watershed. J Northwest AF Univ. (2016) 44:77–82.
35. Quan W, Zheng FD, Rong J. Soil carbon density and C/N distribution of seven forest types in Wuyanling Nature Reserve, Zhejiang Province. J Nanjing Forest Univ. (2019) 43:175–80.
37. Cao Y, Zhang P, Chen Y. Soil C:N:P stoichiometry in plantations of N-fixing black locust and indigenous pine, and secondary oak forests in Northwest China. Soils Sed. (2017) 2:1–12.
38. Ai Z, He L, Xin Q, Yang T, Liu G, Xue S. Slope aspect affects the non-structural carbohydrates and c:n:p stoichiometry of artemisia sacrorum on the loess plateau in china. Catena. (2017) 152:9–17. doi: 10.1016/j.catena.2016.12.024
39. Zhang Y., Wang R, Peng X. Changes in soil organic carbon and total nitrogen in apple orchards in different climate regions on the Loess Plateau. Catena. (2021) 197:104–13. doi: 10.1016/j.catena.2020.104989
40. Sonmez S, Macar N, Demirozer AI. The influence of aspect on the vegetation of Cataldag. Proc Soc Behav. (2014) 120:566–75. doi: 10.1016/j.sbspro.2014.02.137
41. Chen LF, He ZB, Du J, Yang JJ, Zhu X. Patterns and environmental controls of soil organic carbon and total nitrogen in alpine ecosystems of northwestern China. Catena. (2016) 137:37–43. doi: 10.1016/j.catena.2015.08.017
42. Balstrøm T, Breuning-Madsen H, Krüger J, Jensen NH, Greve M. A statistically based mapping of the influence of geology and land use on soil pH, a case study from Denmark. Geoderma. (2013) 192:453–62. doi: 10.1016/j.geoderma.2012.08.024
43. Rytter R. Afforestation of former agricultural land with salicaceae species-initial effects on soil organic carbon, mineral nutrients, C:N and pH. Forest Ecol Manag. (2016) 363:21–30. doi: 10.1016/j.foreco.2015.12.026
44. Sun W, Zhu H, Guo S, Sun W, Zhu H, Guo S. Soil organic carbon as a function of land use and topography on the Loess Plateau of China. Ecol Eng J Ecotechnol. (2015) 83:249–57. doi: 10.1016/j.ecoleng.2015.06.030
45. Wang T, Kang F, Cheng X, Han H, Ji W. Soil organic carbon and total nitrogen density under different land uses in a hilly ecological restoration area of North China. Soil Tillage Res. (2016) 163:176–84. doi: 10.1016/j.still.2016.05.015
46. Laganière J, Boča A, Miegroet HV, Paré D. A tree species effect on soil that is consistent across the species' range: the case of aspen and soil carbon in North America. Forests. (2017) 8:113. doi: 10.3390/f8040113
47. Zhao F, Kang D, Han X, Yang G, Feng Y, Ren G. Soil stoichiometry and carbon storage in long-term afforestation soil affected by understory vegetation diversity. Ecol Eng. (2015) 74:415–22. doi: 10.1016/j.ecoleng.2014.11.010
48. Wu GL, Liu Y, Tian FP, Shi ZH. Legumes functional group promotes soil organic carbon and nitrogen storage by increasing plant diversity. Land Degrad Dev. (2017) 28:1336–44. doi: 10.1002/ldr.2570
49. Chang R, Fu B, Liu G, Wang S, Yao X. The effects of afforestation on soil organic and inorganic carbon: a case study of the Loess Plateau of China. Catena. (2012) 95:145–52. doi: 10.1016/j.catena.2012.02.012
50. Powlson DS, Whitmore AP, Goulding K. Soil carbon sequestration to mitigate climate change: a critical re-examination to identify the true and the false. Soil Biol. (2011) 62:42–55. doi: 10.1111/j.1365-2389.2010.01342.x
51. Ussiri DAN, Lal R. Land management effects on carbon sequestration and soil properties in reclaimed farmland of eastern Ohio. USA. Open J Soil Sci. (2013) 3:46–57. doi: 10.4236/ojss.2013.31006
52. Guo Y, Jiang M, Liu Q, Xie Z, Tang Z. Climate and vegetation together control the vertical distribution of soil carbon, nitrogen and phosphorus in shrublands in china. Plant Soil. (2020) 456:15–26. doi: 10.1007/s11104-020-04688-w
53. He MZ, Dijkstra FA, Zhang K, Li XR, Tan H. Leaf nitrogen and phosphorus of temperate desert plants in response to climate and soil nutrient availability. Sci Rep. (2014) 4:6932. doi: 10.1038/srep06932
54. Wang YQ, Wang YJ. Content of soil organic carbon in forest soil and its effects in the Three Gorges Reservoir Area. Resour Environ Yangtze Basin. (2010) 19:387–95.
55. Zhao WJ, Meng HJ, Ma J. Change features of forest soil conductivity profile in Haxi District, Qilian Mountain. Forest Sci Technol. (2018) 11:7–16.
56. Gao YN, Xu L, Lin F. Relationship between soil organic carbon distribution and soil chemical properties in mining area. J Inner Mongolia Agric Univers. (2016) 37:54–63.
57. Zhang P, Zhang T, Chen NL. Vertical distribution patterns of soil organic carbon and total nitrogen and related affecting factors along northern slope of Qilian Mountains. Chin J Appl Ecol. (2009) 20:518–25.
58. Fernández-Romero ML, Parras-Alcántara L, Lozano-García B, Clark JM, Collins C. Soil quality assessment based on carbon stratifification index in different olive grove management practices in Mediterranean areas. Catena. (2016) 137:449–58. doi: 10.1016/j.catena.2015.10.019
Keywords: slope aspect, soil depth, SOC, STN, STP, Loess plateau
Citation: Liu M, Yu R, Li L, Xu L, Mu R and Zhang G (2021) Distribution Characteristics of SOC, STN, and STP Contents Along a Slope Aspect Gradient of Loess Plateau in China. Front. Soil Sci. 1:741000. doi: 10.3389/fsoil.2021.741000
Received: 14 July 2021; Accepted: 09 September 2021;
Published: 14 October 2021.
Edited by:
Saurav Das, University of Nebraska-Lincoln, United StatesReviewed by:
Shamsollah Ayoubi, Isfahan University of Technology, IranDinesh Panday, The University of Tennessee, Knoxville, United States
Copyright © 2021 Liu, Yu, Li, Xu, Mu and Zhang. This is an open-access article distributed under the terms of the Creative Commons Attribution License (CC BY). The use, distribution or reproduction in other forums is permitted, provided the original author(s) and the copyright owner(s) are credited and that the original publication in this journal is cited, in accordance with accepted academic practice. No use, distribution or reproduction is permitted which does not comply with these terms.
*Correspondence: Minxia Liu, eGlhbWlubEAxNjMuY29t