Abstract
The use of cover crops, combined with low N fertilization and no-tillage, reduces the environmental impacts of agriculture. Legume cover crops provide N to the agroecosystem and allow N fertilization to be reduced without losing productivity, but may also increase nitrous oxide (N2O) emissions. Our main objective was to evaluate the impact of using oats, vetch, and oats+vetch mixture as cover crops on N2O emissions and summer crop yields in a maize–soybean rotation with low N fertilization to maize (32 kg N ha−1) under no-tillage. We also studied how the different cover crops affected soil variables related to N2O emissions. For the treatments that included vetch (vetch and oats+vetch), plots without N fertilization were included to evaluate if N2O emissions and crop yield were increased by low-rate N fertilization after a legume cover crop. We measured N2O emissions using static chambers in a long-term experiment located in the Argentine Pampas. We selected measurement periods in which high N2O fluxes were expected to evaluate the effect of the different cover crops during these hotspots. In the early stages of maize and soybean, the use of vetch as a cover crop increased N2O emissions compared with oats and a control without a cover crop. In those early stages, conditions for high N2O flux occurrence were promoted by the use of cover crops, as they increased soil moisture and, when vetch was the cover crop, nitrate content. Although the oats+vetch mixture reduced soil nitrate availability compared with vetch, this was not reflected lower N2O emissions. The use of oats as a cover crop did reduce N2O emissions compared with vetch and also decreased maize yields by 30.6%. The low-rate N fertilization in treatments that included vetch as a cover crop did not increase N2O emissions or yield significantly. Our study demonstrates that in low-input cropping systems under no-tillage, the use of legume cover crops can favor yields and also increase N2O emissions during the early stages of the following cash crop. Consequently, future work should explore mitigation strategies during this period.
Introduction
Nitrous oxide (N2O) is the main greenhouse gas (GHG) emitted in cropping systems. Agriculture accounts for 60% of the global emission of N2O (1), a GHG with 265–298 times the global warming potential of carbon dioxide for a 100-year timescale and the main anthropogenic cause of the ozone layer depletion (2). Most of the anthropogenic N2O emission is produced by the soil, through the microbial processes of nitrification and denitrification. These processes are controlled by soil factors such as mineral nitrogen (N) availability, moisture, and temperature (3, 4). Thus, soil and crop management, which affects soil conditions, can lead to an increased N2O emission rate (5, 6).
In many agricultural regions of the world such as Northern Europe, Canada, Northern China, and the Pampas Region of Argentina, farmers commonly grow a single crop per year (7, 8). Thus, the soil remains in fallow with scarce cover and no living vegetation for a long period, which generates inefficiencies in the annual capture of precipitation and solar radiation (9), promotes a negative carbon balance (10), and stimulates N losses by leaching (8, 11, 12).
In this context, the use of cover crops combined with low N fertilization is an alternative to the long fallow that promotes productivity and increases the provision of ecosystem services (13–16). Cover crops compete with weeds allowing for the reduced use of herbicides (17), a decrease in N leaching to groundwater (8, 12, 18–20), minimal soil erosion (21, 22), promotion of the soil’s biological activity (23), and increased soil organic matter and aggregation (8, 14, 24). Legume cover crops fix N biologically through symbiosis, enabling the reduction of N additions through inorganic fertilization (25). The N provided by legumes is gradually released compared with that from a fertilizer, which allows for better synchronization with the N requirements of the cash crop and reduces N losses (26). Although cover crops could potentially compete for both water and nutrients with the cash crop, defining the spatiotemporal niches appropriately minimizes such competition (27) and avoids negative effects on crop yield (7).
The use of cover crops in agricultural rotations is also proposed as a practice to reduce GHG emissions, mostly due to their potential to sequester carbon in the soil (8, 14, 24). However, the effect of cover crops on N2O emissions is variable (28, 29) and depends on the cover crop characteristics (species type, biomass, C/N ratio, lignin content, residue management, termination timing) (30). In a meta-analysis, Basche et al. (28) reported that in 60% of the studies the use of cover crops increased N2O emission. This occurred predominantly when the cover crop was a legume, associated with its capacity to obtain atmospheric N through biological fixation, which increases the rate of N2O emission, especially in the decomposition stage of the cover crop. This meta-analysis also reported that, with low N fertilization, emissions attributable to a legume cover crop represent a considerable portion of annual emissions (28). Additionally, under no-tillage, the cover crop residues remain on the soil surface, generating optimal conditions for denitrification due to improvement in rainwater infiltration and the contribution of soluble carbon (26, 31, 32). For all this, in systems with low N fertilization under no-tillage, to work on the mitigation of N2O emissions related to the use of legumes as cover crops is essential.
The use of grasses as cover crops tends to decrease N2O emissions, given their consumption of mineral N from the soil (33–37), but it also tends to decrease the yield of the commercial crop (38). On the other hand, legume cover crops favor not only productivity (39) but also N2O emissions, as previously stated. We hypothesize that using a mixture of grass and legume as cover crops can reduce N2O emissions without decreasing crop yield compared with legume as a cover crop. Our objectives were as follows: i) evaluate the effect of using grass, legume, and their mixture as cover crops on N2O emissions of the following cash crop, in periods in which high N2O emission rates are expected; ii) describe how the different cover crops affect some soil variables and how these variables modulate N2O emissions; iii) assess whether N2O emissions are significantly increased by low-rate N fertilization after a legume cover crop; and iv) evaluate the effect of the different cover crops on the yields of the following cash crop. For this purpose, N2O measurements were made in a long-term experiment located in the Argentine Pampas Region, using fall–winter cycle species of different families (grass, legume, and a mixture of grass and legume) as cover crops in a maize–soybean rotation.
Material and Methods
Study Site and Experimental Description
We conducted this research in a long-term experiment established in 2005 at the Pergamino Experimental Station of Instituto Nacional de Tecnología Agropecuaria (INTA) (33°51′S, 60°40′W), Province of Buenos Aires, Argentina. The soil is classified as a typic Argiudoll (USDA, Soil Taxonomy) of the Pergamino series with a silt loam A horizon with no severe erosion (<0.3% slope) and a strong argillic B horizon. Further details of the soil properties can be found in Restovich et al. (11). The climate is temperate–humid without dry season (40, 41). The average annual temperature is 16.5°C and the annual rainfall is 984 mm (period 1910–2021; Agroclimatological Network database, INTA). During the 2017–2018 and 2018–2019 agricultural seasons, when the N2O measurements were conducted, the average temperature was 17.3°C and 16.8°C, and the annual rainfall was 924 and 1,260 mm, respectively. Daily records of temperature and rainfall data registered during the experimental period are found in Figure 1.
Figure 1
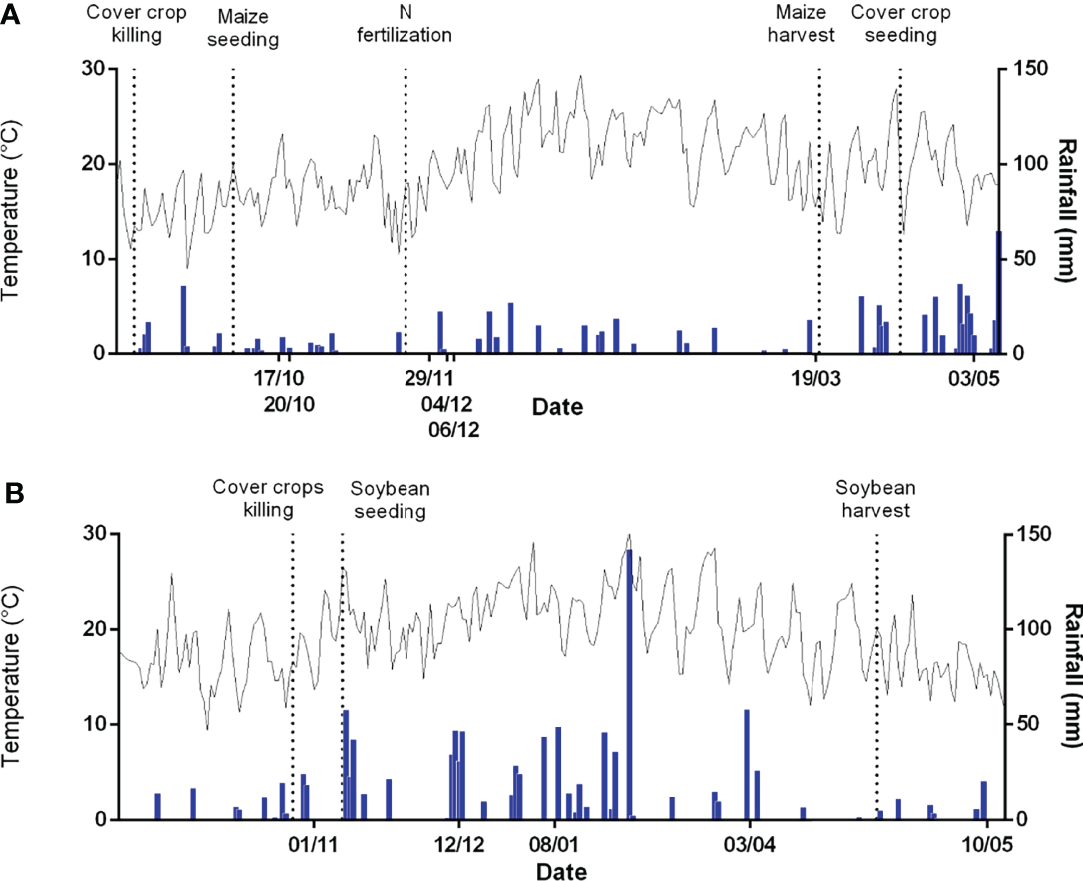
Daily temperature (°C) and precipitation (mm) in the (A) 2017–2018 (maize) and (B) 2018–2019 (soybean) growing seasons. The dotted lines indicate the times of cover crop and cash crop planting, cover crop killing, N fertilization, and cash crop harvest. The dates indicated on the x-axis show when N2O measurements were made.
The experiment has a completely randomized design with three blocks (plots of 10 × 30 m). The crop sequence is maize–soybean under no-tillage with different fall–winter species used as cover crops. The species used were oats (Avena sativa L.), vetch (Vicia sativa L.), and a mixture of oats+vetch, using planting densities of 80, 70, and 20 + 40 kg seed ha−1, respectively. In addition, a control without cover crop was included, with chemical control of weeds following the recommended practices of the region. Weeds were controlled using atrazine in pre-emergence (2 kg ha−1) and glyphosate in post-emergence (3 and 4 L ha−1 for the first and second year, respectively). The presence of pests and diseases was frequently monitored, and they remained below the application thresholds. Maize (hybrid DK747) was planted with a row distance of 0.7 m, according to the regional management (75,000 plants ha−1). At sowing, maize was fertilized with 31.5 kg ha−1 of P2O5. At the V5–6 stages (42), half of the plots (subplots) were fertilized with 32 kg N ha−1 in the form of urea incorporated between rows. The other half of the plots did not receive N fertilization. Soybean (var. DM 5.1) was planted at 0.52 m row distance (500,000 plants ha−1). This crop did not receive N fertilization but was inoculated with Bradyrhizobium sp. The vetch was inoculated with Rhizobium leguminosarum biovar viciae before planting. For this study, we selected the treatments that had N fertilization applied to maize. Additionally, for the treatments that included vetch (vetch and oats+vetch), plots without N fertilization of maize were also included: vetch-NF and oats+vetch-NF. This totals to six treatments: oats-F, vetch-F, oats+vetch-F, control-F, vetch-NF, and oats+vetch-NF.
In this long-term experiment, maize was planted in September/October and soybean in November. Therefore, the cover crops were killed in August/September before maize and in October before soybean, using 3–4 L ha−1 of glyphosate. At cover crop planting, between April and May, all plots were fertilized with 14.7 kg P2O5 ha−1 (6.4 kg P ha−1) using calcium superphosphate. The crop calendar for the measurement period can be seen in Table 1.
Table 1
| 2017–2018 | 2018–2019 | |
|---|---|---|
| Maize | Soybean | |
| Cover crop planting | May 4, 2017 | April 12, 2018 |
| Cover crop killing | September 6, 2017 | October 26, 2018 |
| Cash crop planting | October 4, 2017 | November 9, 2018 |
| N fertilization | November 22, 2017 | – |
| Cash crop harvest | March 20, 2018 | April 9, 2019 |
Cultivation calendar for the experimental plots during the agricultural seasons in which N2O measurements were carried out.
Nitrous Oxide Measurement and Emission Rate Estimation
The measurement periods were previously established and were associated with moments in which high N2O emissions could be expected (43–46) due to soil and climatic conditions (high temperature, moisture, and N availability). We decided to measure N2O emission in these hotspots to see if it differed among the treatments for these periods. These periods were as follows: after the cover crop killing, after maize N fertilization, and after the cash crop senescence. A description of the crop stage and weather conditions on each measurement date is included in Supplementary File 1. We conducted seven N2O measurements at different stages of the maize crop cycle (2017–2018 growing season) and five measurements in the soybean crop cycle (2018–2019 growing season).
N2O emissions were estimated using vented static chambers (47). The chambers were covered with reflective insulation and had two parts, namely, an anchor (buried at 8 cm deep) and a cap, sealed with water when measurements were taken. The chambers’ dimensions were 37 cm long, 25.5 cm wide, and 14 cm high. When vegetation did not exceed the height of the chambers, measurements included vegetation. In case the vegetation exceeded chamber height, we cut the plants up to 10 cm before starting the measurements. For each measurement, three 10-ml air samples were taken at 15-min intervals between 9:00 and 12:00 a.m. for all sampling dates. The N2O emission rate was calculated by the linear regression method (48). We included two chambers in each plot given the spatial variation of N2O emissions. Thus, 108 N2O observations were made on each date (2 chambers per plot × 3 blocks × 6 treatments × 3 measurement times per chamber). The concentration of N2O in the gaseous samples was estimated using an Agilent gas chromatograph with an electron capture detector (Agilent Technologies 6890N) with automatic injection at the Biochemistry Department of the Agronomy School of the University of Buenos Aires (UBA).
Soil, Climatic, and Productive Variables
A composite sample of the first 10 cm of soil was taken from each plot on every N2O measurement date to determine mineral N in the form of ammonium and nitrate , and soil moisture was measured using the gravimetric method (from which the percentage of water-filled pore space, WFPS, was calculated). We sampled for soil bulk density before starting the experiment and used a different bulk density for each treatment to calculate the WFPS, given that we found differences among treatments. Soil temperature was quantified using digital thermometers inserted up to 10 cm in the soil adjacent to each chamber. The air temperature was measured on each date before starting the sampling rounds by placing three digital thermometers at a height of 10 cm from the ground in a shaded location near the site of the experiment. Maize and soybean aboveground biomass at harvest was obtained from two randomly selected 1-m2 samples per subplot. The harvested material was oven-dried at 65°C before separating grains to determine yield.
Statistical Analysis
The N2O emission, WFPS, soil temperature, , and , variables were analyzed using a mixed model (fixed factors: date, treatment, date*treatment interaction, random factor: block). We evaluated the homogeneity of variance and residual normality for each variable. N2O data were log-transformed to meet the assumption of normality. When date*treatment interaction was significant, we analyzed the differences between treatments for each date. Yield data were analyzed using a separated ANOVA for each crop. For the comparison of means, we used the Fisher’s least significant difference (LSD) test (p < 0.05).
To analyze the relationships between N2O emission and the soil and environmental variables, we performed correlation analyses. Given the complexity to describe the linear relationships between N2O emissions and the soil variables, we performed a decision tree analysis based on the procedure of Morgan and Sonquist (49), which was previously used in the Pampas (50, 51). In this analysis, N2O emission was the dependent variable, and WDPS, , soil temperature, and air temperature were the regressor variables. The analysis separates the initial sample into more homogeneous subgroups, separating by thresholds of a regressor variable, seeking to minimize the sum of squares.
Results
Nitrous Oxide Emissions for Maize and Soybean Crops Combined With Different Predecessor Cover Crops
The effect of cover crops on N2O emissions varied depending on the date. N2O emissions presented differences between treatments (p < 0.001), measurement dates (p < 0.001), and date*treatment interaction (p < 0.001). On the first dates after the cover crop killing (both in the first and second growing seasons), significant differences between treatments and higher N2O emissions were recorded (Figure 2).
Figure 2
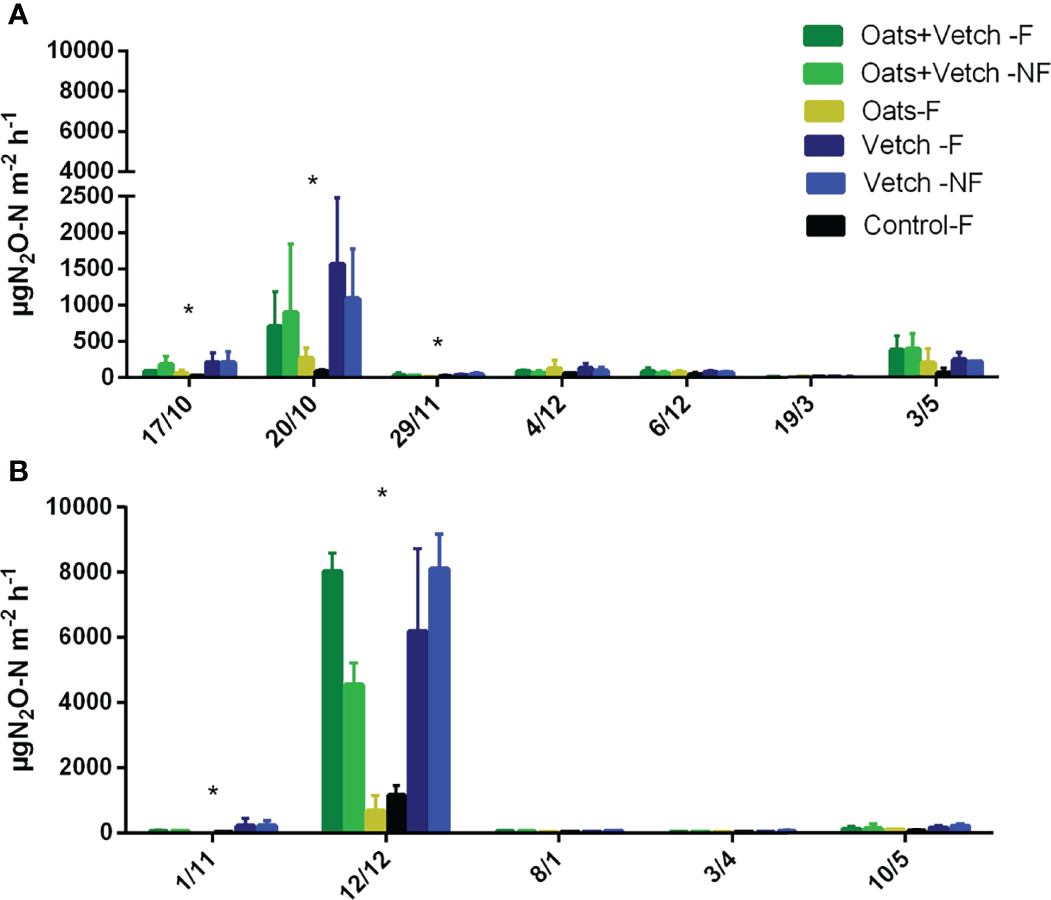
N2O emissions (μg N2O-N m−2 h−1) for the different treatments and measurement dates in (A) maize and (B) soybean. The dates indicated with an asterisk showed significant differences in N2O emissions for the evaluated treatments (p < 0.05).
During the first sampling dates, which corresponded to the period after the cover crop killing and maize planting, treatments that included vetch (vetch-F, vetch-NF, oats+vetch-F, oats+vetch-NF) showed higher N2O emission than both oats-F and the control-F with no cover crop (Figure 2A). No significant differences between the oats+vetch mixtures and the vetch as cover crops were observed in this period, even though the mixture of cover crops showed slightly lower N2O emissions than vetch as a cover crop. The highest average emission rate of the first year was observed on October 20 (16 days after planting maize). On this date, vetch-F had the highest emission rate (1,567.6 μg N2O-N m−2 h−1), with no significant differences with the rest of the treatments that included vetch (vetch-NF, oats+vetch-F, and oats+vetch-NF). The control without cover crop had the lowest emission rate (83.4 μg N2O-N m−2 h−1), with no significant differences with oats-F.
In the first measurement after N fertilization of maize (November 29), no significant difference was observed between the fertilized and unfertilized treatments (vetch-F and oats+vetch-F vs. vetch-NF and oats+vetch-NF). Instead, all treatments with vetch (sole and mixtures) had higher N2O emission rates, regardless of being fertilized or unfertilized. The emission range at that date was between 4.4 and 47.4 μg N2O-N m−2 h−1, lower than in the previous measurements. In the following measurement dates (December 4 and December 6, 12 and 14 days after fertilization), and on March 19, during maize senescence, the emission rate was low for all treatments, with no significant differences among them. The N2O values for these three dates ranged from −8 to 133 μg N2O-N m−2 h−1. Finally, in maize post-harvest (May 3), a new increment in N2O emissions occurred, with no significant differences between treatments (67–393.7 μgN2O-N m−2 h−1).
In the second growing season, the highest N2O emissions occurred again in the first measurements of the year (November 1 and December 9). As what happened in the first year, these high emissions were observed after killing the cover crops and planting the cash crop (Figure 2B). At these dates, treatments that included vetch, alone or in mixtures, showed no statistical differences between them. However, they had higher emissions than the oats and the control without cover crops. In the second year, the date with the highest average N2O emission was December 12 (it was also the highest of all moments measured), with values that ranged from 4,546.3 to 8,110.7 μg N2O-N m−2 h−1 for the treatments that included vetch and from 777.7 to 1,161.0 μg N2O-N m−2 h−1 for oats and the control, respectively (the oats monoculture and the control did not show significant differences between them). On the following dates (January 8, April 3, and May 10), the N2O emission values were lower (21.5–208.1 μg N2O-N m−2 h−1) and presented no significant differences between treatments.
Effect of Cover Crops on the Soil Factors Controlling N2O Emissions
Soil temperature had no significant differences between treatments nor date*treatment interaction. This variable only showed differences between dates (p < 0.001), associated with the air temperature variation (r = 0.6, p < 0.001) (Figure 3).
Figure 3
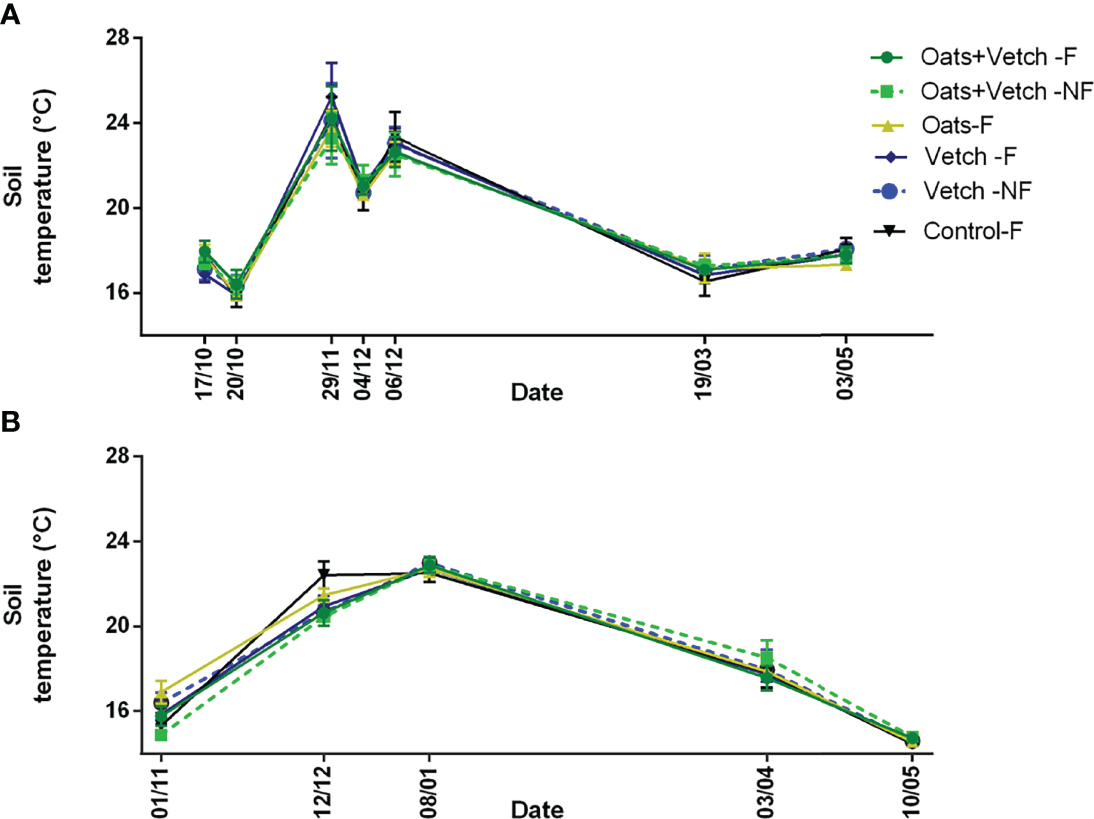
Soil temperature (°C) for the different treatments and measurement dates in (A) maize and (B) soybean.
The WFPS also showed no differences between treatments but did show differences between dates (p < 0.0001) and date*treatment interaction (p = 0.0014). In the first growing season, the differences between treatments were observed in the first two dates after the cover crop killing, in which the control without cover crop showed lower WFPS than the treatments with cover crops (Figure 4A). Rainfall before those measurements was scarce, with an accumulated rainfall of 13.8 and 50.4 mm for the 19 and 60 days preceding the first measurement. In the measurement done during the maize senescence (March 19), we found differences between treatments, with vetch-NF and the control showing higher WFPS than the other treatments.
Figure 4
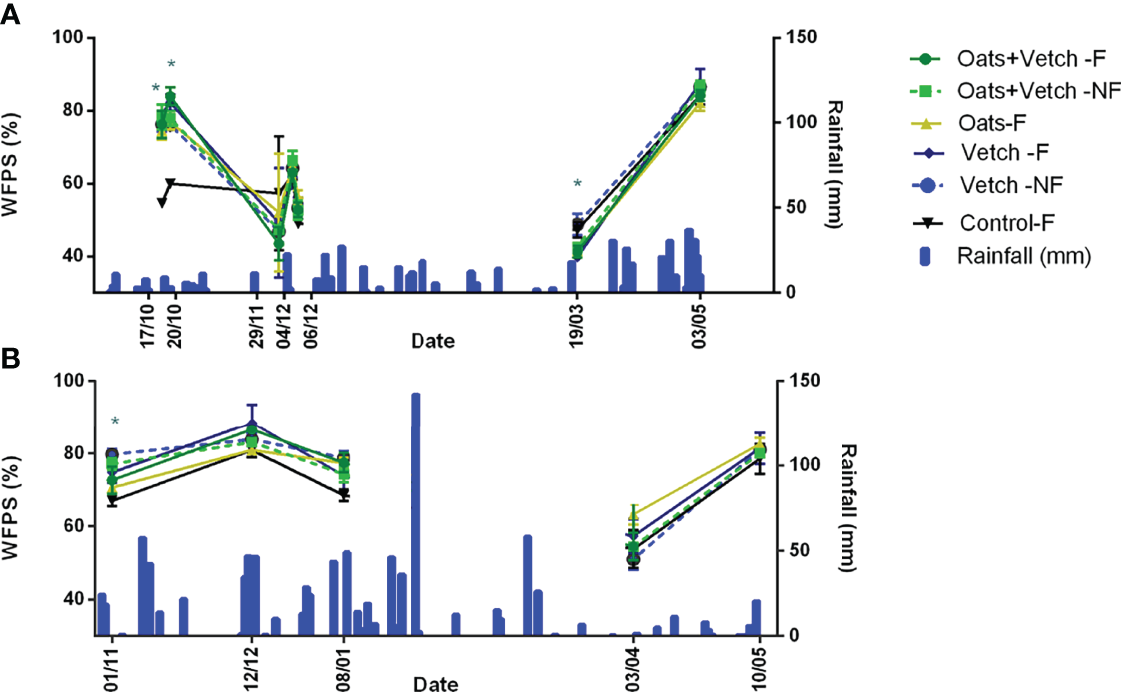
Water-filled pore space (WFPS, %) for the different treatments and measurement dates for (A) maize and (B) soybean. The dates marked with an asterisk showed significant differences in WFPS for the treatments evaluated (p < 0.05). Note that scales of the nitrate figures are different from the scales of the ammonium figures.
During the second growing season, significant differences in WFPS were observed only on the first measurement date, which was after the cover crop killing (November 1) (Figure 4B). On that date, the control without cover crop showed the lowest WFPS, vetch-NF the highest, and the remaining treatments intermediate values of WFPS. The accumulated precipitation before the first measurement date was higher than that registered for maize: 65.6 and 125 mm in the previous 10 and 60 days, respectively. In the remaining dates, no significant differences between treatments were found.
Soil , content showed differences between dates (p < 0.0001) and treatments (p < 0.0001), but no date*treatment interaction (p = 0.1463) (Figure 5). Those treatments that had vetch alone as a cover crop, whether or not combined with N fertilization to maize, had higher soil . The oats+vetch mixture (with and without N fertilization) had lower and did not show significant differences with the control without cover crops. Finally, the treatment with oats as the cover crop had the lowest soil content. During the first agricultural season, the highest contents were observed following the N fertilization of maize (especially on December 6, 2017, 14 days after N fertilization). In the second growing season, the highest was observed after soybean harvest (May 10). Contrary to expectations, dates with high N2O emissions were not coincident with those with the highest soil availability.
Figure 5
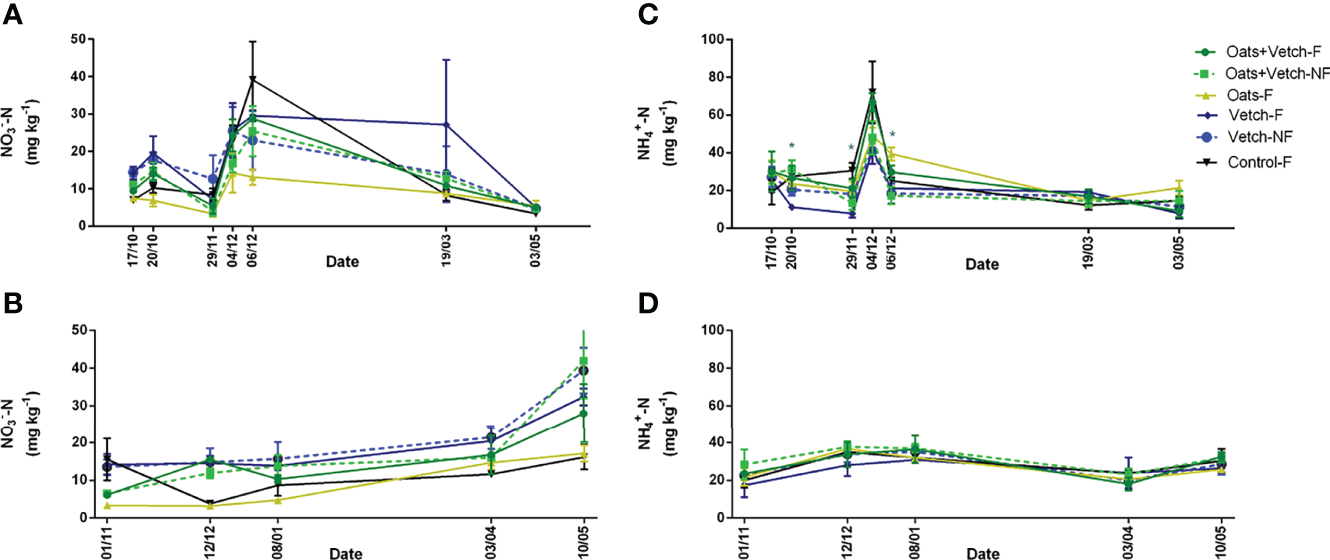
Soil nitrate and ammonium content for the different treatments and measurement dates in maize and soybean. in maize (A) and soybean (B). in maize (C) and soybean (D). The dates marked with an asterisk showed significant differences in WFPS for the treatments evaluated (p < 0.05).
Soil content presented differences between treatments (p = 0.0004), dates (p < 0.0001), and date*treatment interaction (p = 0.0081). The maximum in the soil was observed 12 days after maize N fertilization (December 4), with no significant differences between fertilized and unfertilized treatments (Figure 5). However, there were differences between treatments at the previous and following dates (7 and 14 days after N application): 7 days post-fertilization, the control without cover crop was the treatment with the highest . Oats+vetch-F, oats-F, and vetch-NF had intermediate values, with no significant differences between them, and oats+vetch-NF and vetch-F had the lowest content. On the other hand, 14 days after N fertilization, the unfertilized treatments had the lowest content, without significant differences between the vetch-F and the control-F. Concerning the evolution of content in the soil during soybean cultivation, a lower variability between dates was observed than in maize (probably because it did not receive N fertilization), with ranging from 21.6 to 34.1 mg kg−1.
Grain Yield of the Cash Crops
Maize yield showed differences among treatments (p = 0.0006; Table 2). The highest grain yields were observed in vetch-NF, vetch-F, oats+vetch-NF, and the control-F, with no significant difference between them. On the other hand, the treatment that had oats as a cover crop had the lowest maize yield. Soybean yield showed no significant differences among the treatments (Table 2).
Table 2
| Grain yield (kg ha−1) | |||
|---|---|---|---|
| Treatment | Maize | Soybean | |
| Control-F | 8,988.9 ( ± 1,298.3) ab | 4,926.3 ( ± 454.4) a | |
| Oats+vetch-F | 8,268.8 ( ± 366.3) b | 5,477.6 ( ± 592.3) a | |
| Oats+vetch-NF | 9,262.21 ( ± 546.4) ab | 5,301.3 ( ± 836.8) a | |
| Oats-F | 6,235 ( ± 251.4) c | 5,176.3 ( ± 584.6) a | |
| Vetch-F | 9,356.4 ( ± 541.2) ab | 5,400.6 ( ± 656.8) a | |
| Vetch-NF | 9,569.9 ( ± 241.3) a | 5,359.0 ( ± 186.5) a | |
Maize and soybean grain yield for the different treatments.
Different letters indicate significant differences between treatments (p < 0.05). Standard deviation values are indicated in brackets.
Relation Between Soil and Environmental Variables and N2O Emissions
N2O emissions only presented significant correlations with WFPS (r = 0.33, p < 0.0001) and air temperature (r = 0.18, p = 0.01). In both cases, these relations were positive with a low correlation coefficient. The remaining variables (soil temperature, , and ) had no significant correlations with N2O emissions.
In the decision tree analysis, WFPS was the variable that most controlled N2O emissions, air temperature the second, and mineral N content the third ( or , depending on the scenario) (Figure 6). WFPS separated the measurements into three groups: group A, with WFPS values >80.8%, which had the highest average N2O emissions ; group B, with WFPS values between 75.4% and 80.8%, which had intermediate emission values ; and group C, which included all measurements with WFPS ≤75.4% and had much lower N2O emissions . In subgroups A and B, the second most important variable was air temperature, and the highest rate of emissions occurred when it exceeded 24.8°C and 25.9°C, respectively. Within group A, with the highest emissions, the subgroup with the highest average emission rate ; had content exceeding 7.5 mg kg–1 (in addition to WFPS > 80.5 and Tair > 24.5°C). On the other hand, within group C, with lower average emissions , the lowest rate occurred with WFPS less than 74.1% and content less than 24.8 mg kg−1.
Figure 6
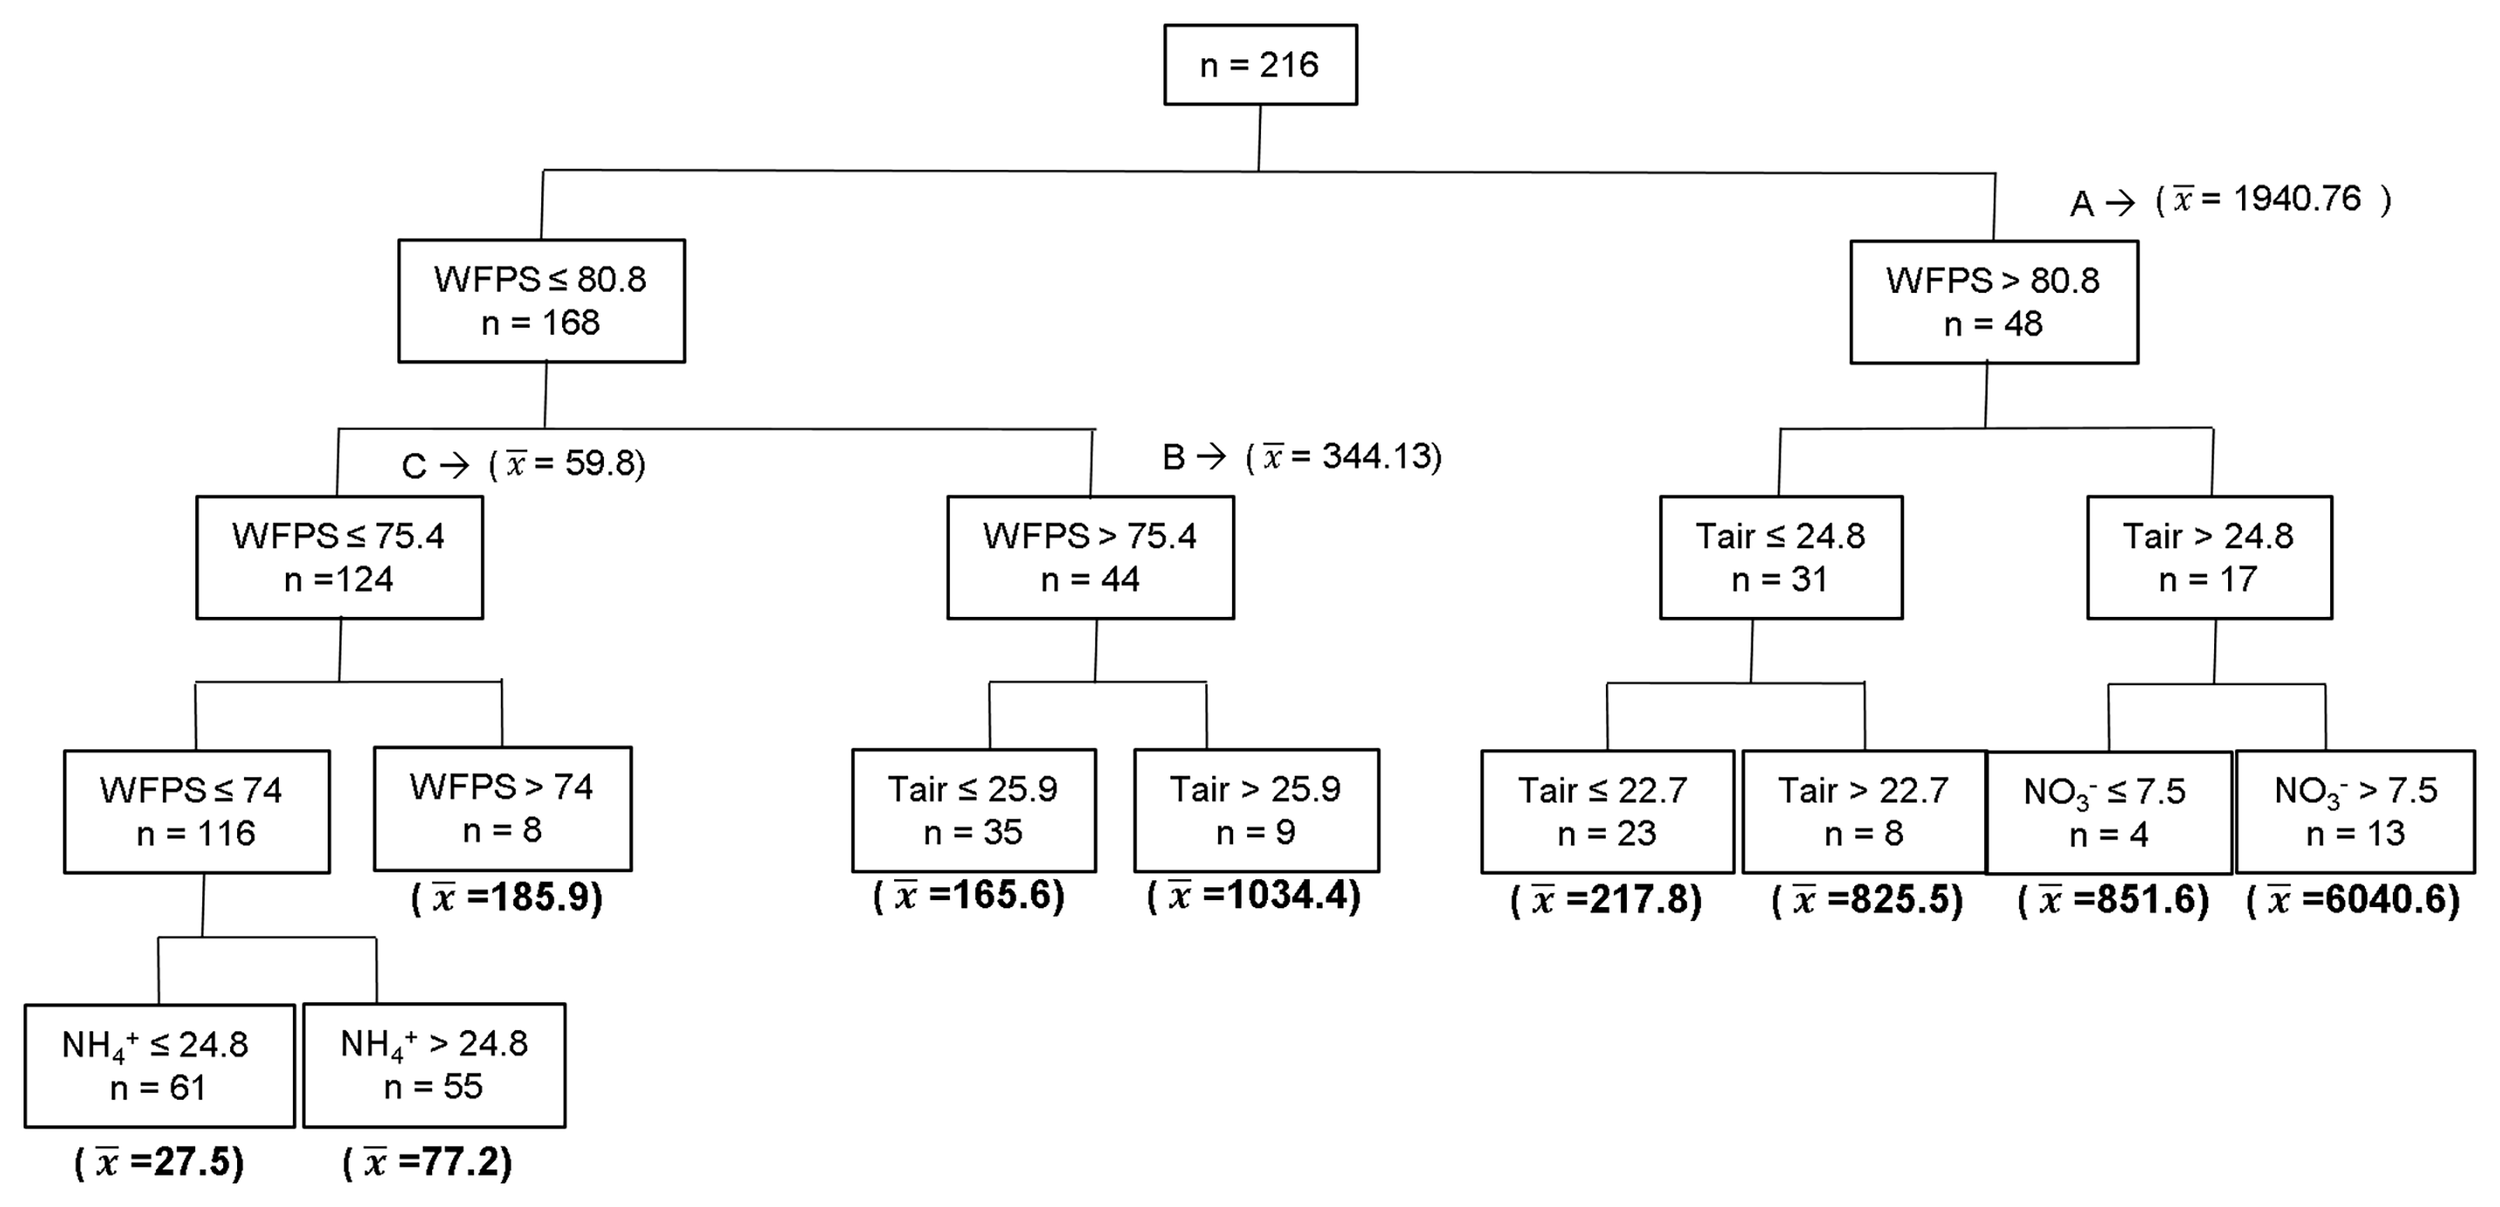
Decision tree analysis. The regressor variables were soil temperature (°C), air temperature (Tair, °C), content of N as ammonium , and N as nitrate . The average N2O emission is indicated in brackets for the different groups (μg N2O-N m−2 h−1).
Discussion
Impact of the Use of Different Cover Crops on N2O Emissions
The inclusion of oats, vetch, and a mixture of oats+vetch as cover crops only affected N2O emissions in the early stages of maize and soybean crops. These results agreed with previous papers that indicate the existence of short-lived N2O emission peaks during the decomposition of the cover crops (28, 46, 52, 53). However, the treatments that had vetch as a cover crop (alone or in mixtures) presented higher N2O emissions than oats and the control without a cover crop. Legumes, due to the high quality of their residue (e.g., low C/N ratio, low lignin content), contribute to the release of mineral N to the soil and increase biological activity, thereby promoting N2O emissions (54). On the other hand, the plots with oats as a cover crop showed no significant differences with the control during the residue decomposition period. Contrary to these results, other studies show that the use of grasses as a cover crop potentially reduces N2O emissions during this period, because they consume more mineral N from the soil during their cycle and leave a residue with a high C/N ratio, favoring the immobilization of mineral N from the soil during the decomposition of residues (33, 35). In this study, oats had lower content in the soil than the control, although this did not result in smaller N2O emissions.
The N2O emissions of the oats+vetch mixture were more similar to the emissions of the vetch treatment than to the oats as cover crops. The oats+vetch treatment had 65% vetch in its composition, which made the C/N ratio in the mixture higher than that of oats alone as a cover crop but not significantly different from that of vetch as a cover crop, as shown by previous studies in this long-term experiment (11, 14). Previous studies demonstrated that legumes growing in mixtures could transfer N to non-legumes, resulting in better N nutrition (39) and leaving N for the following crop (24). Thus, the C/N ratio of the residue from mixtures of grass and legume is lower than that of grass alone, which reduces the potential for N immobilization (55–57). The use of legume and grass mixtures as cover crops optimizes carbon and N availability, improving soil health and reducing N losses compared with legumes (40); however, in this study, it was not an effective strategy to mitigate N2O emissions compared to using grass as a cover crop.
Low-Rate N Fertilization and Its Impact on Nitrous Oxide Emissions Depending on the Cover Crop Predecessor
N fertilization applied to maize in treatments that included vetch as a cover crop did not increase N2O emissions. In our experiment, not only was the N rate low (32 kg N ha−1), which limited N2O emissions, but also the N applied at the V5–6 of maize, which reduces N2O losses compared with fertilizing at planting (58). Even though (for an equal N input) N2O emissions are higher when the N source is a synthetic fertilizer than when it is the residue of a legume (27), our study reinforces the idea that, in low N application systems, emissions derived from the cover crop residue represent a significant proportion of annual N2O emissions (29).
The combination of N provided by the fertilizer and a high C/N ratio residue (e.g., oats) can stimulate N2O emissions because the soluble C input from the crop residue provides energy to the microorganisms involved in the nitrification and denitrification processes (6, 59). However, in our study, the combination of the oats residue with low-rate N fertilization did not result in increased N2O emission post-fertilization, compared with the control without a cover crop. This result could be associated with the low N application rate, as increases in N2O emissions are expected at higher N rates (29). Indeed, the inclusion of oats as a cover crop with low N fertilization is a strategy that promotes soil carbon sequestration (15) without increasing N2O emissions.
Cover Crops and Their Effect on the Variables That Modulate Nitrous Oxide Emissions
The highest N2O emission rates were observed with high WFPS, air temperature, and soil content. This is reported by the literature, which defines the existence of high-emission hotspots when these three factors are combined (33, 60–62). During the early stages of maize and soybean crops, we observed that the use of cover crops enhanced the conditions for hotspot occurrence, as they favor high WFPS and nitrate content, especially after vetch.
During the early phases of maize and soybean, those treatments that had a cover crop showed higher soil moisture than the control without a cover crop. This is relevant given that WFPS, both in this study and others (52, 63), was the main factor explaining the variability in N2O emission rate. Although cover crops consume water during their growth, once their cycle is finished, the remaining mulching favors water infiltration and decreases water evaporation, especially under no-tillage (32, 33). This affects especially the first centimeters of the soil, where the biological processes involved in N2O emission mainly occur. In rainfed agriculture, the cover crop killing date has been adjusted to avoid reductions in available water for the following crop, although the outcome could depend on the timing and volume of rainfall (64–66). In this study, in both growing seasons, the use of cover crops resulted in an increase of the WFPS during the early stages of the cash crop cycle, which favored N2O emissions. This means that there may be a trade-off between productivity and N2O emissions, since an early cover crop killing not only favors water accumulation in the soil and productivity but also stimulates N2O emissions during the initial phases of the cash crop. A late cover crop killing could have the opposite effect given the increased water consumption by cover crops resulting in a lower moisture content of the soil during the early stages of the cash crop. Although mineral N content was the third factor controlling N2O emissions after WFPS and air temperature, the highest N2O fluxes happened when all three conditions occurred simultaneously: high WFPS and air temperature and content exceeding 7.5 mg kg−1. Treatments that had vetch (fertilized or not) as a cover crop showed higher content throughout the measurements. On the other hand, the oats+vetch mixture was effective in reducing the content of the soil compared with vetch alone, although this reduction was possibly not enough to limit N2O emission. Future studies could explore if the use of a lower proportion of vetch in the mixture with grasses (vetch was approximately 65% of the biomass in this work) allows achieving better regulation of N losses without affecting maize yield.
In this paper, contrary to what can be expected (45), N2O emissions during maize senescence were higher than those recorded during soybean senescence. Even though soybean has a lower C/N ratio than maize which resulted in higher soil content in soybean senescence (Figure 5), both air temperature and WFPS were considerably lower in soybean senescence than in maize (14.8°C vs. 21.0°C and 71.4% vs. 85.2%), therefore limiting N2O emissions as shown with the decision tree analysis.
Effect of Cover Crops on Maize and Soybean Yield
The use of oats as a cover crop reduced maize yield by 30.6%, while the use of vetch or oats+vetch did not generate differences with the control without a cover crop. Previous studies showed that maize yield is reduced when the cover crop has a high C/N ratio (e.g., oats) because it limits the availability of N (12). Meanwhile, the use of legumes as cover crops, alone or in mixtures, can maintain maize yield similar to or higher than those obtained without cover crops, particularly in non-water restricted years (12, 39). On the other hand, according to the results of this study and previous research (12), there was no difference in soybean yield between the different cover crop predecessors. This could be explained by the biological N fixation capacity of soybean, which makes it somewhat independent of the soil N content.
Management Implications and Future Perspectives
The use of cover crops, combined with low or no N fertilization and no-tillage, enhances the sustainability of the agroecosystems. Through these management practices, it is possible to achieve environmental goals, such as reducing N losses by leaching, decreasing soil erosion, limiting the use of herbicides during fallow, and improving soil quality (15, 22–24, 67, 68). From a climate change mitigation point of view, the use of cover crops has several advantages: i) it increases soil carbon sequestration (15, 25, 69, 70); ii) it decreases direct N2O emissions from N fertilizer use because the N input from the cover crop, particularly legumes, allows reducing the N rate applied (27); and iii) it reduces indirect N2O emissions because it minimizes N leaching (9, 13, 71). However, the incorporation of cover crops in the rotations, especially legumes, increases direct N2O emissions during a limited time after the cover crop killing.
Our results show that in systems with low N application, the choice of the species used as cover crops determines the magnitude of N2O emissions, especially in the first months after the cover crop killing. The use of oats as a cover crop is an interesting alternative to improve the balance between GHG emissions and removals in croplands, since it did not show increases in N2O emissions and has carbon sequestration capacity in systems with low N fertilization under no-tillage (15). However, its use as a predecessor for maize can cause decreases in crop yield, although it does not affect soybean productivity. The use of vetch or the oats+vetch mixture as cover crops did not decrease maize yield (even without N fertilization) and enhanced carbon sequestration (15), and it also results in higher N2O emissions. Our study shows that the use of cover crops in no-tillage systems favors an increase in WFPS, the main factor regulating N2O emissions. This generates conditions conducive for high N2O emission rates to occur in the early stages of summer crop development. Future research should i) compare N2O emissions from a leguminous cover crop residue and synthetic fertilizers that contribute the same N to the crop, to evaluate whether replacement of fertilizer with N delivered by cover crops can effectively reduce N2O emissions, and (ii) evaluate effective emission mitigation strategies during the cover crop decomposition period (e.g., changes in the killing date of cover crops, use of mixtures with a lower proportion of legumes).
Funding
This research was supported by the Instituto Nacional de Tecnología Agropecuaria (INTA, Argentina) through projects PNNAT-1128023, PE-I058, PE-E1-I011-001, and 2019-PD-I062-001.
Publisher’s Note
All claims expressed in this article are solely those of the authors and do not necessarily represent those of their affiliated organizations, or those of the publisher, the editors and the reviewers. Any product that may be evaluated in this article, or claim that may be made by its manufacturer, is not guaranteed or endorsed by the publisher.
Statements
Data availability statement
The datasets generated for this study are available by the authors on reasonable request.
Author contributions
SR and GP: conceptualization. SV, SR, and GP: conception and design of the study. SR: long-term field experiment management. GP and SR: funding. SV, SR, and GP: fieldwork sampling and measurement. GP and SV: data curation. SV: statistical analysis. SV: writing—first draft. SR and GP: writing—review and editing. All authors contributed to manuscript revision and editing and read and approved the submitted version.
Acknowledgments
The authors are grateful to Leticia García and Jimena Dalpiaz for laboratory assistance and to Diego Colombini, Fabio Villalba, Carol Adrover, and Pablo Azich for fieldwork assistance.
Conflict of interest
The authors declare that the research was conducted in the absence of any commercial or financial relationships that could be construed as a potential conflict of interest.
Supplementary material
The Supplementary Material for this article can be found online at: https://www.frontiersin.org/articles/10.3389/fsoil.2022.903387/full#supplementary-material
References
1
SmithPMartinoDCaiZGwaryDJanzenHKumarPet al. Greenhouse Gas Mitigation in Agriculture. Philos Trans R. Soc B. Biol Sci (2008) 363:789–813. doi: 10.1098/rstb.2007.2184
2
RavishankaraARDanielJSPortmannRW. Nitrous Oxide (N2O): The Dominant Ozone-Depleting Substance Emitted in the 21st Century. Science (2009) 326:123–5. doi: 10.1126/science.1176985
3
ConenFDobbieKESmithKA. Predicting N2O Emissions From Agricultural Land Through Related Soil Parameters. Glob. Chang. Biol (2000) 6:417–26. doi: 10.1046/J.1365-2486.2000.00319.X
4
GuJNicoullaudBRochettePGrosselAHénaultCCellierPet al. A Regional Experiment Suggests That Soil Texture is a Major Control of N2O Emissions From Tile-Drained Winter Wheat Fields During the Fertilization Period. Soil Biol Biochem (2013) 60:134–41. doi: 10.1016/J.SOILBIO.2013.01.029
5
AbalosDSanz-CobenaAGarcia-TorresLvan GroenigenJWVallejoA. Role of Maize Stover Incorporation on Nitrogen Oxide Emissions in a non-Irrigated Mediterranean Barley Field. Plant Soil (2013) 364:357–71. doi: 10.1007/S11104-012-1367-4/TABLES/3
6
Preza-FontesGChristiansonLEGreerKBhattaraiRPittelkowCM. In-Season Split Nitrogen Application and Cover Cropping Effects on Nitrous Oxide Emissions in Rainfed Maize. Agric Ecosyst. Environ (2022) 326:107813. doi: 10.1016/J.AGEE.2021.107813
7
PintoPFernández LongMEPiñeiroG. Including Cover Crops During Fallow Periods for Increasing Ecosystem Services: Is it Possible in Croplands of Southern South America? Agric Ecosyst. Environ (2017) 284:48–57. doi: 10.1016/j.agee.2017.07.028
8
AbdallaMHastingsAChengKYueQChadwickDEspenbergMet al. A Critical Review of the Impacts of Cover Crops on Nitrogen Leaching, Net Greenhouse Gas Balance and Crop Productivity. Glob. Chang. Biol (2019) 25:2530–43. doi: 10.1111/GCB.14644
9
CavigliaOPSadrasVOAndradeFH. Intensification of Agriculture in the South-Eastern Pampas: I. Capture and Efficiency in the Use of Water and Radiation in Double-Cropped Wheat-Soybean. F. Crop Res (2004) 87:117–29. doi: 10.1016/j.fcr.2003.10.002
10
PosseGLewczukNDi BellaCRichterKOricchioPHilbertJ. Impact of Land Use During Winter on the Balance of Greenhouse Gases. Soil Use Manag. (2018) 34:525–32. doi: 10.1111/sum.12458
11
RestovichSBAndriuloAEPortelaSI. Introduction of Cover Crops in a Maize–Soybean Rotation of the Humid Pampas: Effect on Nitrogen and Water Dynamics. F. Crop Res (2012) 128:62–70. doi: 10.1016/J.FCR.2011.12.012
12
PortelaSIRestovichSBGonzálezHMTortiMJ. Reducción Del Drenaje Profundo Y La Lixiviación De Nitrógeno En Rotaciones Agrícolas Con Cultivos De Cobertura. Ecol Austral (2016) 26:212–20. doi: 10.25260/EA.16.26.3.0.307
13
PoudelDDHorwathWRLaniniWTTempleSRVan BruggenAHC. Comparison of Soil N Availability and Leaching Potential, Crop Yields and Weeds in Organic, Low-Input and Conventional Farming Systems in Northern California. Agric Ecosyst. Environ (2002) 90:125–37. doi: 10.1016/S0167-8809(01)00196-7
14
RestovichSBAndriuloAEArmas-HerreraCMBeribeMJPortelaSI. Combining Cover Crops and Low Nitrogen Fertilization Improves Soil Supporting Functions. Plant Soil (2019) 442:401–17. doi: 10.1007/s11104-019-04205-8
15
PeyrardCMaryBPerrinPVéricelGGréhanEJustesEet al. N2O Emissions of Low Input Cropping Systems as Affected by Legume and Cover Crops Use. Agric Ecosyst. Environ (2016) 224:145–56. doi: 10.1016/J.AGEE.2016.03.028
16
RestovichSBAndriuloEPortelaI. Cover Crop Mixtures Increase Ecosystem Multifunctionality in Summer Crop Rotations With Low N Fertilization. Agron Sustain. Dev 2022 422 (2022) 42:1–16. doi: 10.1007/S13593-021-00750-8. Adrián &Slvina &.
17
PittmanKBBarneyJNFlessnerML. Cover Crop Residue Components and Their Effect on Summer Annual Weed Suppression in Corn and Soybean. Weed. Sci (2020) 68:301–10. doi: 10.1017/WSC.2020.16
18
ConstantinJMaryBLaurentFAubrionGFontaineAKerveillantPet al. Effects of Catch Crops, No Till and Reduced Nitrogen Fertilization on Nitrogen Leaching and Balance in Three Long-Term Experiments. Agric Ecosyst. Environ (2010) 135:268–78. doi: 10.1016/J.AGEE.2009.10.005
19
GabrielJLQuemadaM. Replacing Bare Fallow With Cover Crops in a Maize Cropping System: Yield, N Uptake and Fertiliser Fate. Eur J Agron (2011) 34:133–43. doi: 10.1016/J.EJA.2010.11.006
20
QuemadaMBaranskiMNobel-de LangeMNJVallejoACooperJM. Meta-Analysis of Strategies to Control Nitrate Leaching in Irrigated Agricultural Systems and Their Effects on Crop Yield. Agric Ecosyst. Environ (2013) 174:1–10. doi: 10.1016/J.AGEE.2013.04.018
21
Blanco-CanquiHHolmanJDSchlegelAJTatarkoJShaverTM. Replacing Fallow With Cover Crops in a Semiarid Soil: Effects on Soil Properties. Soil Sci Soc Am J (2013) 77:1026–34. doi: 10.2136/SSSAJ2013.01.0006
22
KessavalouAWaltersDT. Winter Rye Cover Crop Following Soybean Under Conservation Tillage: Residual Soil Nitrate. Agron J (1999) 91:643–9. doi: 10.2134/AGRONJ1999.914643X
23
VarelaMFSciancaCMTaboadaMARubioG. Cover Crop Effects on Soybean Residue Decomposition and P Release in No-Tillage Systems of Argentina. Soil Tillage. Res (2014) 143:59–66. doi: 10.1016/J.STILL.2014.05.005
24
PoeplauCDonA. Carbon Sequestration in Agricultural Soils via Cultivation of Cover Crops - A Meta-Analysis. Agric Ecosyst. Environ (2015) 200:33–41. doi: 10.1016/j.agee.2014.10.024
25
KayeJPQuemadaM. Using Cover Crops to Mitigate and Adapt to Climate Change. A. Rev. Agron Sustain. Dev (2017) 37:4. doi: 10.1007/s13593-016-0410-x
26
BayerCGomesJZanattaJAVieiraFCBPiccolo M deCDieckowJet al. Soil Nitrous Oxide Emissions as Affected by Long-Term Tillage, Cropping Systems and Nitrogen Fertilization in Southern Brazil. Soil Tillage. Res (2015) 146:213–22. doi: 10.1016/J.STILL.2014.10.011
27
SnappSSSwintonSMLabartaRMutchDBlackJRLeepRet al. Evaluating Cover Crops for Benefits, Costs and Performance Within Cropping System Niches. Agron J (2005) 97:322–32. doi: 10.2134/AGRONJ2005.0322A
28
BascheADMiguezFEKasparTCCastellanoMJ. Do Cover Crops Increase or Decrease Nitrous Oxide Emissions? A Meta-Analysis. J Soil Water Conserv. (2014) 69:471–82. doi: 10.2489/jswc.69.6.471
29
GuenetBGabrielleBChenuCArrouaysDBalesdentJBernouxMet al. Can N2O Emissions Offset the Benefits From Soil Organic Carbon Storage? Glob. Chang. Biol (2021) 27:237–56. doi: 10.1111/GCB.15342
30
MuhammadISainjuUMZhaoFKhanAGhimireRFuXet al. Regulation of Soil CO2 and N2O Emissions by Cover Crops: A Meta-Analysis. Soil Tillage. Res (2019) 192:103–12. doi: 10.1016/J.STILL.2019.04.020
31
LinnDMDoranJW. Effect of Water-Filled Pore Space on Carbon Dioxide and Nitrous Oxide Production in Tilled and Nontilled Soils. Soil Sci Soc Am J (1984) 48:1267–72. doi: 10.2136/SSSAJ1984.03615995004800060013X
32
BaggsEMStevensonMPihlatieMRegarACookHCadischG. Nitrous Oxide Emissions Following Application of Residues and Fertiliser Under Zero and Conventional Tillage. Plant Soil (2003) 254:361–70. doi: 10.1023/A:1025593121839
33
SnyderCSBruulsemaTWJensenTLFixenPE. Review of Greenhouse Gas Emissions From Crop Production Systems and Fertilizer Management Effects. Agric Ecosyst. Environ (2009) 133:247–66. doi: 10.1016/j.agee.2009.04.021
34
Sanz-CobenaAGarcía-MarcoSQuemadaMGabrielJLAlmendrosPVallejoA. Do Cover Crops Enhance N2O, CO2 or CH4 Emissions From Soil in Mediterranean Arable Systems? Sci Total. Environ (2014) 466–467:164–74. doi: 10.1016/j.scitotenv.2013.07.023
35
GentileRVanlauweBChivengePSixJ. Interactive Effects From Combining Fertilizer and Organic Residue Inputs on Nitrogen Transformations. Soil Biol Biochem (2008) 40:2375–84. doi: 10.1016/J.SOILBIO.2008.05.018
36
MitchellDCCastellanoMJSawyerJEPantojaJ. Cover Crop Effects on Nitrous Oxide Emissions: Role of Mineralizable Carbon. Soil Sci Soc Am J (2013) 77:1765–73. doi: 10.2136/SSSAJ2013.02.0074
37
AbdallaMHastingsAHelmyMPrescherAOsborneBLaniganGet al. Assessing the Combined Use of Reduced Tillage and Cover Crops for Mitigating Greenhouse Gas Emissions From Arable Ecosystem. Geoderma (2014) 223–225:9–20. doi: 10.1016/J.GEODERMA.2014.01.030
38
CoombsCLauzonJDDeenBVan EerdLL. Legume Cover Crop Management on Nitrogen Dynamics and Yield in Grain Corn Systems. F. Crop Res (2017) 201:75–85. doi: 10.1016/J.FCR.2016.11.001
39
SainjuUMWhiteheadWFSinghBP. Biculture Legume–Cereal Cover Crops for Enhanced Biomass Yield and Carbon and Nitrogen. Agron J (2005) 97:1403–12. doi: 10.2134/AGRONJ2004.0274
40
HallRARebellaCMGhersaCMCulotJP. “Field-Crop Systems of the Pampas”. In: PearsonCJ, editor. Field Crops Ecosystems. Amsterdam: Elsevier (1992). p. 413–450.
41
SorianoALeónRJCSalaOELavadoRSDeregibusVACahuepéMAet al. “Rio De La Plata Grasslands”. In: CouplandRT, editor. Ecosystems of the World 8a. Natural Grasslands. Introduction and Western Hemisphere. New York: Elsevier (1991). p. 367–407.
42
RitchieSWHanwayJJ. How a Corn Plant Develops, in: Spec Rep 48 Iowa State Univ Sci Technol Coop Ext Serv Ames, Ia (1982). Available at: https://dr.lib.iastate.edu/entities/publication/5db37a6e-aba5-466b-867a-927fcefca43d (Accessed March 21, 2022).
43
CosentinoDChenuCLe BissonnaisY. Aggregate Stability and Microbial Community Dynamics Under Drying-Wetting Cycles in a Silt Loam Soil. Soil Biol Biochem (2006) 38:2053–62. doi: 10.1016/j.soilbio.2005.12.022
44
Della ChiesaTPiñeiroGYahdjianL. Gross, Background, and Net Anthropogenic Soil Nitrous Oxide Emissions From Soybean, Corn, and Wheat Croplands. J Environ Qual. (2019) 48:16–23. doi: 10.2134/JEQ2018.07.0262
45
VangeliSPosseGBegetMEOtero EstradaEValdettaroRAOricchioPet al. Effects of Fertilizer Type on Nitrous Oxide Emission and Ammonia Volatilization in Wheat and Maize Crops. Soil Use Manag. (2022). doi: 10.1111/SUM.12788
46
GomesJBayerCde Souza CostaFde Cássia PiccoloMZanattaJAVieiraFCBet al. Soil Nitrous Oxide Emissions in Long-Term Cover Crops-Based Rotations Under Subtropical Climate. Soil Tillage. Res (2009) 106:36–44. doi: 10.1016/J.STILL.2009.10.001
47
LivingstonGPHutchinsonGL. “Enclosure-Based Measurement of Trace Gas Exchange: Applications and Sources of Error”. In: MatsonPAHarrisRC, editors. Biogenic Trace Gases: Measuring Emissions From Soil and Water. Oxford, UK: Blackwell Science Ltd. (1995) p. 14–51.
48
VentereaRTPetersenSOde KleinCAMPedersenARNobleADLReesRMet al. Global Research Alliance N2O Chamber Methodology Guidelines: Flux Calculations. J Environ Qual. (2020) 49:1141–55. doi: 10.1002/JEQ2.20118
49
MorganJNSonquistJA. Problems in the Analysis of Survey Data, and a Proposal. J Am Stat Assoc (1963) 58:415. doi: 10.2307/2283276
50
LewczukNAPosseGRichterKAchkarA. CO2 and N2O Flux Balance on Soybean Fields During Growth and Fallow Periods in the Argentine Pampas—A Study Case. Soil Tillage. Res (2017) 169:65–70. doi: 10.1016/J.STILL.2017.01.017
51
CosentinoVRNFigueiro AuregguiSATaboadaMA. Hierarchy of Factors Driving N2O Emissions in non-Tilled Soils Under Different Crops. Eur J Soil Sci (2013) 64:550–7. doi: 10.1111/EJSS.12080
52
BaggsEMReesRMSmithKAVintenAJA. Nitrous Oxide Emission From Soils After Incorporating Crop Residues. Soil Use Manag. (2000) 16:82–7. doi: 10.1111/J.1475-2743.2000.TB00179.X
53
MillarNNdufaJKCadischGBaggsEM. Nitrous Oxide Emissions Following Incorporation of Improved-Fallow Residues in the Humid Tropics. Global Biogeochem. Cycl. (2004) 18:1032. doi: 10.1029/2003GB002114
54
ConstantinidesMFownesJH. Nitrogen Mineralization From Leaves and Litter of Tropical Plants: Relationship to Nitrogen, Lignin and Soluble Polyphenol Concentrations. Soil Biol Biochem (1994) 26:49–55. doi: 10.1016/0038-0717(94)90194-5
55
SullivanPGParrishDJLunaJM. Cover Crop Contributions to N Supply and Water Conservation in Corn Production. Am J Altern Agric (1991) 6:106–13. doi: 10.1017/S0889189300003982
56
RanellsNNWaggerMG. Nitrogen Release From Grass and Legume Cover Crop Monocultures and Bicultures. Agron J (1996) 88:777–882. doi: 10.2134/AGRONJ1996.00021962008800050015X
57
VaughanJDEvanyloGK. Corn Response to Cover Crop Species, Spring Desiccation Time, and Residue Management. Agron J (1998) 90:536–44. doi: 10.2134/AGRONJ1998.00021962009000040016X
58
Sainz RozasHREcheverríaHEPiconeLI. Denitrification in Maize Under No–Tillage. Soil Sci Soc Am J (2001) 65:1314–23. doi: 10.2136/SSSAJ2001.6541314X
59
Sarkodie-AddoJLeeHCBaggsEM. Nitrous Oxide Emissions After Application of Inorganic Fertilizer and Incorporation of Green Manure Residues. Soil Use Manag. (2003) 19:331–9. doi: 10.1111/J.1475-2743.2003.TB00323.X
60
GroffmanPMDavidsonEASeitzingerS. New Approaches to Modeling Denitrification. Biogeochem (2009) 93:1–5. doi: 10.1007/S10533-009-9285-0
61
MolodovskayaMSingurindyORichardsBKWarlandJJohnsonMSSteenhuisTS. Temporal Variability of Nitrous Oxide From Fertilized Croplands: Hot Moment Analysis. Soil Sci Soc Am J (2012) 76:1728–40. doi: 10.2136/SSSAJ2012.0039
62
SnyderCSDavidsonEASmithPVentereaRT. Agriculture: Sustainable Crop and Animal Production to Help Mitigate Nitrous Oxide Emissions. Curr Opin Environ Sustain. (2014) 9–10:46–54. doi: 10.1016/J.COSUST.2014.07.005
63
Butterbach-BahlKBaggsEMDannenmannMKieseRZechmeister-BoltensternS. Nitrous Oxide Emissions From Soils: How Well do We Understand the Processes and Their Controls? Philos Trans R. Soc B. Biol Sci (2013) 368:20130122. doi: 10.1098/rstb.2013.0122
64
DabneySM. Cover Crop Impacts on Watershed Hydrology. J Soil Water Conserv. (1998) 53:207–13.
65
HolmanJDArnetKDilleJMaxwellSObourARobertsTet al. Can Cover or Forage Crops Replace Fallow in the Semiarid Central Great Plains? Crop Sci (2018) 58:932–44. doi: 10.2135/CROPSCI2017.05.0324
66
RosaATCreechCFElmoreRWRudnickDRLindquistJLFudoligMet al. Implications of Cover Crop Planting and Termination Timing on Rainfed Maize Production in Semi-Arid Cropping Systems. F. Crop Res (2021) 271:108251. doi: 10.1016/J.FCR.2021.108251
67
MeisingerJJRiciglianoKA. Nitrate Leaching From Winter Cereal Cover Crops Using Undisturbed Soil-Column Lysimeters. J Environ Qual. (2017) 46:576–84. doi: 10.2134/JEQ2016.09.0372
68
SinghGWilliardKWJSchoonoverJE. Cover Crops and Tillage Influence on Nitrogen Dynamics in Plant-Soil-Water Pools. Soil Sci Soc Am J (2018) 82:1572–82. doi: 10.2136/SSSAJ2018.03.0111
69
LuoZWangESunOJ. Soil Carbon Change and its Responses to Agricultural Practices in Australian Agro-Ecosystems: A Review and Synthesis. Geoderma (2010) 155:211–23. doi: 10.1016/J.GEODERMA.2009.12.012
70
DuvalMEGalantiniJACapurroJEMartinezJM. Winter Cover Crops in Soybean Monoculture: Effects on Soil Organic Carbon and its Fractions. Soil Tillage. Res (2016) 161:95–105. doi: 10.1016/j.still.2016.04.006
71
DiHJCameronKC. Nitrate Leaching in Temperate Agroecosystems: Sources, Factors and Mitigating Strategies. Nutr Cycl. Agroecosyst. 2002 643 (2002) 64:237–56. doi: 10.1023/A:1021471531188
Summary
Keywords
nitrous oxide, no-tillage, mitigation, croplands, nitrogen, maize, soybean, Argentine Pampas
Citation
Vangeli S, Restovich S and Posse G (2022) Cover Crop Species Affect N2O Emissions at Hotspot Moments of Summer Crops. Front. Soil Sci. 2:903387. doi: 10.3389/fsoil.2022.903387
Received
24 March 2022
Accepted
09 May 2022
Published
14 June 2022
Volume
2 - 2022
Edited by
Sonja Leitner, International Livestock Research Institute (ILRI), Kenya
Reviewed by
Zhenwei Song, Institute of Crop Sciences (CAAS), China; Yuan Li, Lanzhou University, China
Updates
Copyright
© 2022 Vangeli, Restovich and Posse.
This is an open-access article distributed under the terms of the Creative Commons Attribution License (CC BY). The use, distribution or reproduction in other forums is permitted, provided the original author(s) and the copyright owner(s) are credited and that the original publication in this journal is cited, in accordance with accepted academic practice. No use, distribution or reproduction is permitted which does not comply with these terms.
*Correspondence: Gabriela Posse, posse.gabriela@inta.gob.ar
This article was submitted to Soil Biogeochemistry and Nutrient Cycling, a section of the journal Frontiers in Soil Science
Disclaimer
All claims expressed in this article are solely those of the authors and do not necessarily represent those of their affiliated organizations, or those of the publisher, the editors and the reviewers. Any product that may be evaluated in this article or claim that may be made by its manufacturer is not guaranteed or endorsed by the publisher.