 Megan F. Mitchell
 Meghan Graham MacLean3
 Kristen M. DeAngelis
- 1Graduate Program in Organismic and Evolutionary Biology, University of Massachusetts, Amherst, MA, United States
- 2Department of Microbiology, University of Massachusetts, Amherst, MA, United States
- 3Department of Environmental Conservation, University of Massachusetts, Amherst, MA, United States
Microbial-derived soil organic matter (SOM), or necromass, is an important source of SOM and is sensitive to climate warming. Soil classification systems consider soil physicochemical properties that influence SOM, hinting at the potential utility of incorporating classification systems in soil carbon (C) projections. Currently, there is no consensus on climate warming effects on necromass and if these responses vary across reference soil groups. To estimate the vulnerability of necromass to climate warming, we performed a meta-analysis of publications examining in situ experimental soil warming effects on microbial necromass via amino sugar analysis. We built generalized linear models (GLM) to explore if soil groups and warming methodologies can be used to predict necromass stocks. Our results showed that warming effect sizes on necromass were not uniform across reference soil groups. Specifically, warming effect sizes were generally positive in permafrost soils but negative in calcic soils. However, warming did not significantly change average necromass. Our GLMs detected significant differences in necromass across soil groups with similar texture and clay percentage. Thus, we advocate for further research to define what predictors of necromass are captured in soil group but not in soil texture. We also show warming methodology is a significant predictor of necromass, depending on the necromass biomarker. Future research efforts should uncover the mechanistic reason behind how passive versus active warming methodology influences necromass responses. Our study highlights the need for more in situ soil warming experiments measuring microbial necromass as this will improve predictions of SOM feedback under future climate scenarios.
1 Introduction
Climate warming will affect microbial-mediated soil organic matter (SOM) dynamics, but predicting the magnitude and direction of these effects is a major challenge in climate forecasting (1, 2);. Soils contain more carbon (C) in SOM than C contained in both the atmosphere and vegetation combined (3, 4). Empirical and theoretical data showcase a multitude of plausible climate change scenarios: soil C feedback can exhibit multi-phase microbial responses (5), and is influenced by microbial physiology (6), C use efficiency (7), thermal adaptations (8, 9);, depletion of labile C stocks (10, 11);, community structure changes (12), and evolutionary adaptations (13, 14);. Understanding SOM dynamics in a warming world is critical for climate change mitigation strategies.
Microbes influence SOM in both life and death, though much more is understood about living microbes than is known about dead microbes, or necromass (15). Living microbes decompose SOM, including necromass, and sequester C as biomass (15, 16);. When microbes die, their necromass may be recycled as a source of nutrients by other microbes or become stabilized as SOM in the soil matrix (16). Many methods are used to measure microbial necromass (16), but the most common method is measuring soil amino sugars as a necromass biomarker (16–18);. Amino sugars are components of microbial cell walls, and include glucosamine (abundant in fungi), muramic acid (exclusive to bacteria), galactosamine, and mannosamine (16–18). Newly deposited SOM is the most vulnerable to decomposition and loss (19), meaning that understanding the fate of necromass in a warming world may help to predict longer-term soil C stocks and their stability.
Soil warming experiments are used as a way of approximating the future effects of climate change on terrestrial ecosystems. These studies show that warming initially stimulates SOM decomposition but that this feedback weakens with duration of warming (5, 20). Defining the warming effects on microbial biomass turnover may help to elucidate the mechanistic reason for this attenuation of warming effects over time. Meta-analyses have shown that warming effect sizes on microbial biomass and/or abundance can be positive (21, 22); or negative (23, 24); and vary across ecosystems (22, 23, 25, 26) and soil type (23). For instance, warming effects on microbial abundance were positive in histosol soils (23), which are dominated by organic material, but negative in podzols (23), which are sandy acidic soils rich in metal oxides.
A recent study measuring soil amino sugars indicated necromass can account for up to 60% of C in SOM (27), but this can vary across biomes, latitude, and bedrock (27–29). Since multiple soil types can be present in a given geographic area, unique microbe-SOM interactions are not always captured at latitudinal or ecosystem scales. Two clear examples of this are a review that showed SOM formation and stability is soil-specific (30) and empirical findings of pedogenic-specific distribution patterns in bacterial communities (31). It follows that microbial-derived SOM formation and stabilization may also exhibit soil specific trends. Soil-specificity can be explored by utilizing soil classification systems such as the World Reference Base for Soil Resources (WRB) and USDA Soil Taxonomy. These systems characterize soils as groups (WRB) or orders (USDA) based on soil attributes. Accordingly, their inclusion in soil C models and climate change mitigation strategies is warranted (30, 32). However, more research is needed to forecast SOM dynamics in soil groups that are poorly represented in the literature (30).
Because SOM, microbial communities, and warming effects on microbial abundance can vary with soil type (23, 30, 31) we wanted to explore whether warming effects on necromass vary by soil type. SOM is a commonly used index for soil health but there is no consensus on how climate warming will affect microbial necromass dynamics (16, 33);. Studies indicate soil warming can increase (34–37), decrease (38–43), or not significantly change (44) (33); microbial necromass. The question remains whether climate warming will lead to the destabilization of microbial necromass, and if so, can we predict this feedback?
To better understand how warming will impact microbial-derived SOM, we conducted a cross-soils meta-analysis on publications examining warming effects on microbial necromass. We used the PRISMA method to discover all soil warming experiment papers that measure necromass stocks in response to warming (45). We hypothesized that 1) microbial necromass responses to warming vary with reference soil group and 2) that microbial necromass stocks are soil-group specific.
2 Methods
2.1 Literature survey
Using the PRISMA method, which utilizes a 27-item checklist that ensures reviews are transparent and repeatable, we conducted a systematic review of the literature. Then, we compiled the data from the review into a meta-analysis to explore climate warming effects on microbial necromass. Using these compiled data, we test our hypotheses that 1) microbial necromass responses to warming vary across soil groups and 2) that microbial necromass stocks are soil-group specific. Google scholar and Web of Science were used to acquire relevant literature. The literature search was performed using the following keywords: soil warming * microbial necromass, soil warming * amino sugar, soil warming * microbial residue, soil warming * muramic acid, soil warming * galactosamine, soil warming * glucosamine, and soil warming * mannosamine. Our last literature search date took place June 1st, 2022.
2.2 Inclusion criteria
Only in situ soil warming experiments were included that also measured microbial necromass via amino sugar analysis; amino sugars included glucosamine (glu), galactosamine (gal), muramic acid (mur), mannosamine (man), and total amino sugars (TAS), which is the sum of individual amino sugars. We included experiments that either directly warmed the soil or warmed canopy air. We excluded incubation experiments (n = 2) that measured necromass unless soils originated from in situ soil warming experiments. However, we excluded any incubations that added substrates to soil. We excluded climate gradient soil warming experiments (n = 7) as experimental warming-induced changes are likely to better reflect long-term processes (46). We also excluded climate gradient experiments that utilized litterbags (n = 2) as warming effects in litter bags may not reflect warming effects on in situ litter layers (47) We excluded experiments that measured necromass via branched glycerol dialkyl glycerol tetraethers (n =1) since these biomarkers are derived mostly from archaea (16). We excluded non-warming treatment effect interactions in studies such as drought, root exclusion, precipitation, CO2 enrichment, and fertilizer amendments. Finally, we excluded soil amino sugar data measured at soil depths greater than 50 cm because necromass content and dynamics varies between top soils and subsoils (48, 49). At this point, we excluded 12 publications from a total of 24 publications.
Papers that met the above criteria were only included if authors reported both control and warmed amino sugar data as well as warming methodology (method, duration, and magnitude) and soil sampling depth. Soil classification had to also be reported in the study, or if it was not, could be acquired from a different source. For instance (39), and (40) did not report soil type, which was determined to be an argixeroll (mollisol) from Web Soil Survey (50).
2.3 Data acquisition
In total, we acquired 12 publications that met all our criteria and thus, were included in this meta-analysis (Table 1). Experiments were conducted primarily in grasslands within two continents, Asia and North America (Supplementary Figure S1). We extracted data from tables, Supplementary Material, or from plots using WebPlotDigitizer (51). Data include average measurements of amino sugars, number of replicates, and standard deviation (SD) or standard error (SE) for each treatment and sampling depth. If sample sizes were not reported (n = 2), we assumed the sample size was equal to the number of replicate warmed plots or the number of replicate control plots. We converted SE to SD using the following formula: S D=S E(n1/2). In situ warming methodology included continuous warming (n = 12) or winter warming (n= 1) with either open top chambers (n = 5) or infrared radiators (n= 7). Warming duration ranged from 3 to 9 years and warming magnitude ranged from 0.1 to 4.9 degrees Celsius above ambient soil temperatures.
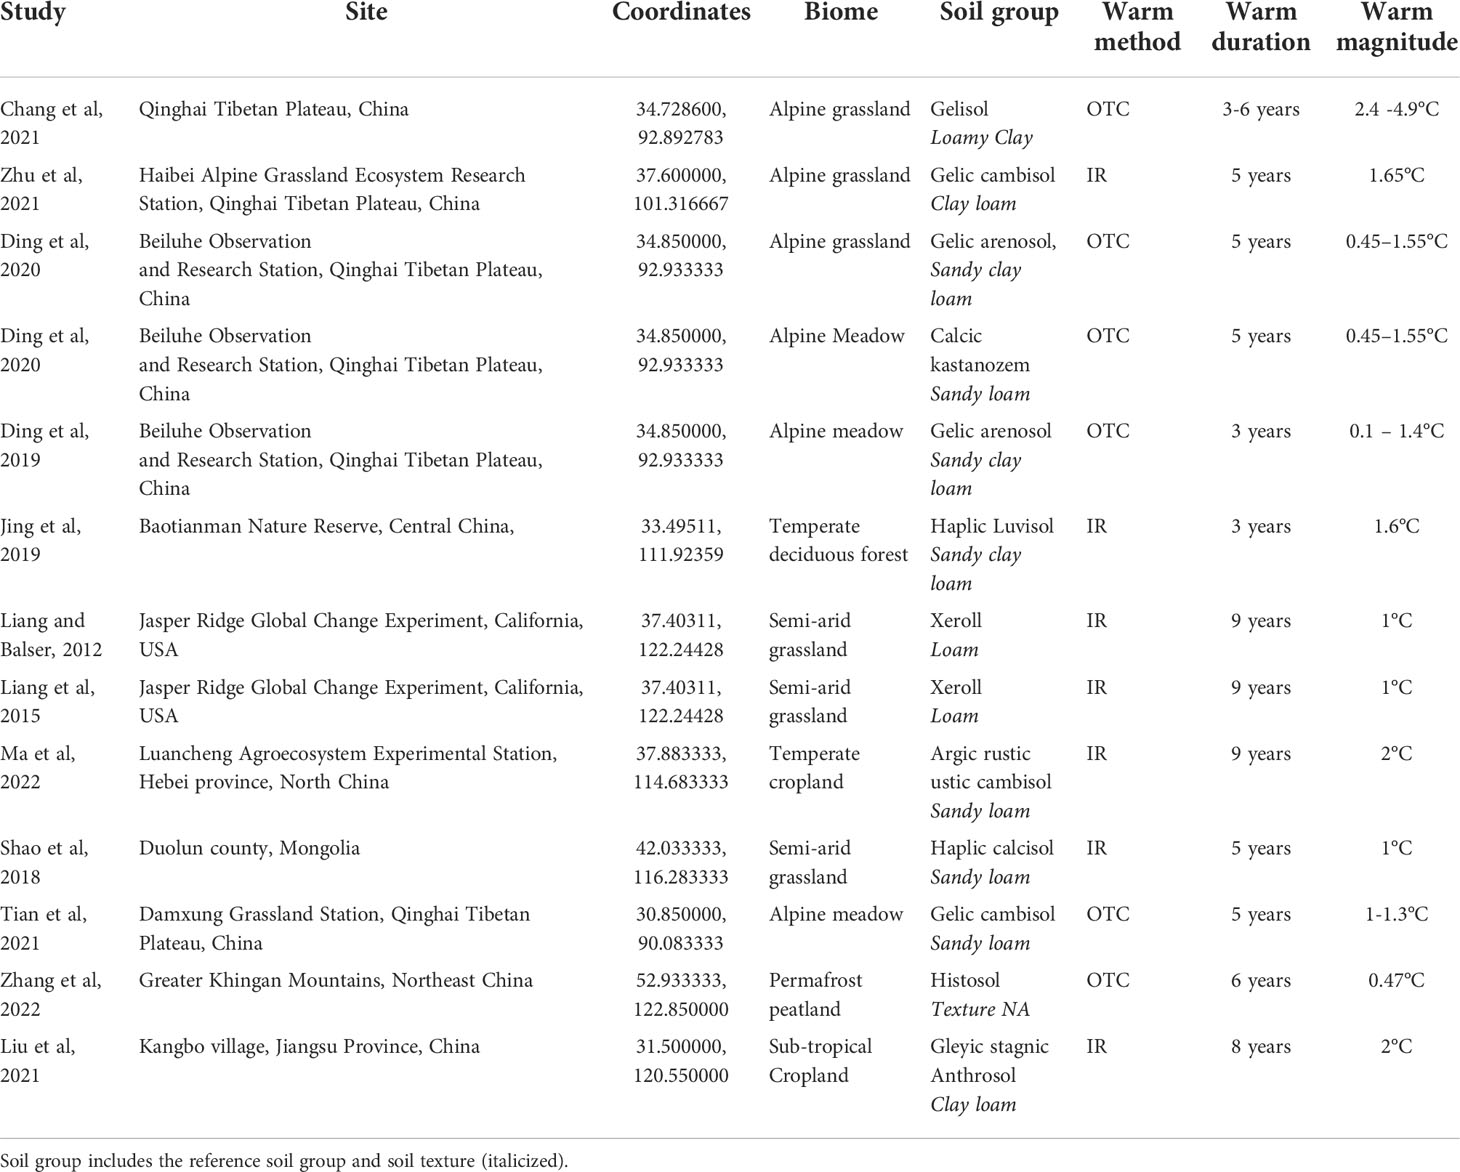
Table 1 Soil warming experiment publications and associated geographic and climatic data that were included in this meta-analysis.
Publications reported soil type using either WRB or USDA soil taxonomy. In total, there were 9 reference soil groups and 5 types of soil textures reported by publications. Soil types included gelisols (WRB cryosol), gelic cambisols (USDA inceptisols), gelic arenosols (USDA entisols), argic rustic ustic cambisols (USDA inceptisols), gleyic stagnic anthrosols (USDA plaggen inceptisols), haplic calcisols (USDA aridisols), glacic historthels (USDA histosols/glacic historthels), calcic kastanozems (USDA mollisols), and an argixeroll, which is a mollisol (WRB chernozem and kastanozems). Soils had loamy textures, including sandy clay loam, sandy loam, clay loam, loamy clay, and loam.
Every study but one (n = 11) reported soil amino sugars as the average value of replicates from the respective treatment group and/or sampling depth. Because of this, we averaged replicate soil amino sugar data extracted from one publication’s Supplementary Material (34) to avoid disproportionally influencing downstream analysis. All amino sugar data were converted to the same units of mg amino sugar g-1 soil. We excluded mannosamine from further analysis because less than 20% of included papers measured and reported this amino sugar.
2.4 Data analysis
2.4.1 Warming effect sizes on necromass
To quantify the magnitude and direction of warming effects on necromass, we estimated effect sizes by calculating the natural logarithm of response ratios (lnRR) between treatment groups. Using lnRR to estimate effect sizes is a common practice in ecological meta-analysis (52). All analysis was conducted in R (53). We used the metafor package (54) to compute effect sizes, which calculates lnRR using this equation: , where x1 and x2 are mean values of warmed and control amino sugars, respectively. We also calculated variance using the same package. One study was excluded from effect size calculations (33) because the SD or SE was not reported. Consequently, we could not calculate warming effect sizes on necromass in histosol soils.
Using the same package (54), we then calculated pooled effect sizes in each soil group, except for soils where only one lnRR was available. We generated grouped forest plots of pooled effect sizes and the 95% confidence intervals across soils for TAS, mur, glu, and gal using the ggforestplot package (55). An lnRR of 0 indicates warming had no effect on necromass in the reference soil group. A positive lnRR indicates that experimental warming increased necromass in the soil group relative to controls, whereas a negative lnRR indicates that experimental warming decreased necromass in the soil group relative to controls. If confidence intervals did not overlap with zero, effect sizes were significant. Our first hypothesis would be supported if the pooled lnRR varies across soil groups. We tested for publication bias by generating funnel plots of lnRR grouped by soil (54). Then, we computed Egger’s regression test for funnel plot asymmetry using the meta package (56).
The distribution of effect sizes grouped by biomarker (rather than soil type and biomarker) violated normality assumptions. Thus, we could not estimate warming’s overall effect size on total or individual amino sugars or perform ordinary linear regression on lnRR. We used a nonparametric test (Kruskal-Wallis) to see if unpooled lnRR differed across soils. If significant results were obtained, we followed up with post-hoc pairwise comparison analysis via the Wilcoxon Rank-Sum test. In lieu of performing ordinary linear regression on lnRRs, we built GLM’s (see subsection “Generalized Linear Model” in methods) to investigate if reference soil group, soil texture, soil sampling depth, biome, warming method, warming magnitude, and warming duration are predictors of microbial necromass.
2.4.2 Difference in necromass between treatment groups
Similar to lnRRs, the distribution of averaged soil amino sugars extracted directly from publications were not normal, as determined by the Shapiro-Wilk test of normality and visual exploration (53). Accordingly, we used nonparametric tests for hypothesis testing.
We tested our hypotheses by exploring the distribution of necromass between treatment groups and across soils using the Kruskal Wallis test (53). If significant results were obtained (p-value< 0.05), we then performed post-hoc pairwise comparison analysis (Wilcoxon Rank-Sum) to detect specific group differences by comparing all variables to the population’s base mean. We visualized the outcome of these test by generating boxplots with pairwise (Wilcoxon Rank-Sum) p-values using the ggplot2, ggbeeswarm, ggstatsplot, ggpubr, ggthemes, and ggeasy packages, and then used the patchwork package to create a panel of plots (57–62).
2.4.3 Generalized linear model
We built generalized linear models (GLMs) to explore whether aspects of experimental soil warming, including reference soil group, soil texture, soil sampling depth, biome, warming method, warming magnitude, or warming duration, can be used to predict necromass. Specifically, we generated GLMs with both inverse Gaussian and gamma distributions using the stats package in R (53); these distributions are suited for right skewed positive continuous datasets. GLMs use a link function to connect the response variable with its linear predictor, making them ideal for modeling non-normal ecological data. We did not model variation in lnRRs across soils using GLMs because 1) lnRRs take on negative values and 2) we could not explore our second hypothesis that microbial necromass stocks vary across reference soil groups using this approach.
Our response variables were the average values of TAS, mur, glu, and gal. Independent variables included treatment group (control or warm), reference soil group, soil texture, biome, sampling depth, warming method, warming magnitude, and warming duration. To account for contrasting pedogenesis, we separated the cambisol soils into two groups to distinguish the wildland soil (gelic cambisols, or “cambisol_a”) from the agricultural soil (argic rustic ustic cambisols, or “cambisol_b”). We did this because agricultural soils are intensively managed (tilled, fertilized, and irrigated) to generate soil conditions that maximize crop yield.
GLMs included the null model (i.e., model coefficients are equal to zero) and single predictor, interactive, or additive full models with both inverse Gaussian and gamma distributions. We used the DHARMa package to validate our GLMs (63) and checked for multicollinearity via the variance inflation factor. We then used the AICcmodavg package to choose the best model via the Akaike Information Criterion (AIC) (64).
After model validation, we generated model summary tables and compared the GLMs estimated parameters, including model coefficient significance (p-value< 0.05) and model null deviance relative to residual deviance. If model null deviance is larger than the residual deviance, then inclusion of the predictor variable improved model goodness of fit. If model coefficients are statistically significant (p-value< 0.05), then the model coefficient (reference soil group) is a significant predictor of necromass. Anthrosol soils or infrared radiation warming were used as the intercept groups for GLM coefficient comparison in models that predict necromass with reference soil group or warming method, respectively. Our best models were chosen based on the DHARMa simulated residuals, residual deviance to null deviance, and lowest AIC value.
We conducted a post-hoc pairwise comparison on validated GLM’s that predict necromass by first computing the models estimated marginal means (EMMs) using the emmeans package (65). Then, we generated a table of pairwise comparisons among EMMs showing the contrast, standard error, and statistical significance (p-value< 0.05) using the gt package (66).
3 Results
3.1 Warming effect sizes
Warming effect sizes (lnRR) varied on total amino sugars (TAS) and individual amino sugars (glu, gal, and mur) across reference soil groups, although there was some redundancy. Significant positive warming effect sizes were detected on TAS in gelisols and on TAS, glu, gal, and mur in gelic arenosols and ustic cambisols (Figure 1). Warming had a negative effect on glu but a positive effect on gal in kastanozems (Figure 1). Warming effects were negative on TAS, glu, and gal in mollisols and calcisols (Figure 1). Funnel plot shapes indicated no publication bias (Supplementary Figure S2), which was confirmed with Egger’s linear regression test for funnel plot asymmetry (p-value > 0.05).
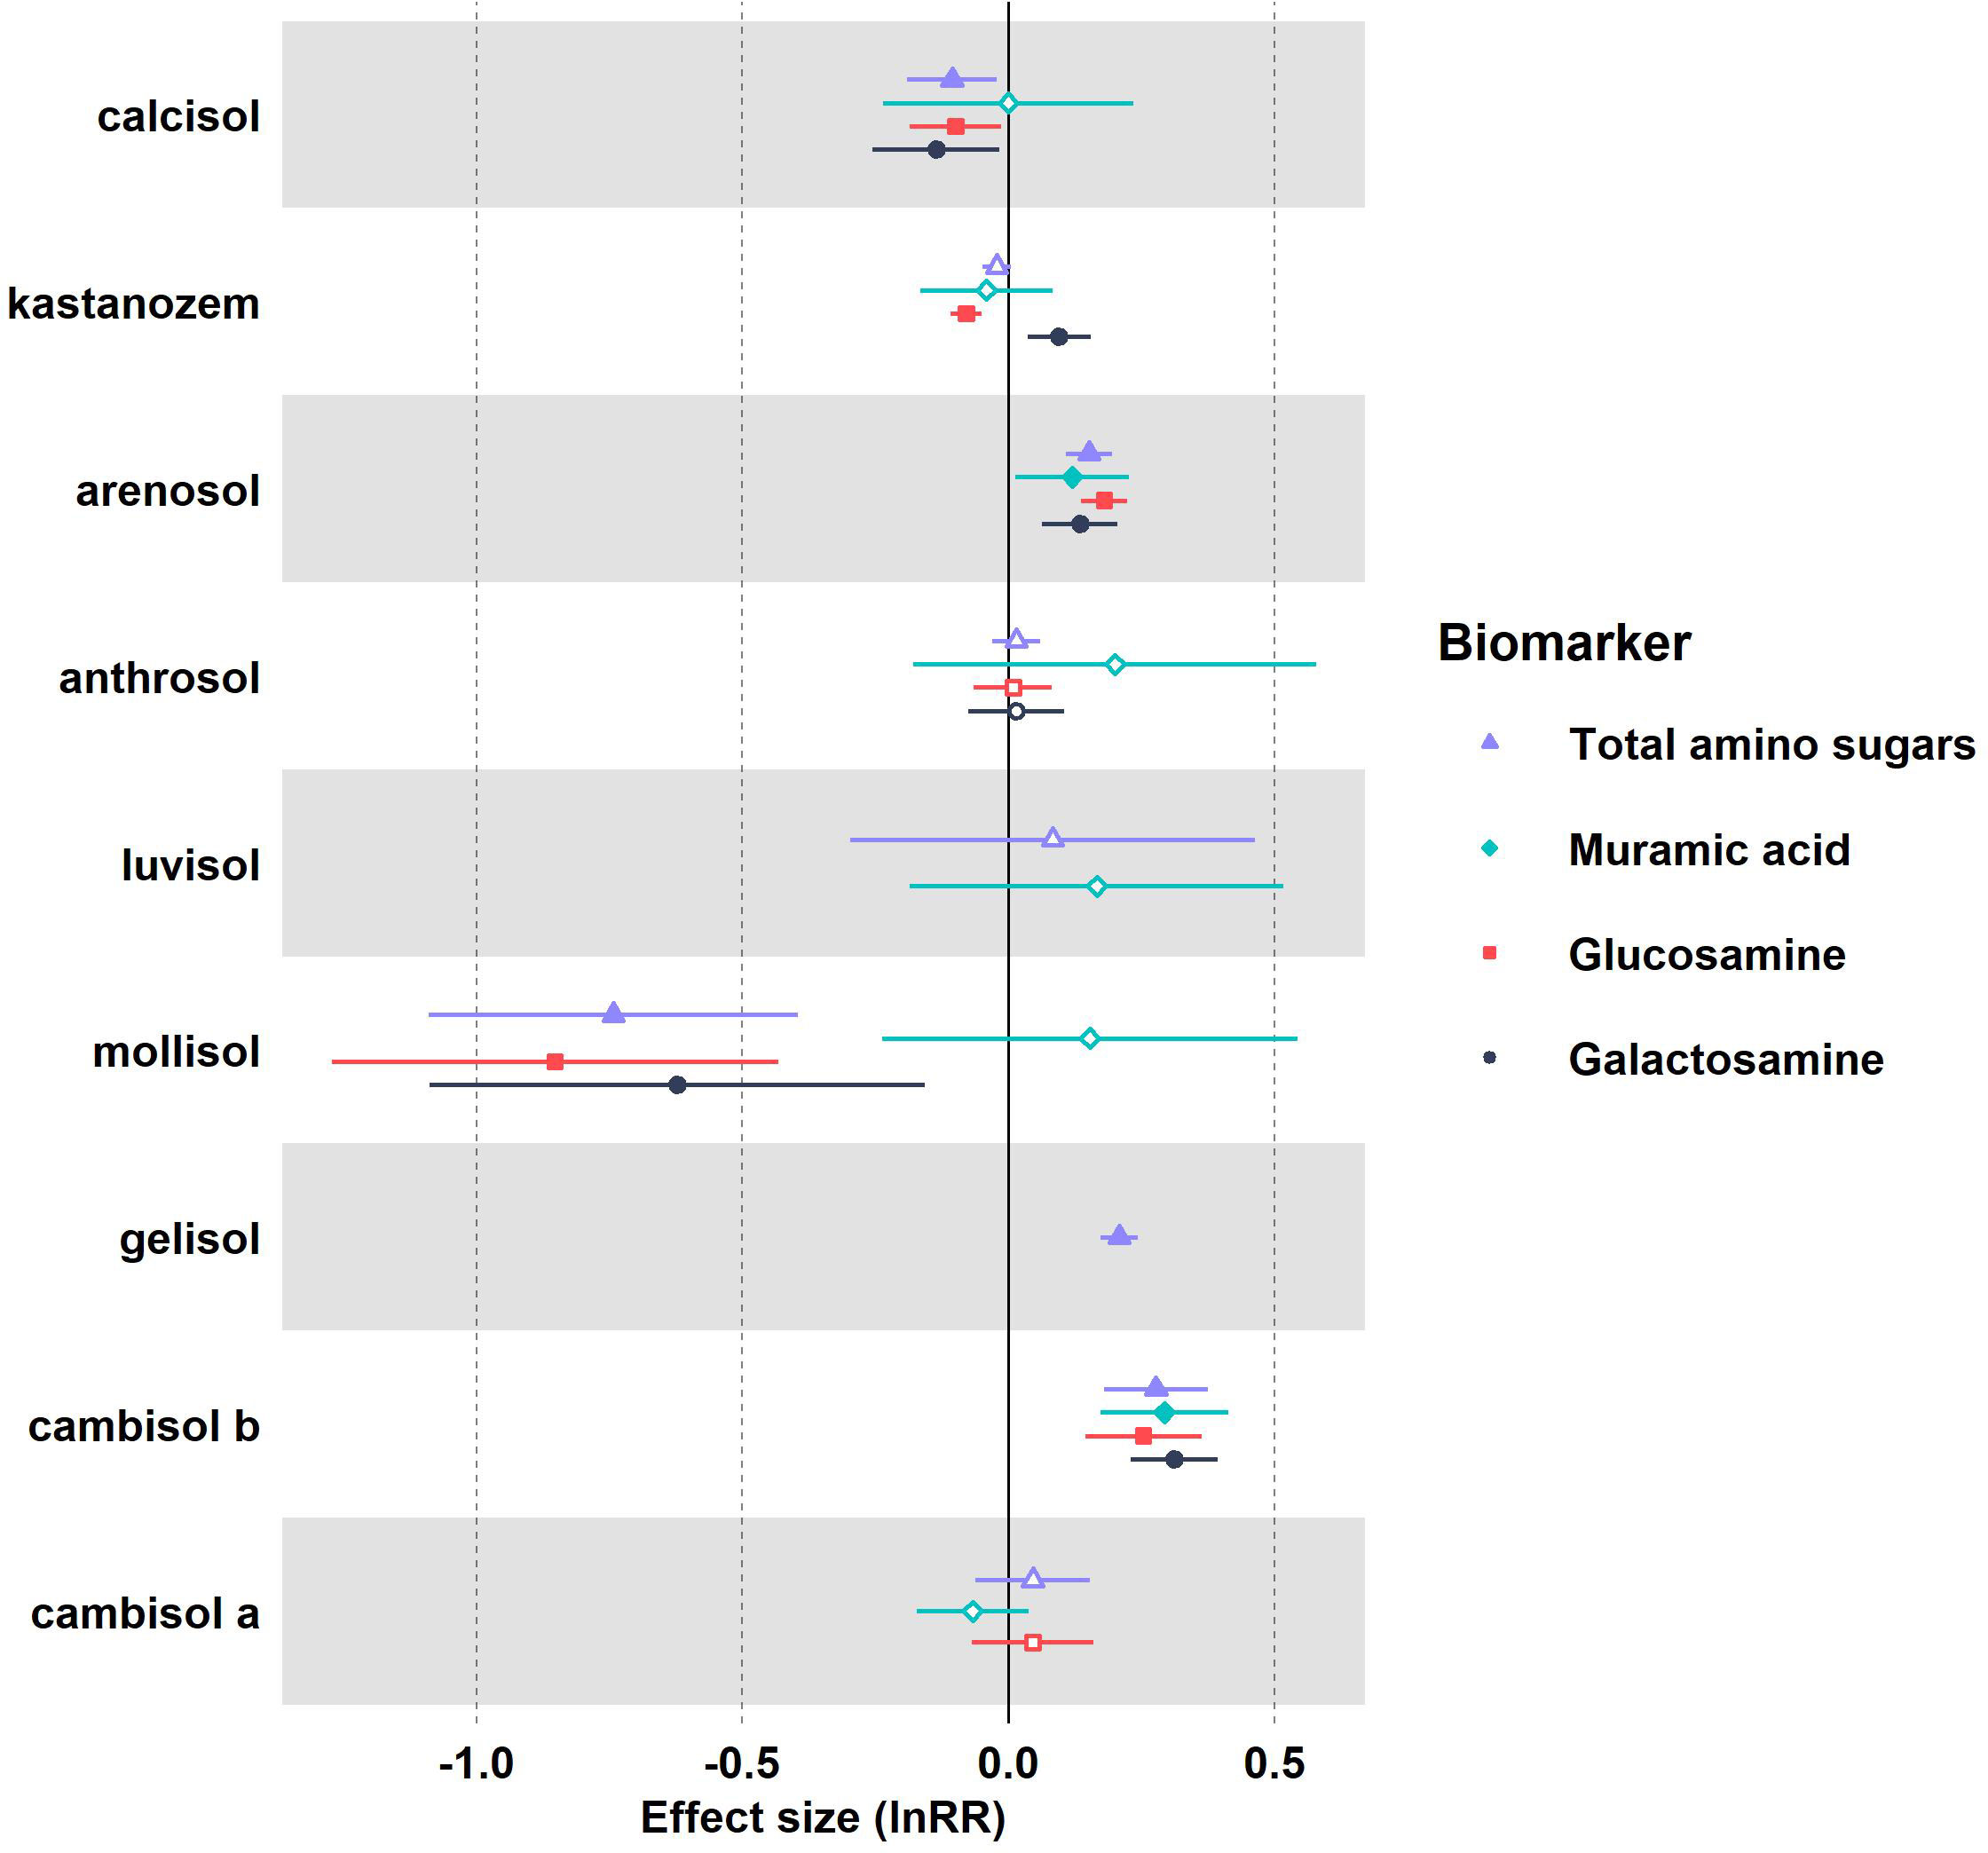
Figure 1 Forest plot of pooled natural log response ratios (lnRR) and 95% confidence intervals of total amino sugars (purple), muramic acid (light blue), glucosamine (red), and galactosamine (dark blue) in response to warming across soil groups. The vertical dashed line represents a lnRR of zero. Effect sizes are significant (p-value< 0.05) if the confidence intervals do not overlap with zero. Significant effect sizes are shown with filled in symbols whereas insignificant effect sizes are hollow symbols.
Kruskal-Wallis’s test indicated significant differences existed in unpooled lnRR of TAS across soils (p-value< 0.05), although no differences were detected in lnRR of mur, glu, and gal (p-value > 0.05). Post-hoc comparison on TAS lnRR indicated gelisols and mollisols significantly differed from the lnRR base mean (p-value< 0.05).
3.2 Average soil necromass between treatment groups and across reference soil groups
The Kruskal-Wallis’s test indicated warming did not significantly affect average individual amino sugars (glu, cal, mur) or TAS when pooled by treatment group (Supplementary Figure S3). Warming effects were also statistically insignificant across reference soil groups (Supplementary Figure S4), meaning that there was no consistent warming effect across the different soil types. However, substantial differences in necromass were detected across soil groups (Figure 2). Post-hoc comparison analysis showed several soil groups significantly differed from the population’s base mean (Figure 2).
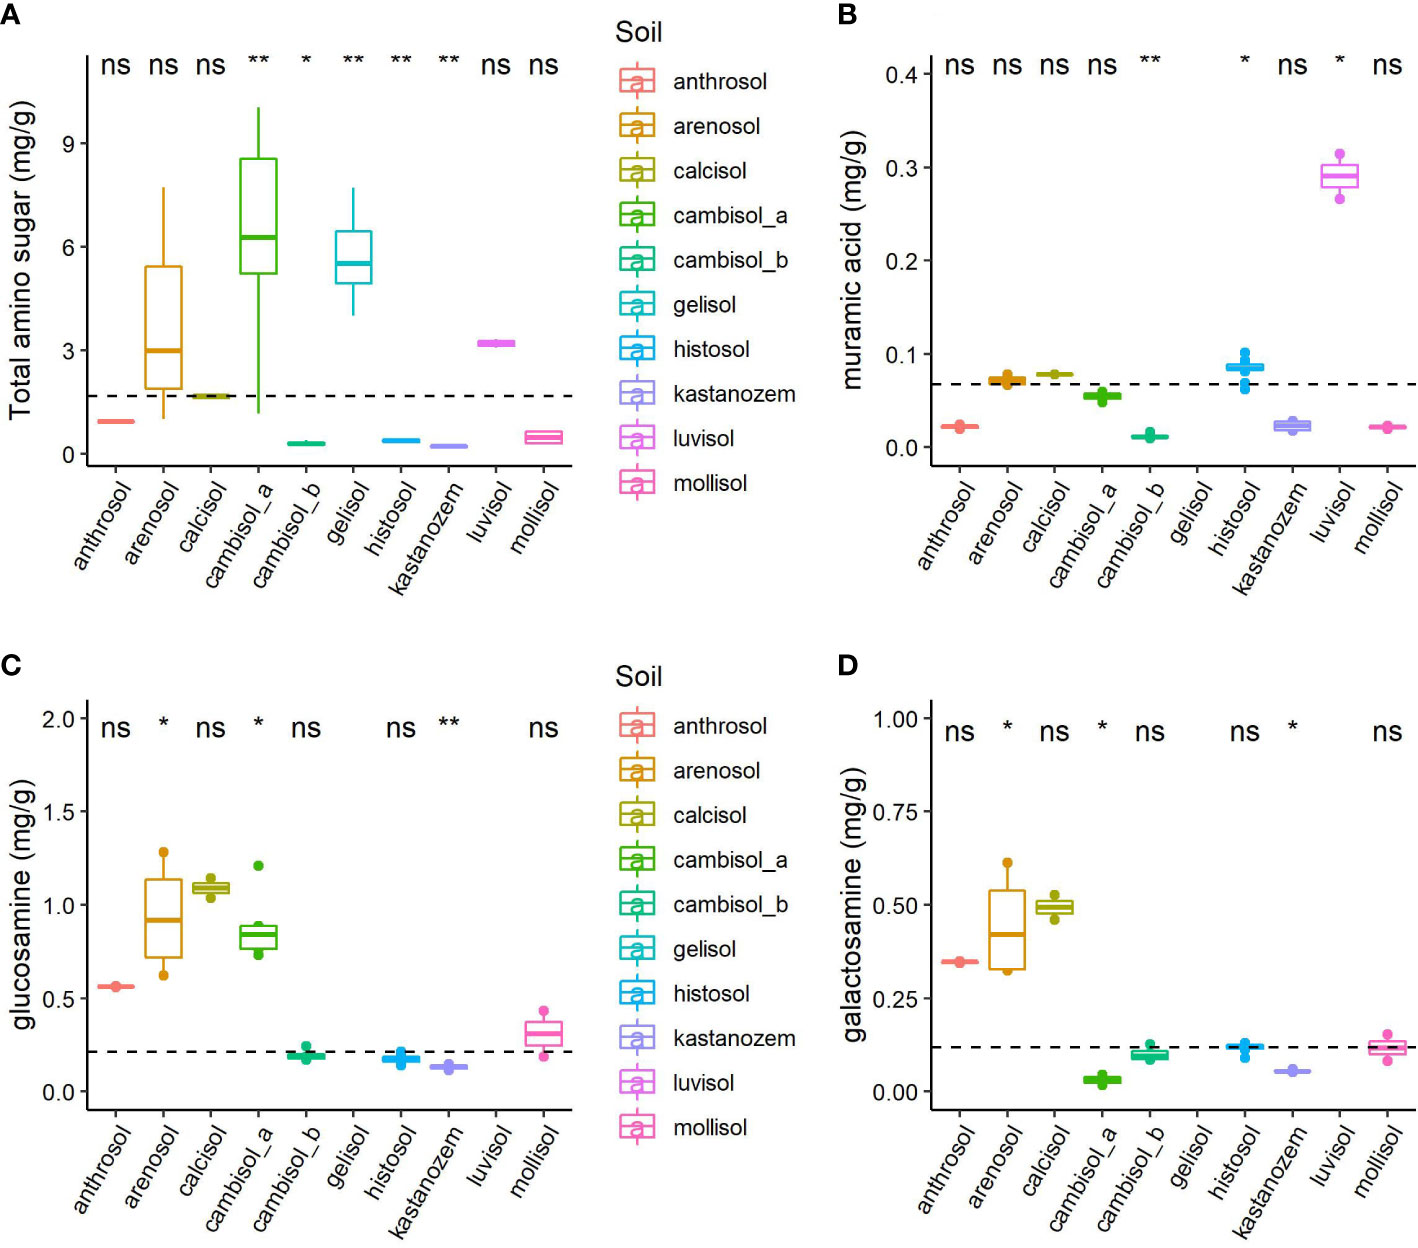
Figure 2 (A) Total amino sugars (mg/g), (B) muramic acid, (C) glucosamine, and (D) galactosamine across all soils. The Kruskal Wallis test detected significant differences in average individual and total amino sugar content across soils (p-value< 0.05). We performed post-hoc comparison using the Wilcoxon Rank-Sum test to determine where group differences originated from. The reference group for post-hoc comparison was the mean of all total or individual amino sugars (mg/g), which is shown by the dashed line. Statistical significance (p-value< 0.05) is indicated by asterisks whereas no statistical significance (p-value > 0.05) is indicated by "ns".
3.3 Predicting necromass with GLMs
We modeled the distribution of microbial necromass using a GLM with inverse Gaussian or gamma distributions. The null models, which state model coefficients are equal to zero, had poor goodness of fit relative to full models, as determined by model validation and model summary tables. We could not validate full models for any necromass biomarker that used biome, treatment group, warming magnitude, or warming duration as sole predictor variables. As discussed below, the addition of reference soil group as a predictor variable improved model goodness of fit for all necromass biomarkers.
3.3.1 GLM predicting total amino sugars
All validated GLMs that predict TAS used an inverse Gaussian distribution. We validated a GLM that predicted TAS with the warming method as the sole predictor variable. Our GLMs detected IR warming as a significant predictor of TAS whereas OTC warming was not a significant predictor. However, model performance was poor, as determined by model summary tables. We also validated GLMs that predicted TAS with the interaction between reference soil group, warming duration, and treatment group. These models also detected IR warming was a significant predictor of TAS, although warming duration and treatment group were insignificant predictors. Unfortunately, there were not enough observations to estimate if interactions between these predictor variables were significant. However, these models performed poorly relative to the GLM mentioned below.
Our best validated GLM, with the lowest AIC (ΔAIC > 99.09), used the reference soil group to predict TAS. Model summary tables revealed there were significant differences in TAS across reference soil groups (Table 2), which indicates soil group is a significant predictor of TAS. In addition to model summary tables, the estimated marginal means (EMM) of TAS differed across reference soil groups (Figure 3). Pairwise comparison on EMM indicated TAS significantly differed across some, but not all reference soil groups (Supplementary Table S1).
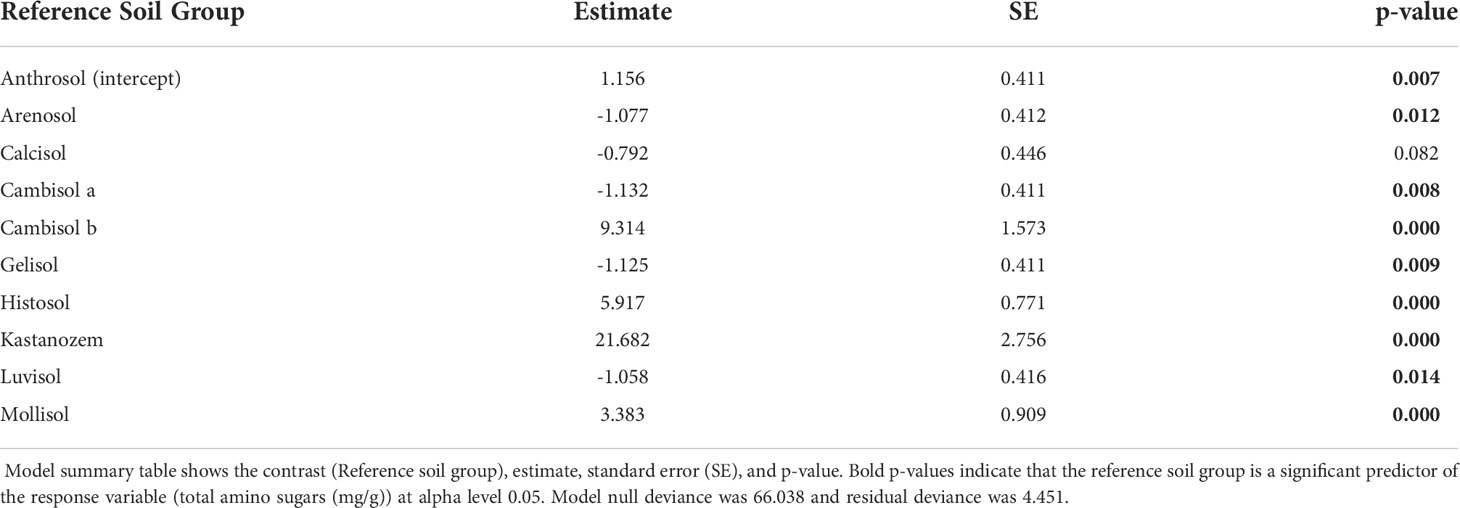
Table 2 Summary table of GLM predicting total amino sugars (mg/g) by reference soil group.
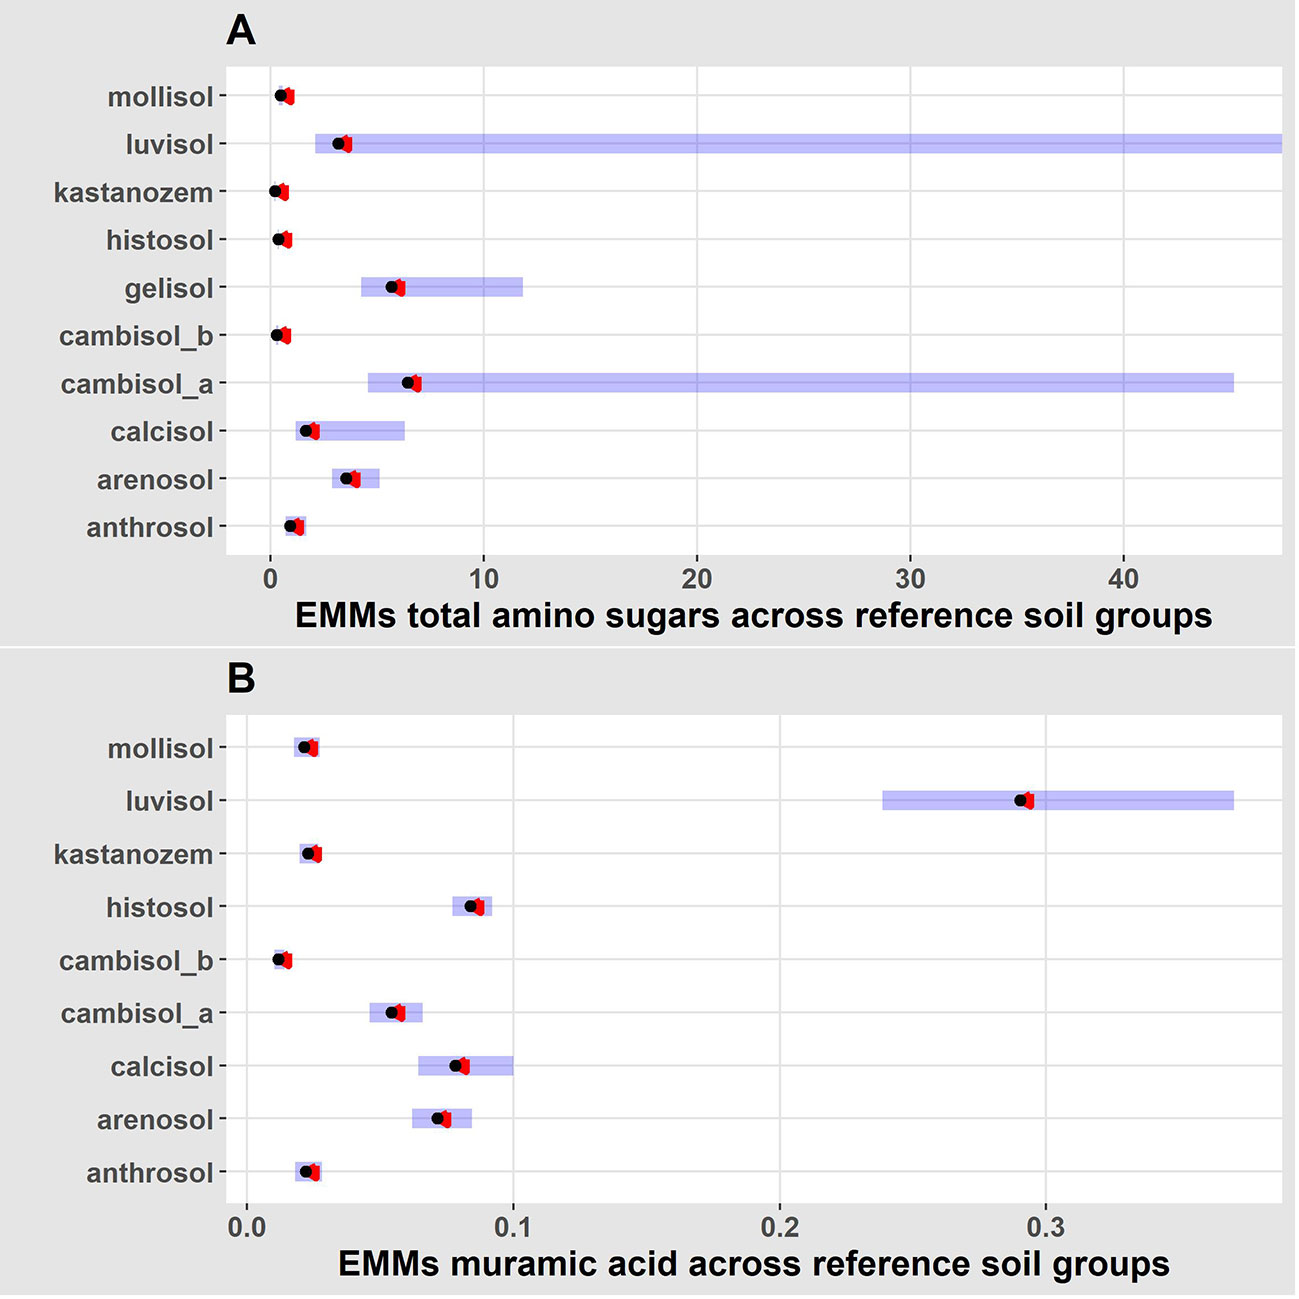
Figure 3 Plot of estimated marginal means (EMMs) from validated GLM’s that predicted total amino sugars (A) and muramic acid (B) using soil type. The blue bars represent confidence intervals for the EMMs, and the red arrows indicate comparisons between EMM’s. If red arrows from one soil type overlap with red arrows from another soil type, then no significant difference (p-value< 0.05) in necromass exists between the soil groups. If arrows do not overlap, then significant differences in necromass exist.
3.3.2 GLM predicting muramic acid
All validated models that predict mur used a gamma distribution. We validated models that predicted mur with soil texture, although this variable was not a significant predictor. We also validated a GLM that predicted mur with sampling depth and detected sampling depths of 0-10cm are significant predictors of mur. Other validated models used the interaction between reference soil group and method, reference soil group and depth, and reference soil group and biome. There were not enough observations to explore whether interactions between these categorical variables were significant.
Our best validated GLM used the reference soil group to predict variation in mur (ΔAIC > -231.19). Like TAS, model summary tables revealed reference soil group is a significant predictor of mur (Table 3). The EMM of mur also differed across reference soil groups (Figure 3). Pairwise comparison on EMM showed mur differed across several reference soil groups (Supplementary Table S2).
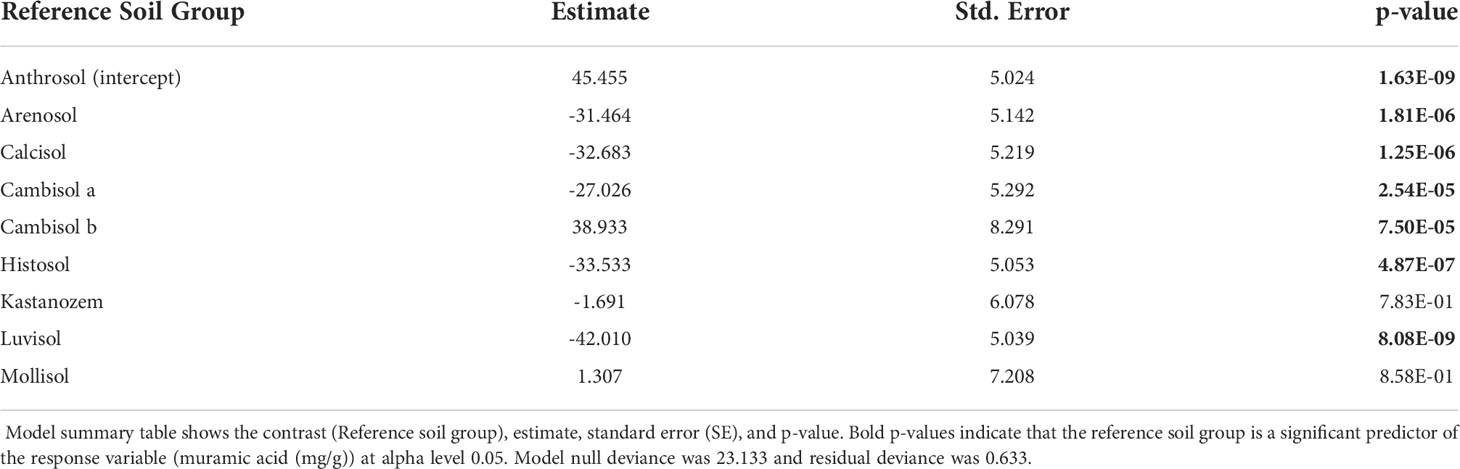
Table 3 Summary table of GLM predicting muramic acid (mg/g) by reference soil group.
3.3.3 GLM predicting glucosamine
All validated GLMs that predicted glu used an inverse Gaussian distribution. We validated a GLM that predicted glu with soil texture, which revealed clay loam and sandy loam soils are significant predictors of glu. Other validated GLMs that predict glu use either warming method or soil type as the sole predictor variables. These models detected OTC warming as a significant predictor of glu as well as several reference soil groups (anthrosol, cambisol b, histosol, kastanozem). However, the best GLM that predicted glu used the interaction between reference soil group and warming method (ΔAIC > -72.11). There were not enough observations of glu across soil warming experiments to estimate if the interaction between these categorical variables (soil * method) were significant. Because of this, we did not compute EMM or conduct post-hoc analysis.
3.3.4 GLM predicting galactosamine
Validated GLMs that predict gal use an inverse Gaussian distribution or gamma distribution. Gal was the only necromass biomarker that could not be predicted with reference soil group as the sole predictor variable. We validated GLMs that predict gal using the warming method with a gamma distribution and detected IR warming as a significant predictor of gal. We also validated GLMs that predicted gal with the interaction between warming magnitude and warming method using both inverse Gaussian or gamma distributions. Our model did not detect warming magnitude as a significant predictor of gal.
Our best model that predicted gal used the interaction between reference soil group and warming method with an inverse Gaussian distribution (ΔAIC > -139.9). Analogous to our top GLM that predicted glu, there were not enough observations to estimate if the interaction between categorical variables (soil group * warming method) were significant. Thus, we did not compute EMM or conduct post hoc analysis.
4 Discussion
Through a systematic review and meta-analysis of in situ soil warming experiments, we detected significant warming-induced effect sizes (lnRR) on necromass. We show that warming effect sizes on necromass were not uniform across reference soil groups, which supports our first hypothesis. However, warming did not significantly affect average necromass between treatment groups (p-values > 0.05); this contradicts our first hypothesis. These contrasting findings between effect sizes (lnRR) versus p-values (averages) may suggest the small sample size used in this analysis influenced the nonparametric tests, thus increasing the likelihood of type II errors. For instance, we detected significant differences in average TAS between treatment groups, specifically in gelisols, prior to averaging raw data from supplementary text (34). Ideally, raw data would not have been averaged prior to analysis but > 90% studies reported averaged amino sugars between treatment groups. Thus, we felt it was best to be consistent and use averaged values. The trade-off here is smaller sample sizes inflate the p-value. Ultimately, these findings suggest 1) warming had a variety of significant effect sizes that largely depend on the reference soil group and 2) warming did not significantly change average necromass between treatment groups.
Warming had positive effect sizes on necromass, depending on the reference soil group. This suggests warming may offset or increase microbial necromass production and deposition in the short term, possibly due to warm-induced increases in microbial mortality and turnover (16, 67). Soil microbes are primarily C limited, and the stress of climate change can divert resources away from growth and nutrient acquisition, altering microbial biomass composition, growth rates, and necromass deposition (68, 69).
Warming effect sizes were positive or insignificant on microbial necromass in frozen soils, including gelisols, gelic arenosols, and gelic cambisols. These permafrost soils all share similar pedogenesis (70), thus it is not surprising effect sizes were similar across these soils. Permafrost soils are generally C rich (70) so microbial recycling of necromass to satisfy C requirements is less likely to occur. In addition, average necromass stocks did not significantly differ across frozen soils, as per pairwise comparison analysis. These findings may indicate warming stressed out permafrost soil microbes, consequently enhancing mortality rates. This could increase necromass formation and deposition in the short term, whereas long-term increases in soil necromass would be accompanied by increased microbial growth and turnover. However, temperate forest soils exposed to chronic warming for almost 30 years show longer turnover times and lower mass-specific growth rates (71), likely due to limiting labile C.
Warming had positive or insignificant effect sizes on soil amino sugars in agricultural soils, which include gleyic stagnant anthrosols and argic rustic ustic cambisols. Its plausible that these agricultural soils are less limited by labile C, nitrogen, and phosphorus, which could explain why warming did not enhance microbial decomposition of necromass. However, it is worth mentioning that although amino sugars are commonly used necromass biomarkers, they come with limitations. For instance, amino sugars analysis does not capture necromass turnover times, only reflects necromass derived from microbial cell walls, and microbial origins are not always clear (16, 72, 73).
Warming effect sizes on necromass were negative in certain reference soil groups. This may suggest warming enhances microbial recycling of necromass and/or facilitates its destabilization. Microbes may recycle more necromass as a source of nutrients to cope with warm-induced reductions in labile C (16). Destabilization of necromass renders previously physicochemically protected necromass susceptible to decomposition (16); this can magnify positive soil C feedback and reduce soil C sequestration. Destabilization of microbial necromass is the least understood component of necromass dynamics (16).
Calcium is a commonly used SOM stabilization index since it promotes aggregation through calcium bridges. Thus, we would have expected warming would increase necromass deposition and stabilization in calcium rich soils, which include the calcic kastanozem, haplic calcisol, and argixeroll. However, this was not the case. Warming generally had significant negative effect sizes on glu, a fungal biomarker, and TAS in calcic soils. Because fungal contributions to necromass C can be greater than bacteria (74, 75); the observed negative warming effect size on TAS in calcisols and mollisols may have been more driven by reductions in fungal-derived rather than bacterial-derived necromass. These findings may suggest calcium is not a suitable indicator of stability for fungal-derived SOM, as measured by amino sugars.
We also show warming effects on TAS were more pronounced in mollisols and gelisols, as the unpooled lnRR significantly differed from the lnRR base mean across all reference soil groups. This may suggest microbial-derived SOM in mollisols and gelisols is more susceptible to climate warming effects relative to other soil groups. Mollisols (kastanozems or chernozems) are mid-latitude temperate grassland soils with thick organic horizons, used extensively for agriculture, and cover about 7% of ice-free land area (76). Because warming effects on necromass were negative in mollisols, and SOM is an indicator of soil health, climate warming may have severe consequences on mollisol health by reducing microbial-derived SOM sequestration. In contrast, gelisols (cryosols) are permafrost soils found in high latitude and elevation ecosystems and cover about 9-13% of ice-free land area (76). We show warming effect sizes were positive in gelisols, which suggest warming increased necromass stocks in these permafrost soils. However, long-term warming effects on microbial-derived SOM in gelisols is not clear. Gelisols are extremely carbon rich, except in desert ecosystems such as Antarctic tundra (76), and thus microbial-derived SOM feedback to climate warming is of great interest. Indeed, future research efforts should aim to explore necromass dynamics across all 32 reference soil groups, but these soils should be targeted as they are intrinsically linked to human food production (mollisols) and carbon cycling in northern latitudes (gelisols).
We modeled the variation of microbial necromass across soils with inverse Gaussian and gamma GLMs. The best GLM that predicted TAS and mur used soil type as the sole predictor variable. We did validate a soil only GLM for glu, but this was not the best model, so we did not compute EMM or conduct post-hoc analysis. We could not validate a soil-only GLM that predicted gal, which may be due to the unclear origins of galactosamine (72, 73). While mur and glu are generally considered to be exclusive to bacteria and fungi, respectively, gal can originate from both fungi and bacteria (72, 73). In any case, our GLMs show that the reference soil group explains most of the variation in three widely used necromass biomarkers and improved model performance.
Model summary tables revealed several reference soil groups are significant predictors of TAS and mur. Pairwise comparison analysis on EMM extracted from GLMs indicated TAS and mur significantly differed between soil groups; this supports our second hypothesis, although not every pairwise comparison was significant. Post hoc analysis (Wilcoxon Rank-Sum) on average necromass extracted directly from publications also pointed to the same conclusion; necromass differed between many soil groups. These findings may suggest 1) necromass varies across certain reference soil groups, 2) our sample sizes were too small to detect significant differences across all reference soil groups, or 3) other factors that are not completely unique to a soil group, such as soil texture or pH, influence necromass. In cases where significant pairwise differences were detected, this may be due to variation in soil physicochemical attributes across soil warming experiments, which differentially influence necromass dynamics. In sum, we show that reference soil group may be a useful framework for predicting microbial necromass stocks. However, more research studying in situ soil warming effects on microbial necromass is needed, especially in underrepresented soils (30) and ecosystems (16).
Our GLM that predicted mur with sampling depth detected soil depths of 0-10 cm are significant predictors of mur, although subsoil depths were not significant. This could be due to greater SOM content and microbial abundance in some topsoils versus subsoils. Although our GLM did not detect subsoil depths as significant predictors of mur, a recent analysis showed muramic acid significantly increases with soil depth (49). Our findings may be an artifact of our small sample size when compared to the large dataset analyzed by Ni et al, 2020. Furthermore, our model performed poorly when compared to the GLM that predicted mur with reference soil group.
Soil texture, or more specifically clay percentage, is often incorporated into soil C models. However, pairwise comparison analysis detected significant differences in necromass between soil groups that had similar textures and clay percentages. For instance, TAS significantly differed between haplic calcisols, calcic kastanozems, and argic rustic ustic cambisols, which all have a sandy loam texture (see Supplementary Table S1). Furthermore, GLMs that used soil texture as the sole predictor variable were either not validated or performed poorly relative to other predictors, including reference soil groups. Our findings may suggest the utility of moving beyond soil texture and incorporating soil classification systems into soil C models.
We show soil warming methodology also influences variation in necromass across soil warming experiments. Our best GLMs that predicted glu and gal used the interaction between reference soil group and warming method. We did validate a GLM that predicted TAS with the warming method although this was not the best model. Whereas IR warming was a significant predictor of TAS and gal, OTC warming was a significant predictor of glu. This may suggest that necromass biomarkers are differentially influenced by active warming (IR) versus passive warming (OTC).
Active warming methods such as IR or buried heated cables apply external heat to the system and are considered to more closely resemble climate warming scenarios (77). Unfortunately, these methods are more costly, energy intensive, and cause more soil disturbance when compared to passive warming methods (76). In contrast, temperature fluxes in passive warming methods are more variable and OTC are not applicable in forested ecosystems (77). Because sandy soils have lower specific heat capacity relative to clayey soils, less energy is required to heat coarse textured soil (78). Likewise, soil thermal conductivity, or the soil’s ability to conduct heat, is generally higher in coarse texture soils relative to fine texture soils (78). This means heat can move more freely in sand versus clay (78). Thus, active warming may be more appropriate in fine textured soils whereas passive warming may be just as effective in coarse textured soils. However, it is important to note soil specific heat capacity and thermal conductivity are positively correlated with soil moisture and this should be taken into account in soil warming experiments (78). How the reference soil group interacts with active versus passive warming methods is unknown because 1) there were not enough observations to estimate if interactions among predictor variables were significant and 2) a reference soil group can vary in texture.
These findings indicate passive versus active warming methodology can yield different necromass response patterns. More research is needed to understand the mechanistic reason for these methodological driven responses in necromass dynamics across reference soil groups. Although passive warming methods can be more variable, they may be advantageous when compared to active warming, especially in developing nations, as they are more economic, energy efficient, and cause less soil disturbance (77). OTC are ideal for ecosystems with low plant stature such as grasslands (77), whereas greenhouse warming has been shown to be efficient in higher stature ecosystems such as boreal forest (79). Thus, we recommend future research efforts measuring necromass to employ more passive soil warming methods when active warming is not feasible. Still, researchers must consider soil specific heat capacity and thermal conductivity in soil warming experiments; these properties influence the energy required to efficiently heat soil and the transfer of heat throughout the soil profile.
A major limitation of this study is the small sample size and unequal observations of necromass across soils, which hampers our confidence in the models and statistical analysis. Soil groups are not well represented in our analysis, and it was common that a specific soil group was only reported by one study. Differences in necromass content across publications could be attributed to a variety of climatic factors rather than soil-specific trends. However, soils are reflective of the climate and biome they formed in and thus, using reference soil groups to make predictions captures ecosystem data such as but not limited to precipitation, temperature, elevation, plant communities, and aspect.
Cross-comparison between studies is also difficult because of differences in warming methods, magnitude, and duration. Microbial necromass content and soil properties can vary with depth (48, 49) but soil sampling depth in our analysis ranged from 5-50cm. Furthermore, our data are based upon short and medium length warming experiments since long-term (>10 year) studies are not yet available. Consequently, long-term warming effects on microbial necromass are not yet clear. Finally, grasslands are overrepresented in this meta-analysis and account for > 70% of all experimental locations.
5 Conclusion
Our study highlights a lack of research available examining warming effects on microbial-derived SOM. We also show the warming method can be a significant predictor of necromass. Although passive warming methods can be more variable, they may be advantageous when compared to active warming, especially in developing countries, as they are more economic, energy efficient, and cause less soil disturbance (77). Thus, we recommend future research efforts measuring necromass to employ more passive soil warming methods when active warming is not feasible. Our analysis should serve as a call to action to encourage more research studying 1) warming effects, especially long-term warming effects, on microbial necromass across all 32 reference soil groups (with emphasis on gelisols and mollisols), 2) how experimental soil warming methods influence necromass dynamics across reference soil groups, and 3) what predictors of necromass are captured in soil classification systems (reference soil groups) but not in soil texture or clay percentage. Further study of climate change effects on necromass deposition, turnover, and stocks will advance our understanding of SOM dynamics, strengthen carbon models, and inform climate change mitigation strategies.
Data availability statement
Publicly available datasets were analyzed in this study. This data can be found here: OSF: https://osf.io/b9g8r/?view_only=81e36aacc4094f81bac0c3e65d0d4e2c.
Author contributions
MFM and KMD contributed to the conceptualization. MFM conducted systematic review, acquired data, performed statistical analysis, and wrote the first draft of the manuscript. KMD provided substantial contributions to reviewing and editing of manuscript drafts, visualization of data, and mentoring. MGM provided substantial contributions to methodology and data analysis and provided academic resources. All authors contributed to manuscript revisions, read, and approved the submitted version.
Funding
This work was funded by the National Science Foundation (NSF) Long-Term Ecological Research (DEB 1832210) and CAREER (DEB 1749206) programs.
Acknowledgments
We would like to thank and acknowledge the authors whose work was used in this meta-analysis. We would also like to thank and acknowledge our anonymous peer reviewers. We are very grateful for their time and effort in reviewing our manuscript. This work was completed with support from the National Science Foundation (NSF) Long-Term Ecological Research (DEB 1832210) and CAREER (DEB 1749206) programs.
Conflict of interest
The authors declare that the research was conducted in the absence of any commercial or financial relationships that could be construed as a potential conflict of interest.
Publisher’s note
All claims expressed in this article are solely those of the authors and do not necessarily represent those of their affiliated organizations, or those of the publisher, the editors and the reviewers. Any product that may be evaluated in this article, or claim that may be made by its manufacturer, is not guaranteed or endorsed by the publisher.
Supplementary material
The Supplementary Material for this article can be found online at: https://www.frontiersin.org/articles/10.3389/fsoil.2022.987178/full#supplementary-material
References
1. Friedlingstein P, Cox P, Betts R, Bopp L, von Bloh W, Brovkin V, et al. Climate–carbon cycle feedback analysis: Results from the C4MIP model intercomparison. J Clim (2006) 19(14):3337–53. doi: 10.1175/JCLI3800.1
2. Hawkins E, Sutton R. The potential to narrow uncertainty in regional climate predictions. Bull Amer Meteor Soc (2009) 90(8):1095–107. doi: 10.1175/2009BAMS2607.1
3. Schmidt MWI, Torn MS, Abiven S, Dittmar T, Guggenberger G, Janssens IA, et al. Persistence of soil organic matter as an ecosystem property. Nature (2011) 478(7367):49–56. doi: 10.1038/nature10386
4. Jobbágy EG, Jackson RB. The vertical distribution of soil organic carbon and its relation to climate and vegetation. Ecol Appl (2000) 10(2):423–36. doi: 10.1890/1051-0761(2000)010[0423:TVDOSO]2.0.CO;2
5. Melillo JM, Frey SD, DeAngelis KM, Werner WJ, Bernard MJ, Bowles FP, et al. Long-term pattern and magnitude of soil carbon feedback to the climate system in a warming world. Science (2017) 358(6359):101–5. doi: 10.1126/science.aan2874
6. Allison SD, Wallenstein MD, Bradford MA. Soil-carbon response to warming dependent on microbial physiology. Nat Geosci (2010) 3(5):336–40. doi: 10.1038/ngeo846
7. Frey SD, Lee J, Melillo JM, Six J. The temperature response of soil microbial efficiency and its feedback to climate. Nat Clim Change (2013) 3(4):395–8. doi: 10.1038/nclimate1796
8. Crowther TW, Bradford MA. Thermal acclimation in widespread heterotrophic soil microbes. Ecol Lett (2013) 16(4):469–77. doi: 10.1111/ele.12069
9. Bradford MA, Davies CA, Frey SD, Maddox TR, Melillo JM, Mohan JE, et al. Thermal adaptation of soil microbial respiration to elevated temperature. Ecol Lett (2008) 11(12):1316–27. doi: 10.1111/j.1461-0248.2008.01251.x
10. Knorr W, Prentice IC, House JI, Holland EA. Long-term sensitivity of soil carbon turnover to warming. Nature. (2005) 433(7023):298–301. doi: 10.1038/nature03226
11. Kirschbaum MUF. Soil respiration under prolonged soil warming: are rate reductions caused by acclimation or substrate loss? Global Change Biol (2004) 10(11):1870–7. doi: 10.1111/j.1365-2486.2004.00852.x
12. DeAngelis KM, Pold G, Topçuoğlu BD, van Diepen LTA, Varney RM, Blanchard JL, et al. Long-term forest soil warming alters microbial communities in temperate forest soils. Front Microbiol (2015) 6:104. doi: 10.3389/fmicb.2015.00104
13. Abs E, Saleska SR, Ferriere R. Microbial evolution reshapes soil carbon feedbacks to climate change. BioRxiv (2019). doi: 10.1101/641399
14. Romero-Olivares AL, Taylor JW, Treseder KK. Neurospora discreta as a model to assess adaptation of soil fungi to warming. BMC Evol Biol (2015) 15:198. doi: 10.1186/s12862-015-0482-2
15. Kästner M, Miltner A, Thiele-Bruhn S, Liang C. Microbial necromass in soils–linking microbes to soil processes and carbon turnover. Front Environ Sci (2021) 9. doi: 10.3389/fenvs.2021.756378
16. Buckeridge KM, Creamer C, Whitaker J. Deconstructing the microbial necromass continuum to inform soil carbon sequestration. Funct Ecol (2022) 36(6):1396–410. doi: 10.1111/1365-2435.14014
17. Zhang X, Amelung W. Gas chromatographic determination of muramic acid, glucosamine, mannosamine, and galactosamine in soils. Soil Biol Biochem (1996) 28(9):1201–6. doi: 10.1016/0038-0717(96)00117-4
18. Kimble JM, Follett RF, Stewart BA eds. Methods using amino sugars as markers for microbial residues in soil. In: Assessment methods for soil carbon. Boca Raton, FL, USA: CRC Press. p. 251–90.
19. Dong W, Song A, Yin H, Liu X, Li J, Fan F. Decomposition of microbial necromass is divergent at the individual taxonomic level in soil. Front Microbiol (2021) 12:679793. doi: 10.3389/fmicb.2021.679793
20. Romero-Olivares AL, Allison SD, Treseder KK. Soil microbes and their response to experimental warming over time: A meta-analysis of field studies. Soil Biol Biochem (2017) 107:32–40. doi: 10.1016/j.soilbio.2016.12.026
21. Lu M, Zhou X, Yang Q, Li H, Luo Y, Fang C, et al. Responses of ecosystem carbon cycle to experimental warming: a meta-analysis. Ecology (2013) 94(3):726–38. doi: 10.1890/12-0279.1
22. Xu W, Yuan W. Responses of microbial biomass carbon and nitrogen to experimental warming: A meta-analysis. Soil Biol Biochem (2017) 115:265–74. doi: 10.1016/j.soilbio.2017.08.033
23. Chen J, Luo Y, Xia J, Jiang L, Zhou X, Lu M, et al. Stronger warming effects on microbial abundances in colder regions. Sci Rep (2015) 5:18032. doi: 10.1038/srep18032
24. Gao W, Yan D. Warming suppresses microbial biomass but enhances n recycling. Soil Biol Biochem (2019) 131:111–8. doi: 10.1016/j.soilbio.2019.01.002
25. Gang F, Haorui Z, Shaowei L, Wei S. A meta-analysis of the effects of warming and elevated CO2 on soil microbes. J Resour Ecol (2019) 10(1):69. doi: 10.5814/j.issn.1674-764x.2019.01.009
26. Zhang X-Z, Shen Z-X, Fu G. A meta-analysis of the effects of experimental warming on soil carbon and nitrogen dynamics on the Tibetan plateau. Appl Soil Ecol (2015) 87:32–8. doi: 10.1016/j.apsoil.2014.11.012
27. Liang C, Amelung W, Lehmann J, Kästner M. Quantitative assessment of microbial necromass contribution to soil organic matter. Glob Chang Biol (2019) 25(11):3578–90. doi: 10.1111/gcb.14781
28. Chen G, Ma S, Tian D, Xiao W, Jiang L, Xing A, et al. Patterns and determinants of soil microbial residues from tropical to boreal forests. Soil Biol Biochem (2020) 151:108059. doi: 10.1016/j.soilbio.2020.108059
29. Ding X, Zhang B, Lü X, Wang J, Horwath WR. Parent material and conifer biome influence microbial residue accumulation in forest soils. Soil Biol Biochem (2017) 107:1–9. doi: 10.1016/j.soilbio.2016.12.020
30. Kögel-Knabner I, Amelung W. Soil organic matter in major pedogenic soil groups. Geoderma. (2021) 384:114785. doi: 10.1016/j.geoderma.2020.114785
31. Sánchez-Marañón M, Miralles I, Aguirre-Garrido JF, Anguita-Maeso M, Millán V, Ortega R, et al. Changes in the soil bacterial community along a pedogenic gradient. Sci Rep (2017) 7(1):14593. doi: 10.1038/s41598-017-15133-x
32. Amelung W, Bossio D, de Vries W, Kögel-Knabner I, Lehmann J, Amundson R, et al. Towards a global-scale soil climate mitigation strategy. Nat Commun (2020) 11(1):5427. doi: 10.1038/s41467-020-18887-7
33. Zhang H, Guo Y, Song C, Song Y, Wang X, Sun L, et al. Six-year warming decreased amino sugar accumulation in the deep rhizosphere soil of permafrost peatland. Appl Soil Ecol (2022) 171:104316. doi: 10.1016/j.apsoil.2021.104316
34. Chang R, Liu S, Chen L, Li N, Bing H, Wang T, et al. Soil organic carbon becomes newer under warming at a permafrost site on the Tibetan plateau. Soil Biol Biochem (2021) 152:108074. doi: 10.1016/j.soilbio.2020.108074
35. Ding X, Chen S, Zhang B, He H, Filley TR, Horwath WR. Warming yields distinct accumulation patterns of microbial residues in dry and wet alpine grasslands on the qinghai-Tibetan plateau. Biol Fertil Soils (2020) 56(7):881–92. doi: 10.1007/s00374-020-01474-9
36. Ding X, Chen S, Zhang B, Liang C, He H, Horwath WR. Warming increases microbial residue contribution to soil organic carbon in an alpine meadow. Soil Biol Biochem (2019) 135:13–9. doi: 10.1016/j.soilbio.2019.04.004
37. Ma L, Ju Z, Fang Y, Vancov T, Gao Q, Wu D, et al. Soil warming and nitrogen addition facilitates lignin and microbial residues accrual in temperate agroecosystems. Soil Biol Biochem (2022) 170:108693. doi: 10.1016/j.soilbio.2022.108693
38. Jing Y, Wang Y, Liu S, Zhang X, Wang Q, Liu K, et al. Interactive effects of soil warming, throughfall reduction, and root exclusion on soil microbial community and residues in warm-temperate oak forests. Appl Soil Ecol (2019) 142:52–8. doi: 10.1016/j.apsoil.2019.05.020
39. Liang C, Gutknecht JLM, Balser TC. Microbial lipid and amino sugar responses to long-term simulated global environmental changes in a California annual grassland. Front Microbiol (2015) 6:385. doi: 10.3389/fmicb.2015.00385
40. Liang C, Balser TC. Warming and nitrogen deposition lessen microbial residue contribution to soil carbon pool. Nat Commun (2012) 3:1222. doi: 10.1038/ncomms2224
41. Shao P, He H, Zhang X, Xie H, Bao X, Liang C. Responses of microbial residues to simulated climate change in a semiarid grassland. Sci Total Environ (2018) 644:1286–91. doi: 10.1016/j.scitotenv.2018.07.055
42. Tian J, Zong N, Hartley IP, He N, Zhang J, Powlson D, et al. Microbial metabolic response to winter warming stabilizes soil carbon. Glob Chang Biol (2021) 27(10):2011–28. doi: 10.1111/gcb.15538
43. Zhu E, Cao Z, Jia J, Liu C, Zhang Z, Wang H, et al. Inactive and inefficient: Warming and drought effect on microbial carbon processing in alpine grassland at depth. Glob Chang Biol (2021) 27(10):2241–53. doi: 10.1111/gcb.15541
44. Liu Z, Liu X, Wu X, Bian R, Liu X, Zheng J, et al. Long-term elevated CO2 and warming enhance microbial necromass carbon accumulation in a paddy soil. Biol Fertil Soils (2021) 57(5):673–84. doi: 10.1007/s00374-021-01557-1
45. Moher D, Shamseer L, Clarke M, Ghersi D, Liberati A, Petticrew M, et al. Preferred reporting items for systematic review and meta-analysis protocols (PRISMA-p) 2015 statement. Syst Rev (2015) 4(1):1. doi: 10.1186/2046-4053-4-1
46. Elmendorf SC, Henry GHR, Hollister RD, Fosaa AM, Gould WA, Hermanutz L, et al. Experiment, monitoring, and gradient methods used to infer climate change effects on plant communities yield consistent patterns. Proc Natl Acad Sci USA (2015) 112(2):448–52. doi: 10.1073/pnas.1410088112
47. Kohl L, Myers-Pigg A, Edwards KA, Billings SA, Warren J, Podrebarac FA, et al. Microbial inputs at the litter layer translate climate into altered organic matter properties. Glob Chang Biol (2021) 27(2):435–53. doi: 10.1111/gcb.15420
48. He M, Fang K, Chen L, Feng X, Qin S, Kou D, et al. Depth-dependent drivers of soil microbial necromass carbon across Tibetan alpine grasslands. Glob Chang Biol (2022) 28(3):936–49. doi: 10.1111/gcb.15969
49. Ni X, Liao S, Tan S, Peng Y, Wang D, Yue K, et al. The vertical distribution and control of microbial necromass carbon in forest soils. Global Ecol Biogeography (2020) 29(10):1829–39. doi: 10.1111/geb.13159
50. NRCS-USDA SSS. Web soil survey (2017). Available at: http://websoilsurvey.sc.egov.usda.gov/.
51. Rohatgi A. Webplotdigitizer. Pacifica, California, USA (2021). Available at: https://automeris.io/WebPlotDigitizer.
52. Hedges LV, Gurevitch J, Curtis PS. The meta-analysis of response ratios in experimental ecology. Ecology (1999) 80(4):1150–6. doi: 10.1890/0012-9658(1999)080[1150:TMAORR]2.0.CO;2
53. R Core Team. R: A language and environment for statistical computing. In: R package version 411 (2021).
54. Viechtbauer W. Conducting meta-analyses in r with the metafor package. J Stat Softw (2010) 36(3):153–60. doi: 10.18637/jss.v036.i03
55. Scheinin I, Kalimeri M, Jagerroos V, Parkkinen J, Tikkanen E, Würtz P, et al. Ggforestplot: Forestplots of measures of effects and their confidence intervals. (2022).
56. Balduzzi S, Rücker G, Schwarzer G. How to perform a meta-analysis with r: a practical tutorial. Evid Based Ment Health (2019) 22(4):153–60. doi: 10.1136/ebmental-2019-300117
58. Clarke E, Sherrill-Mix S. Ggbeeswarm: Categorical scatter (Violin point) plots. In: R package version 060 (2017).
59. Kassambara A. Ggpubr: “ggplot2” based publication ready plots. In: R package version 040 (2020).
60. Carroll J, Schep A, Sidi J. Ggeasy: Easy access to “ggplot2” commands. In: R package version 013 (2021).
61. Patil I. Visualizations with statistical details: The “ggstatsplot” approach. JOSS. (2021) 6(61):3167. doi: 10.21105/joss.03167
63. Hartig F. DHARMa: Residual diagnostics for hierarchical (Multi-level / mixed) regression models. In: R package version 045 (2022).
64. Mazerolle MJ. AICcmodavg: Model selection and multimodel inference based on (Q)AIC(c). In: R package version 23-1 (2020).
65. Lenth RV. Emmeans: Estimated marginal means, aka least-squares means. In: R package version 171-1 (2021).
66. Iannone R, Cheng JC, Schloerke B. Gt: Easily create presentation-ready display tables. In: R package version 050 (2022).
67. Wang X, Wang C, Cotrufo MF, Sun L, Jiang P, Liu Z, et al. Elevated temperature increases the accumulation of microbial necromass nitrogen in soil via increasing microbial turnover. Glob Chang Biol (2020) 26(9):5277–89. doi: 10.1111/gcb.15206
68. Crowther TW, Sokol NW, Oldfield EE, Maynard DS, Thomas SM, Bradford MA. Environmental stress response limits microbial necromass contributions to soil organic carbon. Soil Biol Biochem (2015) 85:153–61. doi: 10.1016/j.soilbio.2015.03.002
69. Fernandez CW, Kennedy PG. Melanization of mycorrhizal fungal necromass structures microbial decomposer communities. J Ecol (2018) 106(2):468–79. doi: 10.1111/1365-2745.12920
70. Ping CL, Jastrow JD, Jorgenson MT, Michaelson GJ, Shur YL. Permafrost soils and carbon cycling. SOIL (2015) 1(1):147–71. doi: 10.5194/soil-1-147-2015
71. Liu XJA, Pold G, Domeignoz-Horta LA, Geyer KM, Caris H, Nicolson H, et al. Soil aggregate-mediated microbial responses to long-term warming. Soil Biol Biochem (2021) 152:108055. doi: 10.1016/j.soilbio.2020.108055
72. Amelung W, Zhang X, Flach KW, Zech W. Amino sugars in native grassland soils along a climosequence in north America. Soil Sci Soc Am J (1999) 63(1):86–92. doi: 10.2136/sssaj1999.03615995006300010014x
73. Engelking B, Flessa H, Joergensen RG. Shifts in amino sugar and ergosterol contents after addition of sucrose and cellulose to soil. Soil Biol Biochem (2007) 39(8):2111–8. doi: 10.1016/j.soilbio.2007.03.020
74. Li N, Xu Y-Z, Han X-Z, He H-B, Zhang X, Zhang B. Fungi contribute more than bacteria to soil organic matter through necromass accumulation under different agricultural practices during the early pedogenesis of a mollisol. Eur J Soil Biol (2015) 67:51–8. doi: 10.1016/j.ejsobi.2015.02.002
75. Liu Y, Tian J, He N, Tiemann L. Global microbial necromass contribution to soil organic matter. Res Sq. (2021). doi: 10.21203/rs.3.rs-473688/v1
76. Buol SW, Southard RJ, Graham RC, McDaniel PA. Soil genesis and classification. 6th ed. Hoboken, NJ, USA: John Wiley & Sons (2011).
77. Aronson EL, McNulty SG. Appropriate experimental ecosystem warming methods by ecosystem, objective, and practicality. Agric For Meteorology (2009) 149(11):1791–9. doi: 10.1016/j.agrformet.2009.06.007
Keywords: Soil warming, microbial necromass, amino sugars, soil organic matter, soil carbon, soil classification, reference soil group, generalized linear modeling
Citation: Mitchell MF, MacLean MG and DeAngelis KM (2022) Microbial necromass response to soil warming: A meta-analysis. Front. Soil Sci. 2:987178. doi: 10.3389/fsoil.2022.987178
Received: 05 July 2022; Accepted: 05 September 2022;
Published: 23 September 2022.
Edited by:
Jacynthe Dessureault-Rompré, Laval University, CanadaReviewed by:
Zhenghu Zhou, Northeast Forestry University, ChinaJessica L. M. Gutknecht, University of Minnesota Twin Cities, United States
Copyright © 2022 Mitchell, MacLean and DeAngelis. This is an open-access article distributed under the terms of the Creative Commons Attribution License (CC BY). The use, distribution or reproduction in other forums is permitted, provided the original author(s) and the copyright owner(s) are credited and that the original publication in this journal is cited, in accordance with accepted academic practice. No use, distribution or reproduction is permitted which does not comply with these terms.
*Correspondence: Kristen M. DeAngelis, ZGVhbmdlbGlzQG1pY3JvYmlvLnVtYXNzLmVkdQ==