 Paulina B. Ramírez
 Stephen Machado
 Surendra Singh
 Rachael Plunkett
 Francisco J. Calderón1
- 1Columbia Basin Agricultural Research Center, Carbon Center, Oregon State University, Pendleton, OR, United States
- 2Lind Dryland Research Station, Washington State University, Pullman, WA, United States
Soil organic carbon (SOC) is considered a significant contributor to soil water retention. However, generalizations about the role of SOC in available water-holding capacity (AWHC) may have inaccurately portrayed this relationship. We aim to reexamine the relationship between SOC and water retention using the National Cooperative Soil Survey (NCSS) Database. We focus on regional soil groups within the Pacific Northwest wheat production region, including Haploxerolls, Argixerolls, Haplocambids, and Durixerolls. We evaluated 77 sites based on SOC, total nitrogen (TN), pH, texture, bulk density (BD), field capacity (FC), permanent wilting point (PWP), and AWHC. Our findings indicate that texture and BD were the most significant contributors to AWHC variation, while SOC played a secondary role in explaining this variation. Mid-infrared (MIR) spectroscopy coupled with a random forest (RF) algorithm was used to evaluate the importance of spectral bands in determining changes in FC and PWP. This analysis identified mineral bands related to inner-surface hydroxyl groups in kaolinite (3700 cm −1) and Si-O-Si overtones (1870 cm −1) as the most important spectral contributors to PWP. The water retention at FC was associated with organic absorbances relevant to soil aggregation, such as polysaccharide C–O (~1035 cm −1), while mineral bands were relatively less influential. This study highlights the need to reexamine the impact of SOC as well as the interaction between soil texture and compaction on soil water retention to elucidate the underlying mechanisms responsible for AWHC, thus providing insight into future drought adaptation strategies.
1 Introduction
Pacific Northwest Region of North America (PNW) face challenges for grain production due to a decline in soil organic carbon (SOC), decreased precipitation, and the intensification of seasonal droughts (1, 2). There is currently no consensus on how small increases in soil organic matter (SOM) might affect available water-holding capacity (AWHC) (3, 4). Given the high diversity of soils and land uses, generalizations about SOM’s role in soil AWHC must be demonstrated at a regional scale for defined soil types and specific cropping systems.
Improving the ability of soil to retain water and nutrients is crucial to achieving higher agricultural productivity in dryland cropping systems (5). Increasing SOC through organic amendments, such as biochar and farmyard manure, is one strategy that is receiving considerable attention as a way of making agroecosystems more resilient (6). Despite the demonstrated importance of SOC in soil water retention, variations in AWHC are shaped by the interplay of soil mechanical, physico-chemical, and biological processes (7–9). These differences are also associated with specific environmental and farm-specific conditions, which makes it challenging to generalize observed patterns and develop a predictive understanding of AWHC dynamics. For example, AWHC in coarse-textured soils tends to be more responsive to the effects of organic amendments than fine-textured soils, due to lower initial SOC values and a wider range for improvement related to pore space (10). Indeed, when SOC content is lower, an increase in carbon (C) content leads to increased water retention in sandy soil and decreased water retention in fine-textured soil (11, 12). Likewise, it is well known that agronomic practices such as tillage, inorganic fertilization, and crop rotation, as well as the presence of certain plant species can also affect water storage (13–15).
A potential approach that may provide important insight into AWHC is the application of spectroscopy to identify water-retaining soil components. Diffuse reflectance mid-infrared (MIR) spectroscopy can potentially reduce the cost and effort involved in analyzing soil health (16, 17). Mid-infrared bands (4000–400 cm −1) are sensitive to texture-related absorbances like Si–O, quartz (sand), and kaolinite clays (18, 19). Soil C moieties can be identified by amide stretching near 1680 cm−1, carboxylate at 1600-1400 cm −1, stretching vibration of carboxyl groups C═O at 1740 cm –1, and aliphatic stretching vibration (3000–2800 cm −1). In addition, spectral bands can be correlated with soil water properties and have been used to predict soil water content (17, 20). For example, MIR absorption at 3700 cm −1 correlates closely with water suction at −1500 kPa, which is associated with clay minerals (21).
Although many studies provide convincing evidence that changes in SOC are responsible for increased plant-available water (3, 22, 23), the role of C in AWHC dynamics is still ambiguous due to conflicting results reported in the literature (4). Downscaling from global to regional scales reduces uncertainties associated with internal soil-specific variability, revealing the effects of various hidden factors (24). Therefore, this study seeks to evaluate the contribution of SOC to AWHC in the PNW at a regional scale. Its main objectives are: 1) examine the relationship between soil water retention and SOC in PNW agricultural soils, 2) identify soil attributes associated with AWHC at a regional spatial scale, and 3) demonstrate the capability of MIR absorbances to predict AWHC.
2 Materials and methods
2.1 Site description
The Soil Characterization Database at the USDA NRCS National Soil Survey Center in Lincoln, Nebraska, was used for this study. We included soil and spectral data from 77 locations in Idaho, Washington, and Oregon. We selected 144 samples, including Mollisols (Argixerolls, Haploxerolls, Durixerolls) and Aridisols (Haplocambids). The selected samples are a good representation of the potential wheat production soils of the Pacific Northwest (Figure 1). We focused on the A horizon and transitional A–B horizons since these soil layers are more responsive to agricultural management. The mean annual temperature (MAT) in this study area ranges between 5.3 and 11.6°C, while annual precipitation (P) varies from 217–2300 mm annually.
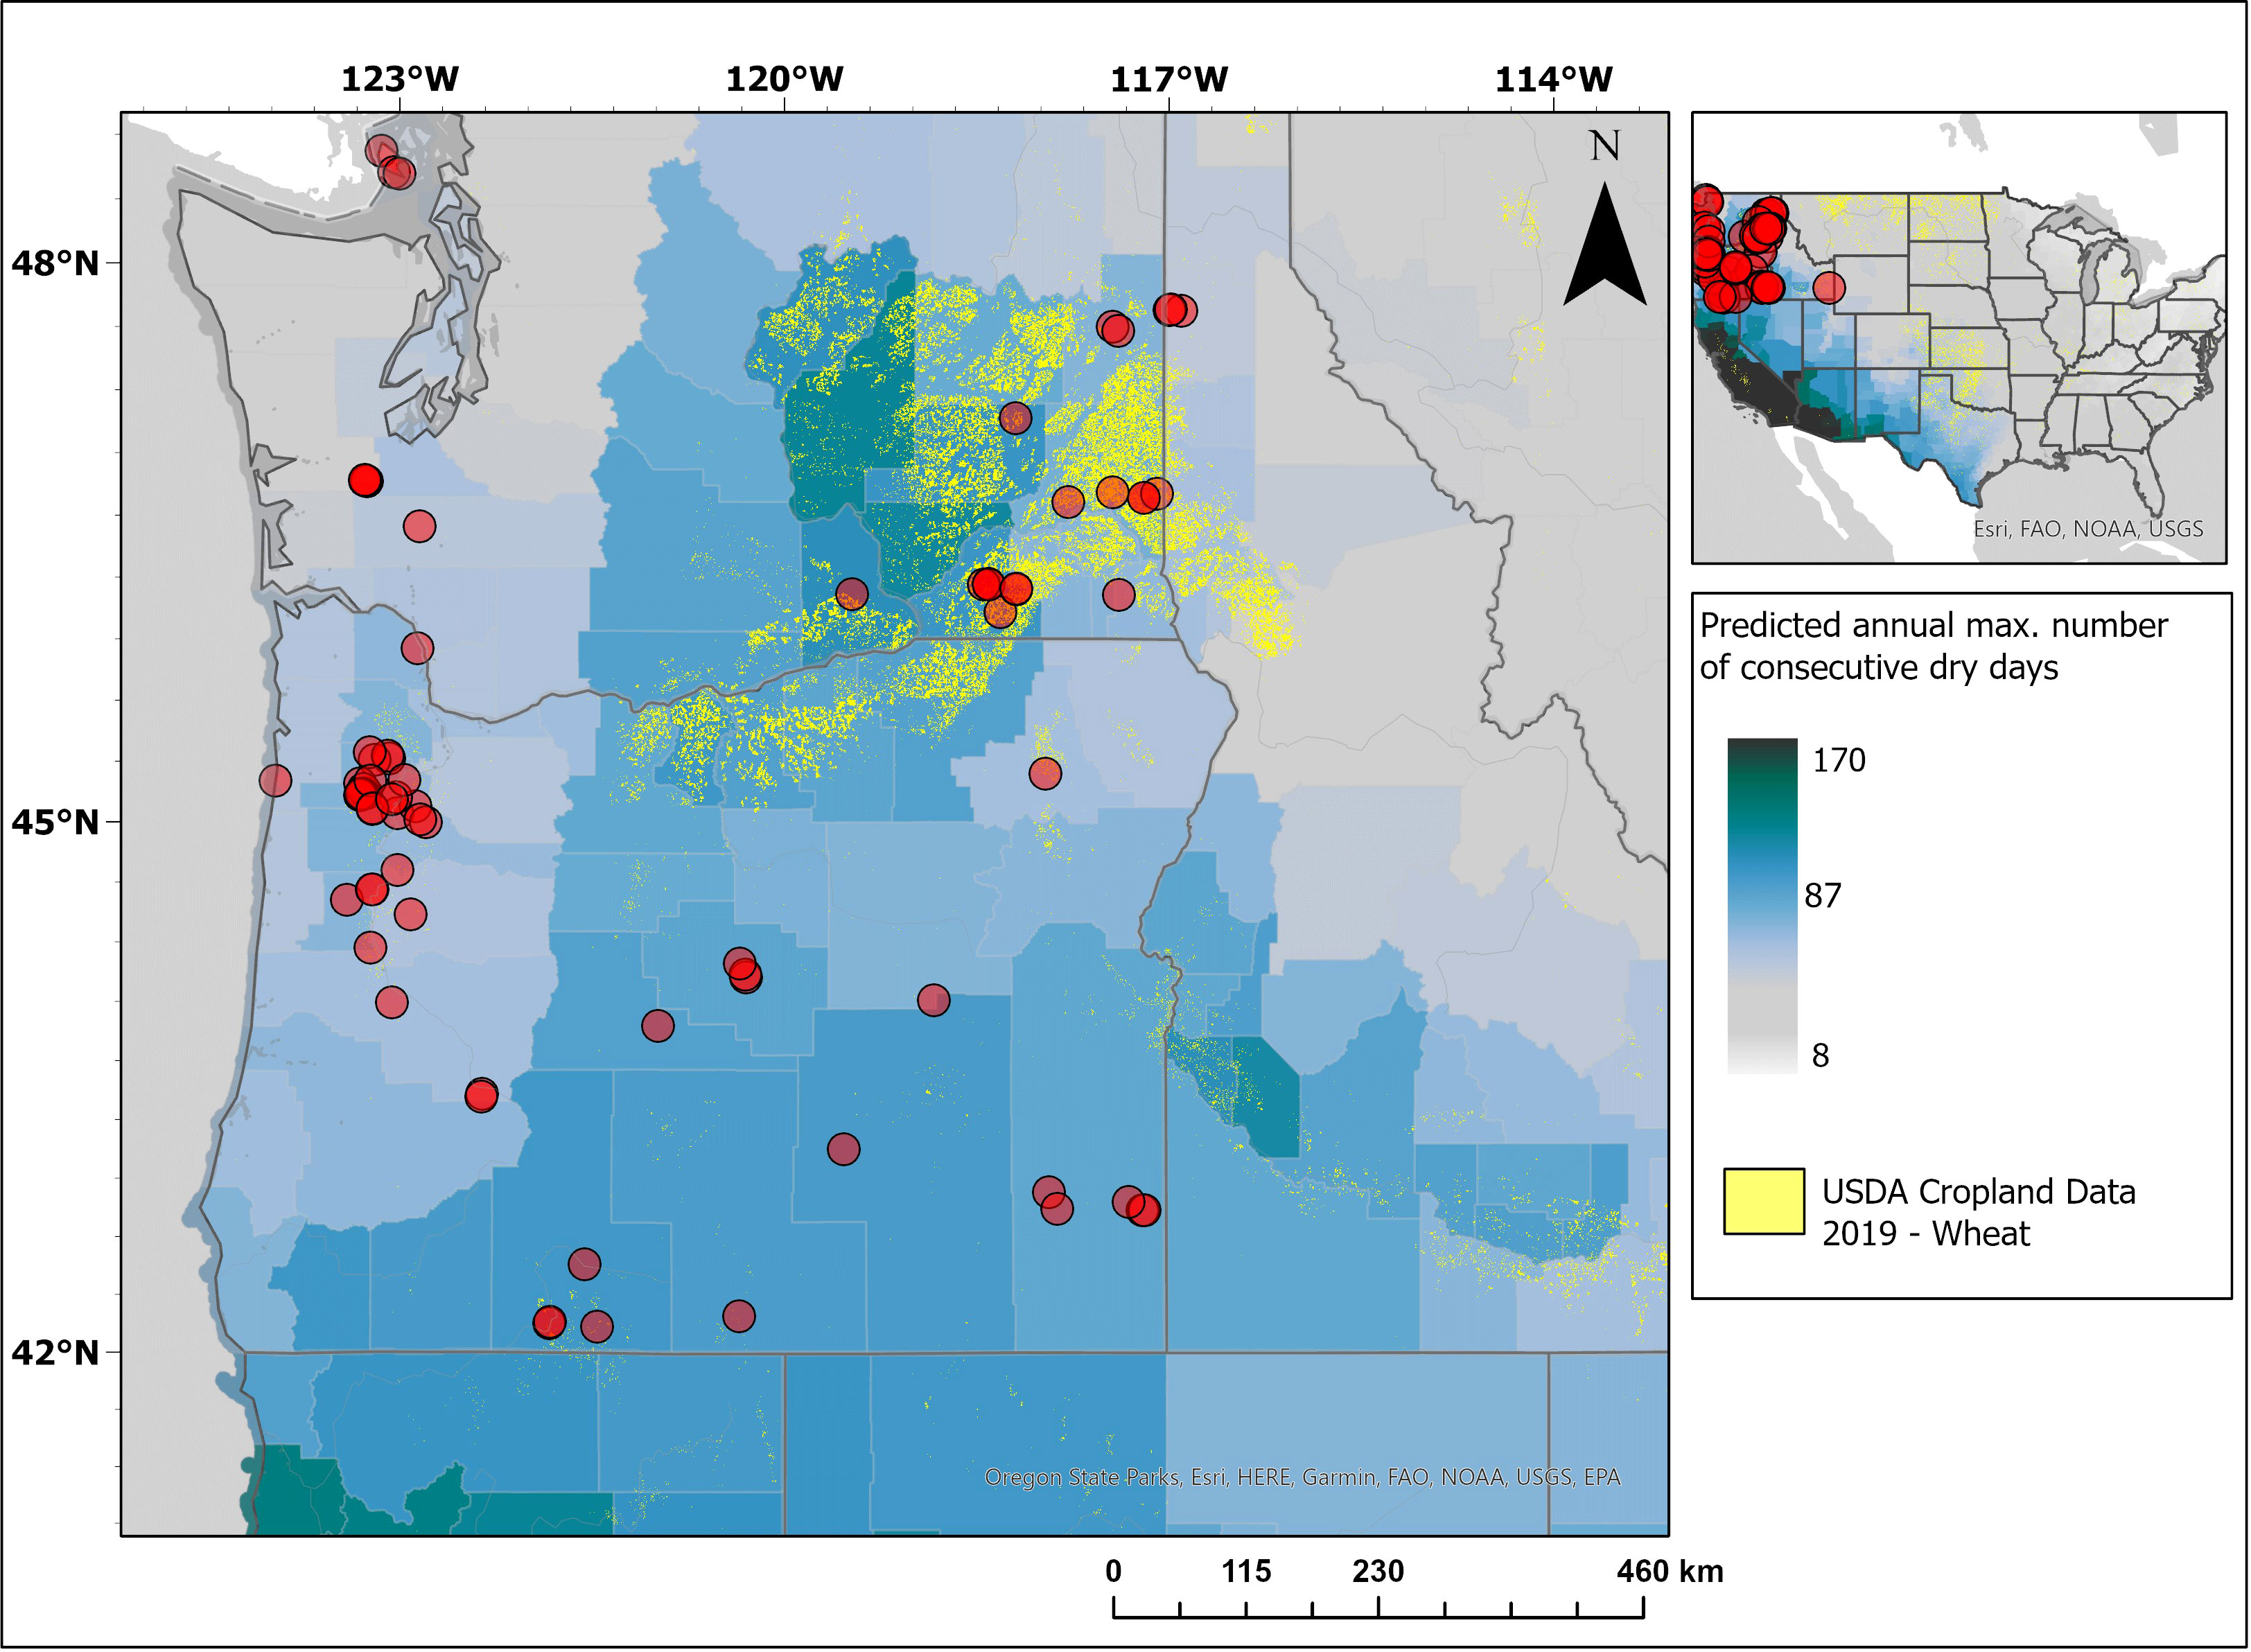
Figure 1 Sampling locations included in the study area. The 77 sites represented a broad range of conditions typically encountered in the US Pacific Northwest. The map shows the predicted annual maximum number of consecutive dry days (< 0.25 mm) in areas of current agricultural production by the year 2050 in a Business-As-Usual Scenario. ArcGIS Pro software was employed to create the map.
2.2 Soil sampling and laboratory analysis
Natural Resources Conservation Service records were queried for surface and mineral A horizons, using the National Cooperative Soil Survey (NCSS) Characterization Database maintained by the Kellogg Soil Survey. We specifically selected points that contained spectral information as well as field capacity (FC) and permanent wilting point (PWP) data (25). Each point had measurements of coarse fragment free (>2 mm) oven-dried BD (core and clod method; g cm–3), particle-size distribution (pipette method; sand, silt, and clay; % wt), SOC (total carbon determined by dry combustion minus CaCO3–C measured using the electronic manometer method, % wt), soil pH in 1:1 water suspension, and TN (dry combustion, wt %), gravimetric water content at PWP (−1,500 kPa) and FC (−33 kPa) measured with the pressure plate apparatus (% wt). The AWHC was calculated as the difference between the water retained at FC and PWP. All laboratory methods are described in (26).
2.3 Application of machine learning to mid-infrared spectra
Spectra in the MIR library were obtained from air-dried soil samples (35–37°C), passed through a 2-mm sieve, and ground to<180 µm. For mineral soils, ∼15 g of the<2-mm soil was ground using a Planetary Ball Mill with silicon nitride bowls and balls (Pulverisette 5, Fritsch). Full details about the spectroscopic methods can be found in Seybold et al. (27). Standard normal variate (SNV) was used to standardize the spectra, scaling to zero mean and unit standard deviation before averaging them (28). The spectra used were the average of the four sampling site replicates. Subsequently, the averaged spectra were baseline corrected in order to perform a Random Forest (RF) learning algorithm (method = ‘rf”) for both regression and feature selection. Machine learning analyses were implemented using the Caret and randomForest packages in the R software environment (29, 30). The variable selection analysis was conducted using the calibrated RF model in order to select only relevant and contributing features (wavelengths) (31). The calibrations were performed using default and optimized settings, including the number of variables to be considered at each split (mtry) and the number of trees (ntree). The final values used for the model were mtry = 4; ntree = 500. The root mean squared error (RMSE) and R-squared (R2) were used as criteria to select the optimal calibration model. The RF method also produces a measure of importance for each variable, quantifying the relative contribution to the prediction accuracy (32). The feature contribution is calculated by randomly permuting the variable’s values among the “out of bag” observations for each tree, optimizing the RMSE, and averaging the total number of trees.
2.4 Statistical analysis
Since some variables were not normally distributed, we carried out Spearman’s correlations between volumetric water content at FC and PWP with soil physical and chemical variables. A redundancy analysis (RDA) was conducted to determine the relationship among soil physico-chemical parameters, as well as categorical variables such as soil classification and functional horizon designations. The RDA is a linear model based on multiple linear regression. A forward selection on RDA was performed to test which environmental variables could significantly explain soil water retention. The forward selection procedure in RDA, based on Monte Carlo permutation with 499 iterations, was performed to determine the most significant discriminating variables affecting AWHC (P< 0.05).
3 Results
3.1 Influence of soil properties on water retention
The selected soil samples display a wide range of soil textural classes from sandy loam to sandy clay loam, as well as SOC content between 1.4 and 71.4 g kg−1 (Table 1). The SOC and TN exhibit high positive kurtosis, 3.3 and 4.2, respectively, with a high probability of observing extremes in the tails in our dataset. Clay content ranged from 2.2 to 44.9%, sand from 12 to 88.4%, and silt from 8.1– 61.6%. BD ranged between 0.9 and 1.8 g cm−3 and pH between 4.3 and 8.3. The soils in this study displayed a wide range of volumetric water content at −1,500 kPa (PWP), ranging from 32.4- 5.3%. While the water content held at −33 kPa (FC) ranged from 12.1–52.4%. The PWP data had high positive skewness showing more data on the right side than FC data. Accordingly, across the sites, the average AWHC in the surface soil horizons was 13.6% 5.7.
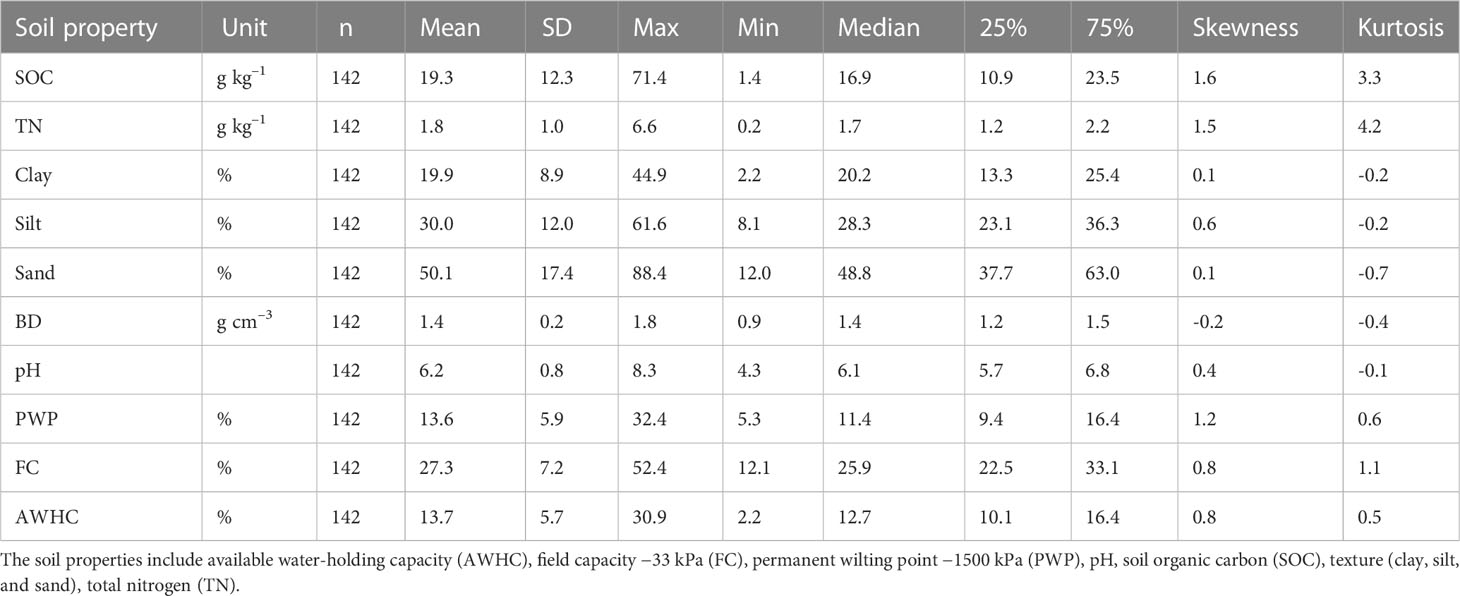
Table 1 Summary statistics of variables in the surface soil (A and transitional A–B horizons) (n=144).
A Spearman’s correlation matrix of soil characteristics is shown in Figure 2. Clay and BD were significantly and negatively correlated with AWHC (P< 0.05). Water retention at PWP and FC showed positive associations with SOC, but SOC values were not well suited to explain AWHC. Our analysis revealed that FC was strongly associated with BD, while PWP was highly responsive to clay. We also used RDA to summarize the linear relationship between soil properties and water hydraulic properties (Figure 3). In the RDA ordination biplot, axes 1 and 2 explained 2.8 and 8.8%, respectively. In general, for this dataset, the RDA analysis showed that increases in BD negatively affect available water at FC, leading to a decrease in AWHC (Figure 3). According to RDA analysis, measured soil properties explained a total of 37.7% of the variation in AWHC. Forward selection applied to RDA indicated that physical properties such as BD had the greatest influence on AWHC (Table 2), accounting for 28.2% for this sample set. Other soil properties like clay, SOC, and sand were less important drivers of AWHC and only explained a small amount of variation. Clay, SOC, and sand accounted for 2.9%, 3.0%, and 3.1% of the variation in AWHC, respectively (p< 0.05) (Table 2).
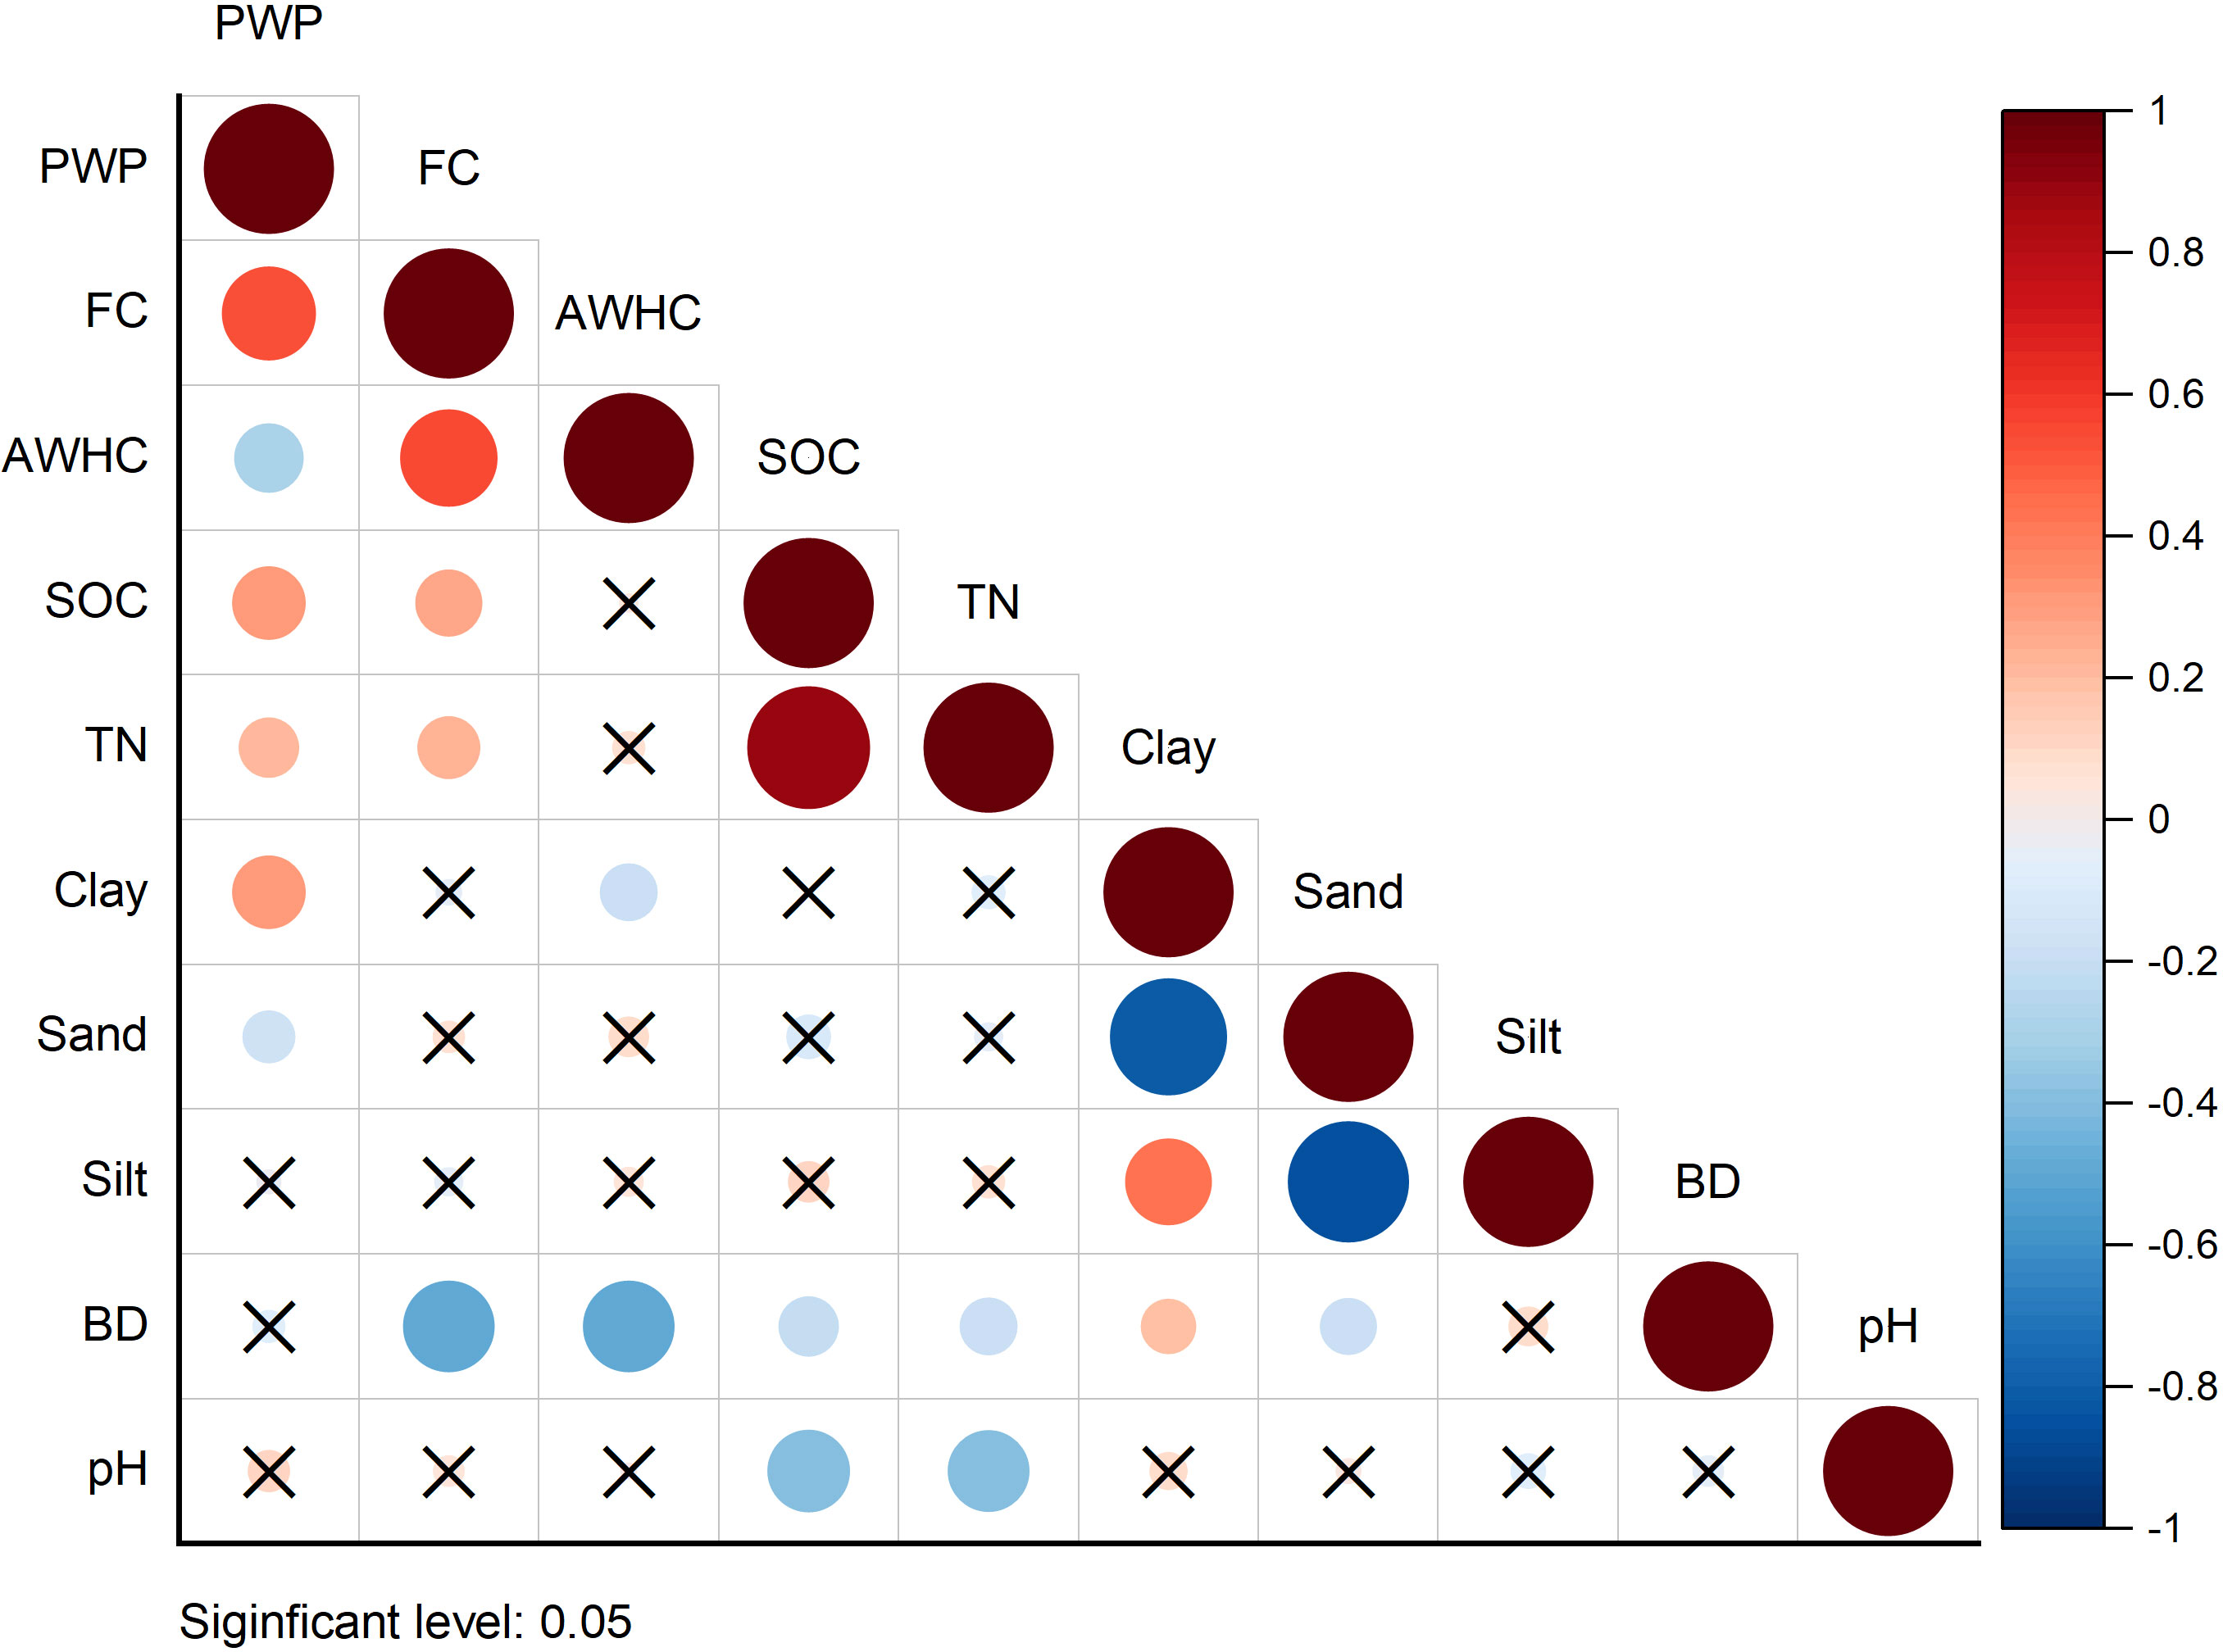
Figure 2 Spearman rank correlation matrix of soil hydraulic properties and soil chemical physical included in the A horizon and transitional A–B horizons. Available water-holding capacity (AWHC), bulk density (BD), field capacity −33 kPa (FC), permanent wilting point −1500 kPa (PWP), soil organic carbon (SOC), total nitrogen (TN). Only significant correlations are shown P<0.05).
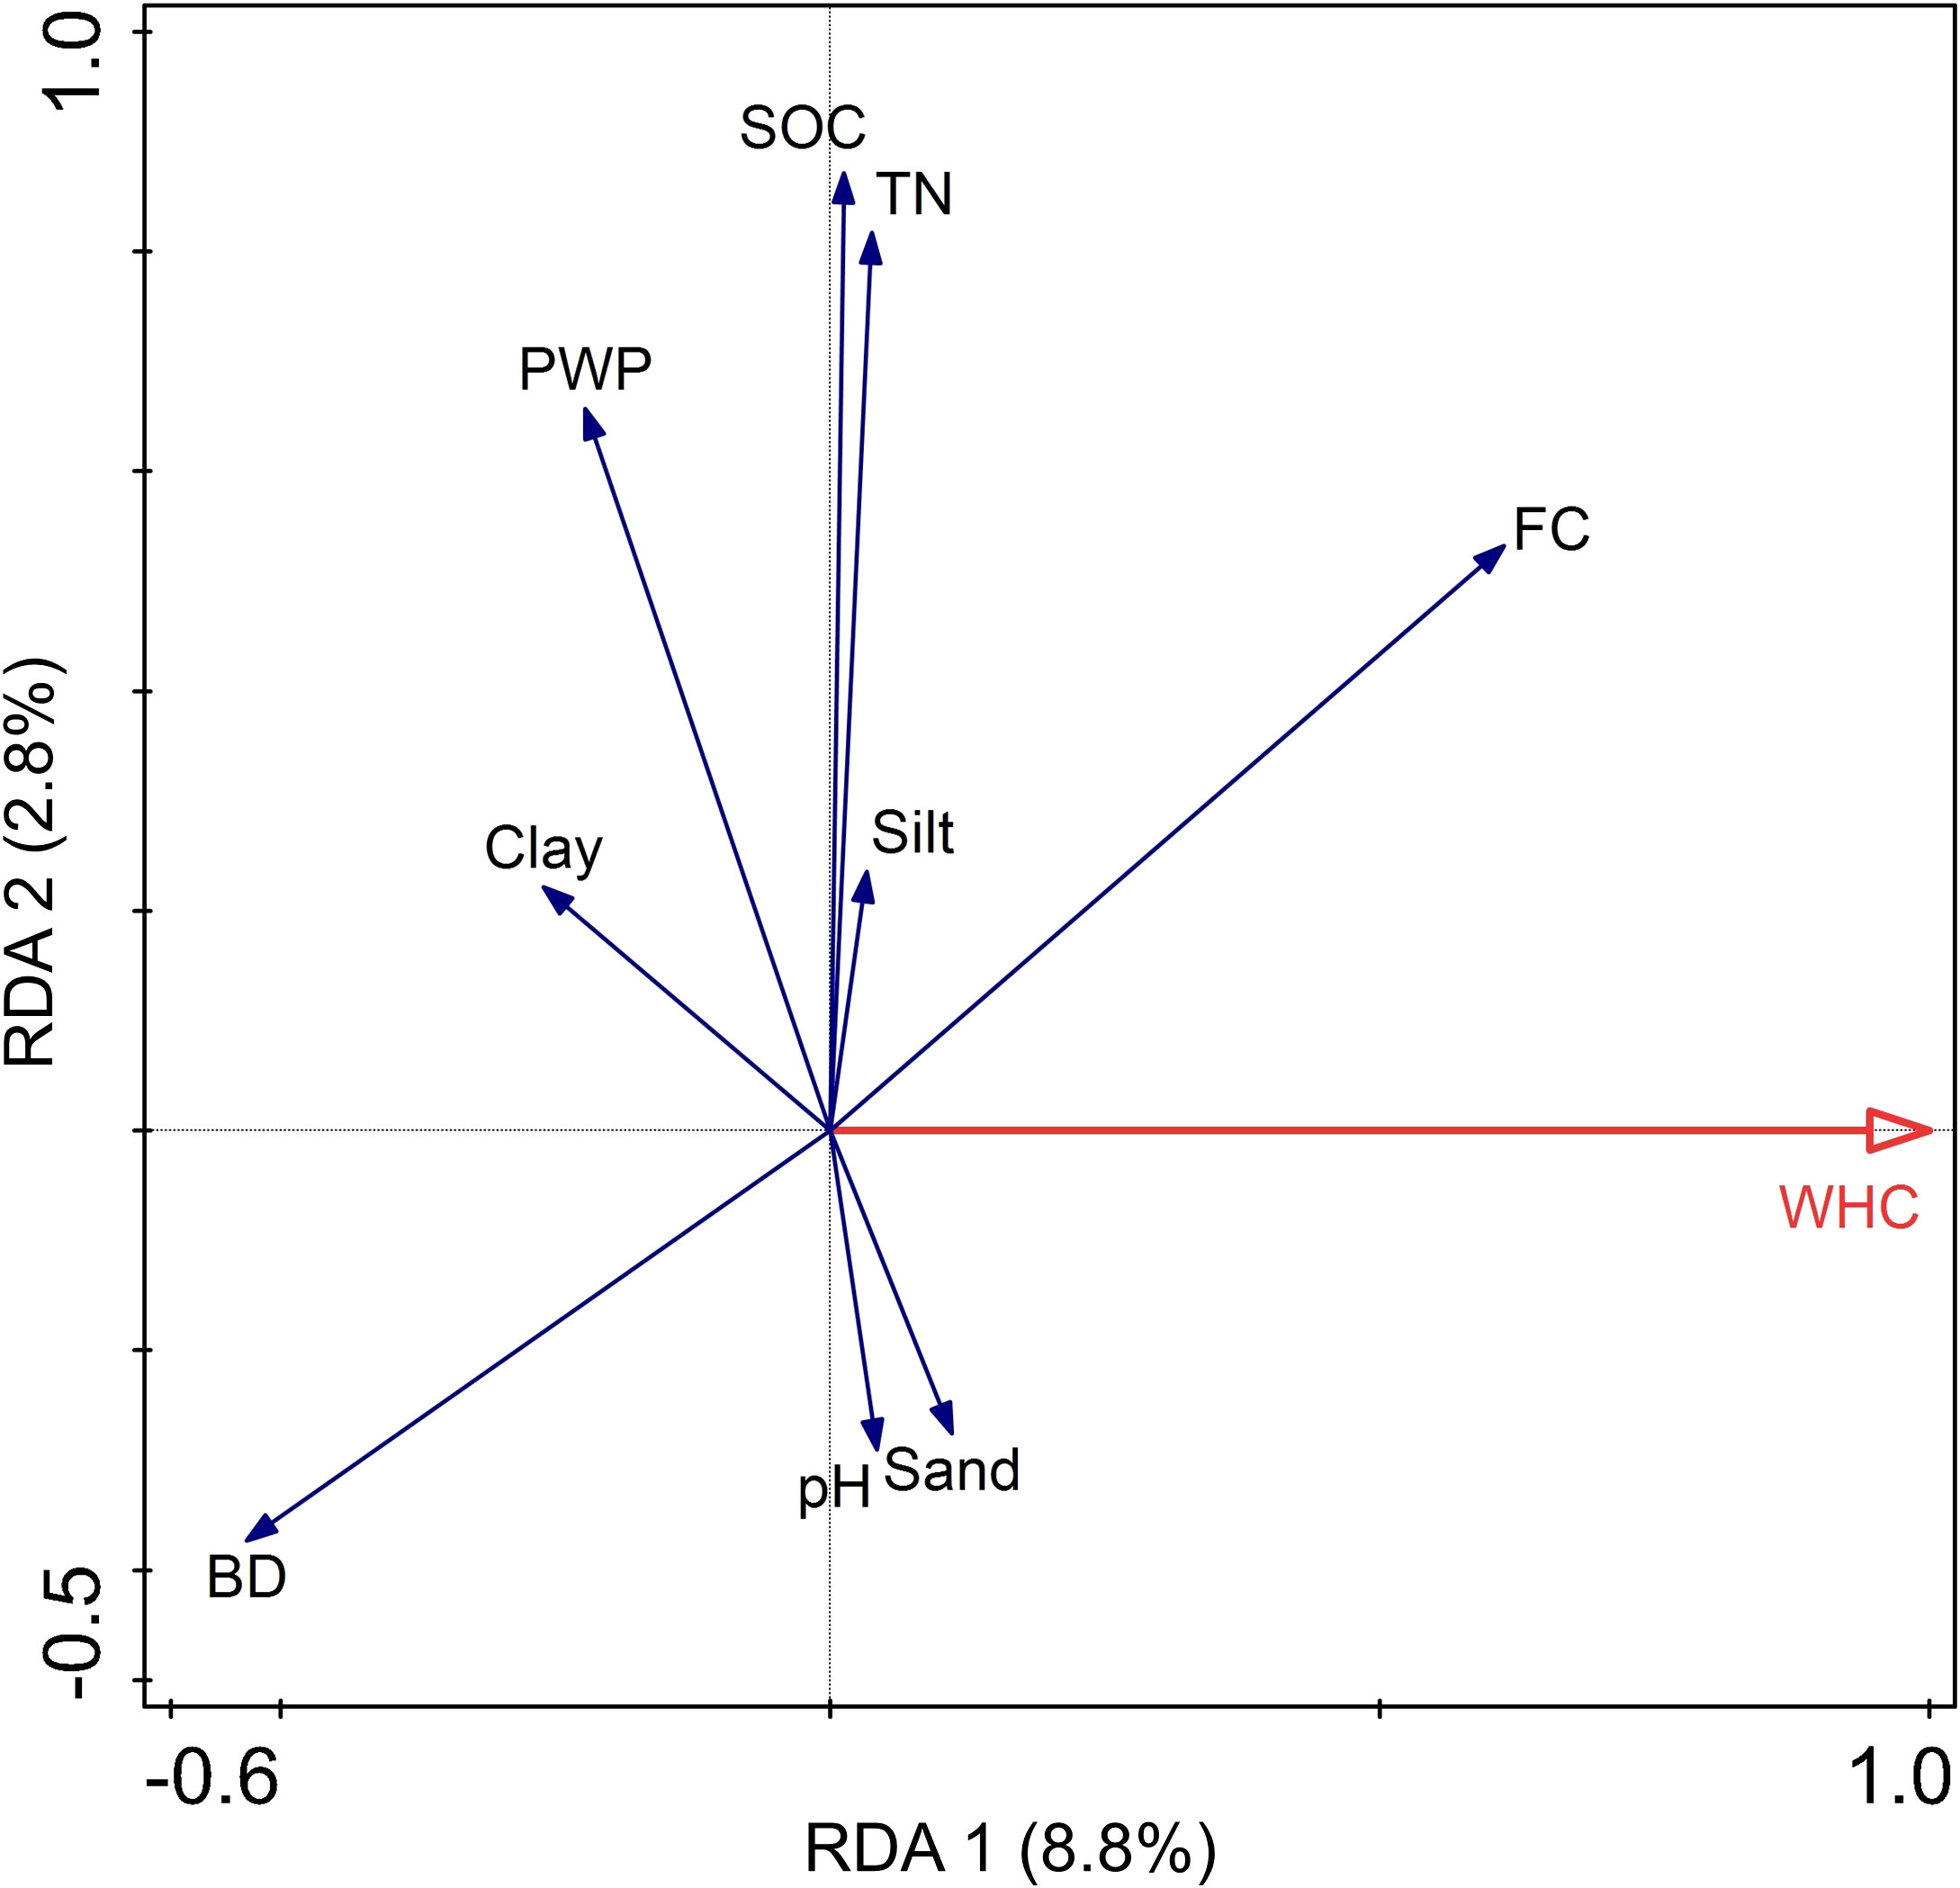
Figure 3 Redundancy analysis (RDA) ordination biplot showing the relationship of soil attributes with soil hydraulic properties in the horizon A. Available water-holding capacity (AWHC), field capacity −33 kPa (FC), permanent wilting point −1500 kPa (PWP), soil organic carbon (SOC), total nitrogen (TN). n=142.
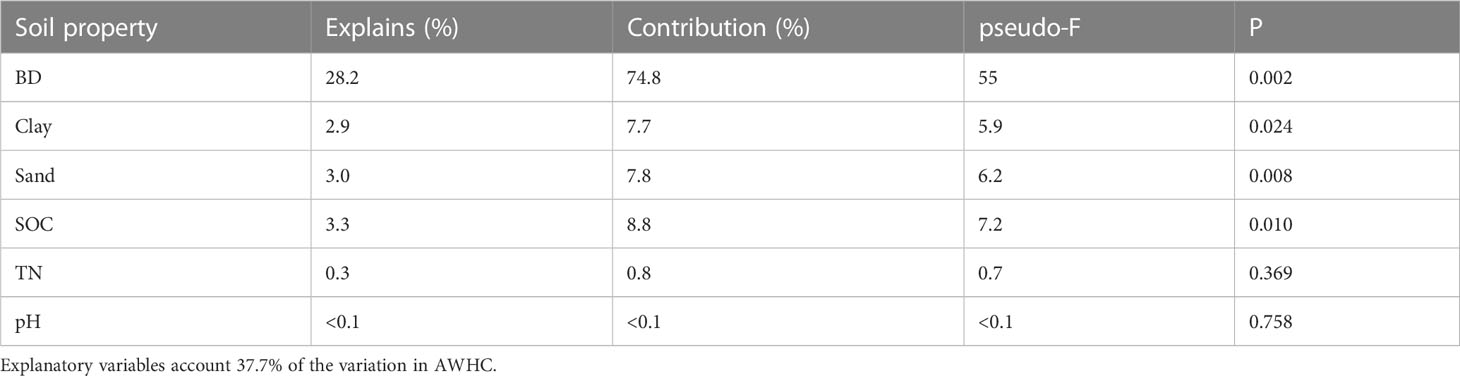
Table 2 Stepwise forward multiple linear regression analysis between available water-holding capacity (AWHC) and explanatory variables including bulk density (BD), soil organic carbon (SOC), texture (clay, silt, and sand), total nitrogen (TN).
3.2 Relationships between organic and mineral spectra MIR signatures
The MIR absorbance data were used to develop predictive models for PWP, FC, SOC, and clay using RF regression (Figure 4). The SOC and PWP performed best, with R2 values greater than 0.90, while the calibration built for clay and FC estimation achieved R2 values of 0.81–0.85, respectively (Supplementary Figure S1). The RF variable importance analysis was applied in order to identify the spectral features that had the greatest influence on PWP, FC, SOC and clay calibrations (Figure 5). The results showed that the most influential absorbances vary according to each soil property (SOC, clay, FC, and PWP). The OH-stretch (3750–3100 cm –1) and the Si-O-Si overtone (1870 cm −1) contributed the most to PWP. The most influential bands for FC were in the 1080–1038 cm −1 region, putatively attributed to organic functional groups such as -CO stretch and the C–O and C–N of carboxylic acids and amides. For SOC, the top-ranked bands included 2930–2870 cm −1, representing aliphatic CH stretching of methyl and methylene groups.
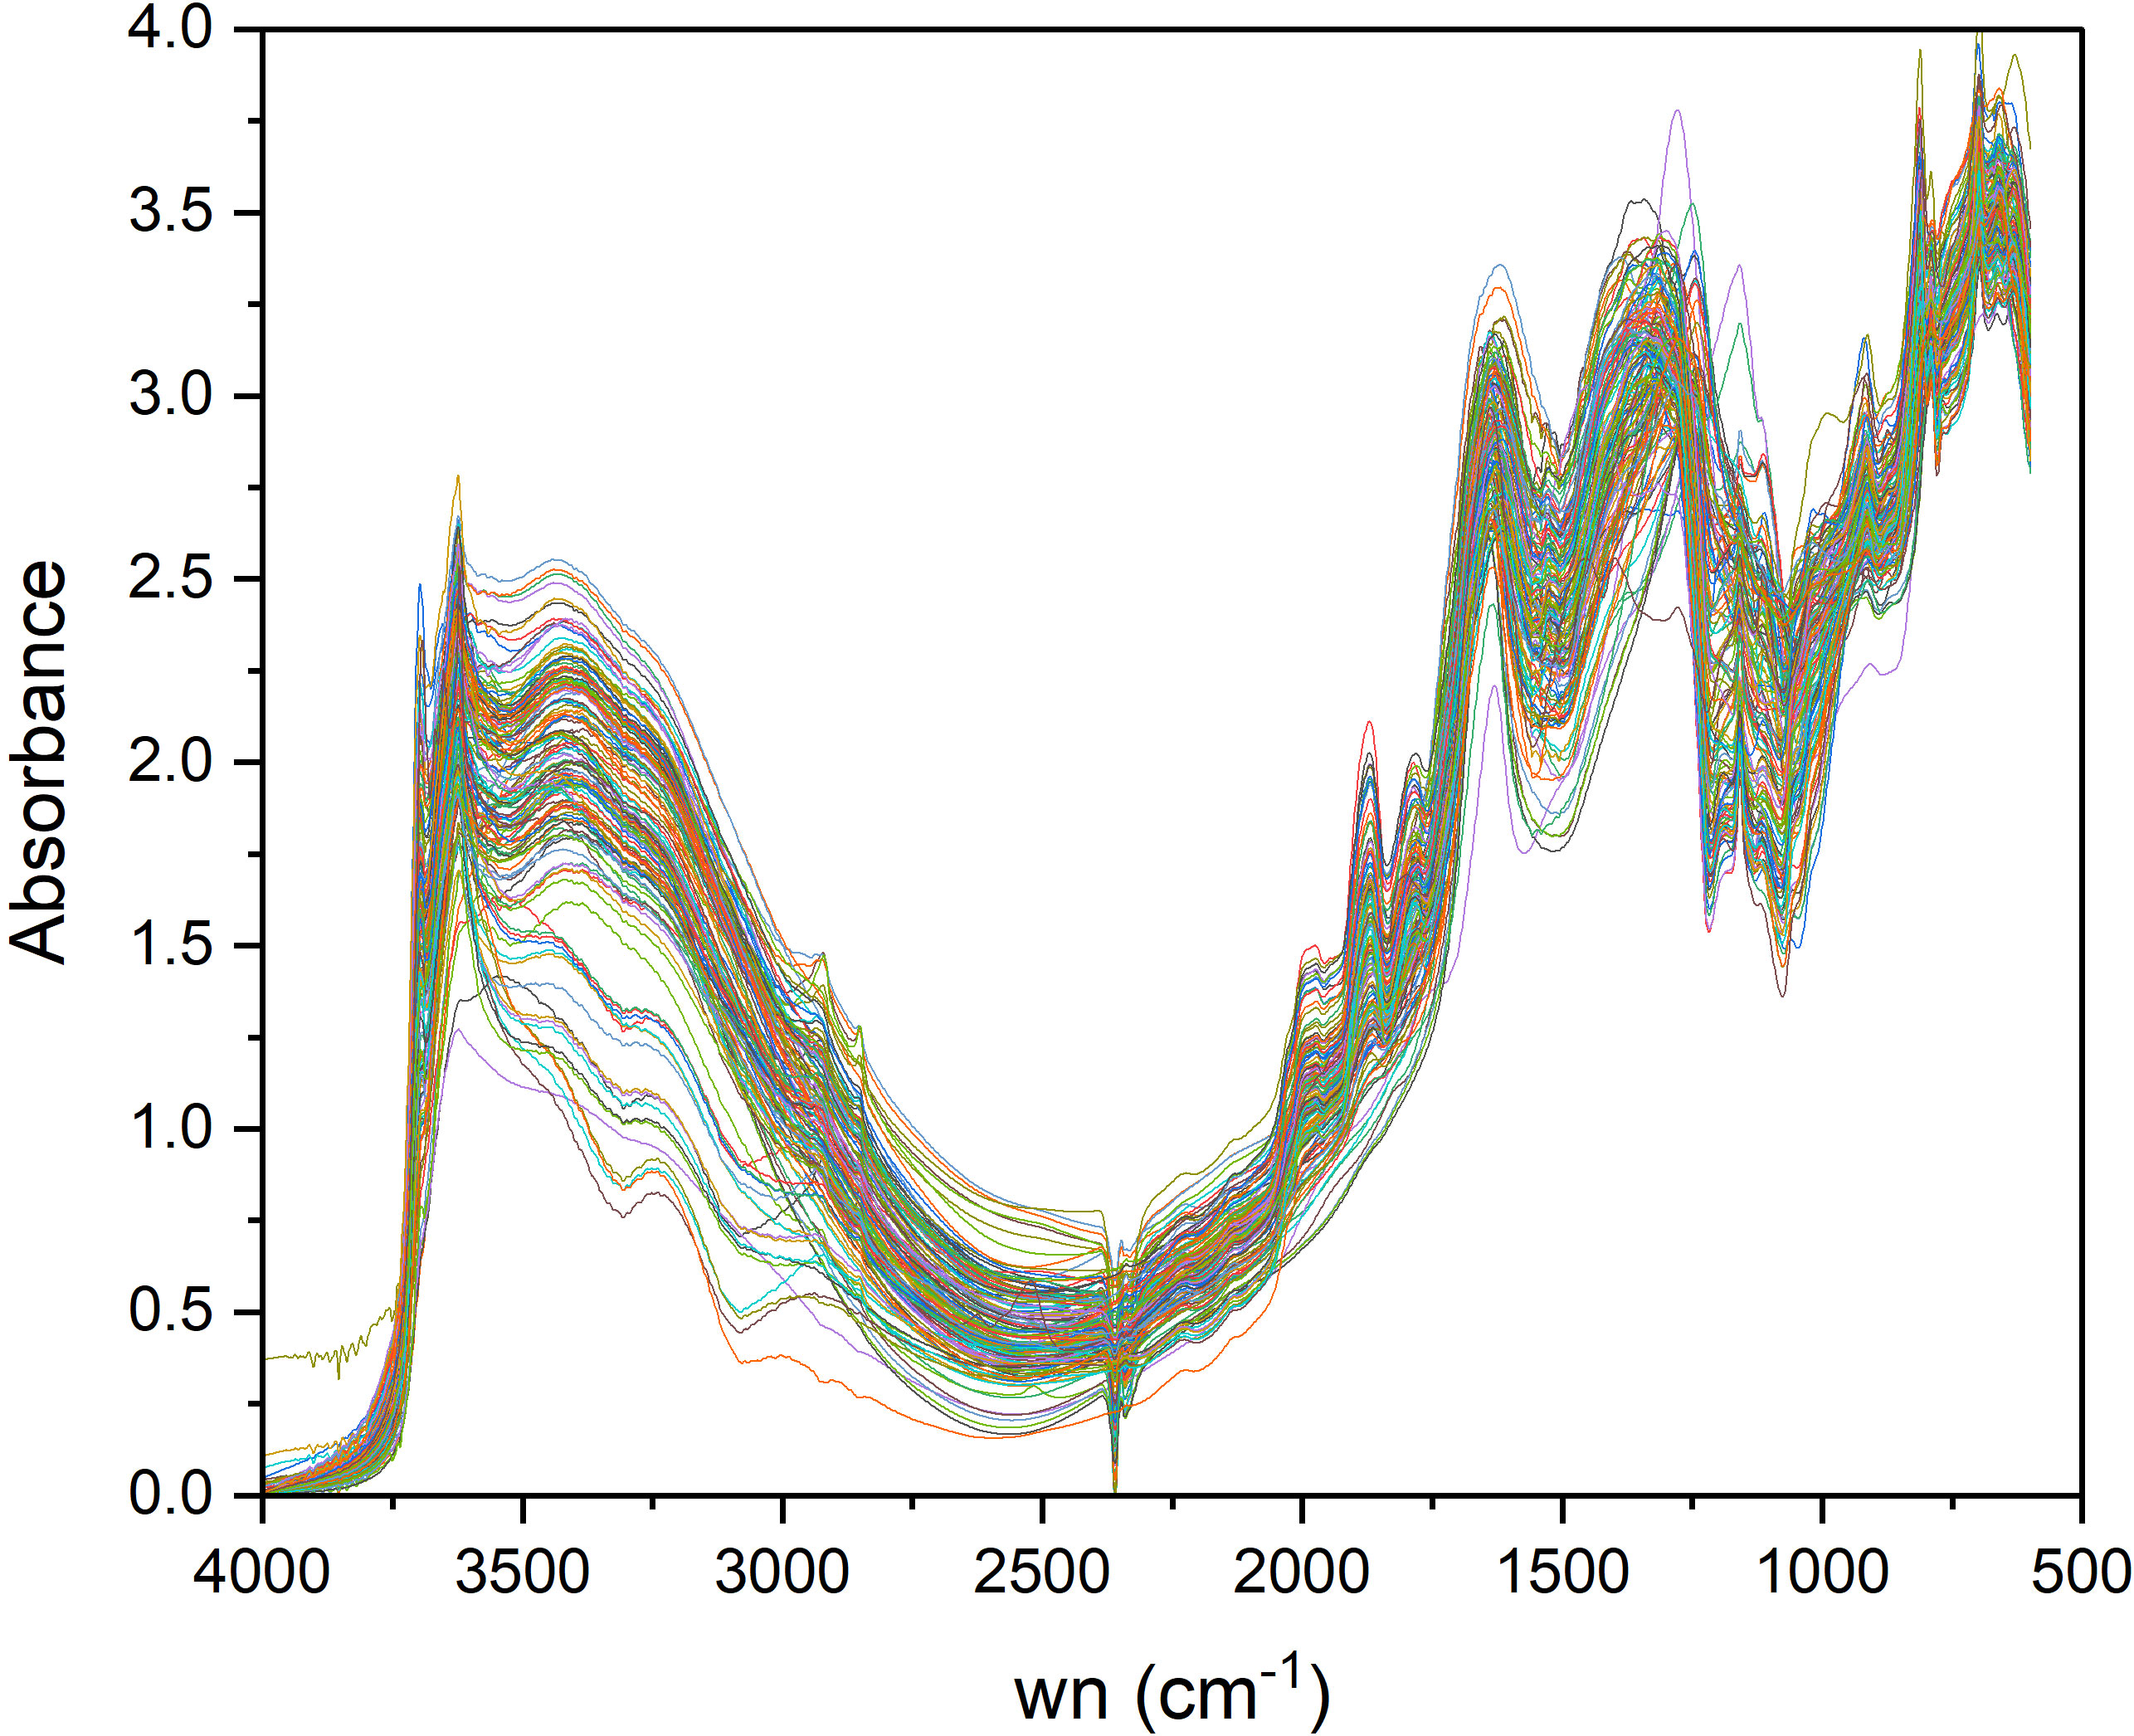
Figure 4 Mid-infrared diffuse reflectance spectra from 77 sites collected in the A horizon and transitional A–B horizons in the US Pacific Northwest (n=142). The spectra were transformed by standard normal variate (SNV) and linear baseline correction.
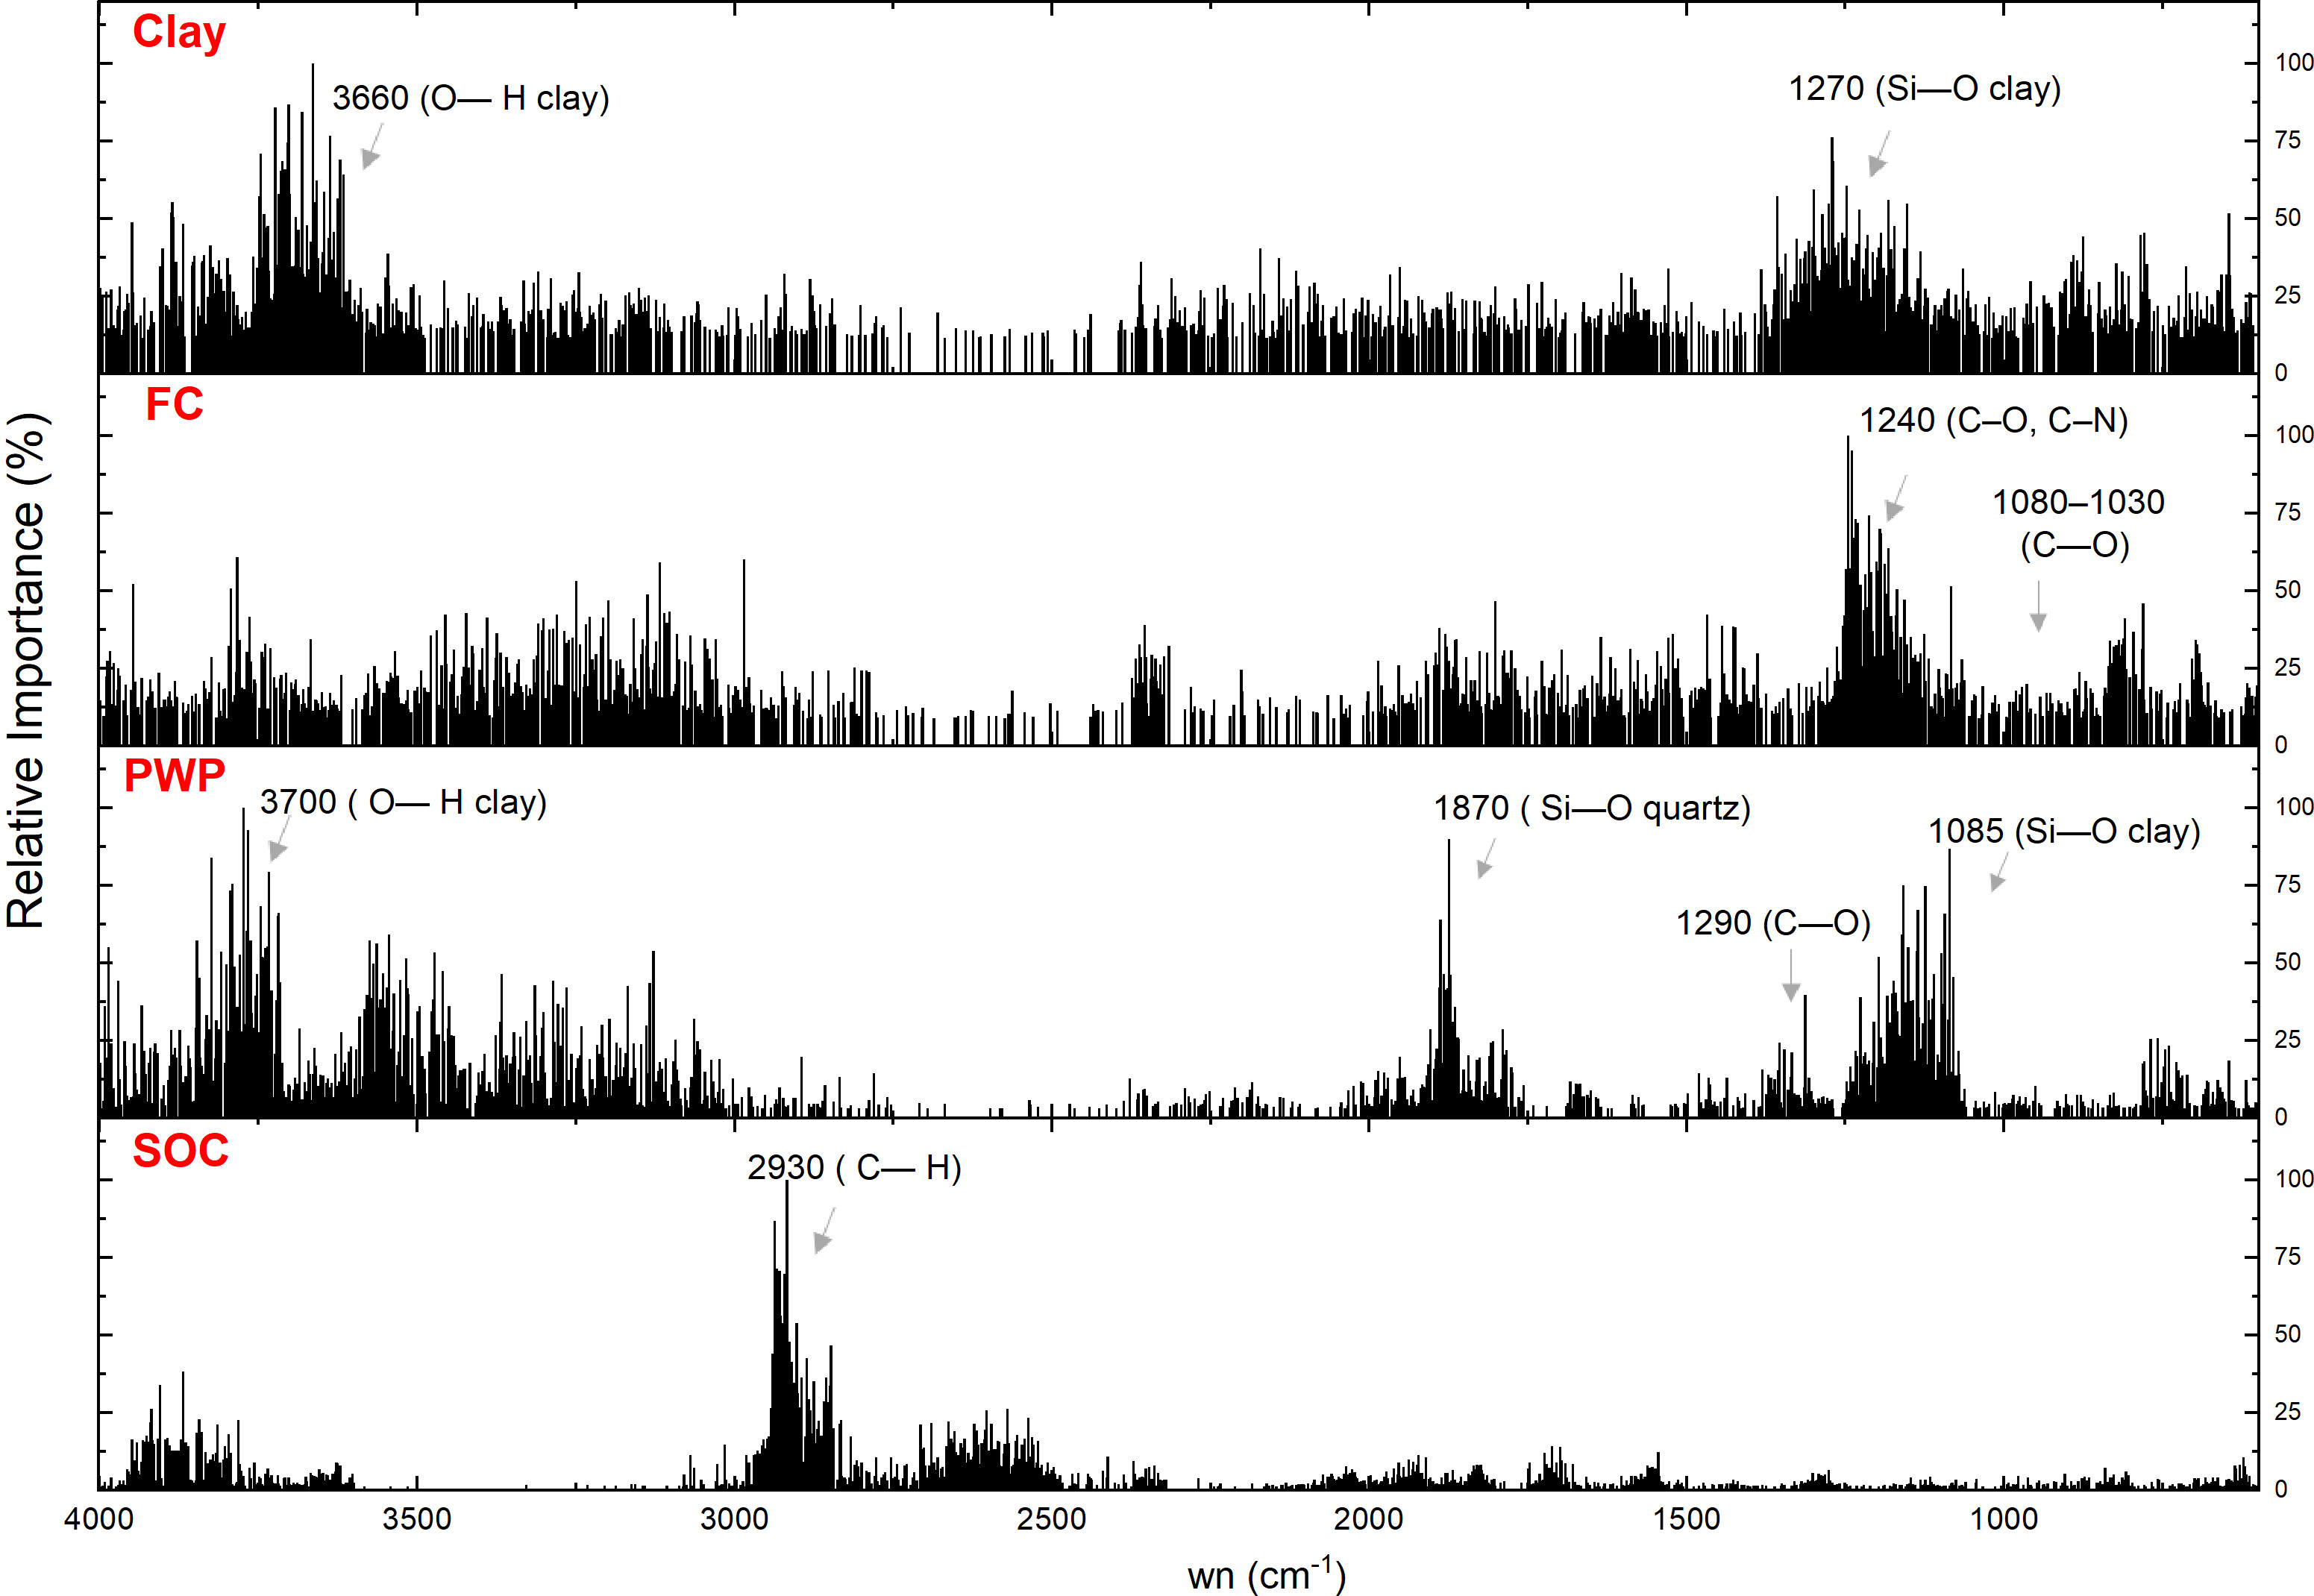
Figure 5 Variables importance analysis derived from a random forest (RF) regression model. The plot shows the most influential wavelengths (wn) in the MIR region for the prediction of A) soil organic carbon (SOC), permanent wilting point (PWP), field capacity (FC) and clay minerals.
The ratio of organic to mineral wavelengths was calculated based on the RF relative variable importance ranking for MIR signatures (Figure 5). The most significant contributors to the calibration model correspond to absorption wavelengths at around ~3600 cm −1, resulting from the first overtone stretch vibration of water molecules as well as from higher overtones or combination vibrations of organic compounds at ~1200 cm −1. Thus, we defined the ratio eq. (1), which we called as the quotient of the arithmetic mean of the organic region to the arithmetic mean of the mineral region starting at wavelength (cm −1) and ending at (cm −1).
The data followed an exponential decay trend for PWP but not for FC (Figure 6). The water retention at PWP decreased exponentially as the organic (1319–1278 cm −1) to mineral (3720–3695 cm −1) absorbance ratio decreased. Decreasing quotients of the ratio indicate a higher degree of water retention at PWP.
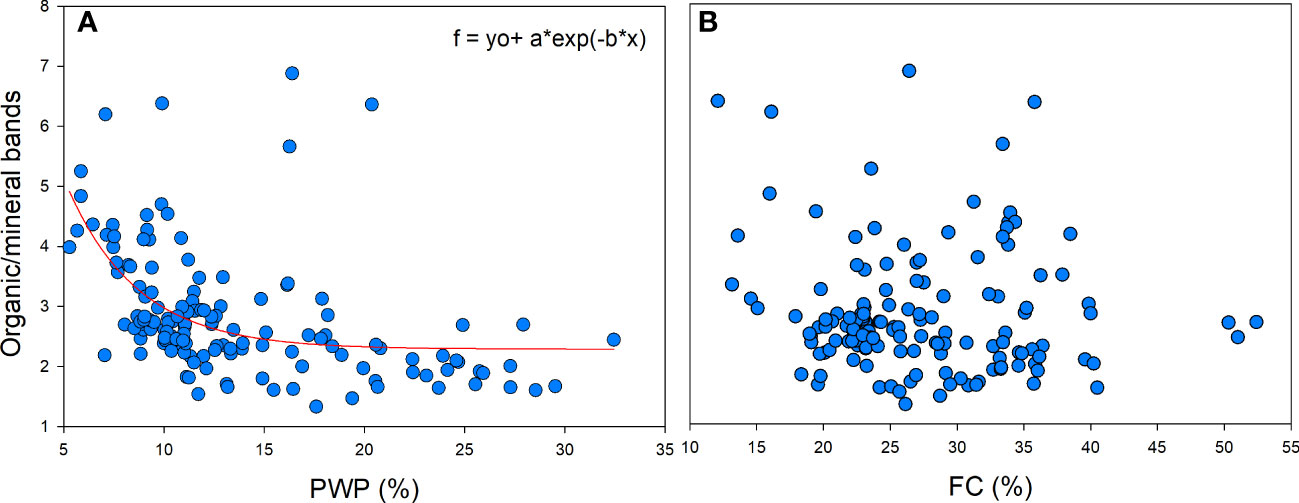
Figure 6 Soil water retention at (A) permanent wilting point −1500 kPa (PWP) and (B) field capacity −33 kPa (FC) as a function of organic and mineral ratio . The ratio . corresponds to the quotient of the arithmetic mean of the organic region (~1200 cm −1) to the arithmetic mean of the mineral region (~3600 cm −1).
4 Discussion
There is considerable interest in understanding how an increase in SOC might affect water retention, particularly if this occurs under increasing drought stress. Our results highlighted the factors controlling AWHC in the dryland production region of the PNW. In addition, the MIR absorbance features caused by minerals and organic compounds improved our understanding of the soil attributes related to AWHC.
Topsoil BD is essential in controlling water and air movement through soil and facilitating root growth and proliferation (33). In our study, we found that BD > soil texture > SOC were critical factors affecting AWHC (Table 2), which aligned with previous studies showing that reduced soil BD and compaction lead to an increase in FC, thus increasing AWHC (34). Although BD was found to be the most important factor associated with AWHC in PNW soils, a considerable portion of the variation could not be explained by the measured variables. Several factors might be contributing to this unexplained variation, including other soil structural properties (i.e., aggregation), local variations in soil type, and legacy effects of farm management (35). Therefore, we suggest that the impacts of BD on AWHC were not exclusively derived from SOC content in our study. Instead, we believe that the mechanisms underlying increased BD were based on inherent soil properties influencing soil structure and pore-space relationships (e.g., textural characteristics), as well as compaction caused by farming practices or other disturbances (e. g., tillage, wheel traffic, soil cover) (36, 37).
The effect of SOC on water retention was studied through correlation and further examined using spectroscopy (Figures 4, 5). Variable importance obtained through RF identified a set of MIR wavelengths that are associated with FC and PWP. The spectral responses related to water retention at PWP and FC showed clear differences. For water retention at PWP, our findings show a larger contribution of organic components associated with clay and silt fractions at 1290–1080 cm −1, which can overlap with other absorption bands, including aromatics and labile fulvic acids (38). In addition, the most prominent wavelength in terms of RF at 3700 cm −1, presumably ascribed to clays, was also found to be significant for PWP predictions (18, 39).
Furthermore, we observed that PWP declined exponentially with decreasing MIR spectral signatures associated with organic-to-mineral components (Figure 6). In addition, PWP declined exponentially with a decreasing organic-to-mineral spectral ratio (Figure 6), indicating that an increase in mineral soil’s adsorption capacity for SOM leads to higher retention at PWP. Conversely, with a higher ratio of organic to mineral due to lower clay content or clay particles reaching saturation, the water retained by clay decreases proportionally to water held in free SOM (not bounded with minerals), resulting in lower PWP. These findings were consistent with the fact that adsorptive forces that govern water content are closely related to fine particle fractions and SOM (40). In contrast, this is not observed in FC, where soil physical attributes such as BD, rather than mineralogy, exerted a direct and dominant impact. Indeed, our results show influential absorption at 1035 cm −1, which can be attributed to polysaccharides in soil aggregation for FC (41). We also found that MIR can inform our understanding of AWHC, and specific spectral bands may be used as proxies to track the potential of soils to retain water. This could be advantageous because directly measuring soil water content at PWP is a slow and laborious process (42).
We argue that the relationship between SOM and AWHC must be examined for specific soils and situations. Previous studies have demonstrated the consistently limited effect of SOC on AWHC on various spatial scales (3, 4). In this scenario, it is difficult to draw conclusions about organic amendment application for drought adaptation if we do not address the textural interactions and soil compaction in soils of the PNW. Indeed, our findings support previous studies that show a limited effect of SOM through biochar amendment on water content at FC in Oregon agricultural soils with varying textures (43). Understanding how these factors interact is especially important because the soil C accumulation rate decreases where soils are inherently nutrient-limited; therefore, any treatment that reduces compaction could be more cost-effective as a drought-adaptive strategy for this area. A challenge for future research will be to elucidate soil functions that minimize compaction.
5 Conclusion
This study analyzes patterns and drivers of AWHC at a regional scale in the PNW. We found that BD and texture explain the most significant amount of variation in AWHC, while SOC was less important. Altogether, these results suggest that compaction effects predominate over soil C effects in determining water storage. Therefore, an increase in AWHC cannot necessarily be achieved with an increase in C input if texture properties are not considered. A RF variable importance analysis for predicting water retention at PWP and FC showed apparent spectroscopic differences, with a predominant effect of mineral features near 3700 cm −1 for PWP. This analysis can help target factors with the greatest influence on AWHC variables. Our results underscore the crucial role of SOM and underline the importance of both BD and texture as critical contributors to water retention, such as compaction. The effect of soil compaction on BD needs substantial attention in order to inform farmers of the opportunities and options available to address future droughts.
Data availability statement
Publicly available datasets were analyzed in this study. This data can be found here: https://sdmdataaccess.nrcs.usda.gov/.
Author contributions
PR conducted writing and original draft preparation. PR, FC, SM developed the research concepts, data interpretation, review, and editing. PR and FC conducted data/evidence collection, data curation and statistical analyses. FC leadership and responsibility for the research activity. FC and SM supervision and funding acquisition. RP contributed to the research and initial draft of the paper. SS provided a critical review and editing. All authors contributed to the article and approved the submitted version.
Funding
This work was supported by the Carbon Center, Columbia Basin Agricultural Research Center (CBARC) # 207411120004003S.
Conflict of interest
The authors declare that the research was conducted in the absence of any commercial or financial relationships that could be construed as a potential conflict of interest.
The author SM declared that they were an editorial board member of Frontiers, at the time of submission. This had no impact on the peer review process and the final decision.
Publisher’s note
All claims expressed in this article are solely those of the authors and do not necessarily represent those of their affiliated organizations, or those of the publisher, the editors and the reviewers. Any product that may be evaluated in this article, or claim that may be made by its manufacturer, is not guaranteed or endorsed by the publisher.
Supplementary material
The Supplementary Material for this article can be found online at: https://www.frontiersin.org/articles/10.3389/fsoil.2023.1233886/full#supplementary-material
References
1. Maaz TM, Schillinger WF, MaChado S, Brooks E, Johnson-Maynard JL, Young LE, et al. Impact of climate change adaptation strategies on winter wheat and cropping system performance across precipitation gradients in the Inland Pacific Northwest, USA. Front Environ Sci (2017) 5:23/BIBTEX. doi: 10.3389/FENVS.2017.00023/BIBTEX
2. Ghimire R, Bista P, MaChado S. Long-term management effects and temperature sensitivity of soil organic carbon in grassland and agricultural soils. Sci Rep 2019 9:1 (2019) 9:1–10. doi: 10.1038/s41598-019-48237-7
3. Libohova Z, Seybold C, Wysocki D, Wills S, Schoeneberger P, Lindbo D, et al. Reevaluating the effects of soil organic matter and other properties on available water-holding capacity using the National Cooperative Soil Survey Characterization Database. J Soil Water Conserv (2018) 73:411–21. doi: 10.2489/jswc.73.4.411
4. Minasny B, McBratney AB. Limited effect of organic matter on soil available water capacity. Eur J Soil Sci (2018) 69:39–47. doi: 10.1111/EJSS.12475
5. Lal R. Soil organic matter content and crop yield. J Soil Water Conserv (2020) 75:27A–32A. doi: 10.2489/jswc.75.2.27A
6. Lyon SW, Fischer BMC, Morillas L, Conejo JR, Sánchez-Murillo R, Serrano AS, et al. On the potential of biochar soil amendments as a sustainable water management strategy. Sustainability (2022) 14:7026. doi: 10.3390/SU14127026
7. Geroy IJ, Gribb MM, Marshall HP, Chandler DG, Benner SG, Mcnamara JP. Aspect influences on soil water retention and storage. Hydrological Processes (2011) 25:3836–42. doi: 10.1002/HYP.8281
8. Hallam J, Hodson ME. Impact of different earthworm ecotypes on water stable aggregates and soil water holding capacity. Biol Fertility Soils (2020) 56:607–17. doi: 10.1007/s00374-020-01432-5
9. Zeraatpisheh M, Garosi Y, Reza Owliaie H, Ayoubi S, Taghizadeh-Mehrjardi R, Scholten T, et al. Improving the spatial prediction of soil organic carbon using environmental covariates selection: A comparison of a group of environmental covariates. Catena (2022) 208:105723. doi: 10.1016/J.CATENA.2021.105723
10. Al-Omran A, Ibrahim A, Alharbi A. Effects of biochar and compost on soil physical quality indices. Commun Soil Sci Plant Anal (2021) 52:2482–99. doi: 10.1080/00103624.2021.1949461
11. Rawls WJ, Pachepsky YA, Ritchie JC, Sobecki TM, Bloodworth H. Effect of soil organic carbon on soil water retention. Geoderma (2003) 116:61–76. doi: 10.1016/S0016-7061(03)00094-6
12. Lal R. Soil organic matter and water retention. Agron J (2020) 112:3265–77. doi: 10.1002/agj2.20282
13. Ahuja LR, Fiedler F, Dunn GH, Benjamin JG, Garrison A. Changes in soil water retention curves due to tillage and natural reconsolidation; changes in soil water retention curves due to tillage and natural reconsolidation. Soil Sci Soc America J (1998) 62:1228–33. doi: 10.2136/sssaj1998.03615995006200050011x
14. Basche AD, Kaspar TC, Archontoulis SV, Jaynes DB, Sauer TJ, Parkin TB, et al. Soil water improvements with the long-term use of a winter rye cover crop. Agric Water Manage (2016) 172:40–50. doi: 10.1016/j.agwat.2016.04.006
15. Wang S, Wang H, Hafeez MB, Zhang Q, Yu Q, Wang R. No-tillage and subsoiling increased maize yields and soil water storage under varied rainfall distribution: A 9-year site-specific study in a semi-arid environment. Field Crops Res (2020) 255:107867. doi: 10.1016/j.fcr.2020.107867
16. Asgari N, Ayoubi S, Demattê JAM, Dotto AC. Carbonates and organic matter in soils characterized by reflected energy from 350–25000 nm wavelength. J Mountain Sci (2020) 17:1636–51. doi: 10.1007/s11629-019-5789-9
17. Sanderman J, Savage K, Dangal SRS. Mid-infrared spectroscopy for prediction of soil health indicators in the United States. Soil Sci Soc America J (2020) 84:251–61. doi: 10.1002/saj2.20009
18. Janik LJ, Merry RH, Forrester ST, Lanyon DM, Rawson A. Rapid prediction of soil water retention using mid infrared spectroscopy. Soil Sci Soc America J (2007) 71:507–14. doi: 10.2136/SSSAJ2005.0391
19. Ng W, Minasny B, Jeon SH, McBratney A. Mid-infrared spectroscopy for accurate measurement of an extensive set of soil properties for assessing soil functions. Soil Secur (2022) 6:100043. doi: 10.1016/J.SOISEC.2022.100043
20. Minasny B, McBratney AB, Tranter G, Murphy BW. Using soil knowledge for the evaluation of mid-infrared diffuse reflectance spectroscopy for predicting soil physical and mechanical properties. Eur J Soil Sci (2008) 59:960–71. doi: 10.1111/J.1365-2389.2008.01058.X
21. Tranter G, Minasny B, Viscarra Rossel RA, Murphy B,H. Comparing spectral soil inference systems and mid-infrared spectroscopic predictions of soil moisture retention. Soil Phys (2008) 72:1394–400. doi: 10.2136/sssaj2007.0188
22. Hudson BD. Soil organic matter and available water capacity. J Soil Water Conserv (1994) 49:189–94. doi: 10.1201/9780429445552-36
23. Ankenbauer KJ, Loheide SP. The effects of soil organic matter on soil water retention and plant water use in a meadow of the Sierra Nevada, CA. Hydrological Processes (2017) 31:891–901. doi: 10.1002/HYP.11070
24. Jungkunst HF, Göpel J, Horvath T, Ott S, Brunn M. Global soil organic carbon–climate interactions: Why scales matter. Wiley Interdiscip Reviews: Climate Change (2022) 13:e780. doi: 10.1002/WCC.780
25. Ramcharan A, Hengl T, Beaudette D, Wills S. A soil bulk density pedotransfer function based on machine learning: A case study with the NCSS soil characterization database. Soil Sci Soc America J (2017) 81:1279–87. doi: 10.2136/SSSAJ2016.12.0421
26. Soil Survey Staff. Kellogg Soil Survey Laboratory Methods Manual. Soil Survey Investigations Report no. 42, version 5.0. Burt R, Soil Survey Staff Lincoln, eds. (Nebraska: U.S. Department of Agriculture, Natural Resources Conservation Service) (2014).
27. Seybold CA, Ferguson R, Wysocki D, Bailey S, Anderson J, Nester B, et al. Application of mid-infrared spectroscopy in soil survey. Soil Sci Soc America J (2019) 83(6):1746–59. doi: 10.2136/sssaj2019.06.0205
28. Barnes RJ, Dhanoa MS, Lister SJ. Standard normal variate transformation and de-trending of near-infrared diffuse reflectance spectra. Appl Spectrosc (1989) 43:772–7. doi: 10.1366/0003702894202201
29. Liaw A, Wiener M. Package “randomForest” Title Breiman and Cutler’s Random Forests for Classification and Regression. R Development Core Team (2018). Repository CRAN; 2018. Available from: https://www.stat.berkeley.edu/~breiman/RandomForests/.
30. Kuhn M, Wing J, Weston S, Williams A, Keefer C, Engelhardt A, et al. CRAN - Package caret. The R journal 223 (2020). Available at: https://cran.r-project.org/web/packages/caret/index.html.
31. Saidi S, Ayoubi S, Shirvani M, Azizi K, Zhao S. Digital mapping of soil phosphorous sorption parameters (PSPs) using environmental variables and machine learning algorithms. Int J Digital Earth (2023) 16:1752–69. doi: 10.1080/17538947.2023.2210314
32. Kuhn M. Building predictive models in R using the caret package. J Stat Software (2008) 28:1–26. doi: 10.18637/JSS.V028.I05
33. Whalley WR, Dumitru E, Dexter AR. Biological effects of soil compaction. Soil Tillage Res (1995) 35:53–68. doi: 10.1016/0167-1987(95)00473-6
34. Nawaz MF, Bourrié G, Trolard F. Soil compaction impact and modelling. A review. Agron Sustain Dev (2012) 33:291–309. doi: 10.1007/S13593-011-0071-8
35. Batey T. Soil compaction and soil management – a review. Soil Use Manage (2009) 25:335–45. doi: 10.1111/J.1475-2743.2009.00236.X
36. Carrow RN. Physical problems of fine-textured soils. In: Handbook of Integrated Pest Management for Turf and Ornamentals. (Washington, D.C: CRC Press) (1994). p. 84–90. doi: 10.1201/9780138752798-10
37. Keller T, Sandin M, Colombi T, Horn R, Research DO-S. Historical increase in agricultural machinery weights enhanced soil stress levels and adversely affected soil functioning. Soil Tillage Res (2019) 194:104293. doi: 10.1016/j.still.2019.104293
38. Davinic M, Fultz LM, Acosta-Martinez V, Calderón FJ, Cox SB, Dowd SE, et al. Pyrosequencing and mid-infrared spectroscopy reveal distinct aggregate stratification of soil bacterial communities and organic matter composition. Soil Biol Biochem (2012) 46:63–72. doi: 10.1016/J.SOILBIO.2011.11.012
39. Calderón FJ, Mikha MM, Vigil MF, Nielsen DC, Benjamin JG, Reeves JB. Diffuse-reflectance mid-infrared spectral properties of soils under alternative crop rotations in a semi-arid climate. Commun Soil Sci Plant Anal (2011) 42:2143–59. doi: 10.1080/00103624.2011.596243
40. Jensen DK, Tuller M, de Jonge LW, Arthur E, Moldrup P. A New Two-Stage Approach to predicting the soil water characteristic from saturation to oven-dryness. J Hydrology (2015) 521:498–507. doi: 10.1016/J.JHYDROL.2014.12.018
41. Lehmann J, Kinyangi J, Solomon D. Organic matter stabilization in soil microaggregates: Implications from spatial heterogeneity of organic carbon contents and carbon forms. Biogeochemistry (2007) 85:45–57. doi: 10.1007/S10533-007-9105-3/FIGURES/7
42. Yao N, Li Y, Xu F, Liu J, Chen S, Ma H, et al. Permanent wilting point plays an important role in simulating winter wheat growth under water deficit conditions. Agric Water Manage (2020) 229:105954. doi: 10.1016/j.agwat.2019.105954
Keywords: bulk density, mid-infrared spectroscopy, machine learning, organic matter, water holding capacity
Citation: Ramírez PB, Machado S, Singh S, Plunkett R and Calderón FJ (2023) Addressing the effects of soil organic carbon on water retention in US Pacific Northwest wheat–soil systems. Front. Soil Sci. 3:1233886. doi: 10.3389/fsoil.2023.1233886
Received: 02 June 2023; Accepted: 07 August 2023;
Published: 21 August 2023.
Edited by:
Leila Esmaeelnejad, Soil & Water Research Institute, IranReviewed by:
Shamsollah Ayoubi, Isfahan University of Technology, IranSunday Ewele Obalum, University of Nigeria, Nsukka, Nigeria
Copyright © 2023 Ramírez, Machado, Singh, Plunkett and Calderón. This is an open-access article distributed under the terms of the Creative Commons Attribution License (CC BY). The use, distribution or reproduction in other forums is permitted, provided the original author(s) and the copyright owner(s) are credited and that the original publication in this journal is cited, in accordance with accepted academic practice. No use, distribution or reproduction is permitted which does not comply with these terms.
*Correspondence: Paulina B. Ramírez, UGF1bGluYS5yYW1pcmV6Y2lzdGVybmFAb3JlZ29uc3RhdGUuZWR1