 Moh’d M. Omar1,2*
 Boniface H. J. Massawe1Mawazo J. Shitindi1
 Ole Pedersen3Joel L. Meliyo4
 Kadeghe G. Fue5
- 1Department of Soil and Geological Sciences, Sokoine University of Agriculture, Morogoro, Tanzania
- 2Tanzania Agricultural Research Institute (TARI), Mlingano Centre, Tanga, Tanzania
- 3Department of Biology, University of Copenhagen, Copenhagen, Denmark
- 4Tanzania Agricultural Research Institute (TARI), Hombolo Center, Dodoma, Tanzania
- 5Department of Agricultural Engineering, School of Engineering and Technology, Sokoine University of Agriculture, Morogoro, Tanzania
Salt-affected soils have serious implications for agricultural land quality and productivity, leading to a reduction in the net cultivable area available for food production. This issue has emerged as one of the foremost global challenges in recent years, impacting both food security and environmental sustainability. This research focuses on soil characterizations conducted in three irrigation schemes to understand the types, distribution, and nature of salt-affected soils. Auger observations served as the basic methodology for soil unit delineation in this study. Twelve representative soil pits with a depth of more than 160 cm were described, and undisturbed and disturbed samples were collected and analyzed for physical and chemical properties. The schemes were characterized by low levels of available phosphorus, organic carbon, and total nitrogen, as well as variations in exchangeable bases. Furthermore, 37.5% of the analyzed horizons highlighted the presence of salt-affected soils. Sodium was the predominant cation, followed by magnesium, potassium, and calcium. Likewise, HCO3− was the dominant anion, followed by Cl− and SO42−. The results of this study reveal the existence of two types of salt-affected soil. Uturo irrigation scheme had sodic soils, while the Ndungu irrigation scheme had saline-sodic soils. Additionally, both sodic and saline-sodic soils have been discovered in the Mawala irrigation scheme. The root cause of this challenge is inherent soil conditions, exacerbated by inadequate drainage infrastructure. Therefore, measures such as the application of gypsum followed by salt leaching, improving soil drainage by incorporating organic matter, improving drainage infrastructure, and using rice-tolerant varieties are recommended to mitigate salt stress and improve soil fertility. It is imperative to establish a robust framework for continuous monitoring and regular assessment of soil health to enable timely interventions and informed decisions for sustainable agricultural management.
1 Introduction
Soil is an inevitable resource for human survival and plays a crucial role in providing food and fodder (1, 2). Its importance lies not only in its ability to sustain plant growth but also in the numerous ecosystem services it provides, such as water filtration, nutrient cycling, and carbon sequestration (3–6). However, soils face numerous challenges affecting their key ecosystem functions (7), including salinization (8, 9), erosion (10, 11), and pollution (12, 13). Consequently, inadequate food and fodder production has become a pressing global problem (2, 6). Soil health is the foundation of productive and sustainable agriculture (5) and is defined as the continued ability of soil to function as a vital ecosystem that supports plants, animals, and humans (14). Soil health evaluation provides an understanding of the current and site-specific status of the soil and its fate for future use (15, 16) and guides management interventions (17, 18).
Understanding soil information is crucial for rational agricultural land use options, especially in problematic soils (19). Problematic soils directly affect crop sustainable production and productivity (1). Prior knowledge about the soil properties at a specific location enables informed decisions about appropriate management practices for optimal and sustainable crop production (5). In addition, such knowledge promotes sustainable soil management and resource use (20). Salt-affected soils include a group of soils characterized by a high concentration of soluble salts, including sodium (Na+), potassium (K+), chloride (Cl-), and sulphate (SO42-), and/or a high excess of sodium ions (Na+) among the exchangeable cations in the soil solution (21). It is important to note that some of these ions, such as potassium (K+) and sulphate (SO42-), also serve as essential plant nutrients. Among problematic soils, salt-affected soils pose a global challenge to agricultural lands (7) and exacerbate food insecurity issues (2). Soil salinization, as a form of soil degradation, negatively impacts crop yields by interfering with plant uptake of nutrients and water as well as destroying soil structure (22–24).
Salt-affected soils represent a major and widespread barrier to global food security and environmental sustainability, covering a total area of about 1 billion hectares (25). It has been estimated to account for about 20% of the total cultivated, and 33% of the irrigated agricultural lands worldwide (26). This deteriorating condition is expected to worsen under the influence of climate change (27). With the world population projected to reach 11.2 billion by 2100 (28), finding a way to produce sufficient food is essential. Rapid global population growth is putting unprecedented pressure on land to meet food needs (1, 2). Consequently, addressing the challenges facing food production, including soil salinization has become a major focus in recent decades (29, 30). In Tanzania, the alarming condition of salt-affected soils has been reported by several researchers (31–33). Kashenge-Killenga et al. (31) found that 7–15% of rice irrigation schemes were affected by salts, and about 2–10% of rice fields were abandoned.
The presence of excessive salt ions, particularly sodium (Na+) and chloride ions (Cl-) in the soil, can significantly affect the availability and uptake of water and essential nutrients by plants (34, 35). Not only that, high tissue concentration of Na+ and/or Cl- is also toxic to crops (36). In addition, excessive sodium (Na+) in soils can adversely affect soil structure, leading to reduced infiltration, inadequate aeration (i.e., increased swelling and dispersal of clay particles), and the development of flooded areas under anoxic conditions (37–39). Moreover, lack of oxygen in waterlogged soils can severely impact root respiration and beneficial soil microorganisms, affecting plant health and nutrient cycling (40). This leads to overall deterioration of soil health and adverse effects on plant growth and agricultural productivity (41–44).
Salt-affected soils can develop naturally through diverse mechanisms including weathering of salty parent materials, upwelling of groundwater from salt rocks, deposition of windblown salt particles, and flooding inundation (45, 46). In addition to natural factors, certain agricultural practices, including the use of salt water for irrigation, increasing groundwater levels due to waterlogging caused by over-irrigation, a lack of drainage channels, and excessive use of agrochemicals, especially in lowland and irrigated areas, are the main causes of secondary soil salinization (8, 33, 47). Under such circumstances, the dissolved salts may be mobilized into the soil layers, which could lead to soil surface salt accumulation (47).
Given the scarcity of agriculturally productive land and the demand for food to feed the growing world population (48), it is important to address issues leading to more land degradation such as soil salinization, especially in productive areas such as those having irrigation infrastructures (49–51). Characterization of salt types in salt-affected areas provides valuable insights into the most appropriate and cost-effective restoration strategies (49). Implementing targeted and informed approaches to the reclamation and rehabilitation of these areas can play a significant role in promoting sustainable agriculture, improving food security, and preserving our valuable land resources for future generations (8).
The aim of this study was to understand the types of salts present in the studied irrigation schemes that affect soil quality. We hypothesized that the presence of distinct salt types is influenced by irrigation practices and soil properties. This hypothesis served as a premise for our research, as understanding the predominant salt types enables the development of reliable action plans for sustainable land management of the soil, as well as the development of data-driven policies and land resource management strategies.
2 Materials and methods
2.1 Study description
The study focused on three representative irrigation schemes including Mawala (2000 ha), Ndung (600 ha) and Uturo (1500 ha) located within diverse agro-ecological zones (Figure 1). Mawala irrigation scheme is situated within (E1) code on the agroecological zone map of Tanzania (52), corresponding to Eastern Plateaux and Mountain Blocks. The landscape is characterized by plain to flat surfaces. The dominant soils are moderately to well drained, moderately deep to deep, dark brown to yellowish sandy clay loam, and sandy clay with weak to moderate structure. While Ndugu irrigation scheme falls within E2, located at the foot slope of the South Pare Mountains under Eastern Plateaux and Mountain Blocks (52). The area is characterized by alluvial/colluvial plain. The dominant soils are well drained, deep, black to brown, sandy clay, and sandy clay loam with moderate to strong structure. Additionally, the Uturo irrigation scheme is under (Rukwa – Ruaha Rift Zone – Alluvial Flats) abbreviated R2, in agroecological zone map of Tanzania (52). The landscape of the scheme is floodplains with a very gentle slope. The soils of the scheme are poorly to moderately drained due to their high clay content; they are very deep, grey to brown, mottled in some of the underlying horizons, and have a weak to moderate structure.
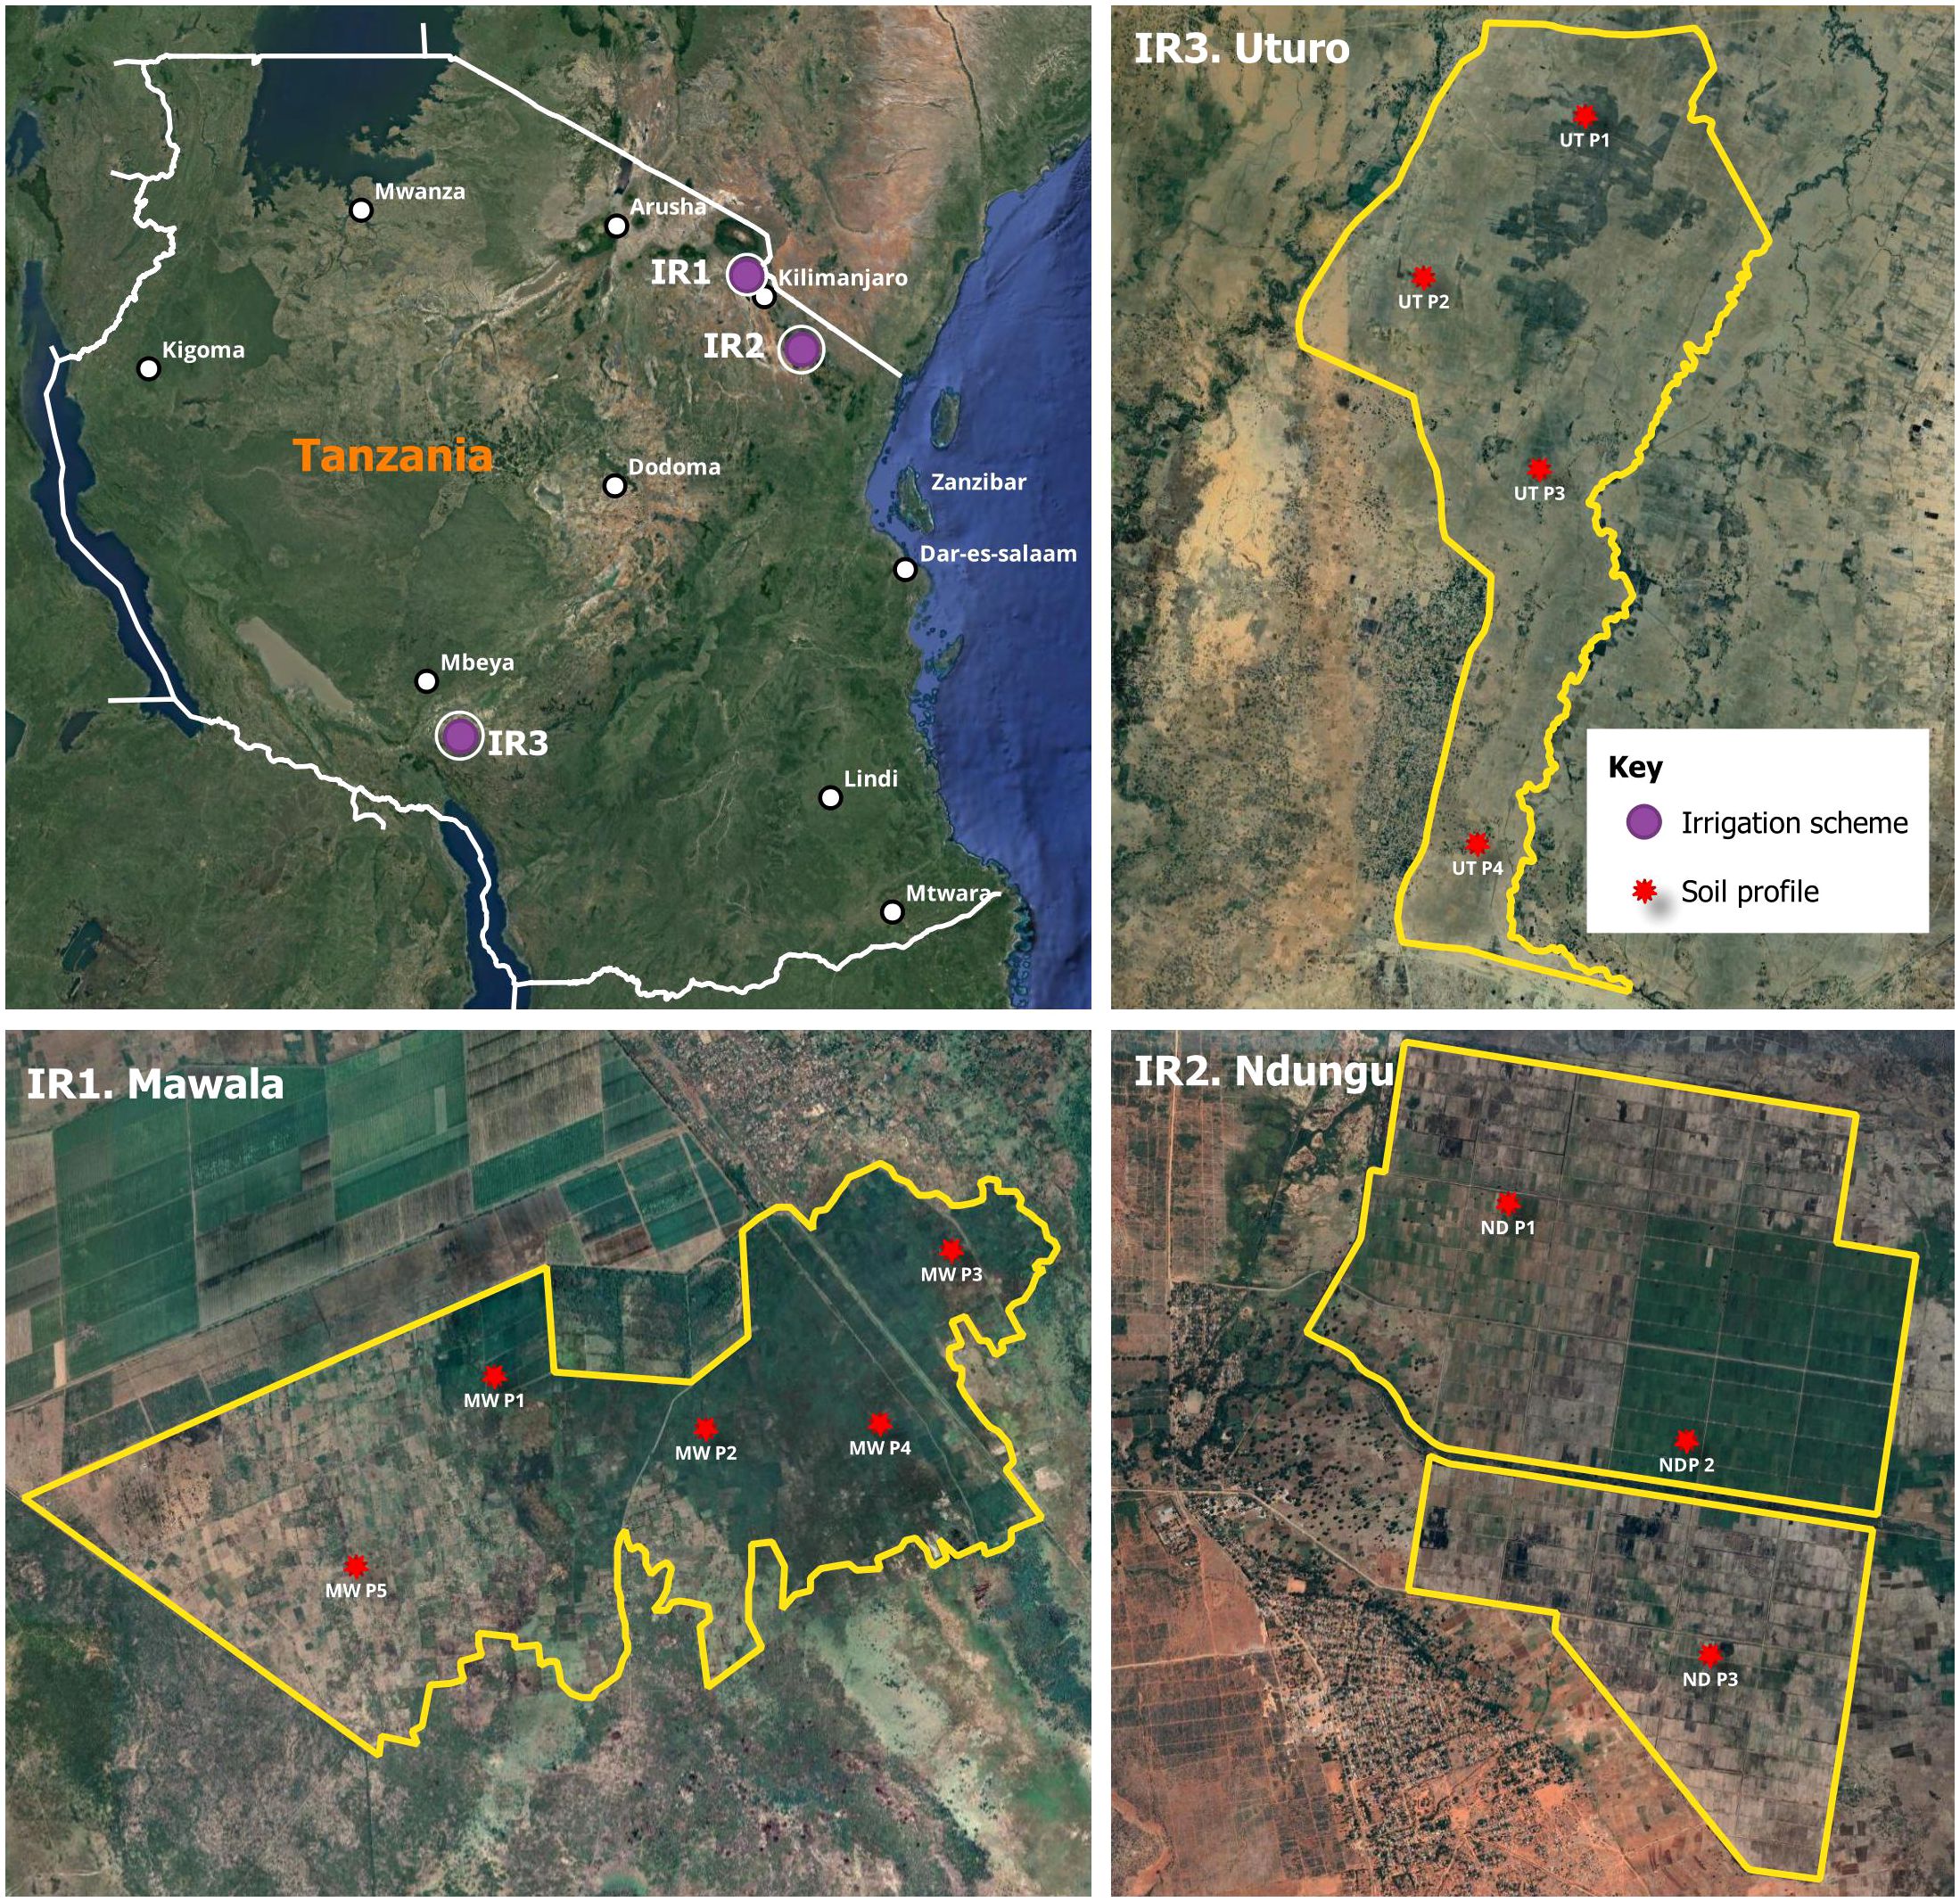
Figure 1 A map of Tanzania showing the location of surveyed irrigation schemes and the distribution of soil profiles in the respective irrigation schemes: IR1 = Mawala irrigation scheme; IR2 = Ndungu irrigation scheme; IR3 = Uturo irrigation scheme; purple dot location of irrigation scheme; red dot distribution of the soil profiles. This map was prepared using QGIS.
The geographical locations and climatic characteristics of the studied irrigation schemes are presented as (Supplementary Table S1). In this study, Irrigation (IR1), Irrigation (IR2), and Irrigation (IR3) represent Mawala, Ndungu, and Uturo irrigation schemes respectively. These irrigation schemes were selected to capture the broad array of environmental and agricultural conditions present in different regions.
2.2 Soil morphological characterization: description and sampling
A stratified sampling approach was used to establish preliminary mapping units, taking into account the geology, land use, and topography of the study areas to ensure representativeness. A total of 40 auger observation holes were drilled to a depth of 100 cm, and soil properties were described following the Food and Agriculture Organization’s (FAO) Guidelines for Soil Description (2006). Auger observations served as the basis for confirming soil boundaries and selecting representative pedon sites for each irrigation scheme. In each mapping unit, a profile pit was opened to a depth of 2 meters, resulting in a total of 12 profiles in three irrigation schemes. The distribution of soil profiles within the study area was not based on the land size of each irrigation scheme but rather on the variation of the soil. This approach was chosen to capture the necessary information in the different areas of the study. Consequently, the soil profiles were not evenly distributed across the irrigation schemes in terms of their spatial arrangement. A composite soil samples were collected from each individual horizon for laboratory analysis to determine soil physical and chemical properties for soil classification, determining salinity status, and recommending appropriate management options. The natural breaks in soil horizon depths were harmonized into equal depth increments (i.e., 0-20 cm, 20-40 cm, 40-60 cm, etc.) depending on the depth of the profiles to provide a clear graphical representation of soil properties.
2.3 Laboratory methods
The collected composite samples were air-dried for two weeks and grinding was done to obtain a fine fraction after sieving through a 2 mm sieve. Undisturbed core samples were oven dry at 105°C for 24 h. Particle size analysis was done by hydrometer method (53). Bulk density of the soil was determined using core method (54). Electrical conductivity (EC1:2.5) was determined with 1:2.5 soil-water and electrical conductivity of a saturated soil paste extract (ECe) was determined using electrical conductivity meter as described by (55). The paste extract was prepared using the FAO standard operating procedure for saturated soil paste extract. Soil pH was determined using pH meter using the method by Mclean (56). Soil OC was determined by the Walkley and Black wet oxidation method (57). Total nitrogen was analyzed using the Kjeldahl method described by (58). Available phosphorus was analyzed using (59, 60). Cation exchange capacity of soil (CEC) and exchangeable bases were determined by saturating soil with neutral 1M NH4OAc (ammonium acetate) and the adsorbed NH4+ was displaced by using 1M KCl and then determined by Kjeldahl distillation method for estimation of CEC of soil (61). Extractable micronutrients (Fe, Zn, Cu and Mn) were extracted by diethylenetriamine pentaacetic acid (DTPA) and determined using atomic absorption spectrophotometry (AAS) (62).
Carbonate (CO32−) and bicarbonate (HCO3−) were determined by titration with acid using the method described in (63). Chloride (Cl−) was determined by titration with the silver nitrate method described in (63). Sulfate (SO4−2) contents were determined by a turbidimetric procedure using a UV-visible spectrophotometer (64). The sodium adsorption ratio (SAR) and exchangeable sodium percentage (ESP) were calculated by the procedure outlined by developed by (65) using Equations 1, 2 respectively
2.4 Salt-affected soil classification
Salt affected soil classification was determined based on the chemical analysis of both surface and subsurface horizons using two classification systems. Based on Richards (65), the key parameters include pH, electrical conductivity of saturated paste extract (ECe), exchangeable sodium percentage (ESP), and sodium adsorption ratio (SAR), as described by Richards (65). The classification criteria for saline soil were ECe > 4.0 dS m−1 at 25°C; pH< 8.2; ESP< 15 and/or SAR<13. For saline-sodic the condition is ECe > 4.0 dS m−1 at 25°C; pH< 8.2; ESP >15 and/or SAR >13. Furthermore, for sodic soil ECe > 4.0 dS m−1 at 25°C; pH< 8.2; ESP >15 and/or SAR >13. Based on Choudhary (66), the key ions used for classification including sodium ions (Na+), chloride ions (Cl-) and sulphate ions (SO42-) as shown in Table 1.
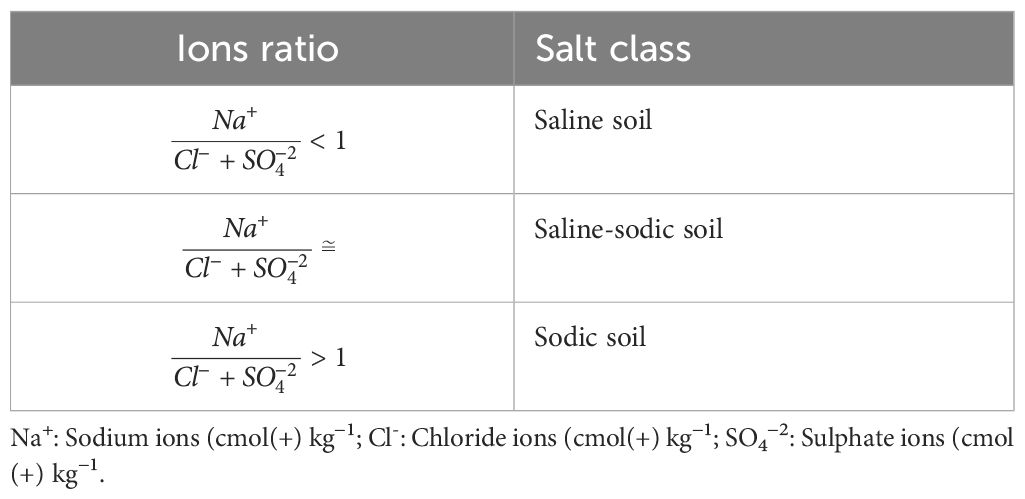
Table 1 Classification of salt-affected soils based ions ration (66).
2.5 Statistical analysis
Correlation between and among selected soil physicochemical properties was analyzed using R statistical software package (metan and gplots). Pearson’s correlation coefficient was used to quantify the strength and direction of linear relationships between variables. Preliminary data checks were carried out to ensure that the key assumptions of the method used were met. The linearity of the data was assessed using scatterplots, which allowed visual inspection of the relationship between the variables. At the same time, the normality of the data distributions was examined using Q-Q diagrams. In addition, the data set was examined for the presence of outliers using boxplots. Descriptive statistics were also used to generate tables showing the variations of the parameters studied Microsoft Excel (67). These results were used to evaluate and compare the severity of the salt effects across studied irrigation schemes.
3 Results and discussion
3.1 Physical soil properties
3.1.1 Soil depth
The soil depth varied from 150 cm to 180 cm in almost all profiles of all pedons examined. This indicated that the soil was deep (68). According to De Pauw (52), young alluvial deposits can have an influence on this remarkable soil depth due to flooding. The deep soil profile provides benefits for supporting the plant root systems (69). It allows roots to explore and expand a larger area to access water and nutrients (69). Consequently, these conditions can contribute to improving agricultural productivity and drought resilience in irrigation systems. In addition, the deeper soil regulates the temperature of the soil by acting as a storage and sink for thermal energy, thereby promoting the plant’s steady growth (70).
3.1.2 Texture
Soil texture variation across the irrigation schemes presented in Figure 2. In all three irrigation schemes, the soils had a higher clay content, which can have a positive impact on soil fertility as it retains moisture and nutrients. However, irrigation scheme 2 had the highest sand content compared to other irrigation schemes. Soil texture is a very stable property that influences the physical properties of the soil (71). It influences water movement through the soil profiles, nutrient availability for plants, and the overall soil health and productivity of ecosystems (71). Soil texture is correlated to soil fertility and quality in the long term (72).

Figure 2 Soil particle size distribution across three irrigation schemes. Data are mean percentage ± s.d.
Soil texture plays an important role in soil salinity leaching (73). The contrasting properties of sandy and clayey soils significantly impact their ability to manage and mitigate salinity-related problems. According to Khondoker, et al. (24, 74) and Gelaye et al. (24, 74), sandy soils have a significantly higher infiltration and leaching rate compared to clayey soils. This distinction implies that sandy soils have the ability to remove salts quickly and effectively, facilitating the leaching process. The increased permeability of sandy soils allows water to penetrate more quickly, removing salts from the root zone and preventing their accumulation. In contrast, clayey soils, which are characterized by finer particles and a denser structure, have lower infiltration and leaching rates. This intrinsic property leads to a longer retention of salts in the soil matrix (24, 74).
Variations in soil textures within irrigation schemes have distinct implications for effective salinity management. The presence of high clay content, especially in irrigation schemes 1 and 3, influences salt accumulation at the surface, thereby limiting salt leaching (24, 46). Conversely, the prevalence of higher sand content in irrigation scheme 2 improves the possibility of salt leaching (24).
3.2 Chemical soil properties
3.2.1 Soil reaction
The pH values of the surface horizons within the soil profiles were found to vary across the surveyed irrigation schemes. In Irrigation Scheme 1, the observed pH levels ranged from 7.2 to 10.1 for pedons, while for the subsurface horizons, the range was between 7.38 and 6.7. Similarly, in Irrigation Scheme 2, the surface horizon exhibited pH values ranging from 6.67 to 8.08, while the subsurface ranged from 6.2 to 8.4. In contrast, in Irrigation Scheme 3, the surface horizon’s pH levels spanned from 6.3 to 8.7, with the subsurface values ranging from 6.6 to 9.0. It was observed that the pH variations along the surveyed profiles were not consistent, with some soil profiles indicating a decrease in pH with increasing depth, while others demonstrated an increase in pH with depth. The results in (Figure 3A) align with the outcomes of the study conducted by (32) in Ndungu irrigation scheme. Overall, the results of the soil pH analysis underscore the prevalence of varying alkaline conditions across the surveyed irrigation schemes, with the majority of soils in Irrigation Scheme 1 exhibiting alkaline characteristics ranging from mildly neutral to strongly alkaline (pH values of 7.2 to 10.1) (75).
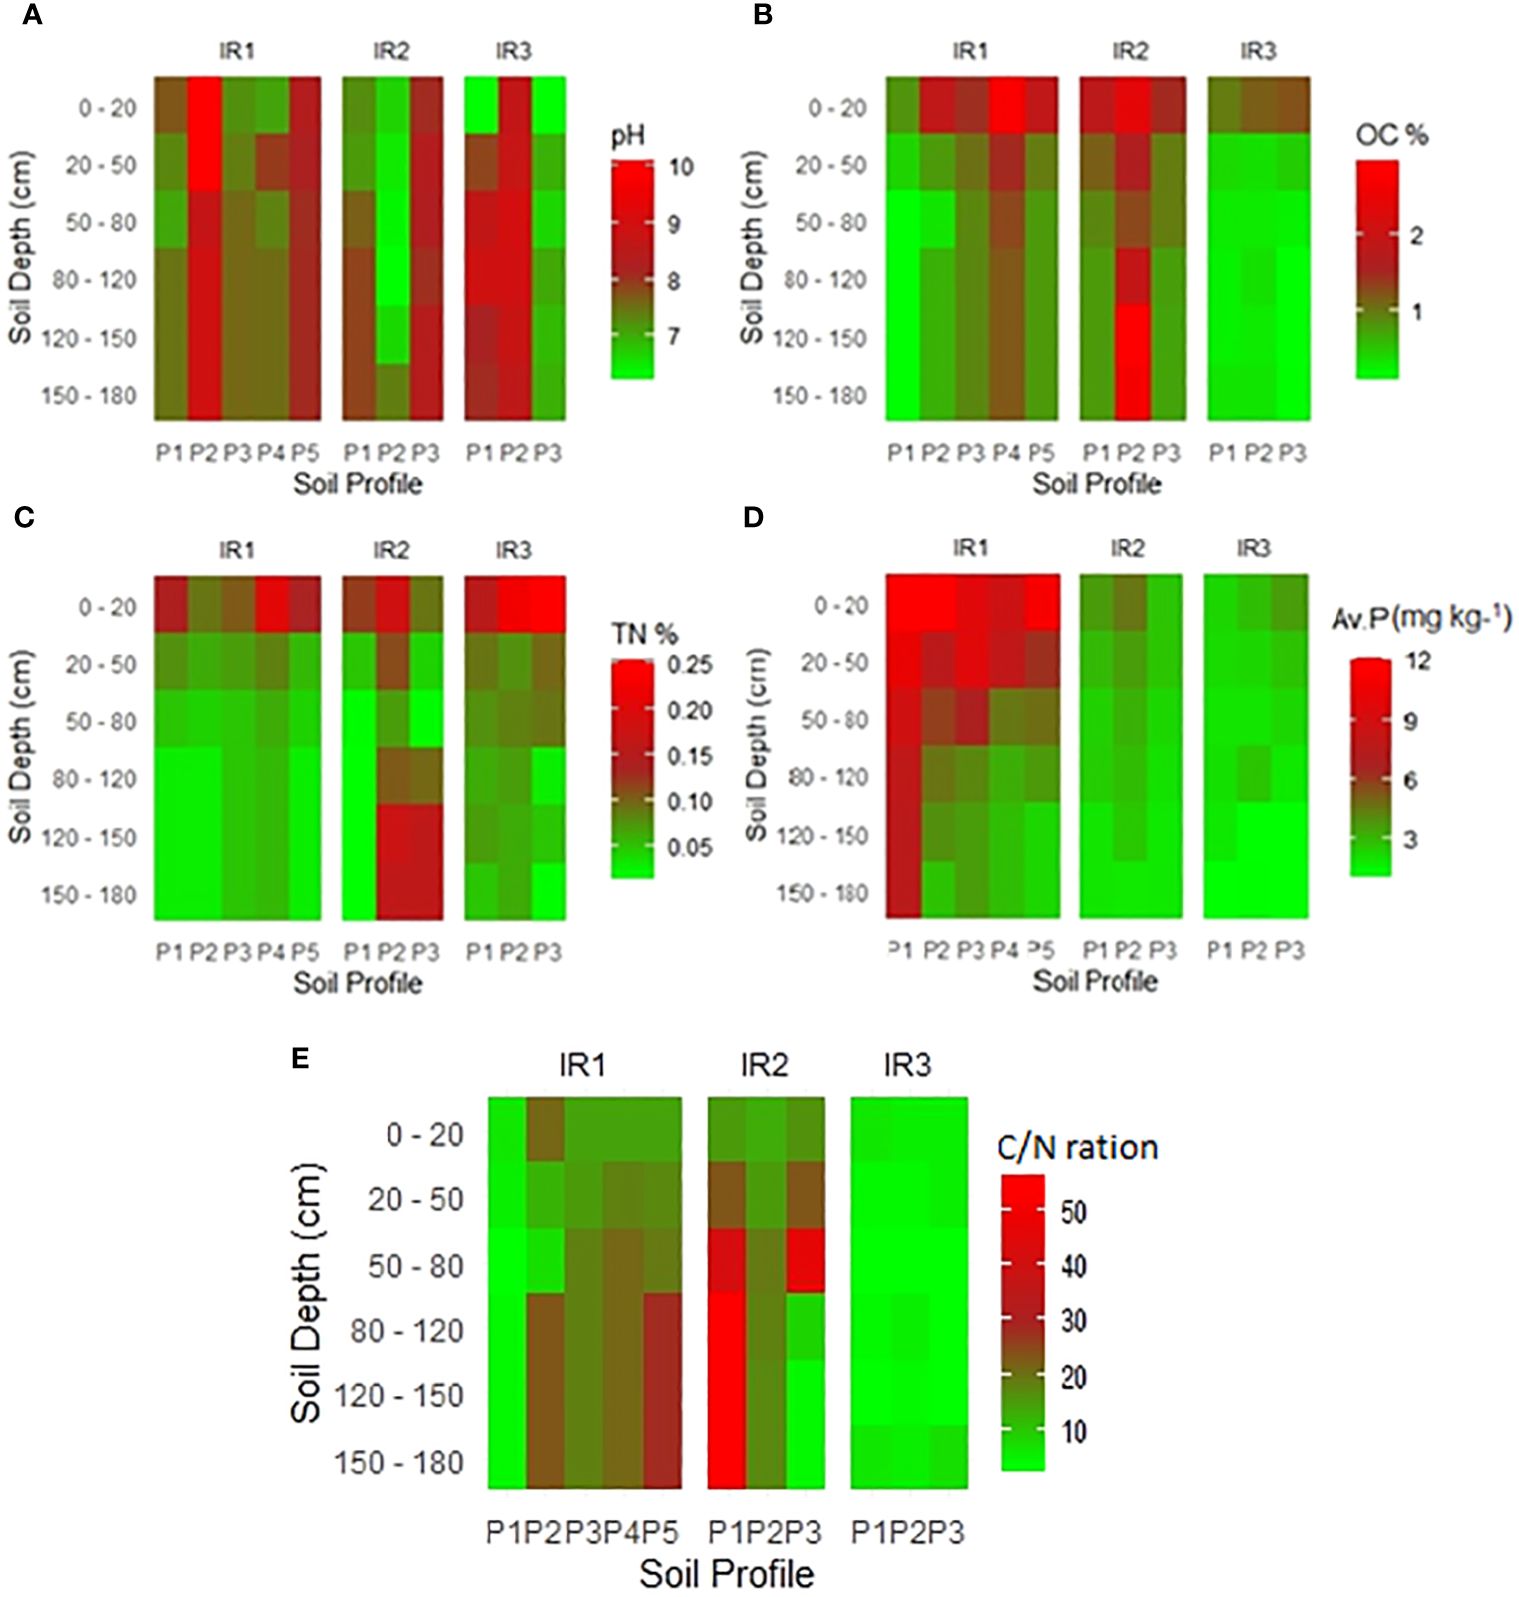
Figure 3 Variation in chemical properties with soil depth across the surveyed irrigation schemes. Note: IR: Irrigation scheme; P: Profile; (A) pH; (B) Organic carbon (%); (C) Total nitrogen (%); (D) Available phosphorous (mg/kg); (E) Carbon to nitrogen ratio (C/N ratio).
Variations in soil reactions in the study areas were highly related to variations in sodium levels and exchangeable salts. Soil can be acidic because of the weathering of silica-rich rocks, biological processes that produce acids, and the decomposition of organic matter (76), while alkaline soils, which are indicated by high pH, often develop through the weathering of rocks that contain significant amounts of exchangeable bases (Ca, Mg, K, and Na) (77).
Soil pH plays a crucial role in plant nutrient availability and, therefore, has a profound impact on plant growth and development. In acidic soils (pH< 6.5), the availability of nutrients such as iron (Fe) tends to increase, which benefits plants (78, 79), but manganese (Mn) also becomes more easily accessible, whose high availability leads to soil toxicity (80). While aluminum (Al) is toxic in excess, it becomes more soluble under acidic conditions. Al ions (Al3+) are considered a limiting factor for plant growth through their effect on the deficiency of phosphorus (P), calcium (Ca), magnesium (Mg), and toxic manganese (81). In alkaline soil (pH >), the availability of phosphorus (P) decreases due to precipitation, while the availability of molybdenum (Mo) increases in moderately alkaline soil (79). Zinc (Zn) becomes less soluble, which has a negative impact on plant health (79).
3.2.2 Soil organic carbon, total nitrogen and C/N ratio
Soil organic carbon (SOC) content within the surface horizons showed values ranging from 0.8% to 2.7%, indicating variation from very low to high levels (Figure 3B) (75), but was dominated by low levels. In contrast, the SOC content within the subsurface horizons varied between 0.1% and 3.0%. In general, the dominant value was 0.9%. The SOC content of all irrigation systems decreased with soil depth, except for profile pit 2 (P2) under irrigation scheme 2, where certain subsurface horizons had a high SOC content. This irregularity may be attributed to buried soil-horizon or the pedoturbation process in heavy clay soils. Surface soil layers had a higher SOC content than subsurface layers, mainly due to the continuous input of organic matter from plant and animal residues. According to the rating by (82, 83), the SOC content in the surface horizons is in the low to medium range. Likewise, total nitrogen (TN) showed a similar decreasing pattern with soil depth, with values ranging from 0.1% to 0.3% in surface horizons and 0.01% to 0.2% in subsurface horizons (Figure 3C). According to Farzadfar et al. (84),, nitrogen is bound to the organic matter in the soil; the total amount of nitrogen decreases with depth as the amount of organic matter decreases. Furthermore, a linear correlation analysis (Figure 4) revealed a significant and positive correlation (p = 0.001∗∗∗) between TN and OC.

Figure 4 Pearson’s correlation coefficient (r) between selected chemical properties. * p< 0.05, ** p< 0.01, *** p< 0.001. ECe = electrical conductivity at saturated paste extract; Na = exchangeable sodium; Ca = exchangeable calcium; Mg = exchangeable magnesium; K = exchangeable potassium; Av. P = available phosphorous; TN = total nitrogen; OC = organic carbon; ESP = exchangeable sodium percentage; SAR = sodium adsorption ration; Cl = chloride; SO4 = sulphate; HCO3 = bicarbonate.
In addition, the Carbon to Nitrogen C/N ratios (Figure 3E) across irrigation schemes, generally decrease with increasing soil depth within each irrigation scheme. This reflecting variations in organic matter content and decomposition processes with soil depth. In some profile, there are notable differences in C/N ratios among irrigation schemes, indicating potential impacts of irrigation practices on soil fertility and nutrient cycling. For instance, irrigation scheme IR2 exhibits higher C/N ratios compared to IR1 and IR3 at different soil depths, suggesting possible differences in organic matter management, nitrogen inputs or soil forming process. According to Abrar et al. (85), C and N contents and their stoichiometry decreased with increasing soil depth. These negative correlations influence the C stabilization in the surface layers. Furthermore, Abrar et al. (86) reported that soil C and N ratios can be influenced by the availability of N and P in the soil, as well as management practices and microbial stoichiometry, which influence C and N mineralization.
3.2.3 Available phosphorus
In all irrigation schemes studied, soils with low available P (Figure 3D) dominated both topsoil and subsoil, except for a few observed profiles. The low available P content in the soil may be due to the low rate of fertilizer application and phosphorus fixation reactions. According to Omar et al. (33), the high cost of fertilizers causes farmers to use less recommended fertilizers in rice irrigation schemes. Additionally, the phosphorus fixation reaction is pH dependent (87) and occurs under three conditions. In acidic soils with extremely acid (pH< 4.5), P can precipitate with iron, while strongly acid to moderate acid soils at (pH 4.5 to 5.0 and 5.6 to 6.0) can precipitate with aluminum (88, 89). In alkaline soils with moderate alkaline (pH 7.9 to 8.4), P can precipitate with calcium to form poorly soluble calcium phosphates (88, 89). This means that a large portion of the applied P can be chemically bound, whereas only a small portion of the soil P remains in the soil solution and is available for plant uptake (87, 90).
According to Thomas and Pierzynski (91), the natural release of phosphorus (Av.P) in the soil is characterized by a slow process, which is mainly due to the high reactivity of phosphorus in the soil solution and the low solubility of primary phosphorus minerals. As a result, external sources of phosphorus become essential to replenish the available phosphorus content in the soil and meet the nutrient requirements of agricultural crops (91).
3.2.4 Exchangeable bases (Ca, Mg, K and Na)
The results showed irregular fluctuations in the levels of exchangeable basic cations in the soil profiles (Figure 5). The exchangeable calcium (Ca2+) showed considerable variations, ranging from 0.3 to 3.3 cmol(+) kg−1 (Figure 5A). This wide range suggests that there are very low to low calcium levels in the soil in the studied irrigation schemes (75), a condition that raises concerns that it is insufficient to maintain normal plant growth. Calcium plays a crucial role in various physiological processes essential for plants, including cell wall structure and stability, enzyme activation, and nutrient uptake (92, 93). Exchangeable magnesium (Mg) showed a wide variation from 0.2 to 5.0 mol(+) kg−1 as shown in (Figure 5B), indicating very low to high values (75, 94). Therefore, the soils of some pedons have sufficient amounts of exchangeable Mg for crop production. For example, in the irrigation system (IR1), the soils in Profile 4 had high magnesium levels both on the surface and in the subsurface horizons. Likewise, the exchangeable potassium (K) values, as shown in (Figure 5C), ranged from 0.01 to 6.9 cmol(+) kg−1, ranging from very low to very high (75).
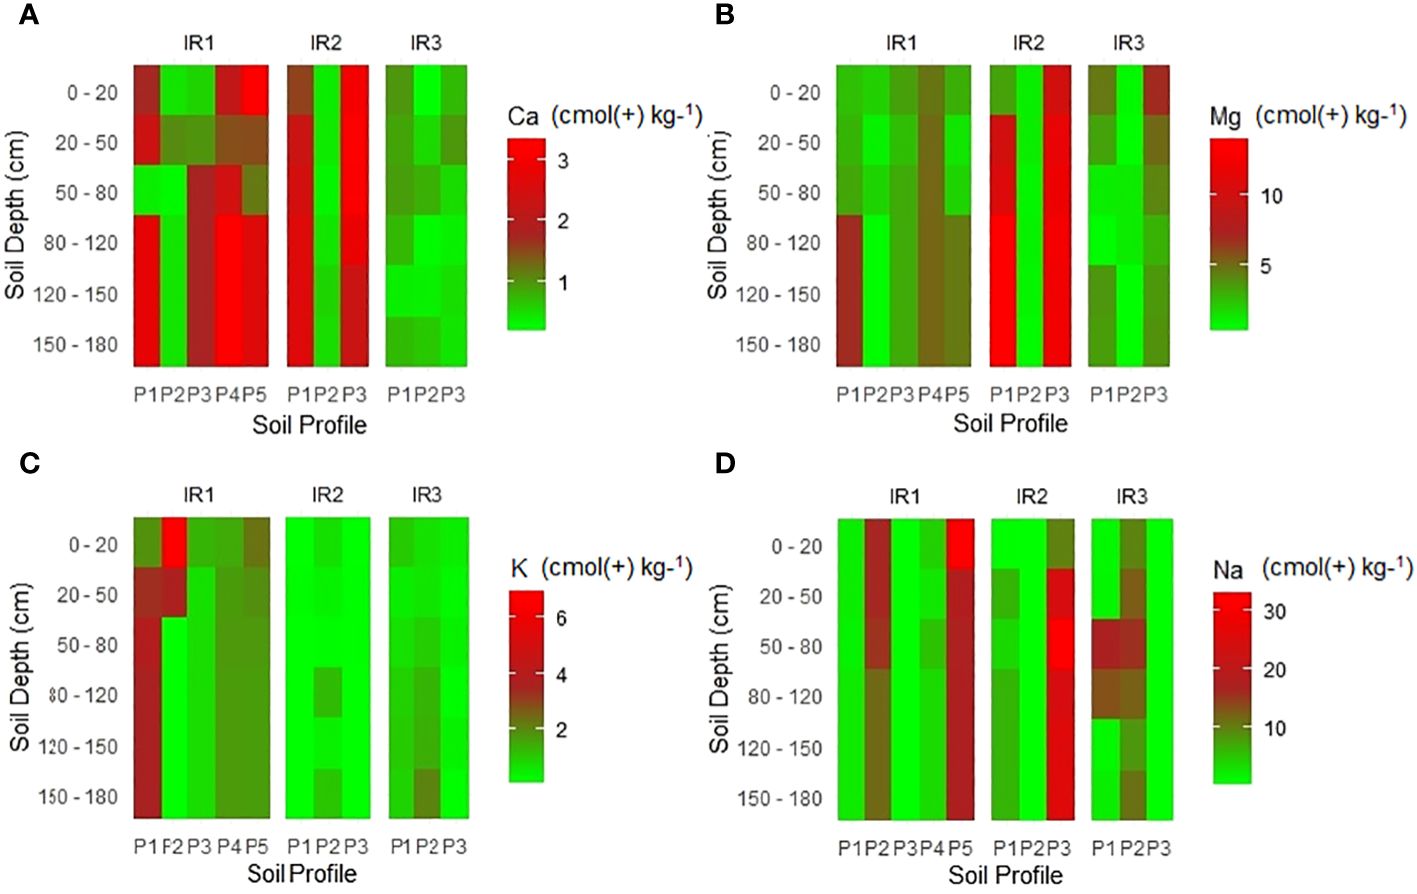
Figure 5 Variation of exchangeable bases with soil depth across the surveyed irrigation schemes. Note: (A) Calcium (cmol(+) kg−1), (B) Magnesium (mol(+) kg−1), (C) Potassium (mol(+) kg−1), (D) Sodium (mol(+) kg−1).
The observed differences between surface and subsurface horizons were evident both within and between the different irrigation schemes studied. According to Meliyo et al. (32), intensive rice farming without the use of suggested fertilizers may exacerbate the low base concentrations in some of the soils, which are generally thought to be related to innate limitations in soil fertility.
Exchangeable sodium (Na) showed significant differences between irrigation schemes, ranging from 0.1 to 32 cmol(+) kg−1 (Figure 5). The variation suggests the presence of excessive sodium (sodicity/salinity) in certain soil horizons, which could potentially have negative effects on rice growth. Although ESP is a widely used measure of the effects of high sodium levels (75). In general, soils with an ESP below 15% are considered to be at low risk of sodicity. If the ESP is between 15% and 40%, it indicates a moderate risk of sodicity, while values above 40% indicate a high risk (46). The results of the study (Supplementary Table S2) showed that some ESP values have a high risk, exceeding 40%. This means that the concentration of sodium in the soil is highly relative to other cations in the soil. To optimize rice growth and yield under the high risk of sodium effective soil management practices must be implemented. Gypsum is a common and wide amendment for sodic and saline-sodic soil (95, 96). Gypsum (calcium sulfate) has the unique ability to replace sodium ions (Na+) with calcium ions (Ca2+) in the soil solution. This process helps reduce the excess sodium at the exchange site in the soil. Gypsum improves soil structure by promoting flocculation, which causes soil particles (clay and silt) to form large and more stable aggregate (95, 97, 98). Soils with high exchangeable sodium suffer from poor drainage and compaction, so gypsum breaks down sodium dispersion and improves soil permeability (95, 97). On the other hand, gypsum provides calcium, improves nutrient availability (99), and prevents magnesium-related soil tension (97).
Bases in the non-exchangeable forms may be of limited use as sources of nutrients for plants, but their gradual release helps to replenish the supply of exchangeable bases in the soil (100). The rate of release of these bases from the non-exchangeable forms is expected to increase with the intensity of weathering, especially when the soil materials have uniform properties (100).
3.2.5 Exchangeable anions (CO32-, HCO3-, Cl-, and SO42-) in the studied irrigation schemes
The results indicated that there were variations of carbonate (CO3-), bicarbonate (HCO3-), chloride (Cl-), and sulphate (SO42-) between studied soil profiles, and these variations directly correlate with the presence of sodium Na+ and other essential cations. The anions showed irregular variations with soil depth, as shown in Figure 6. The high concentrations of carbonate (CO3-), bicarbonate (HCO3-), chloride (Cl-), and sulphate (SO42-) were an indication of the existence of salt-affected soils (9). In particular, the abundance of carbonate and bicarbonate anions contributes to increased soil alkalinity and affects the availability and uptake of certain nutrients, as reported by (30). Iron (Fe) became less soluble, leading to iron deficiency in plants, manganese (Mn) become less available; Phosphorus (P) precipitated as insoluble compounds, reducing its uptake and hindering zinc (Zn) absorption (101). Likewise, the concentration of chloride anions serves as an indicator of presence of soluble salts and, due to their presence, reduces water availability to plants, and it competes with other anions (i.e. nitrate, sulfate, and phosphate) for uptake by plant roots (49, 102). Furthermore, these anions provide valuable insight into specific types of salts in the soil. The dominant salts in the irrigation scheme under study are chloride and bicarbonate of sodium and magnesium, as indicated by the high concentration of cations of Na+ and Mg+ and anions of Cl- and HCO3- in a soil solution.
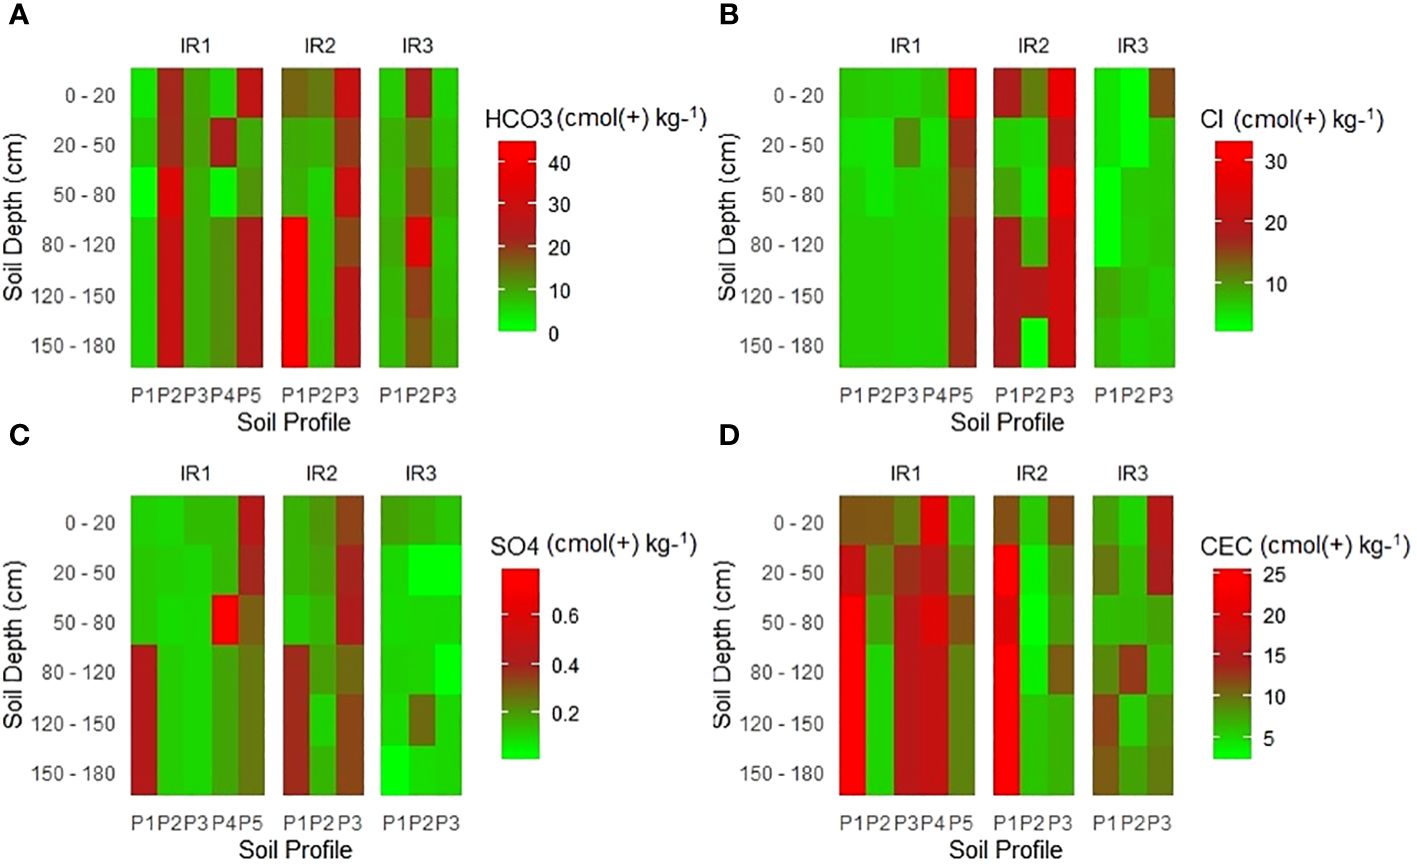
Figure 6 Variation of exchangeable anions with soil depth across the surveyed irrigation schemes. Note: (A) Hydrogen Carbonate (cmol (+) kg−1), (B) Chloride (cmol(+) kg−1), (C) Sulfate (cmol(+) kg−1, and (D) CEC (cmol(+) kg−1)).
3.2.6 Cation exchange capacity
Cation exchange capacity (CEC) measures the soil’s ability to retain and exchange positively charged ions. Cation exchange capacity is an important parameter in determining soil health, indicating the amount of negatively charged sites on the soil surface capable of retaining positively charged ions (41, 97). The results of the study showed a decreasing trend of the CEC with increasing soil depth and sodium concentration in all irrigation systems. CEC values ranged from 2.1 to 25.5 cmol(+) kg−1 soil across all irrigation schemes (Figure 7). This indicated very low to medium values (75). Soils with higher cation exchange capacity CEC values have a greater ability to retain essential cations such as Ca2+, Mg2+ and K+ in the soil solution (97). Salt-affected soils generally have lower CEC values compared to non-saline soils due to the presence of salts that displace cations from exchange sites, resulting in reduced CEC (46). However, it is worth noting that CEC in salt-affected soils can be improved through specific soil management practices such as adding gypsum and organic matter to the soil.
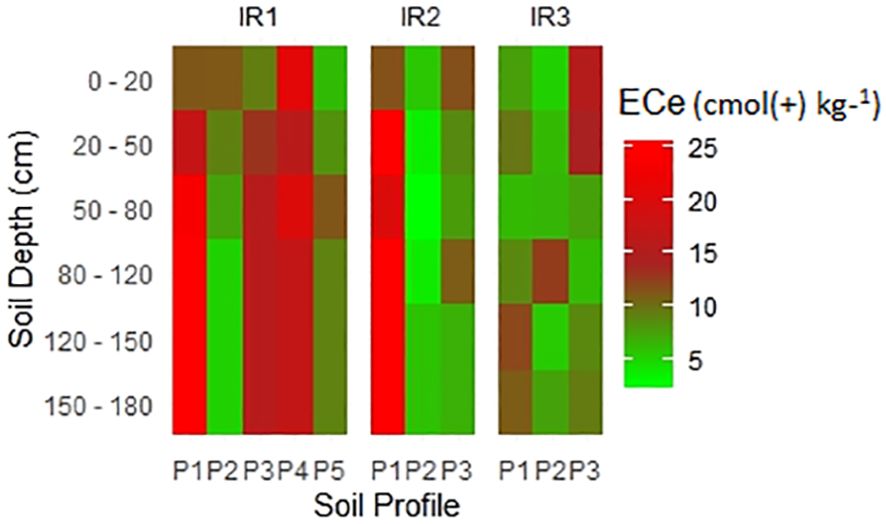
Figure 7 Variation of electrical conductivity of saturated paste extract (ECe) with soil depth.
Gypsum helps displace salts, while organic material increases the availability of exchange sites for cations (95, 97, 98). Organic matter is negatively charged, and when added to salt-affected soil, it increases soil CEC, improves soil structure, increases nutrient availability, and increases overall soil fertility (98, 103).
3.2.7 Electrical conductivity of saturated paste extract
Soil ECe is a crucial indicator of soil salinity and is directly related to the presence and concentration of salts in the soil matrix (104, 105). The results of the ECe values in the studied irrigation scheme, as presented in (Figure 7), ranged from the lowest 0.34 dS m−1 to the highest 28.97 dS m−1. In the context of rice cultivation, an ECe above 4 dS m−1 is considered moderate salinity, while an ECe above 8 dS m−1 is considered high (106, 107). At high ECe (> 8 dS m−1) rice plants face the challenge of reducing water uptake due to osmotic stress, ion toxicity affecting nutrient balance, and altering root development and nutrient uptake (106, 107). Based on the results of the study, it was pointed out that the soils in some areas of irrigation systems may have salinity problems, which may lead to a decline in rice yield.
According to Richard (65), an ECe value below 2 dS m−1 indicates a soil with low salt content due to the reduced presence of soluble salts. However, this observation alone does not necessarily imply the absence of sodicity. In certain cases, the accumulation of Na+ ions at exchange sites can induce sodicity even when ECe is low, leading to increased sodium concentrations. It is essential to emphasize that the classification of salt-affected soils is based on several salt indicators, including pH, ECe, exchangeable sodium percentage (ESP), and sodium adsorption ratio (SAR) (65). The results in Figure 4 demonstrate a strong correlation between ECe, sodium, and soluble anions.
4 Characteristics of salts in the studied irrigation schemes
The field soil description indicates that inherent natural pedogenetic processes involving mineral weathering, leaching, and ion exchange were the primary cause of salinity problems in the studied irrigation schemes. However, these challenges are compounded by poor management practices, particularly inadequate removal of irrigation water. Among a critical factor intensifying salinity problem in the studied area is the lack of efficient drainage infrastructure. This forces farmers to irrigate salt water from their neighboring farms that are affected salts (32, 33). This practice results in an involuntary spread of soil salinity to areas that were previously unaffected or less affected.
Out of the 56 soil horizons analyzed, 25 percent were of the two upper horizons found to have an ECe value ranging from 4.6 dS m−1 to 29.0 dS m−1 (Supplementary Table S2). This finding highlights the prevalence of soil salinity in the studied area, which has important implications for land use and agricultural productivity. Most crops are sensitive to salt concentration, but the magnitude of the effects varies depending on concentration, growth stages, and crop species (107, 108). Plants are more sensitive to salts in the early growth stages (germination and seedling stages) (109). Rice (Oryza sativa) can tolerate an ECe value of less than 4 dS m−1; beyond this threshold, critical yield losses can occur. The results presented in (Supplementary Table S2) indicate that in some soil horizons, the ECe values were above the rice threshold, which ultimately resulted in yield losses or complete crop failure in some parts of the studied irrigation schemes. Sustained rice yield losses due to salinization resulted to farmers abandoning part of their land, leading to a reduction of productive areas, thereby affecting food security. Low yields have been reported in some rice farming irrigated systems in Tanzania (32, 110), and due to large losses, some of the farms have even been abandoned (32). The yield loss ranges from 5 to 100% and has been reported by (31).
The dominant ions were Na+, Mg+, HCO3-, and Cl-. Based on the soil salt classification (Figure 8) (65, 66), saline-sodic and sodic soils were identified. Irrigation scheme 1 had saline and sodic soils, while only saline-sodic soils were observed in irrigation scheme 2. Furthermore, only sodic soils were identified in irrigation scheme 3. The presence of salt-affected soils in the studied irrigation scheme was also supported by a study conducted by (31, 33) on farmers’ perceptions of salt-affected soils in irrigation systems, where 25% of farms were reported to be affected by salt-affected soils. Based on the identified types of salt-affected soils, salt remediation measures need to be implemented to ensure sustainable rice production, high yields, and food security.
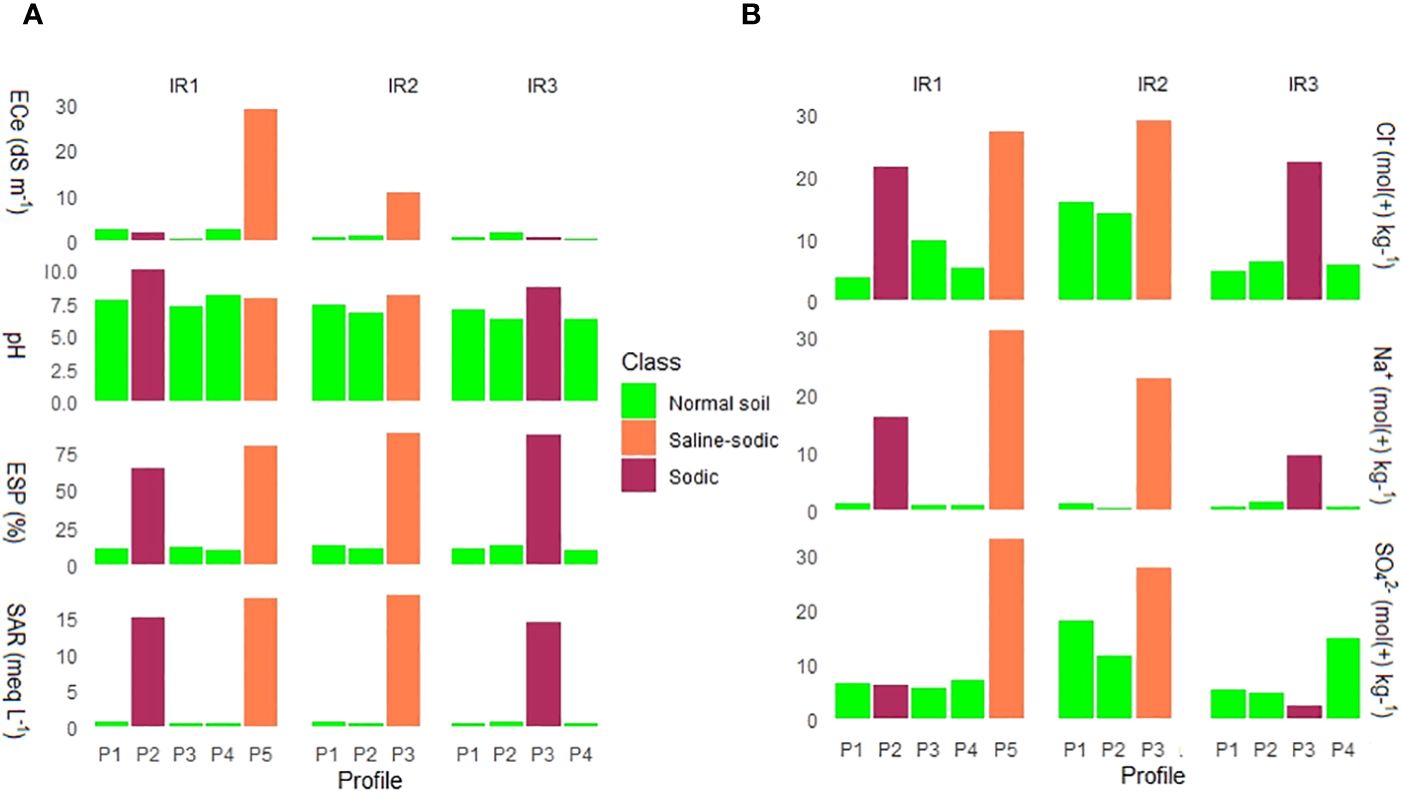
Figure 8 Classification of salt-affected soils of the surface horizons of surveyed profile pits, (A) is based on Richards (65), and (B) is based on Choudhary (66).Note ECe=electrical conductivity at saturated paste extract; ESP=exchangeable sodium percentage; SAR=sodium adsorption ratio, pH, Cl=chloride; Na=sodium; SO4=sulfate; IR=irrigation scheme, and P=profile.
5 Conclusion and recommendation
Soil characterizations were conducted to understand the types, distribution, and nature of salt-affected soils in three irrigation schemes. Eleven soli profile pits were described, undisturbed and disturbed samples were taken and analyzed for physical and chemical properties. Soils in all areas were deep and influenced by young alluvial deposits and floods, which offer a substantial benefit to plant root systems and then enhance agricultural productivity. The distinct variations in soil texture, with a higher clay content in irrigation schemes I and III and a high sand content in scheme 2, implies its variations in influencing water movement, nutrient availability, and overall soil health. The prevalence of low levels of available phosphorus, organic carbon, and total nitrogen in soil, as well as fluctuations in exchangeable bases, highlight the need for targeted soil management practices to optimize nutrient availability for crops. In the soil profile layers, which contained salts, sodium was the dominated cation, followed by magnesium, potassium, and calcium. The anions were dominated by bicarbonate, chloride, and sulfate. Some ECe > 4 dS m−1 were observed in some of the soil horizons, which has a detrimental effect on rice because rice can only tolerate an ECe value of less than 4 dS m−1. Beyond this threshold, critical yield losses or complete crop failure can occur. Two types of salt-affected soils, sodic and saline-sodic, were identified in some of the described profile pits. The root cause of these challenges lies in inherent soil processes, aggravated by inadequate drainage infrastructure that forces farmers to use salt water from neighboring farms. This agricultural practice led to an increase in the accumulation of salt farms that have been affected, as well as non-affected farms.
In light of these findings, to ensure sustainable rice production in the studied irrigation schemes, it is recommended to: First, implement efficient drainage systems to limit saltwater spreading and salt accumulation on unaffected rice farms. Second, application of gypsum to the affected farms, where calcium will replace sodium in the exchange site, combined with quality water help to leach the soluble salts in the root zones. Third, the use of manure could help to improve water infiltration and enhance salt leaching to minimize the effect of salts in the root zone. Fourth, promote the use of salt-tolerant rice varieties that can withstand salinity levels above established limits to maintain rice yields. In addition, continuous monitoring and periodic assessments of soil health should be integrated into the farm management plan to enable timely interventions and informed decision making.
Data availability statement
The original contributions presented in the study are included in the article/Supplementary Material. Further inquiries can be directed to the corresponding author.
Author contributions
MO: Conceptualization, Data curation, Formal analysis, Methodology, Writing – original draft, Writing – review & editing. BM: Writing – review & editing. MS: Writing – review & editing. OP: Writing – review & editing. JM: Writing – review & editing. KF: Writing – review & editing.
Funding
The author(s) declare financial support was received for the research, authorship, and/or publication of this article. The authors gratefully acknowledge the Climate Smart Africa Rice Project, Grant No.19-03-KU, for the financial Support.
Conflict of interest
The authors declare that the research was conducted in the absence of any commercial or financial relationships that could be construed as a potential conflict of interest.
Publisher’s note
All claims expressed in this article are solely those of the authors and do not necessarily represent those of their affiliated organizations, or those of the publisher, the editors and the reviewers. Any product that may be evaluated in this article, or claim that may be made by its manufacturer, is not guaranteed or endorsed by the publisher.
Supplementary material
The Supplementary Material for this article can be found online at: https://www.frontiersin.org/articles/10.3389/fsoil.2024.1372838/full#supplementary-material
References
1. Kopittke PM, Menzies NW, Wang P, McKenna BA, Lombi E. Soil and the intensification of agriculture for global food security. Environ Int. (2019) 132:1–8. doi: 10.1016/j.envint.2019.105078
2. Silver WL, Perez T, Mayer A, Jones AR. The role of soil in the contribution of food and feed. Philos Trans R Soc B: Biol Sci. (2021) 376:1–15. doi: 10.1098/rstb.2020.0181
3. Harris JA, Evans DL, Mooney SJ. A new theory for soil health. Eur J Soil Sci. (2022) 73:1–7. doi: 10.1111/ejss.13292
4. Rodrigues L, Hardy B, Huyghebeart B, Fohrafellner J, Fornara D, Barančíková G, et al. Achievable agricultural soil carbon sequestration across Europe from country-specific estimates. Glob Chang Biol. (2021) 27:63–80. doi: 10.1111/gcb.15897
5. Tahat MM, Alananbeh KM, Othman YA, Leskovar DI. Soil health and sustainable agriculture. Sustainability. (2020) 12:1–26. doi: 10.3390/SU12124859
6. Timmis K, Ramos JL. The soil crisis: the need to treat as a global health problem and the pivotal role of microbes in prophylaxis and therapy. Microb Biotechnol. (2021) 14:76–97. doi: 10.1111/1751-7915.13771
7. Singh A. Soil salinity: A global threat to sustainable development. Soil Use Manag. (2022) 38:39–67. doi: 10.1111/sum.12772
8. Kumar P, Sharma PK. Soil salinity and food security in India. Front Sustain Food Syst. (2020) 4:533781. doi: 10.3389/fsufs.2020.533781
9. Prasad K, Devkota M, Rezaei M, Oosterbaan R. Managing salinity for sustainable agricultural production in salt-affected soils of irrigated drylands. Agric Syst. (2022) 198:1–16. doi: 10.1016/j.agsy.2022.103390
10. Bhandari D, Joshi R, Regmi RR, Awasthi N. Assessment of soil erosion and its impact on agricultural productivity by using the RMMF model and local perception: A case study of rangun watershed of mid-hills, Nepal. Appl Environ Soil Sci. (2021) 1:1–10. doi: 10.1155/2021/5747138
11. Steinhoff-Knopp B, Kuhn TK, Burkhard B. The impact of soil erosion on soil-related ecosystem services: development and testing a scenario-based assessment approach. Environ Monit Assess. (2021) 1:1–18. doi: 10.1007/s10661-020-08814-0
12. Guo M. Soil health assessment and management: Recent development in science and practices. Soil Syst. (2021) 5:1–20. doi: 10.3390/soilsystems5040061
13. Tindwa HJ, Singh BR. Soil pollution and agriculture in sub-Saharan Africa: State of the knowledge and remediation technologies. Front Soil Sci. (2023) 2:1101944. doi: 10.3389/fsoil.2022.1101944
14. Guan DX, Shi Z, Zhu L, Zhu YG, Dahlgren RA, Ma LQ. Health as a unifying concept to promote integrated soil and environmental research. Soil Environ Health. (2023) 1:1–3. doi: 10.1016/j.seh.2023.100001
15. Silva AMM, de Araújo VLVP, Cardoso EJBN. Revisiting the past to understand the present and future of soil health in Brazil. Front Soil Sci. (2023) 17:1172436. doi: 10.3389/fsoil.2023.1172436
16. Zhao R, Wu K. Soil health evaluation of farmland based on functional soil management—a case study of Yixing city, Jiangsu province, China. Agriculture. (2021) 11:1–27. doi: 10.3390/agriculture11070583
17. Ros GH, Verweij SE, Janssen SJC, De Haan J, Fujita Y. An open soil health assessment framework facilitating sustainable soil management. Environ Sci Technol. (2022) 56:17375–84. doi: 10.1021/acs.est.2c04516
18. Maharjan B, Das S, Acharya BS. Soil Health Gap: A concept to establish a benchmark for soil health management. Glob Ecol Conserv. (2020) 1:1–6. doi: 10.1016/j.gecco.2020.e01116
19. Abd-Elmabod SK, Bakr N, Muñoz-Rojas M, Pereira P, Zhang Z, Cerdà A, et al. Assessment of soil suitability for improvement of soil factors and agricultural management. Sustainability. (2019) 11:1–21. doi: 10.3390/su11061588
20. Strauss V, Paul C, Dönmez C, Löbmann M, Helming K. Sustainable soil management measures: a synthesis of stakeholder recommendations. Agron Sustain Dev. (2023) 43:1–26. doi: 10.1007/s13593-022-00864-7
21. Hopmans JW, Qureshi AS, Kisekka I, Munns R. Critical knowledge gaps and research priorities in global soil salinity. Switzerland: Springer (2021) 1(1):1–191. doi: 10.1007/978-3-031-37428-9_17
22. Cuevas J, Daliakopoulos IN, Del Moral F, Hueso JJ, Tsanis IK. A review of soil-improving cropping systems for soil salinization. Agronomy. (2019) 9:1–22. doi: 10.3390/agronomy9060295
23. Uri N. Cropland soil salinization and associated hydrology: Trends, processes and examples. Water. (2018) 10:1–20. doi: 10.3390/w10081030
24. Khondoker M, Mandal S, Gurav R, Hwang S. Freshwater shortage, salinity increase, and global food production: A need for sustainable irrigation water desalination—A scoping review. Earth. (2023) 4:223–40. doi: 10.3390/earth4020012
25. Ivushkin K, Bartholomeus H, Bregt AK, Pulatov A, Kempen B, de Sousa L. Global mapping of soil salinity change. Remote Sens Environ. (2019) 2:1–12. doi: 10.1016/j.rse.2019.111260
26. Shrivastava P, Kumar R. Soil salinity: A serious environmental issue and plant growth promoting bacteria as one of the tools for its alleviation. Saudi J Biol Sci. (2015) 22:1–12. doi: 10.1016/j.sjbs.2014.12.001
27. Khamidov M, Ishchanov J, Hamidov A, Donmez C, Djumaboev K. Assessment of soil salinity changes under the climate change in the khorezm region, Uzbekistan. Int J Environ Res Public Health. (2022) 19:1–13. doi: 10.3390/ijerph19148794
28. UN. World Population Projected to Reach 9.8 Billion in 2050, and 11.12 Billion in 2100 (2017). Dep. Econ. Soc. Aff. Available online at: https://www.un.org/development/desa/en/news/population/world-population-prospects-2017.html (Accessed 13/10/2023).
29. Butcher K, Wick AF, Desutter T, Chatterjee A, Harmon J. Soil salinity: A threat to global food security. Agron J. (2016) 108:2189–200. doi: 10.2134/agronj2016.06.0368
30. Shahid SA, Zaman M, Heng L. Introduction to soil salinity, sodicity and diagnostics techniques. Guideline Salinity Assess Mitigation Adapt Using Nucl Related Tech. (2018) 1:1–42. doi: 10.1007/978-3-319-96190-3_1
31. Kashenge-Killenga S, Meliyo J, Urassa G, Kongo V. Extent of Salt-Affected Soils and Their Effects in Irrigated and Lowland Rain-Fed Rice Growing Areas of Southwestern Tanzania. In: Lal R, Kraybill D, Hansen DO, Singh BR, Mosogoya T, Eik LO, editors. Climate Change and Multi-Dimensional Sustainability in Agriculture: Climate Change and Sustainability in Agriculture, vol. 1. Switzerland: Springer International (2016). p. 97–126. doi: 10.1007/978-3-319-41238-2_3
32. Meliyo JL, Kashenge-Killenga S, Victor KM, Mfupe B, Hiza S, Kihupi AL, et al. Evaluation of salt affected soils for rice (Oryza sativa) production in ndungu irrigation scheme same district, Tanzania. Sustain Agric Res. (2016) 6:24–38. doi: 10.5539/sar.v6n1p24
33. Omar MM, Shitindi MJ, Massawe BHJ, Fue KG, Pedersen O, Meliyo JL. Exploring farmers’ perception, knowledge, and management techniques of salt-affected soils to enhance rice production on small land holdings in Tanzania. Cogent Food Agric. (2022) 8:1–20. doi: 10.1080/23311932.2022.2140470
34. Otlewska A, Migliore M, Dybka-Stępień K, Manfredini A, Struszczyk-Świta K, Napoli R, et al. When salt meddles between plant, soil, and microorganisms. Front Plant Sci. (2020) 11:553087. doi: 10.3389/fpls.2020.553087
35. Ketehouli T, Carther KFI, Noman M, Wang FW, Li XW, Li HY. Adaptation of plants to salt stress: Characterization of Na+ and K+ transporters and role of Cbl gene family in regulating salt stress response. Agronomy. (2019) 9:1–32. doi: 10.3390/agronomy9110687
36. Munns R, Tester M. Mechanisms of salinity tolerance. Annu Rev Plant Biol. (2008) 59:651–81. doi: 10.1146/annurev.arplant.59.032607.092911
37. Daba AW, Qureshi AS. Review of soil salinity and sodicity challenges to crop production in the lowland irrigated areas of Ethiopia and its management strategies. Land. (2021) 10:1–21. doi: 10.3390/land10121377
38. Farahani E, Emami H, Fotovat A, Khorassani R, Keller T. Soil available water and plant growth in relation to K:Na ratio. Geoderma. (2020) 1:1–7. doi: 10.1016/j.geoderma.2020.114173
39. Rengasamy P. Irrigation water quality and soil structural stability : A perspective with some new insights. Agronomy (2018) 8(5):1–13. doi: 10.3390/agronomy8050072
40. Pedersen O, Perata P, Voesenek LACJ. Flooding and low oxygen responses in plants. Funct Plant Biol. (2017) 44:3–6. doi: 10.1071/FPv44n9_FO
41. Gondek M, Weindorf DC, Thiel C, Kleinheinz G. Soluble salts in compost and their effects on soil and plants: a review.. In: compost science & utilization, (2020) 28(2):59–75. doi: 10.1080/1065657X.2020.1772906
42. Ullah A, Bano A, Khan N. Climate change and salinity effects on crops and chemical communication between plants and plant growth-promoting microorganisms under stress. Front Sustain Food Syst. (2021) 5:618092. doi: 10.3389/fsufs.2021.618092
43. Abrar MM, Saqib M, Abbas G, Atiq-Urrahman M, Mustafa A, Shah SAA, et al. Evaluating the contribution of growth, physiological, and ionic components towards salinity and drought stress tolerance in jatropha curcas. Plants. (2020) 9:1–18. doi: 10.3390/plants9111574
44. Sheldon AR, Dalal RC, Kirchhof G, Kopittke PM, Menzies NW. The effect of salinity on plant-available water. Plant Soil. (2017) 418:477–91. doi: 10.1007/s11104-017-3309-7
45. Omuto C, Vargas R, El Mobarak A, Mohamed N, Viatkin K, Yigini Y, et al. Mapping of salt-affected soils. Technical Manual. Rome: FAO (2020). 1–151pp. doi: 10.4060/ca9215en
46. Stavi I, Thevs N, Priori S. Soil salinity and sodicity in drylands: A review of causes, effects, monitoring, and restoration measures. Front Environ Sci. (2021) 9:712831. doi: 10.3389/fenvs.2021.712831
47. Litalien A, Zeeb B. Curing the earth: A review of anthropogenic soil salinization and plant-based strategies for sustainable mitigation. Sci Total Environ. (2020) 698:1–15. doi: 10.1016/j.scitotenv.2019.134235
48. Pawlak K, Kołodziejczak M. The role of agriculture in ensuring food security in developing countries: Considerations in the context of the problem of sustainable food production. Sustainability. (2020) 12:1–20. doi: 10.3390/su12135488
49. Basak N, Rai AK, Sundha P, Meena RL, Bedwal S, Yadav RK, et al. Assessing soil quality for rehabilitation of salt-affected agroecosystem: A comprehensive review. Front Environ Sci. (2022) 10:935785. doi: 10.3389/fenvs.2022.935785
50. Shaygan M, Baumgartl T. Reclamation of salt-affected land: A review. Soil Syst. (2022) 6:1–17. doi: 10.3390/soilsystems6030061
51. Qadir M, Quillérou E, Nangia V, Murtaza G, Singh M, Thomas RJ, et al. Economics of salt-induced land degradation and restoration. HAL Open Sci. (2014) 1:1–27. doi: 10.1111/1477-8947.12054
52. De Pauw E. Soils, Physiography and Agro-Ecological Zones of Tanzania, in: Crop Monitoring and Early Warning Systems Project, FAO (1984). Dar es Salaam, Tanzania: GCPS/URT/047/NET, Ministry of Agriculture. Available online at: https://www.kilimo.go.tz/maps/Tanzania_Agro-Ecological_Zones.pdf (Accessed 05/08/2023).
53. Beretta AN, Silbermann AV, Paladino L, Torres D, Bassahun D, Musselli R, et al. Análisis de textura del suelo con hidrómetro: Modificaciones al método de Bouyoucus. Cienc Investig Agrar. (2014) 41:263–71. doi: 10.4067/S0718-16202014000200013
54. Black GR, Hartge KH. Bulk density. In: Klute A, editor. Methods of soil analysis, Part 1 (2nd Ed). Agronomy Monograph No. 9. American Society of Agronomy and Soil Science Society of America, Madison, WI (1986). p. 364–76.
55. Moberg J. Soil and Plant Analysis Manual. Copenhagen, Denmark: The Royal Veterinary and Agricultural University, Chemistry Department (2002).
56. Mclean EO. Soil pH and Lime Requirement. In: Page AL, editor. Methods of Soil Analysis Part 2, 2nd ed. American Society of Agronomy, Madison, Wisconsin USA (1982). p. 159–64.
57. Nelson DW, Sommers LE. Chemical methods soil science society of America book series. Bigham JM, editor. Madison WI, USA: Soil Science Society of America (1996) p. 961–1010. Available at: https://www.waterboards.ca.gov/waterrights/water_issues/programs/bay_delta/california_waterfix/exhibits/docs/Islands/II_41.pdf. Methods of Soil Analysis. Part 3. Chemical Methods, SSSA.
58. Bremner JM, Mulvaney CS. Total Nitrogen. In: In: Methods of Soil Analysis Part 2, Agronomy, Monograph No9. Page AL, Miller RH, Keeney DR, editors. Madison Wisconsin: American Society of Agronomy (1982) p. 149–57.
59. Bray RH, Kurtz LT. Determination of total, organic and available forms of phosphorus in soils. Soil Sci. (1945) 58:39–45. doi: 10.1097/00010694-194501000-00006
60. Olsen SR. Phosphorus. In: Page AL, Miller RH, Keeney DR, editors. Methods of Soil Analysis, part 2. American Society of Agronomy, Madison, Wisconsin (1982). p. 403–30.
61. Thomas GW. Exchangeable cations. In: Page AL, Miller RH, Keeney DR, editors. Methods of Soil Analysis. Part 2, Agronomy Monograph No.9. American Society of Agronomy, Madison Wisconsin (1982). p. 149–57.
62. Lindsay WLNWA. Development of DTPA soil test for zinc, iron, manganese, and copper. Soil Sci Soc America J. (1978) 42:421–8. doi: 10.2136/sssaj1978.03615995004200030009x
63. NSS. National Soil Service, “Laboratory procedures for routine analysis.” 3rd edition. Mlingano Tanga, Tanzania: Agricultural Research Institute (1990).
64. Xing RYZZYWS. Rapid determination of total sulfur content in green liquors by turbidimetric method. Bioresources. (2019) 15:721–8. doi: 10.15376/biores
65. Richards LA. Diagnosis and improvement of saline and alkaline soils. Agriculture handbook no. 60. USDA, Washington. Soil Sci Soc America J. (1954) 18:348. doi: 10.2136/sssaj1954.03615995001800030032x
66. Choudhary OP. Soil Salinity and Sodicity (2018). Available online at: https://www.researchgate.net/publication/327824188 (Accessed 14/09/2023).
68. Gad AA. Land capability classification of some western desert Oases, Egypt, using remote sensing and GIS. Egyptian J Remote Sens Space Sci. (2015) 18:9–18. doi: 10.1016/j.ejrs.2015.06.002
69. Yost JL, Hartemink AE. How deep is the soil studied – an analysis of four soil science journals. Plant Soil. (2020) 1:5–18. doi: 10.1007/s11104-020-04550-z
70. Sharma PK, Kumar S. Soil Temperature and Plant Growth. In: Soil Physical Environment and Plant Growth. Switzerland: Springer Nature (2023). p. 175–204. doi: 10.1007/978-3-031-28057-3_7
71. Amsili JP, van Es HM, Schindelbeck RR. Cropping system and soil texture shape soil health outcomes and scoring functions. Soil Secur. (2021) 4:1–11. doi: 10.1016/j.soisec.2021.100012
72. AbdelRahman MAE, Metwaly MM, Afifi AA, D’Antonio P, Scopa A. Assessment of soil fertility status under soil degradation rate using geomatics in west Nile Delta. Land. (2022) 11:1–23. doi: 10.3390/land11081256
73. Wang F, Yang S, Wei Y, Shi Q, Ding J. Characterizing soil salinity at multiple depth using electromagnetic induction and remote sensing data with random forests: A case study in Tarim River Basin of southern Xinjiang, China. Sci Total Environ. (2021) 1:1–17. doi: 10.1016/j.scitotenv.2020.142030
74. Gelaye KK, Zehetner F, Loiskandl W, Klik A. Effects of soil texture and groundwater level on leaching of salt from saline fields in Kesem irrigation scheme, Ethiopia. Soil Water Res. (2019) 14:221–8. doi: 10.17221/137/2018-SWR
75. Landon JR. Booker Tropical Soil Manual. In: A handbook for soil survey and agricultural land evaluation in the tropics and subtropics. London: Longman Scientific and Technical Publishers (1991). p. 1–474.
76. Bolan N, Sarmah AK, Bordoloi S, Bolan S, Padhye LP, Van Zwieten L, et al. Soil acidification and the liming potential of biochar. Environ pollut. (2023) 317:120632. doi: 10.1016/j.envpol.2022.120632
77. Kowalska JB, Zaleski T, Józefowska A, Mazurek R. Soil formation on calcium carbonate-rich parent material in the outer Carpathian Mountains – A case study. Catena. (2019) 1:436–51. doi: 10.1016/j.catena.2018.11.025
78. Wala M, Kolodziejek J, Wilk T. Acidity and availability of aluminum, iron and manganese as factors affecting germination in European acidic dry and alkaline xerothermic grasslands. PeerJ. (2022) 10:1–29. doi: 10.7717/peerj.13255
79. Barrow NJ, Hartemink AE. The effects of pH on nutrient availability depend on both soils and plants. Plant Soil. (2023) 487:21–37. doi: 10.1007/s11104-023-05960-5
80. Li J, Jia Y, Dong R, Huang R, Liu P, Li X, et al. Advances in the mechanisms of plant tolerance to manganese toxicity. Int J Mol Sci. (2019) 20:1–15. doi: 10.3390/ijms20205096
81. Muhammad N, Zvobgo G, Zhang G. A review: The beneficial effects and possible mechanisms of aluminum on plant growth in acidic soil. J Integr Agricult Chin Acad Agric Sci. (2019) 18:1518–28. doi: 10.1016/S2095-3119(18)61991-4
82. Westerman RL. Soil Testing and Plant Analysis. Madison, Wisconsin, USA: Soil Science Society of America, Inc (1990) p. 1–757. doi: 10.2136/sssabookser3.3ed.frontmatter
83. Havlin JL, Samuel LT, Werner LN. Soil Fertility and Fertilizers. An Introduction to Nutrient Management. Pearson India: Education Services Pvt (2021) p. 1–507.
84. Farzadfar S, Knight JD, Congreves KA. Soil organic nitrogen: an overlooked but potentially significant contribution to crop nutrition. Plant Soil. (2021) 1(1):7–23. doi: 10.1007/s11104-021-04860-w
85. Abrar MM, Xu H, Aziz T, Sun N, Mustafa A, Aslam MW, et al. Carbon, nitrogen, and phosphorus stoichiometry mediate sensitivity of carbon stabilization mechanisms along with surface layers of a Mollisol after long-term fertilization in Northeast China. J Soils Sediments. (2020) 21:705–23. doi: 10.1007/s11368-020-02825-7
86. Abrar MM, Xu M, Shah SAA, Aslam MW, Aziz T, Mustafa A, et al. Variations in the profile distribution and protection mechanisms of organic carbon under long-term fertilization in a Chinese Mollisol. Sci Total Environ. (2020) 723:138181. doi: 10.1016/j.scitotenv.2020.138181
87. Johan PD, Ahmed OH, Omar L, Hasbullah NA. Phosphorus transformation in soils following co-application of charcoal and wood ash. Agronomy. (2021) 11:1–25. doi: 10.3390/agronomy11102010
88. Penn CJ, Camberato JJ. A critical review on soil chemical processes that control how soil ph affects phosphorus availability to plants. Agriculture. (2019) 9:1–18. doi: 10.3390/agriculture9060120
89. Barrow NJ, Hartemink AE. The effects of pH on nutrient availability depend on both soils and plants. Plant Soil Springer. (2023) . 1:21–37. doi: 10.1007/s11104-023-05960-5
90. Chen Y, Guo N, He W, Abbasi NA, Ren Y, Qu X, et al. Transformation of soil accumulated phosphorus and its driving factors across Chinese cropping systems. Agronomy. (2023) 13:1–26. doi: 10.3390/agronomy13040949
91. Liu J, Han C, Zhao Y, Yang J, Cade-Menun BJ, Hu Y, et al. The chemical nature of soil phosphorus in response to long-term fertilization practices: implications for sustainable phosphorus management. J Clean Prod. (2020) 1(1):1–8. doi: 10.1016/j.jclepro.2020.123093
92. Thor K. Calcium—nutrient and messenger. Front Plant Sci Front. (2019) 10:440. doi: 10.3389/fpls.2019.00440
93. Weng X, Li H, Ren C, Zhou Y, Zhu W, Zhang S, et al. Calcium regulates growth and nutrient absorption in poplar seedlings. Front Plant Sci. (2022) 10:887098. doi: 10.3389/fpls.2022.887098
94. Edward AC. Interpreting Soil Test Results: what do all the Numbers Mean? 3rd edition. By PamHazelton & BrianMurphy (eds). CSIRO Publishing, 2016, 200 pp. Soil Use Manag. (2018) 34(1):164–5. doi: 10.1111/sum.12402
95. Yahya EK, Jia Z, Luo W, YuanChun H, Ame MA. Enhancing salt leaching efficiency of saline-sodic coastal soil by rice straw and gypsum amendments in Jiangsu coastal area. Ain Shams Eng J. (2022) 13:1–11. doi: 10.1016/j.asej.2022.101721
96. Abate S, Belayneh M, Ahmed F. Reclamation and amelioration of saline-sodic soil using gypsum and halophytic grasses: Case of Golina-Addisalem irrigation scheme, Raya Kobo Valley, Ethiopia. Cogent Food Agric. (2021) 7:1–19. doi: 10.1080/23311932.2020.1859847
97. Bello SK, Alayafi AH, Al-Solaimani SG, Abo-Elyousr KAM. Mitigating soil salinity stress with gypsum and bio-organic amendments: a review. Agronomy (2021) 11(9):1–18. doi: 10.3390/agronomy11091735
98. Yuan Y, Liu Q, Zheng H, Li M, Liu Y, Wang X, et al. Biochar as a sustainable tool for improving the health of salt-affected soils. Soil Environ Health. (2023) 1:1–16. doi: 10.1016/j.seh.2023.100033
99. Ding Z, Zhou Z, Lin X, Zhao F, Wang B, Lin F, et al. Biochar impacts on NH3-volatilization kinetics and growth of sweet basil (Ocimum basilicum L.) under saline conditions. Ind Crops Prod. (2020) 1:1–9. doi: 10.1016/j.indcrop.2020.112903
100. Day AD, Ludeke KL. Exchangeable Bases. In: Plant Nutrients in Desert Environments Adaptations of Desert Organisms. Springer, Berlin, Heidelberg (1993). p. 27–9. doi: 10.1007/978-3-642-77652-6_7
101. Dotaniya ML, Meena MD, Choudhary RL, Meena MK, Singh H, Dotaniya CK, et al. Management of plant nutrient dynamics under alkaline soils through graded application of pressmud and gypsum. PloS One. (2023) 18:1–11. doi: 10.1371/journal.pone.0288784
102. Alharbi K, Al-Osaimi AA, Alghamdi BA. Sodium chloride (NaCl)-induced physiological alteration and oxidative stress generation in pisum sativum (L.): A toxicity assessment. ACS Omega. (2022) 7:20819–32. doi: 10.1021/acsomega.2c01427
103. El hasini S, Iben. Halima O, El. Azzouzi M, Douaik A, Azim K, Zouahri A. Organic and inorganic remediation of soils affected by salinity in the Sebkha of Sed El Mesjoune – Marrakech (Morocco). Soil Tillage Res. (2019) 1:153–60. doi: 10.1016/j.still.2019.06.003
104. Kargas G, Londra P, Sotirakoglou K. The effect of soil texture on the conversion factor of 1:5 soil/water extract electrical conductivity (EC1:5) to soil saturated paste extract electrical conductivity (ECe). Water. (2022) 14:1–10. doi: 10.3390/w14040642
105. Van Tan L, Thanh T. The effects of salinity on changes in characteristics of soils collected in a saline region of the Mekong Delta, Vietnam. Open Chem. (2021) 19:471–80. doi: 10.1515/chem-2021-0037
106. Liu C, Mao B, Yuan D, Chu C, Duan M. Salt tolerance in rice: Physiological responses and molecular mechanisms. Crop J Instit Crop Sci. (2022) 10:13–25. doi: 10.1016/j.cj.2021.02.010
107. Zhang R, Hussain S, Wang Y, Liu Y, Li Q, Chen Y, et al. Comprehensive evaluation of salt tolerance in rice (Oryza sativa L.) germplasm at the germination stage. Agronomy. (2021) 11:1–14. doi: 10.1016/j.cj.2021.02.010
108. Dehnavi AR, Zahedi M, Ludwiczak A, Perez SC, Piernik A. Effect of salinity on seed germination and seedling development of sorghum (Sorghum bicolor (L.) Moench) genotypes. Agronomy. (2020) 10:1–15. doi: 10.3390/agronomy10060859
109. Farooq M, Gogoi N, Hussain M, Barthakur S, Paul S, Bharadwaj N, et al. Plant Physiology and Biochemistry Effects, tolerance mechanisms and management of salt stress in grain legumes. Plant Physiol Biochem. (2017) 1:199–217. doi: 10.1016/j.plaphy.2017.06.020
Keywords: food security, salt types, soil health assessment, soil properties, sustainable agriculture
Citation: Omar MM, Massawe BHJ, Shitindi MJ, Pedersen O, Meliyo JL and Fue KG (2024) Assessment of salt-affected soil in selected rice irrigation schemes in Tanzania: understanding salt types for optimizing management approaches. Front. Soil Sci. 4:1372838. doi: 10.3389/fsoil.2024.1372838
Received: 18 January 2024; Accepted: 09 April 2024;
Published: 23 April 2024.
Edited by:
Gilles Colinet, University of Liège, BelgiumReviewed by:
Heba Elbasiouny, Al-Azhar University, EgyptMuhammad Mohsin Abrar, Zhongkai University of Agriculture and Engineering, China
Copyright © 2024 Omar, Massawe, Shitindi, Pedersen, Meliyo and Fue. This is an open-access article distributed under the terms of the Creative Commons Attribution License (CC BY). The use, distribution or reproduction in other forums is permitted, provided the original author(s) and the copyright owner(s) are credited and that the original publication in this journal is cited, in accordance with accepted academic practice. No use, distribution or reproduction is permitted which does not comply with these terms.
*Correspondence: Moh’d M. Omar, bW1hbmdhb21hcnlAZ21haWwuY29t