 Prafulla Kumar Sahoo
 Harish Chandra Barman
 Hemant Kumar
 Umakant Chaudhari
- Department of Environmental Science and Technology, Central University of Punjab, Bathinda, India
Uranium (U) and other potentially toxic element (PTE) in cropland have become a major concern for food safety in the Malwa region of Punjab, India. However, limited information is available on the baseline status of these contaminants in vegetable-cultivated soil (CS) and their link to crop rotation patterns. To address this, a total of 149 CS samples (0–10 cm depth) were collected from different sites in the Bathinda and Mansa districts of Punjab during the winter season of 2023–2024. In other seasons, these sites are cultivated with either vegetables or other crops, such as rice, wheat, cotton, and maize, as part of a crop rotation system. Based on the sequence of previous and current crops in each site, the cultivated soils were categorized into different groups, with vegetable–vegetable (VG–VG) and rice–vegetable (RC–VG) rotations being the most dominant. Additionally, 12 undisturbed/uncultivated soil (US) samples were collected for comparative analysis and to estimate the region’s background PTE levels. The results showed that the soils were slightly alkaline (pH: 6.56 to 9.29; average, 7.9) and not saline (EC: 173 to 3,230 µS cm−1) in nature. The contents of U and PTEs were significantly higher (p < 0.05) in CS samples compared to US samples; however, when compared with the regional studies and the reference values of world and Indian soils, all concentrations remained within the limits, indicating no significant enrichment. The content of PTEs did not vary significantly between the two crop rotation patterns, although slightly higher levels of PTEs were noted for RC–VG group. The pollution indices (calculated using site-specific background values), such as contamination factor (CF) and enrichment factor (EF), revealed low to moderate level of contamination in CS samples, except Pb, which showed moderate to very high levels of pollution. Furthermore, the pollution load index (PLI; 0.7 to 2.8) and potential ecological risk (RI; 41 to 250) suggested a low to moderate risk category for PTEs with Cd and Pb being the major contributors. Fertilizer analysis revealed that this contamination may be attributed to the overuse of chemical fertilizers, especially phosphate-based fertilizers, which enriched with U, Cd, Pb, and other PTEs. Although U-enriched groundwater, in conjunction with phosphate fertilizers, could contribute to higher U content in cultivated soils, its impact on U accumulation in VG-cultivated lands appeared to be minimal. Principal component analysis (PCA) and the significant correlation (p < 0.01) between Fe-Mn and Zn-Cr-Cu-Ni-As-Cd-U suggest that secondary Fe/Mn oxyhydroxides play a major role in adsorbing these elements in soils. These findings provide baseline information on the PTE levels in vegetable-cultivated soils in the region, which can support the development of strategies for sustainable land management and improve crop quality in this region.
1 Introduction
Agricultural soil contamination with potentially toxic elements (PTEs) has become a critical environmental issue and a major public health concerns in many parts of the world, as these contaminants can transfer from soil to humans through the food chain (1–5). The most notable PTEs include Fe, Mn, As, Cd, Cr, Cu, Ni, Cr, Mo, Zn, Hg, and U. Certain PTEs, such as Cu, Zn, Fe, Mn, Mo, and Ni, are considered as essential mineral nutrients for plant growth and productivity at relatively low concentrations; however, when accumulated at higher levels, these elements can adversely affect plant growth, development, and reproduction (6). In contrast, elements such as Cd, Pb, As, and U are considered as non-essential and, due to their long-term, persistent, high toxicity, and non-biodegradable nature in the environment, these elements at higher levels in agricultural soils can adversely affect crop health and productivity and subsequently cause severe toxicological effects on both animal and human health (7, 8).
Heavy metals are naturally present in agricultural soils depending on the type of parent rocks, soil types, and climate conditions; however, anthropogenic activities, especially intensive agricultural practice involving the indiscriminate use of inorganic fertilizers, pesticides, and insecticides, are the main sources of PTEs in farming soils (3, 4, 9–11). The extent of accumulation can vary with land use type and the pattern of farming practices, as different cropping systems exert different impacts on heavy metal accumulation in agricultural soils (2, 12–15). In conventical farming, the excessive application of chemical fertilizers, including nitrogen (N), phosphorus (P), potassium (K), and compound/mixed fertilizers, along with pesticides and herbicides, which play an important role in higher crop yields and food production, has significantly degrade agricultural soil quality (12, 16, 17). Among these inputs, phosphate fertilizers are a major source of diverse toxic elements such as Cd, Pb, Co, Ni, Cr, Zn, and U to agricultural soils (18). In addition, the use of sewage sludge, manure, and industrial by-products and the use of wastewater or contaminated groundwater for irrigation also introduce heavy metals into agricultural systems (11, 19–21). Irrigation with contaminated groundwater is a major concern in Southeast Asian countries like India and Bangladesh, where the shallow aquifers are often contaminated with heavy metals like As, U, Cr, Pb, and Cd (22–25). Repeated use of such amendments plays a key role in the accumulation of these metals in cultivated lands (23, 26–28), which directly or indirectly affects crop safety and human health (29, 30). This is particularly critical in developing countries like India, where agricultural activities are subject to less stringent rules and regulations. In order to provide a comprehensive view of the soil contamination and its environmental risk, calculation of pollution indices such as contamination factor (CF), pollution load index (PLI), and potential ecological risk index (RI) is required (3, 31). This assessment should be integrated with multivariate statistics to identify the major factors controlling soil pollution. In addition, information on contamination sources is required for prioritizing target contaminants and implementing the sustainable management strategies in agriculturally dominated regions.
Punjab is one of the major agricultural hubs in the northwest part of India, where approximately 85% of the geographical area of this state is associated with agriculture, with a crop intensity of 184% (32). This has earned the region the title of “the Green Basket of India”. However, intensive agriculture, coupled with unregulated use of chemical fertilizers and pesticides throughout the year, has resulted in the degradation of soil and groundwater quality of the region (33–35). This is more pronounced in the semi-arid regions of the Malwa belt, where uranium contamination in groundwater is a major concern (25). In addition, elevated concentrations of As, Cd, Pb, and other contaminants have also been reported in Malwa’s soils (36–39). Karanveer et al. (37) studied the distribution and health risk assessment of PTEs in the agricultural land and barren areas soil from the semi-arid region of southwest Punjab, India, while Choudhari et al. (38) investigated metal accumulation in agricultural soils, along with environmental risk and geochemical signature patterns in the three districts (Moga, Muktsar, and Faridkot) of the Malwa region. Other studies have also addressed the contents of PTEs and their potential risks in agricultural soils of this area (40, 41). However, a comprehensive study on PTE accumulation and associated ecological risk on vegetable-cultivated soil in the Malwa region is lacking. The Bathinda and Mansa districts in the Malwa region warrant focused investigations due to their intensive agriculture activities, excessive application of agrochemicals, rapid urbanization, industrial growth, and elevated levels of U and other heavy metals in groundwater, which may contribute to soil pollution and subsequent accumulation in crops. Moreover, it remains unclear to what extent the crop rotation pattern affects metal accumulation in vegetable-cultivated soils. Understanding this aspect helps to explore safer or more sustainable crop cultivation practices that can reduce pollution risk and protect soil health. Soil properties such as pH, EC, organic matter, clay content, and Fe/Al-oxydroxides also affect the fate, mobility, and accumulation of metals in agricultural soils (Cao et al., 2022). Therefore, these factors should be evaluated to better understand their role in metal accumulation. Additionally, determining local background/reference levels of PTEs is crucial to accurately estimate anthropogenic contamination in the region.
In view of the aforementioned, the present study analyzed the pseudo-total concentration of 11 elements, along with other physico-chemical parameters, in 149 vegetable-cultivated soils and 12 undisturbed/uncultivated soils from various sites in Bathinda and Mansa districts of Punjab, India. The main objectives were to assess the baseline levels of PTEs in vegetable-cultivated soils, evaluate the associated pollution risk, and examine the role of crop rotation practices and other factors in metal accumulation. Furthermore, an attempt has been made to characterize the locally available chemical fertilizers, manures, and irrigation water sources to identify the possible contamination pathways.
2 Materials and methods
2.1 Study area description, land use pattern, climate, and basic geology
The study area (Figure 1a) is located in the Bathinda and Mansa districts of the Malwa region, situated in southwest Punjab, India. The land use/land cover (LULC) map depicts that most of the area is dominated with cropland, followed by built-up areas and bare land (Figure 1b). Considering the alluvial soil and the easy availability of both canal water and groundwater for irrigation, the region supports the cultivation of diverse crops including wheat, rice, cotton, maize, legumes, and vegetables, following different crop rotation patterns. Vegetable crops are grown in both summer and winter seasons, in both commercial farms and home gardens. In conventional farming, chemical fertilizers such as diammonium phosphate (DAP), single super phosphate (SSP), urea, and potash are frequently applied in addition to livestock manures.
The region experiences a hot, dry, and semi-arid climate with scorching summers (ranging from 41 to 49°C) and cold winters (1 to 4°C). The average annual rainfall is about 408 mm (42). Geologically, this region is part of the Indo-Gangetic sub-basin and consists of thick sequences of Quaternary alluvial deposits, dating from the Mid-Pleistocene to recent times (Figure 1c) (42). These deposits are primarily composed of medium to fine gray micaceous sand, silt, clay, oxidized silt–clay with kankar, and micaceous sand, with patches of yellowish-brown loose sand with or without kankar (42). The soil of the study area has a predominantly sandy texture, consisting of loose, sandy, and calcareous alluvium (42). Poor nutrient contents and presence of high amounts of calcium carbonate are the main problems of the soil of this region. The aquifers in this area are mainly semi-confined and unconfined types, and the latter is heavily utilized for agriculture due to insufficient surface water resources.
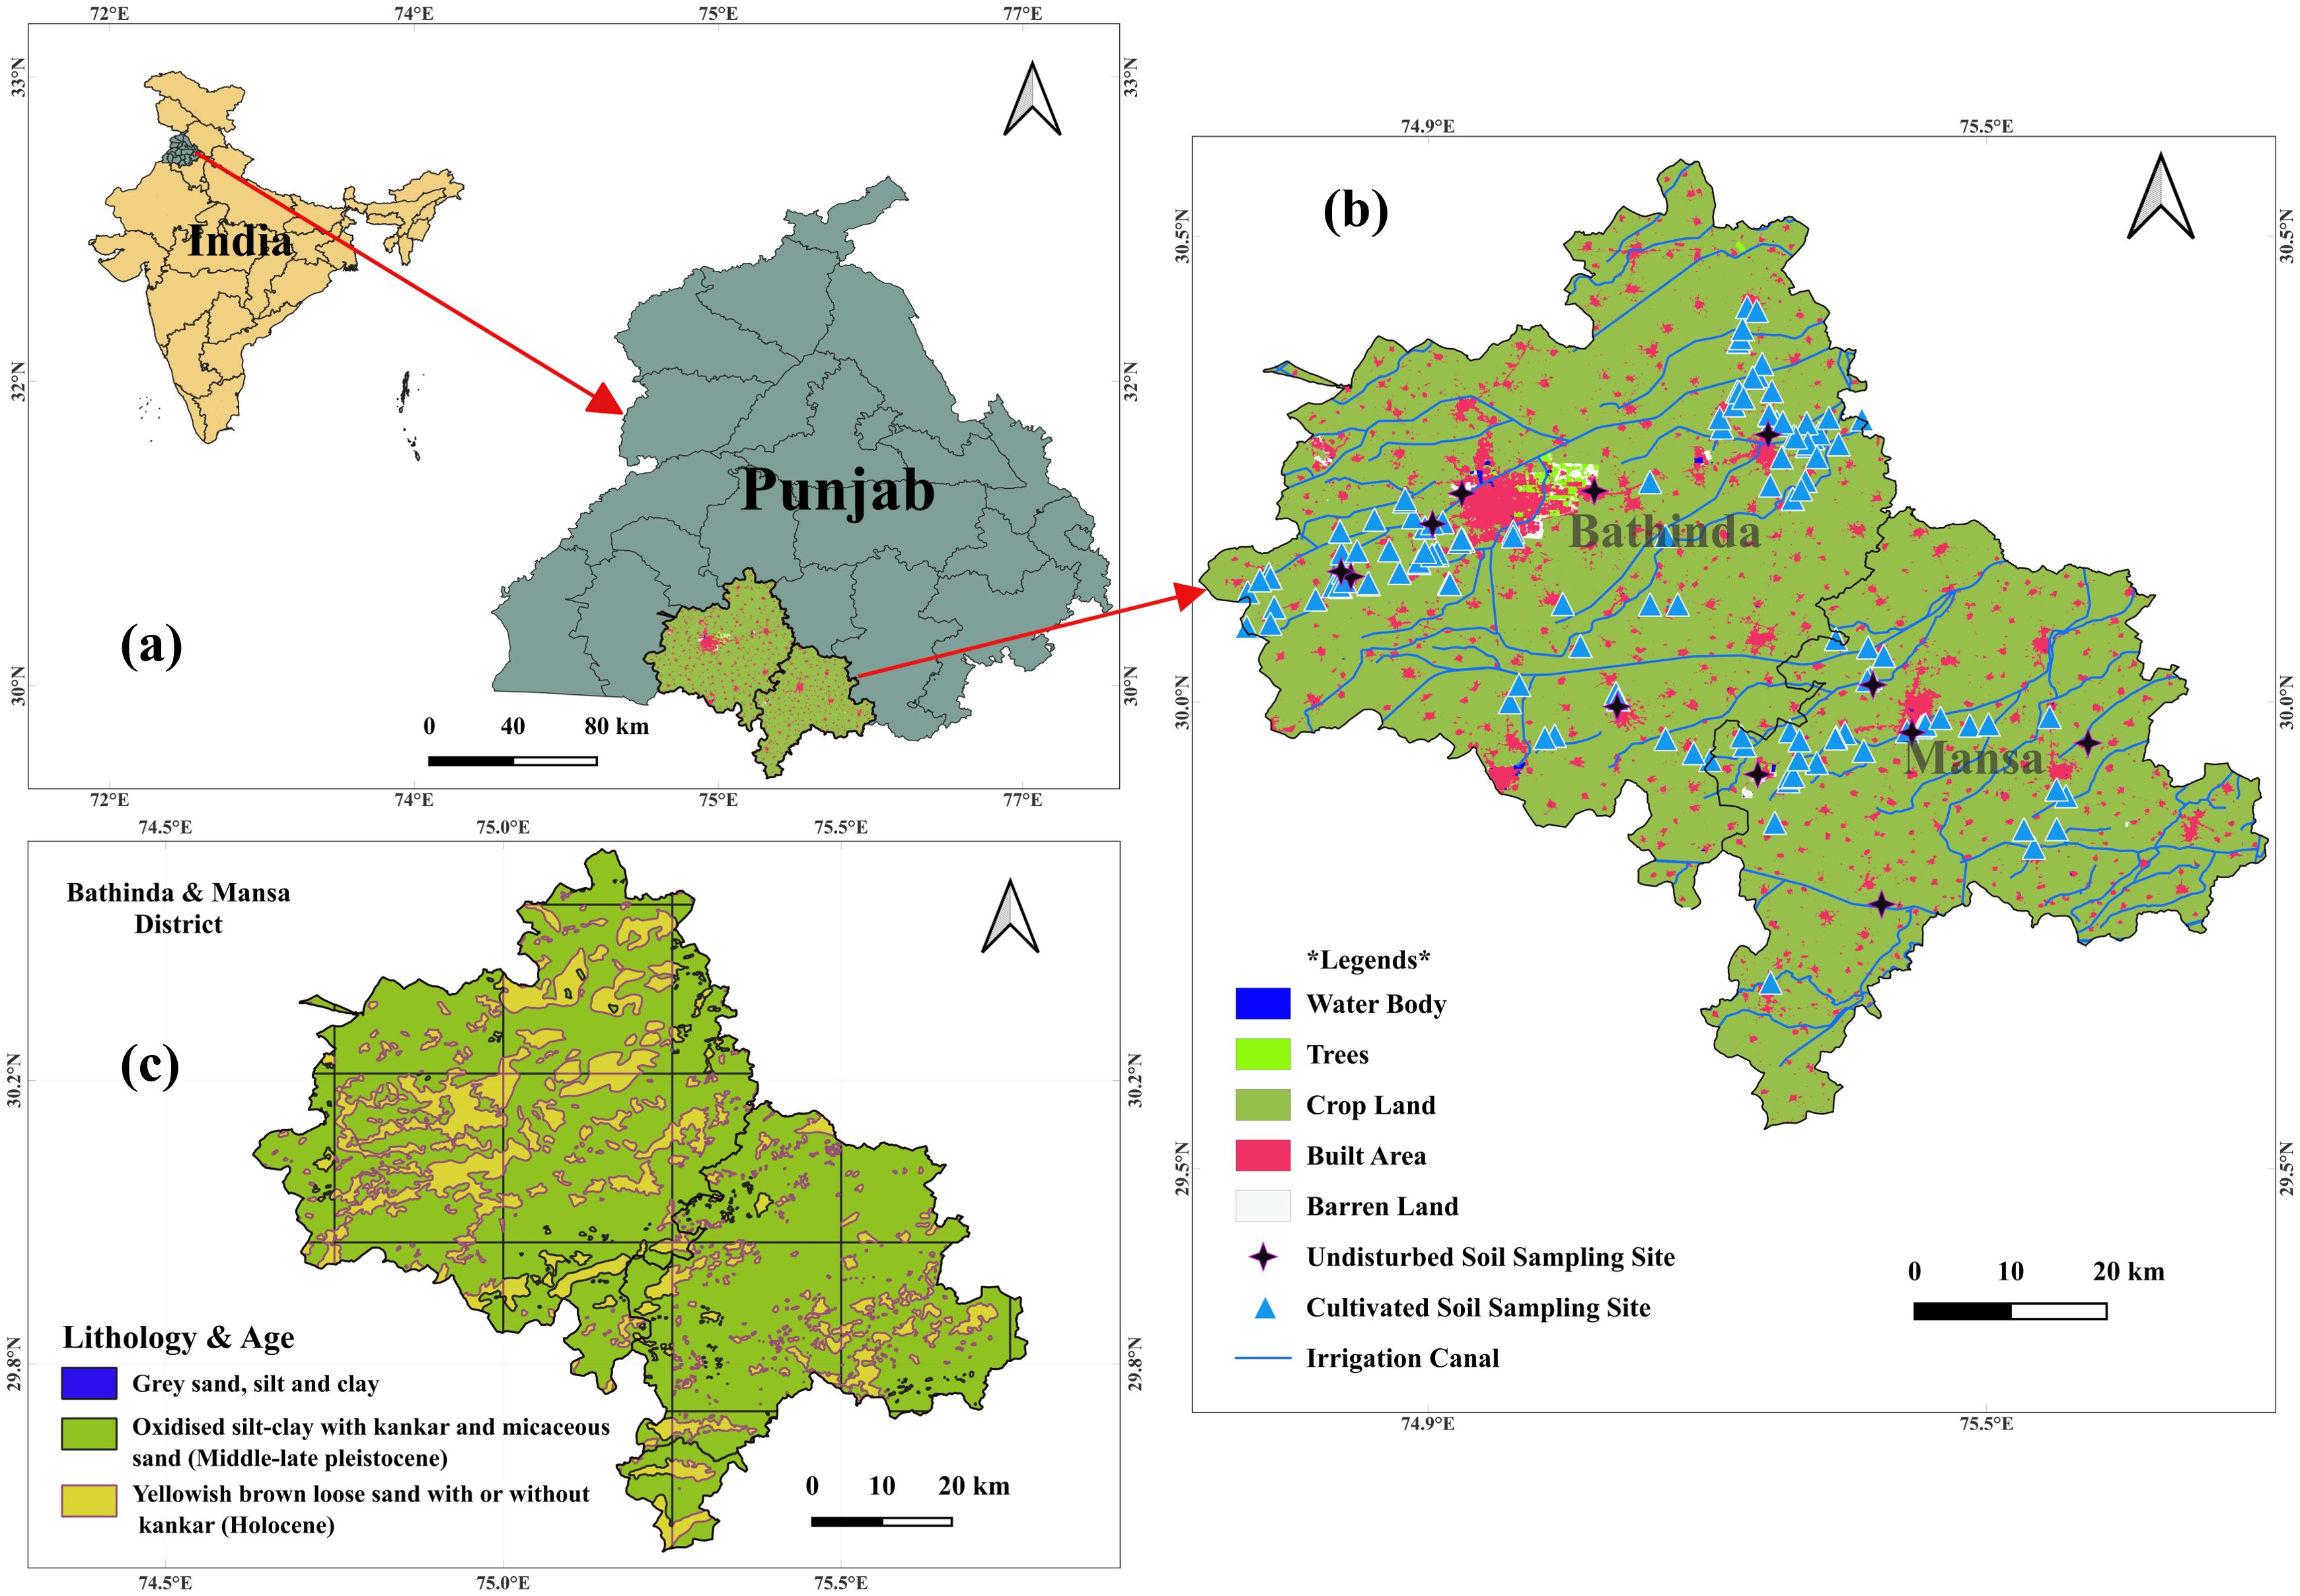
Figure 1. Map showing the (a) geographical location of the study area (Bathinda and Mansa districts) in Punjab, India, (b) land use/land cover pattern with sampling points of vegetable-cultivated and undistrubed/uncultivated soils, and (c) the basic lithology of the area.
2.2 Soil sampling and chemical analysis
A total of 149 vegetable (VG)-cultivated soil samples (0−10 cm depth) were collected during the winter season of the year 2023–2024 from the Bathinda and Mansa districts of Punjab (Figure 1b). The cultivated sampling sites were selected randomly across the two districts, based on the site accessibility and the type of cultivation (commercial farms or home gardens). Given the region’s diverse crop rotation patterns, fields used for winter vegetable cultivation are also used for rice, wheat, maize, cotton, or vegetable crops during other seasons. Based on the sequence of crop cultivation at each sampling point as part of the crop rotation practices, the VG-cultivated soils were grouped into four categories such as rice–vegetable (RC–VG), vegetable–vegetable (VG–VG), cotton–vegetable (CT–VG), and maize–vegetable (MZ–VG), in which the first term refers to the previous (summer) crop and the second to the current (winter) vegetable crop. Among these, RC–VG and VG–VG were the most dominant and are therefore discussed in details. Additionally, 12 soil samples were collected from uncultivated/undisturbed lands around the study area, but away from the agricultural field or any waste dumping zone or point source to represent control conditions. For these control samples, the top 5 cm of soil, which was presumed to be impacted by atmospheric deposition, was removed, and the samples were collected from the 5- to 15-cm depth using a stainless-steel tool. From each sampling location, approximately 1 kg of soil was collected and brought to the lab in double-zip plastic bags. All samples were air-dried at ambient temperature, sieved through a 2-mm sieve, and put in new polythene zip lock bags for further analysis. Chemical fertilizers and cow dung samples were also collected from the near localities in the Bathinda district. Information on crop production history, rotation frequency, irrigation water types, and type of fertilizer use for vegetable cultivation at each site was surveyed during sampling.
Soil pH was determined in water–soil suspension (soil/solution ratio = 1:2.5), while electrical conductivity (EC) was measured in 1:5 soil–water suspension following the IS method. Total organic carbon (TOC) content was determined using a TOC analyzer (TOC-L, Shimadzu). For analysis of the pseudo-total concentrations of PTEs in soils, 0.5 g of each sample was digested using the reverse aqua regia method (1:3; HCl: HNO3; USEPA, 3052) in a microwave digester (Milestone Ethos Easy). Fertilizer metal content was determined by placing 1 g of sample in 10% HNO3 in a 100-mL Teflon beaker, followed by heating at 70–90°C. The digested samples were filtered and diluted to 50 mL with deionized water. The concentration of U was measured using ICP-MS, while other elements were analyzed with MP-AES (Agilent 4210, Agilent Technologies, Australia). Analytical grade acids were used for sample digestion. After digestion, samples were diluted and filtered through PTFE syringe filters (0.45 μm pore size) before being injected into the instrument. All samples were run in triplicate, and the average value was considered for data interpretation. To ensure the reliability of the analytical data, ICP multi-element standard (Merck) and certified reference materials (CRMs: GBM303-4, MRGeo08) were used. A Merck standard was run after every five samples. Calibration curves of all studied elements exhibited good linearity with coefficients of determination values (R2) ranging from 0.9991 to 0.9998, indicating excellent method reliability. Recovery percentages of elements (varied between 86% and 115%) showed a high agreement with the reference standards, and the relative standard deviation (RSD) was within ±10% for most elements.
2.3 Statistical analysis
The descriptive statistics, including minimum, maximum, mean, median, standard deviation, percentiles skewness and kurtosis of the variables, were calculated using XLSTAT. The normality of the data was checked using the Kolmogorov–Smirnov (K–S) test. Boxplots were generated to better visualize the distribution of elements between sample types. Spearman’s rank correlation coefficient was applied to evaluate the nature of chemical associations between variables. In principal component analysis (PCA), the soil dataset was reduced to a smaller number of principal components to facilitate interpretation of the multidimensional structure by demonstrating the correlations between original variables. To test the significant differences of elements between two groups, a non-parametric Mann–Whitney U test was applied. This test compared the median values of PTEs between two independent groups, with a p-value less than 0.05 indicating statistical significance. For the estimation of the background levels of heavy metals in the study area, uncultivated soils were used. Although several methods are available for determining background threshold values, such as mMAD(Median + 2 * MAD), TIF (Tukey's Upper Fence), and percentiles (43), the limited sample size in this study prevented the application. Therefore, in this study, “75th percentile” was adopted to determine the local background level (LGB) of PTEs, as it gives more restrictive or conservative background values and it is commonly used for the estimation of quality reference (QRV) under Brazilian regulations (44).
2.4 Pollution indices
The level of soil contamnation was evaluated using various single- and multi-element indices, such as enrichment factor (EF), contamination factor (CF), pollution load index (PLI), and potential ecological risk index (RI). These indices are based on a comparative assessment of element concentrations at sampling sites relative to a reference/background value. The calculation of different indices is given below.
2.4.1 Enrichment factor
EF is a widely used pollution metric used for assessing the degree to which a specific metal is enriched in soil or sediment samples. It is calculated by comparing the concentration of metal interest and a reference element in the sample to their respective background values. EF also helps to distinguish between naturally occurring element and its anthropogenic influences. It is computed using the following relation (Equation 1):
where is the ratio of the concentrations of the target element (x) to that of Al in the soil samples, and is the ratio of the concentration of the target element (x) to that of Al in a reference background. In this study, site-specific local geochemical background (LGB) values of PTEs were derived from uncultivated soils of the region. The estimated LGB (based on the 75th percentile) values are as follows: Fe (9,633 mg/kg), Al (9,173 mg/kg), Mn (194 mg/kg), Zn (26.18 mg/kg), Cr (16.86 mg/kg), Ni (5.34 mg/kg), Cu (4.3 mg/kg), U (1.18 mg/kg), As (1.16 mg/kg), and Cd (0.2 mg/kg). Aluminum (Al) was selected as the reference element in this study since it is geochemically stable, relatively abundant, and less affected by human activities. The classification of EF, as per Sutherland (45), is as follows: (i) no enrichment (possibly depletion) (EF < 1); (ii) minor enrichment (EF < 2); (iii) moderate enrichment (2 ≥ EF < 5); (iv) significant enrichment (5 ≥ EF < 20); (v) very high enrichment (20 ≥ EF < 40); and (vi) extremely high enrichment (EF < 40).
2.4.2 Contamination factor
CF evaluates the extent of anthropogenic contamination in soil by calculating the ratio between the concentration of element in soil and the background values. It was determined using Equation 2 (46) as:
where represents the measured concentration of element x in the cultivated soil samples, while is the background concentration (LGB; same as EF) of the element x. The level of CF values is classified into four categories (46): CF < 1 (low contamination); 1 ≤ CF < 3 (moderate contamination), 3 ≤ CF < 6 (considerable contamination), and CF > 6 (very high contamination).
2.4.3 Pollution load index
PLI is used to evaluate the overall pollution status resulting from the combined presence of multiple contaminants at a given sampling location. It is calculated as the nth root of the product of all the n CFs for each metal, as given in Equation 3 (47).
where n is the number of analyzed metals and CF denotes the contamination factor of each metal. PLI is interpreted as follows: unpolluted (PLI < 1), moderate pollution (2 < PLI > 3), heavy pollution (2 < PLI > 3), and (PLI > 3) extreme pollution (47).
2.4.4 Potential ecological risk index
The ecological risk factor (Ei), proposed by the Swedish scientist Hakanson (46), evaluates environmental threats taking into account the ecological, toxicological, and environmental effects of heavy metal pollutants, unlike other contamination indices like CF and EF, which only provide contamination status relative to background values. It is calculated using Equation 4:
where Ei is the ecological risk of the element, CF is the contamination factor of the element, and Tr is the toxic-response factor, which has been set based on the toxicity of each element. In this study, the Tr values used were as follows: Zn = 1, Cr = 2, Cu = Ni = Pb = 5, As = 10, and Cd = 30 (46). For uranium, since no standard Tr value is currently available, a value equal to that of As (10) was assumed, given its relatively high chemical toxicity and its potential to cause cancer (48). The potential ecological risk (RI; Equation 5) is the overall degree of ecological risk caused by toxic metal concentrations and is calculated (Eq. 5) from the sum of the potential ecological risk factors (Ei) of each element evaluated at a sampling point. The classification criteria for Ei are as follows: Ei < 40 (low); 40 ≤ Ei < 80 (moderate); 80 ≤ Ei <160 (considerable); 160 ≤ Ei < 320 (heavy); and Ei ≥ 320 (serious). Similarly, the classification of RI is as follows: RI < 150 (low); 150 ≤ RI <300 (moderate); 300 ≤ RI <600 (considerable); and RI > 600 (very high).
3 Results and discussion
3.1 Characteristics of irrigation water quality in the region
Irrigation water quality not only affects agricultural soil health, but also poses a threat to the productivity and safety of the crops if contaminated water is used. In the study area, both groundwater and canal waters are used for irrigation. The basic chemical characteristics of both water types in this region are given in Table 1, and their suitability for irrigation was evaluated against the threshold limits of irrigation water quality set by the Food and Agriculture Organization of the United Nations (56). It can be seen that groundwaters exhibited significantly higher EC (ranging from 223–8,190 µS/cm) compared to canal water (ranging from 183–237 µS/cm). Higher EC values (>3,000 µS/cm) in some groundwater can negatively affect crop yields and soil health, but the pH of both waters is mostly sightly alkaline (6.59–9.2), falling within the acceptable range for irrigation purposes (56). Among the heavy metals in groundwater, Fe recorded the highest concentration (average, 28.2 to 451 µg/L) followed by Zn (average, 5.3 to 851 µg/L), with the overall decreasing order: Fe > Zn > Mn and other elements. In canal water, the concentration of most of the metals were comparatively lower, except for Fe (average up to 3,287 µg/L) and Mn (average up to 107 µg/L). For other PTEs, the average concentrations in both waters were either negligible or below the permissible limit set by FAO (56), with a few exceptions. As there is no guideline value exists for U in irrigation waters, the WHO drinking water limit (30 µg/L) was used as a reference. This indicates that groundwaters are significantly enriched with U (ranging from 3 to 518 µg/L), with over 50% of samples exceeding the WHO limit from this region (25). In case of canal water, U levels were either below the detection limit or far lower than the permissible limit. These results suggest that prolonged use of U-enriched groundwater for irrigation could serve as a potential source of U contamination in cultivated soil; as a result, it may be a concern to the vegetable crops grown in the region.
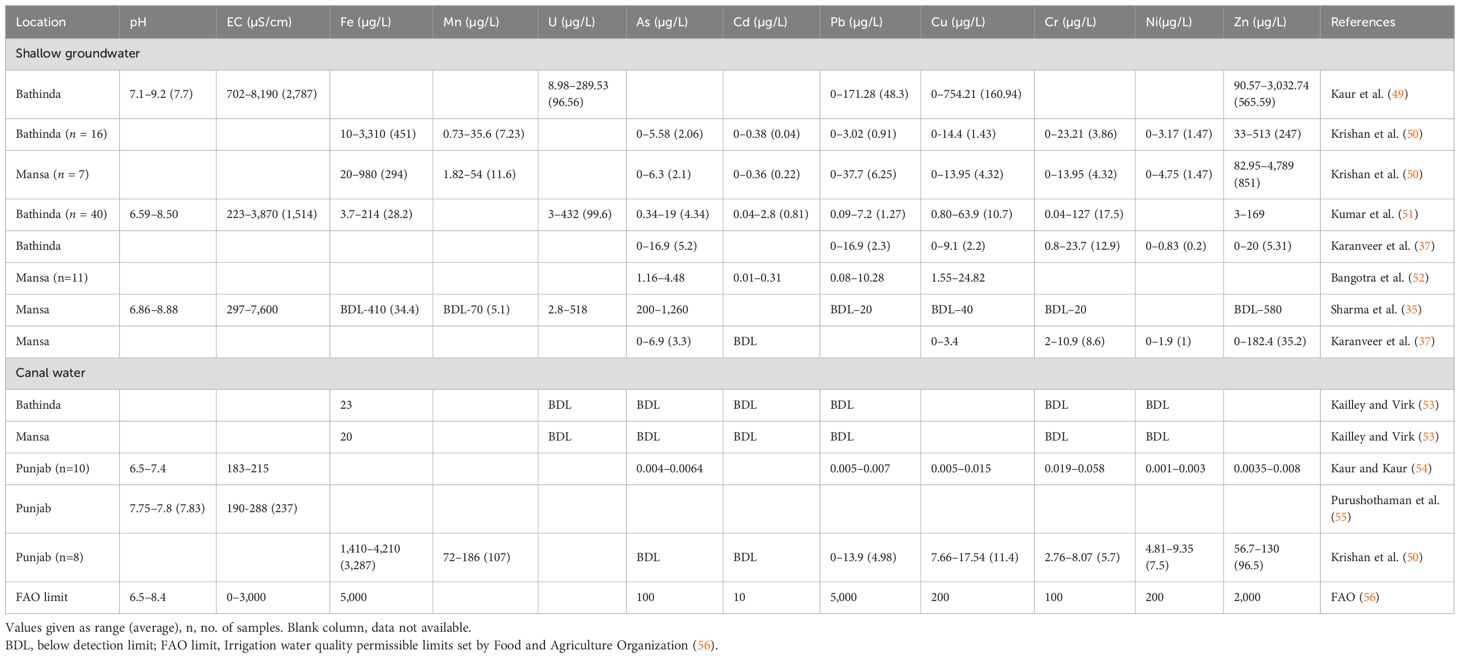
Table 1. Basic chemical characteristics of groundwater and canal waters used for irrigation in the study area.
3.2 Chemical characteristics of inorganic fertilizers and cow dung
Considering the study area is part of the agriculturally intensive region of Punjab, where chemical fertilizers have been frequently used, this study analyzed some locally available chemical fertilizers, such as DAP, SSP, urea, and potash, along with organic fertilizer (such as cow dung) to discuss their potential contribution to PTEs in cultivated soils. The results (Table 2) revealed considerable variation of PTEs among the different fertilizers, with phosphatic fertilizers containing significantly higher concentrations of most metals compared to other types. At present, there is no global consensus on the regulatory limit for PTEs in chemical fertilizers (58), although the European Union Fertilizer Regulation (EU) 2019/1009 (59) has adopted a coordinated approach to setting limits for many elements in macronutrient inorganic fertilizers (Table 2) to minimize environmental and health risks. All inorganic fertilizers analyzed in this study were within the limits of PTEs set by the EU Regulation (59). Similarly, in cow dung manure, PTE concentrations were within the limits of organic fertilizers as set by both (59) and Indian Fertilizer Control Order (FCO) (57).
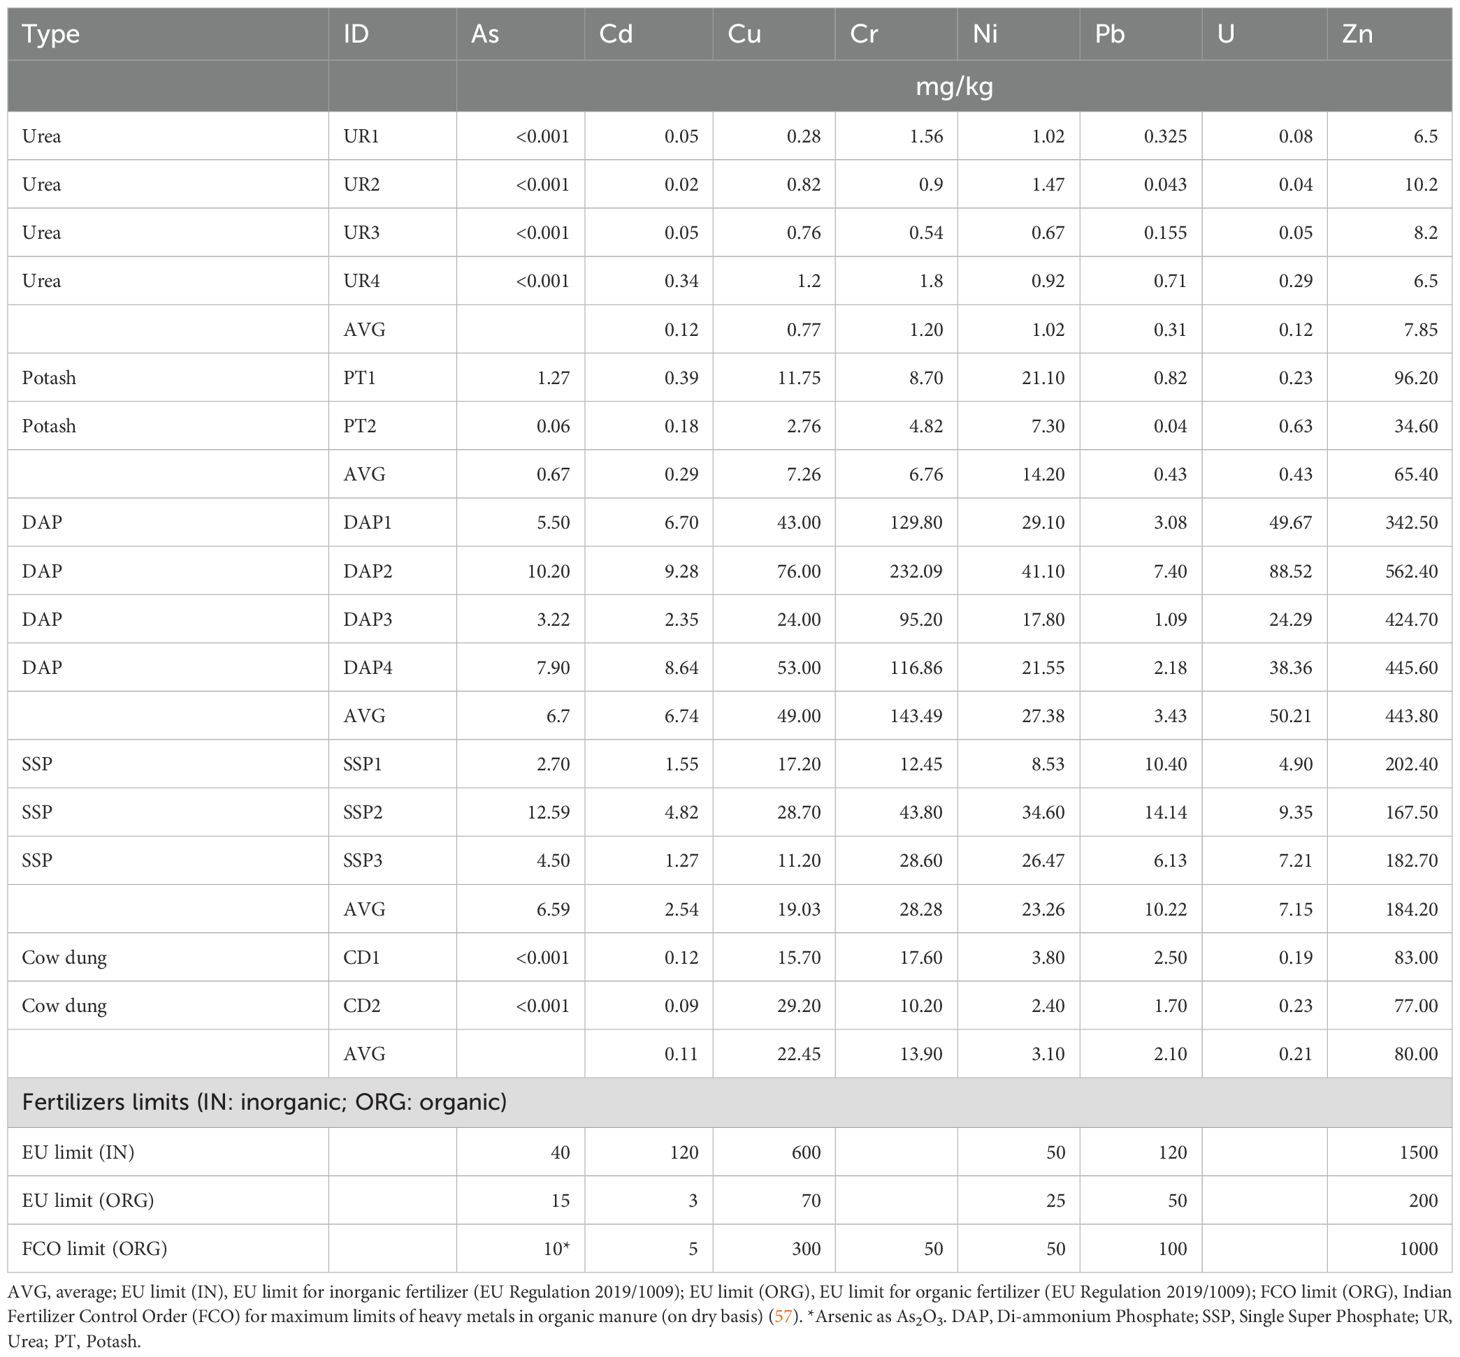
Table 2. Chemical characteristics of different chemical fertilizers and cow dung samples collected around the study area.
Based on the ranking of elements in the macronutrient fertilizers (average values), DAP contained the highest concentrations of Cd (6.74 mg/kg), Cu (49 mg/kg), Cr (143.49 mg/kg), Ni (27.38 mg/kg), U (50.21 mg/kg), and Zn (443 mg/kg), and the second-highest concentrations of Pb (3.43 mg/kg). This was followed by SSP with the highest level of Pb (10.22 mg/kg) and the second-highest level of Cd (2.54 mg/kg), Cu (19.03 mg/kg), Cr (28.28 mg/kg), Ni (23.26 mg/kg), U (7.15 mg/kg), and Zn (184 mg/kg). In case of urea, it did not rank the highest or the second-highest for any element but showed the lowest or second-lowest values for Fe, Th, Mo, and Cd, while K has the lowest concentrations for most of the elements, except U and Zn. Higher enrichment of most of the PTEs, including U, in phosphatic fertilizer shows a strong control of the raw material and chemical synthesis processes used (58). For instance, the elevated U concentration in DAP is linked to its origin from rock phosphate, which is naturally enriched in uranium (58). Notably, the concentration of Pb was relatively higher in SSP than in DAP, possibly due to differences in the manufacturing processes. In contrast, PTEs and U concentrations were negligible in urea and potash fertilizers. Cow dung samples also contained substantially lower PTE levels compared to phosphate-based fertilizers. Thus, this comparison clearly indicates that excessive application of P-based fertilizers can be a potential source of toxic metals in agricultural soils, although the content of metal accumulation is also influenced by soil properties and environmental conditions. Several studies also reported the role of P fertilizers in soil contamination. Budianta et al. (60) found that continuous application of P-based fertilizers increases Pb and Cd contents in the soil. Thomas et al. (61) reported that soil treated with phosphate fertilizer exhibited elevated concentrations of metals, including Cd, Co, Cu, Pb, Zn, Cr, and Ni, compared to controls. Similarly, Nicholson et al. (11) highlighted that phosphate fertilizers were an important source of heavy metals particularly for Zn, Cu, and Cd in agricultural soils of England and Wales, and Mwalongo et al. (62) reported that P fertilizers enhance U concentration in agricultural soils.
3.3 Basic soil properties of cultivated vs. uncultivated soils and the role of crop rotation pattern
Descriptive statistics of the physicochemical properties of vegetable-cultivated soils (CS) and uncultivated soils (US) are summarized in Table 3. The Mann–Whitney U test indicated statistically significant differences for pH, EC, and TOC (p < 0.05) between the CS and US. In CS, the soil pH ranged from 6.56 to 9.29, while in US, it ranged from 7.6 and 8.9, indicating that the majority of the soils were alkaline in nature. Similar soil pH ranges (6.6 to 9.6) were reported from Bathinda, Talwandi Sabo, and Amritsar (36, 63–65). The slightly lower pH observed in cultivated soils may be attributed to chemical fertilization (66). The EC, a crucial indicator of soil health, was significantly higher in CS (ranging from 173 to 3,230 μS cm−1; average, 675 μS cm−1) than in UC (ranging from 138 to 603 μS cm−1). With the exception of a few samples (EC > 1,000 μS cm−1), the majority of CS were non-saline in nature (EC < 1,000 μS cm−1), indicating that they are suitable for the growth of vegetables and soil microbial activity (67, 68). Previous studies also reported similar EC ranges in soils: Yadav et al. (65) observed EC values of 120–5,260 μS cm−1 (average, 700 μS cm−1) in Bathinda, while Kumar et al. (41) reported EC values of 360–543 μS cm−1 from the Bathinda and Talwandi Sabo block in the Bathinda district. Overall, higher EC in the cultivated soils may result from the accumulation of soluble fertilizers and salts, combined with irrigation with elevated EC-containing groundwater and high evaporation rates in the region. Apart from pH and EC, soil TOC was also significantly higher in CS (ranging from 0.11% to 2.44%; average, 0.76%) than in US (ranging from 0.22% to 1.12%; average, 0.48%). This increase is likely due to organic amendments like livestock manures, compost, and chemical fertilizers applied to cultivated fields. These findings are consistent with the recent study of Kaur et al. (36), who reported soil organic matter contents ranging from 0.74% to 2.34% in Bathinda soils. Another study by Kumar et al. (2016) reported an average of 0.57% organic matter in the Goniana and Talwandi Sabo blocks of Bathinda. Similarly, Kahlon et al. (69) reported organic matter contents of 0.63% and 0.52% for rice–wheat and cotton–wheat soils, respectively.
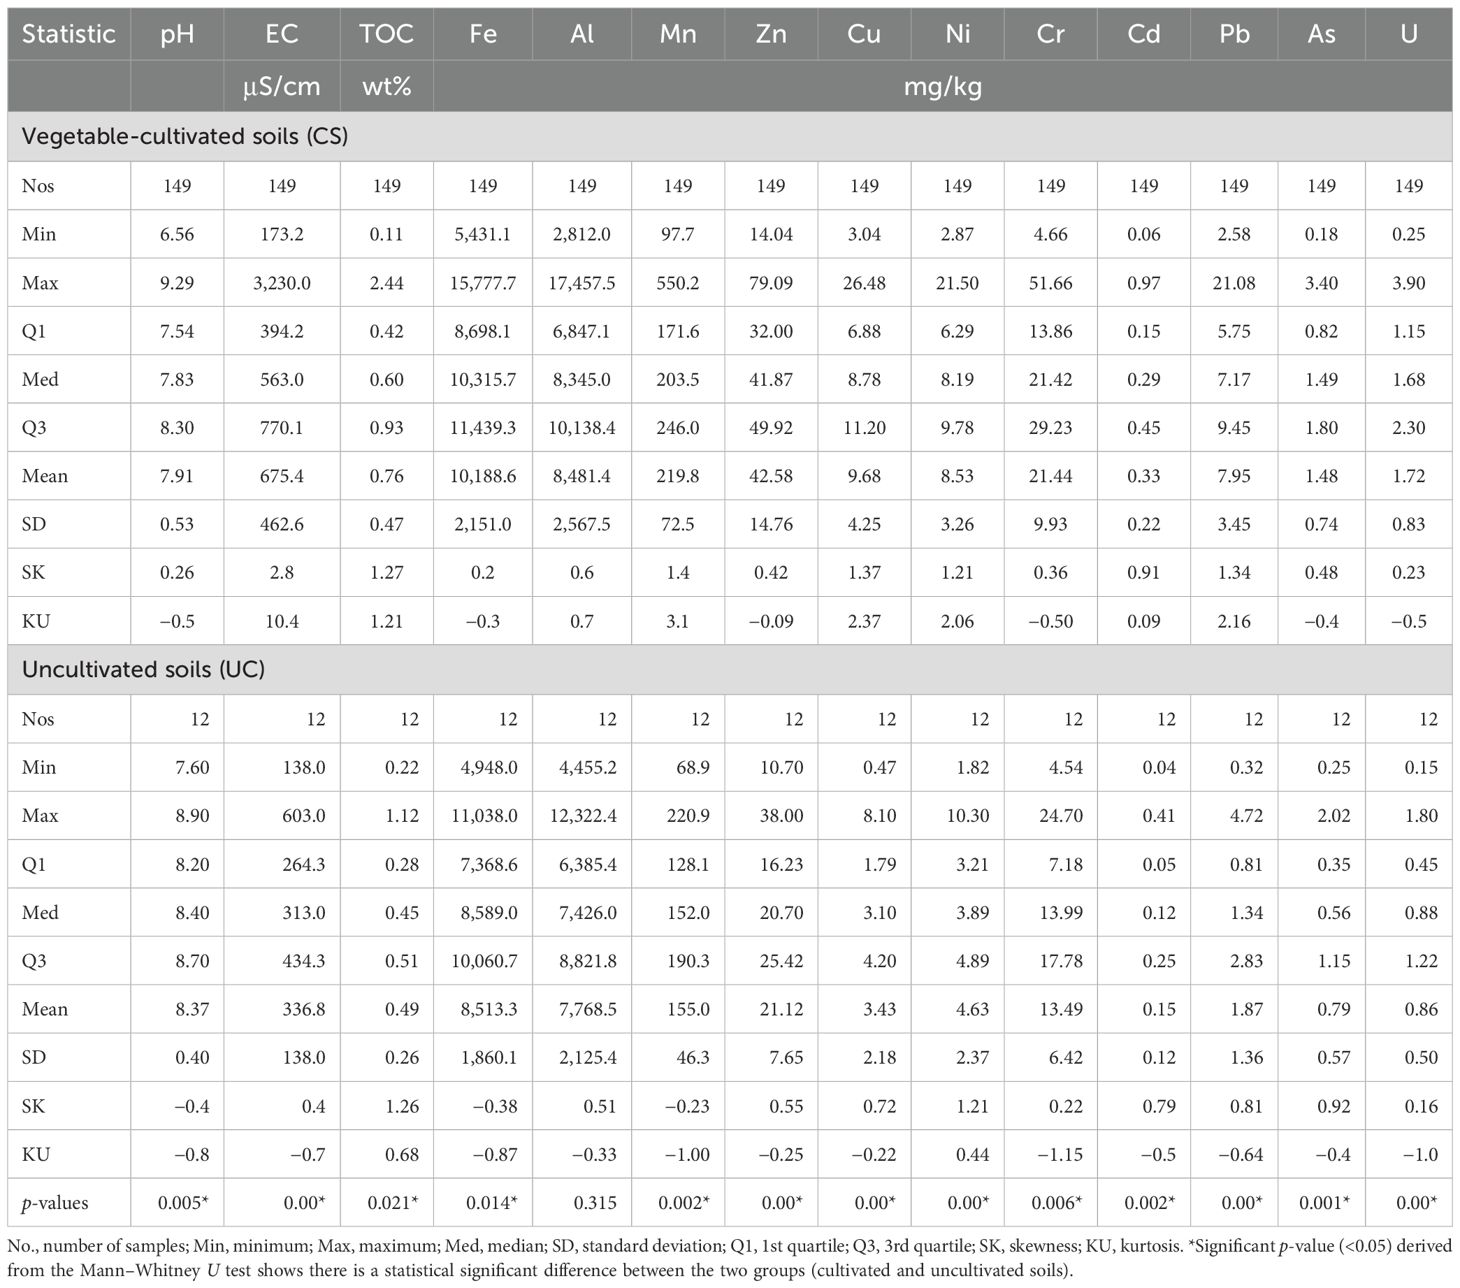
Table 3. Physicochemical characteristics and metal contents in different vegetable-cultivated and uncultivated soil from Bathinda and Mansa districts of Punjab.
When the vegetable-cultivated soil samples were analyzed with respect to the sequence of the cultivation (i.e., previous and current crop) at each sampling point, as part of the crop rotation practices, (i.e., based on previous–current crop), the VG–VG and RC–VG groups were the dominant categories (74 and 69 samples, respectively), while MZ-VG (4 samples) and CT–VG (5 samples) were few. Therefore, in the comparative assessment, the last two groups were excluded. As shown in Supplementary Table S1, EC was significantly higher in RC–VG than in the VG–VG group, possibly due to greater groundwater and fertilizer use in rice cultivation, which introduces more salt. In contrast, pH and TOC values were higher in the VG–VG group (average, 8.02 and 0.83%, respectively) than in the RC–VG group (average, 7.77 and 0.67%, respectively). The VG–VG field included both commercial farms and home garden, with the latter likely contributing to higher pH and TOC through greater livestock manures and compost application, whereas lower pH in RC–VG suggests more chemical fertilizer use (66). However, a healthy or fertile soil is generally considered to have at least 3% soil organic matter (equivalent to 1.76% TOC) (70). The low organic carbon content in our studied soil may be linked to their sandy texture. Kaur et al. (36) reported sand contents of 59% to 95% in Bathinda soils. Overall, alkaline pH, higher EC, low organic matter, and the sandy texture of the studied soils are consistent with the typical features of semi-arid agriculture soils, as evidenced in studies from India (36, 71, 72) and worldwide (73, 74).
3.4 Distribution of metals in cultivated vs. uncultivated soils and influence of crop rotation
The descriptive statistics of the concentrations of metals in CS and US are given in Table 3. The results show that there is a substantial variation in PTE content in soils, with higher standard deviations and moderately to highly skewed values for CS, indicating a more heterogeneous distribution of metals in cultivated lands. The average concentrations of elements followed the order: Fe > Al > Mn > Zn > Cr > Ni > Pb > Cu > As > U > Cd. This shows that essential micronutrients such as Fe, Mn, and Zn were most abundant in vegetable-cultivated soils compared to non-essential toxic elements like Cd, which presented the lowest value. The specific ranges of metals (mg/kg) in CS were as follows: Fe (5,431–15,778), Al (2,812–17,457), Mn (97–550), Cu (3.04–26.48), Zn (14.06–79.09), Cr (4.66–51.66), As (0.18–3.4), Ni (2.87–21.50), Pb (2.58–21.08), Cd (0.06–0.97), and U (0.25–3.9). Similarly, the ranges (mg/kg) in US were as follows: Fe (4,948–11,038), Al (4,455–12,322), Mn (68.9–220), Cu (0.47–8.1), Zn (10.7–38), As (0.25–2.02), Ni (1.82–10.3), Cr (4.54–24.7), Pb (0.32–4.7), Cd (0.04–0.41), and U (0.15–1.8). The Mann–Whitney U test results (Table 3) showed a significant difference (p < 0.05) for most of the PTEs (except Al) between the two groups (CS and US), with higher levels in the latter.
Lead accumulation was nearly four times higher in CS (mean, 7.95 mg/kg) than in US (mean, 1.87 mg/kg). However, when compared to the regional studies conducted in Punjab, India (Table 4), Pb contents in this study were relatively lower. For example, Chaudhari et al. (38) reported significantly higher levels of Pb (average, 31.5 mg/kg) in agricultural soils from three southwest districts of Punjab (Moga, Faridkot, and Muktsar). Similarly, Sonkar et al. (78) documented an average Pb content of 90.02 mg/kg from SAS Nagar in Punjab, which could be due to anthropogenic factors like excessive application of agrochemicals. In another study, Kaur et al. (75) reported higher Pb levels of 15.6 mg/kg in Mansa, whereas Ahmad and Pandey (40) recorded lower concentrations (average of 4.33 mg/kg) in Bathinda. In Fatehgarh Sahib, Kumar et al. (41) observed seasonal variations, with mean Pb concentrations of 7.8 mg/kg in soils under pre-monsoon and 9 mg/kg under post-monsoon conditions. Similarly, Bhatti et al. (33) recorded Pb concentration ranging from 5.5 to 9.67 mg/kg in the Doaba region of Punjab, associating metal buildup with agricultural inputs such as fertilizers and pesticides, whereas Bala et al. (87) reported a mean Pb concentration of 19.3 mg/kg from the Barnala district of Punjab. Chromium concentration was nearly twice as high in CS (average, 21.44 mg/kg; Table 3) as in US (average, 13.49 mg/kg), reinforcing the influence of agricultural practices. Higher Cr concentrations have been reported across different regions of Punjab. Kaur et al. (75) documented higher Cr concentrations of 37.5 mg/kg in Mansa, while Ahmad and Pandey (40) observed elevated Cr levels of 34.32 mg/kg in Bathinda. A study by Kumar et al. (41) found an average Cr concentration of 24.14 mg/kg in Fatehgarh, Southeast Punjab, showing moderate accumulation.
Similar to Pb, there is a great disparity in Cd levels between CS and US, reflecting fertilizer-related contamination (Table 3). Statistical analysis showed a significant difference in Cd accumulation between the two soil types, with significantly lower Cd levels (0.15 mg/kg) in the US. Previous studies have reported varying Cd concentrations in the region. Kaur et al. (75) documented much higher Cd levels of 3.1 mg/kg in Mansa, in contrast with the findings in this study. Ahmad and Pandey (40) reported much lower Cd concentrations, with a mean of 0.06 mg/kg in Bathinda’s agricultural fields. Bhatti et al. (33) observed Cd concentrations ranging from 0.516 to 1.58 mg/kg in Punjab’s Doaba region, linking Cd buildup to pesticide and fertilizer use. In case of As, US soils contained significantly lower As levels (0.79 mg/kg) compared to CS (mean 1.48 mg/kg). Other studies have also reported comparatively higher As concentrations in this region. Kaur et al. (75) documented a mean As concentration of 8.1 mg/kg in Mansa, while Ahmad and Pandey (40) recorded 6.24 mg/kg in Bathinda. Similarly, Kumar et al. (2016) reported a collective mean concentration of 6.06 mg/kg from the Talwandi Sabo and Goniana blocks of Bathinda. Among micronutrients, Zn, Cu, and Ni were also significantly higher in CS than in US. For example, Zn averaged 21.12 mg/kg in US compared to 42.58 mg/kg in CS (Table 3); a similar enrichment pattern was also observed for Cu and Ni. Kaur et al. (88) reported elevated Zn and Cu in agricultural soils from Amritsar.
Overall, most metals were significantly higher (p < 0.05) in CS than in US, reflecting agricultural practices like fertilization and irrigation, and other possible pollution sources lead to the accumulation of heavy metals in cultivated lands. However, there is a wide range of metal concentrations across different agricultural regions, highlighting variations in contamination sources and environmental influences. Uncultivated soils, by contrast, are chemically less enriched and had slightly higher pH, indicating more natural balance. Comparing soil metal accumulation based on crop rotation categories (Figure 2), it can be seen that most of the PTEs were higher in the RC–VG category than in the VG–VG category, although Mann–Whitney U test (Supplementary Table S1) indicated no significant differences. Higher metal content in the rice based vegetable cultivated field is likely due to more commercial practices that associated with more chemical fertilizer use and greater irrigation input. When compared with earlier studies, either in the same study area (40, 75) or in the other regions of Punjab (41, 87), PTE levels in this study were relatively lower. The reason for this could be the farm types, as previous studies mainly assessed rice–wheat crop systems, which require higher irrigation (for rice) and more fertilization (for both) compared to vegetable farming. Fertilizer analysis in this study revealed elevated levels of Pb, Cd, Cr, Ni, and U in some chemical fertilizers, mostly DAP and SSP fertilizers, confirming that their role as a key source of these metals in agricultural soils of the region could be due to the excessive application of phosphatic fertilizers. Atafar et al. (89) indicated that Cd, Pb, and As concentrations were increased in the cultivated soils due to phosphate-based fertilizer application. Additionally, the application of pesticides and insecticides can also contribute to increased metal contamination like Pb and Cd to soils (60, 90). The level of Cr may have originated either from fertilizers or from the presence of Cr in bedrocks. Thus, intensive farming practices involving the overuse of phosphate fertilizers and pesticides can pose a serious concern for crop production in the region. The main sources of Cu in these soils are likely over-application of agrochemicals, including fungicidal sprays, that can reach the soil directly or indirectly through leaf litter (9). Notably, the higher level of U in cultivated soils could be attributed to the irrigation of U-contaminated groundwater or the application of phosphate fertilizer.
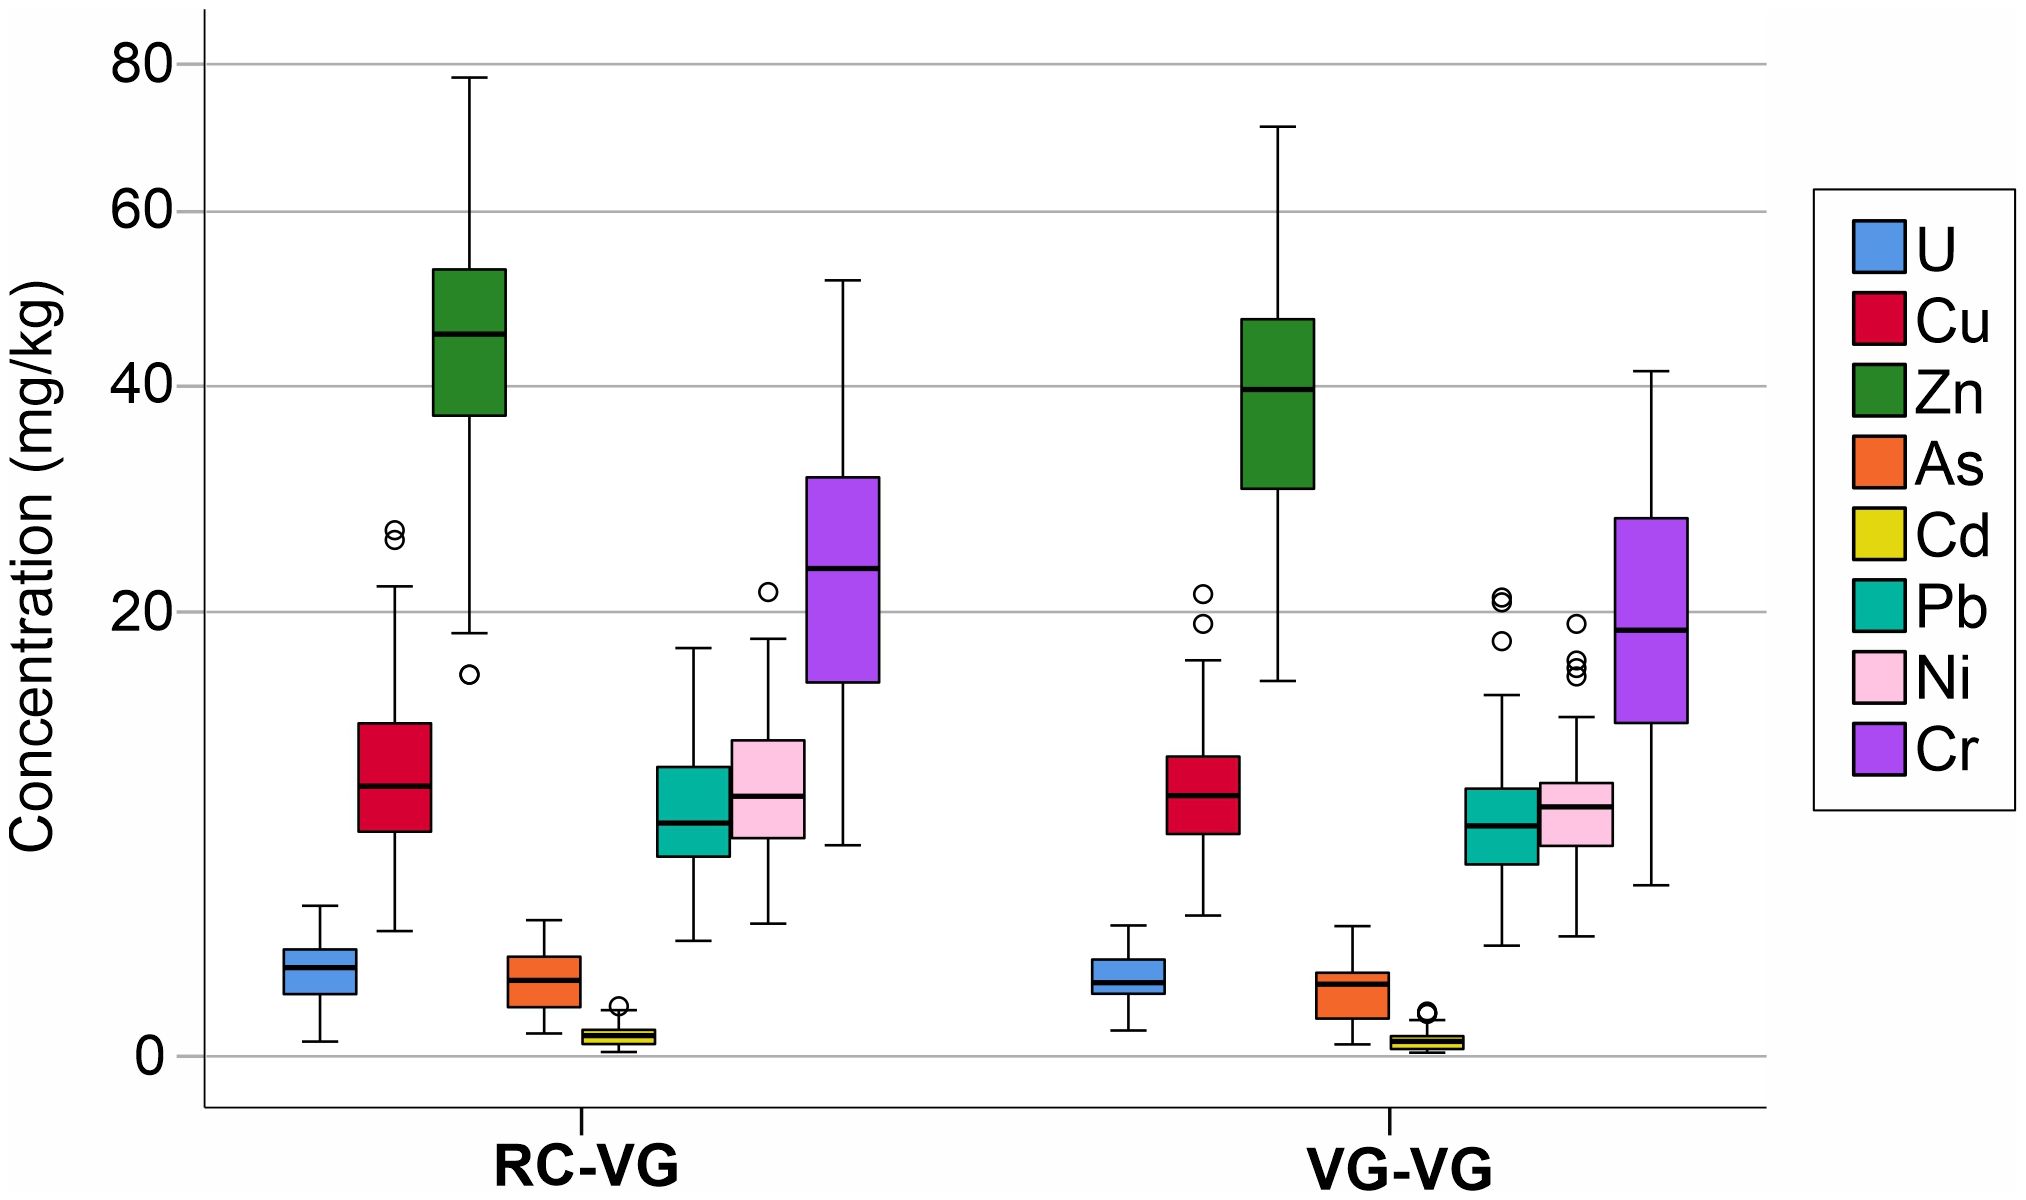
Figure 2. Box plot showing the distribution of various elements in soils under different crop rotation fields. Crop codes indicate the sequence of cultivation at each site, where the first term refers to the previous (summer) crop and the second to the current (winter) crop (e.g., RC–VG = summer rice followed by winter vegetable; VG–VG = summer vegetable followed by winter vegetable). Concentrations are indicated with interquartile ranges, medians, and outliers.
Soil heavy metal concentrations in the study area were also compared with various international guidelines values (Table 4), including world background soils (WBS; 80) and upper continental crust (UCC; 21). Furthermore, various regulatory authorities from different countries/organizations—EU, WHO, FAO, USEPA, MAC China, and India—have established permissible limits for heavy metals in agricultural soil. For instance, Indian standards (79) specify the following guideline values of heavy metals in agricultural soil: 135–270, 250–500, 300–600, 75–150, 3–6, and 300–600 mg/kg for Cu, Pb, Co, Ni, Cd, and Zn, respectively. The FAO/WHO, Food and Agricultural Organization (FAO)/World health organization (WHO) (86) guidelines recommend limits of 600 mg/kg for Mn, 1,000 mg/kg for Zn, 300 mg/kg for Cu, 75 mg/kg for Cr, 50 mg/kg for Pb, 20 mg/kg for As, and 3 mg/kg for Cd. China’s recommended maximum allowable concentration (MAP) of heavy metals for paddy soils (GB15618-2008) specifies the limits of Zn (250 mg/kg), Cu (100 mg/kg), Pb (80 mg/kg), and Cd (0.5 mg/kg) among others (85). Similarly, the German Federal Soil Protection Ordinance has given precautionary values for heavy metals for loam/silty soil type (84), while the Canadian soil environmental quality guidelines (83) provide permissible limits of toxic elements for agricultural soils. It can be seen that there is a great variation in the limits of heavy metals across different guidelines/countries, which may be due to differences in climatic conditions, soil characteristics, and different strategies adopted by them. When compared to these references, it was observed that most of the PTEs in studied soils were found to be considerably lower than the safe range of Indian Standards (79) as well as the WBS (Table 4). Likewise, all values fell below the permissible limits of other soil quality guidelines developed to protect ecological health and agricultural productivity (Table 4). Similarly, the average U concentrations in the studied soils also remained within the range of WBS (0.79 to 11 mg/kg; 80), UCC (2.6 mg/kg; 81), and the Canadian preliminary soil quality guideline for U in agricultural land use (83).
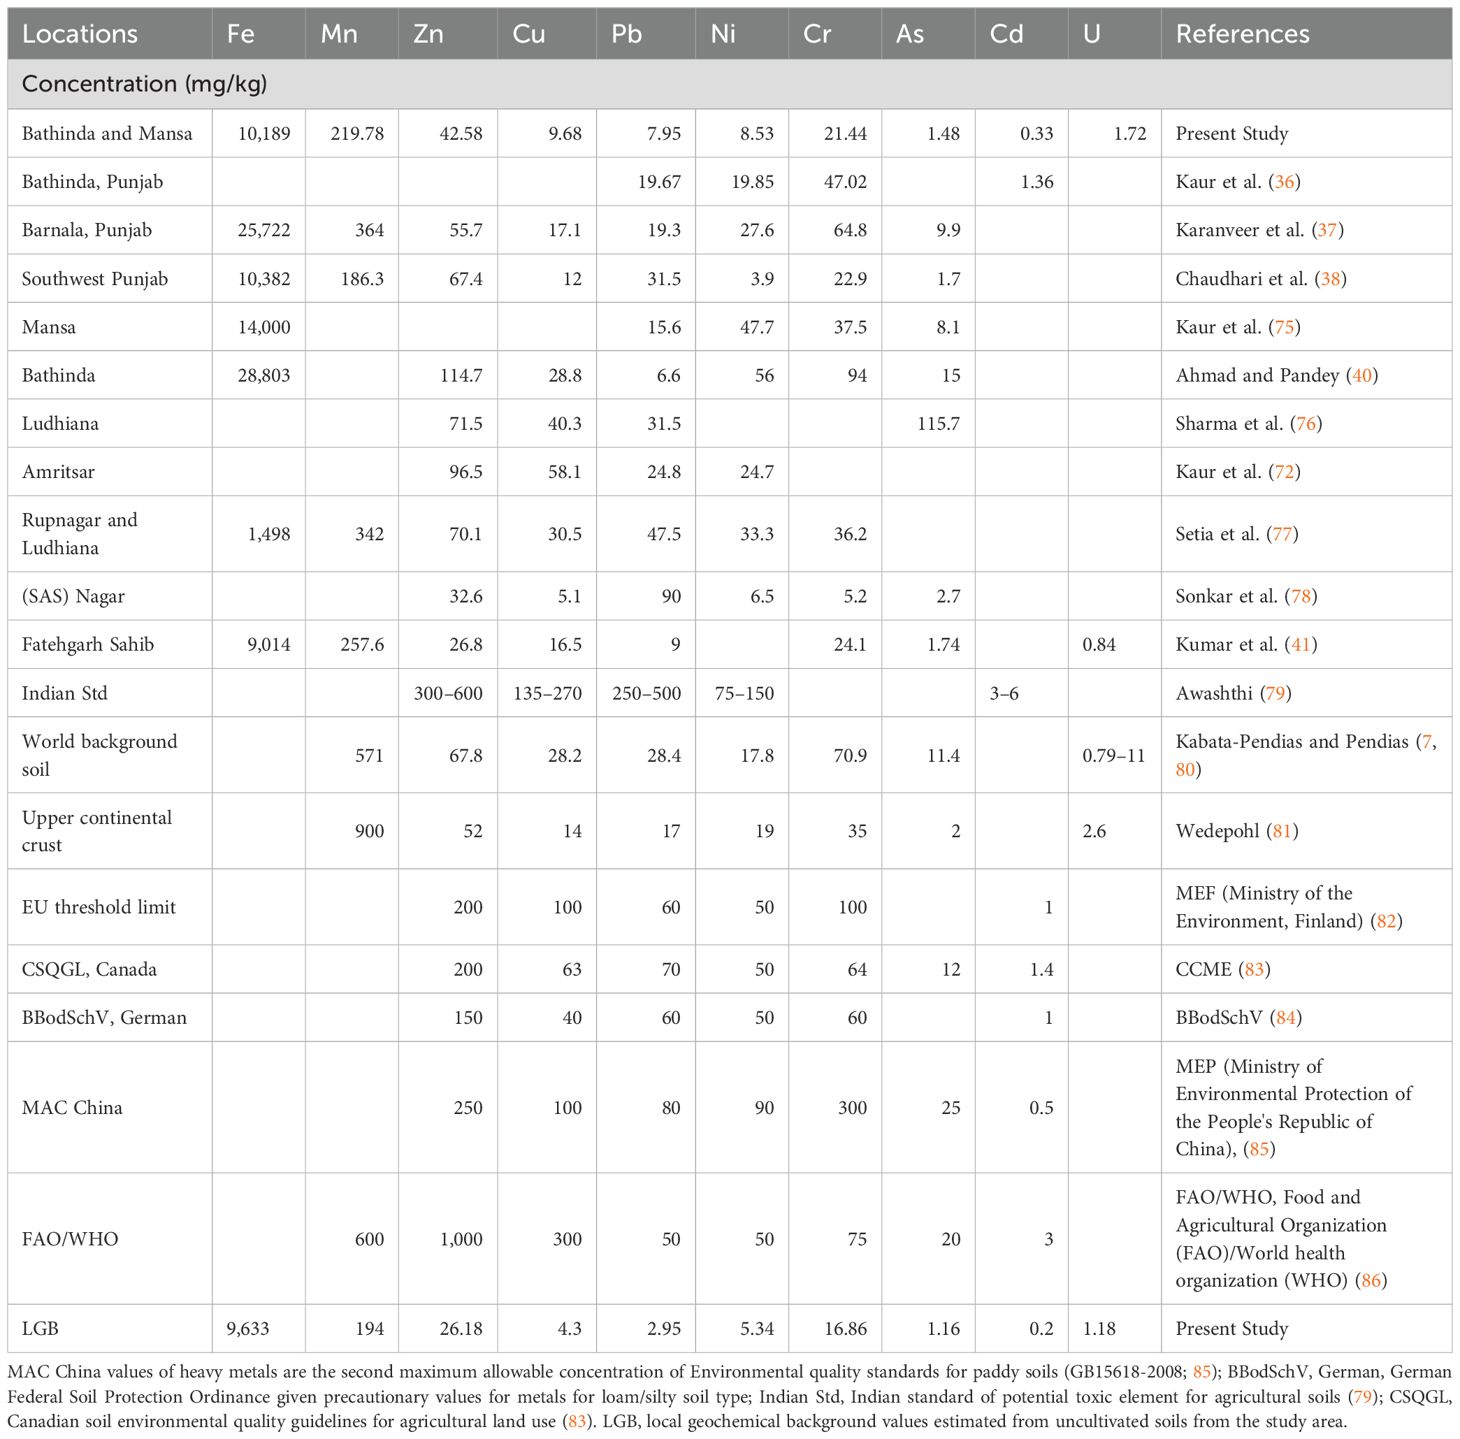
Table 4. Comparison of average heavy metals concentrations in vegetable-cultivated soils of present study with regional studies and reference values/threshold limits set by different countries/organizations.
Overall, this comparison with national and international criteria as well as regional literatures reveals that the soil is in good condition concerning heavy metal accumulations; however, long-term irrigation with contaminated groundwater combined with the continuous application of chemical fertilizers and pesticides can degrade soil quality and disrupt soil metal balance by increasing the accumulation of toxic PTEs in the cultivation lands.
3.5 Environmental/ecological risk assessment
Because of the lack of geochemical background studies in some specific study sites, many studies use global reference values, such as the WBS and the UCC, to assess anthropogenic contamination in soils or sediments. However, these global values can be sometimes misleading, as they often result in either overestimation or underestimation of contamination levels (44). This limitation arises because such values do not consider local geological setting/mineralogy/soil types, which plays a crucial role in defining the actual pollution status (91, 92). Therefore, establishing appropriate local or site-specific geochemical background seems to be more relevant for accurately determining the magnitude of the anthropogenic metal contamination (44). This is evident in the present study, as there is a significant variation of LGB values from global and national reference values (Table 4). Hence, in this study, the LGB values were used to calculate pollution indices.
Overall, EF data (Figure 3a) revealed that overall most of the cultivated soil samples fell into the no to minimal (67%) and moderate (29.5%) enrichment categories for PTEs. Only 3% of samples showed significant enrichment, suggesting that localized contamination most likely associated with anthropogenic input. Certain elements, notably, Pb, Cd, and Cu, appeared in the significant enrichment categories (EF >5) in a small proportion of samples (14%, 4%, and 8%, respectively), pointing to possible inputs from agricultural activities such as chemical fertilizer and pesticide application. Similarly, the CF values (Figure 3b) showed that most elements exhibited moderate pollution (1 ≤ CF <3) in nearly 69% of samples. Low contamination (CF < 1) accounted for 24.2% of samples, while considerable contamination (3 ≤ CF < 6) occurred in 6.2% of samples. On average, CF values in the cultivated soils followed the order: Pb > Cu > Zn > Ni> Cd > U > As > Cr > Mn > Fe. This ranking shows that Mn and Fe had the highest proportion of low contamination values, while Pb has the highest average CF value, which exhibited considerable contamination in nearly 25% of samples, followed by Cu in 17.45% and Cd in 12% of samples. Also, a very small fraction (2% sites) of Pb belongs to the very high contamination category, which needs urgent attention. Overall, these contamination indices underline the importance of targeted monitoring and management strategies for contaminants like Pb and Cd, which can pose higher ecological and health risk due to their persistence and toxicity.
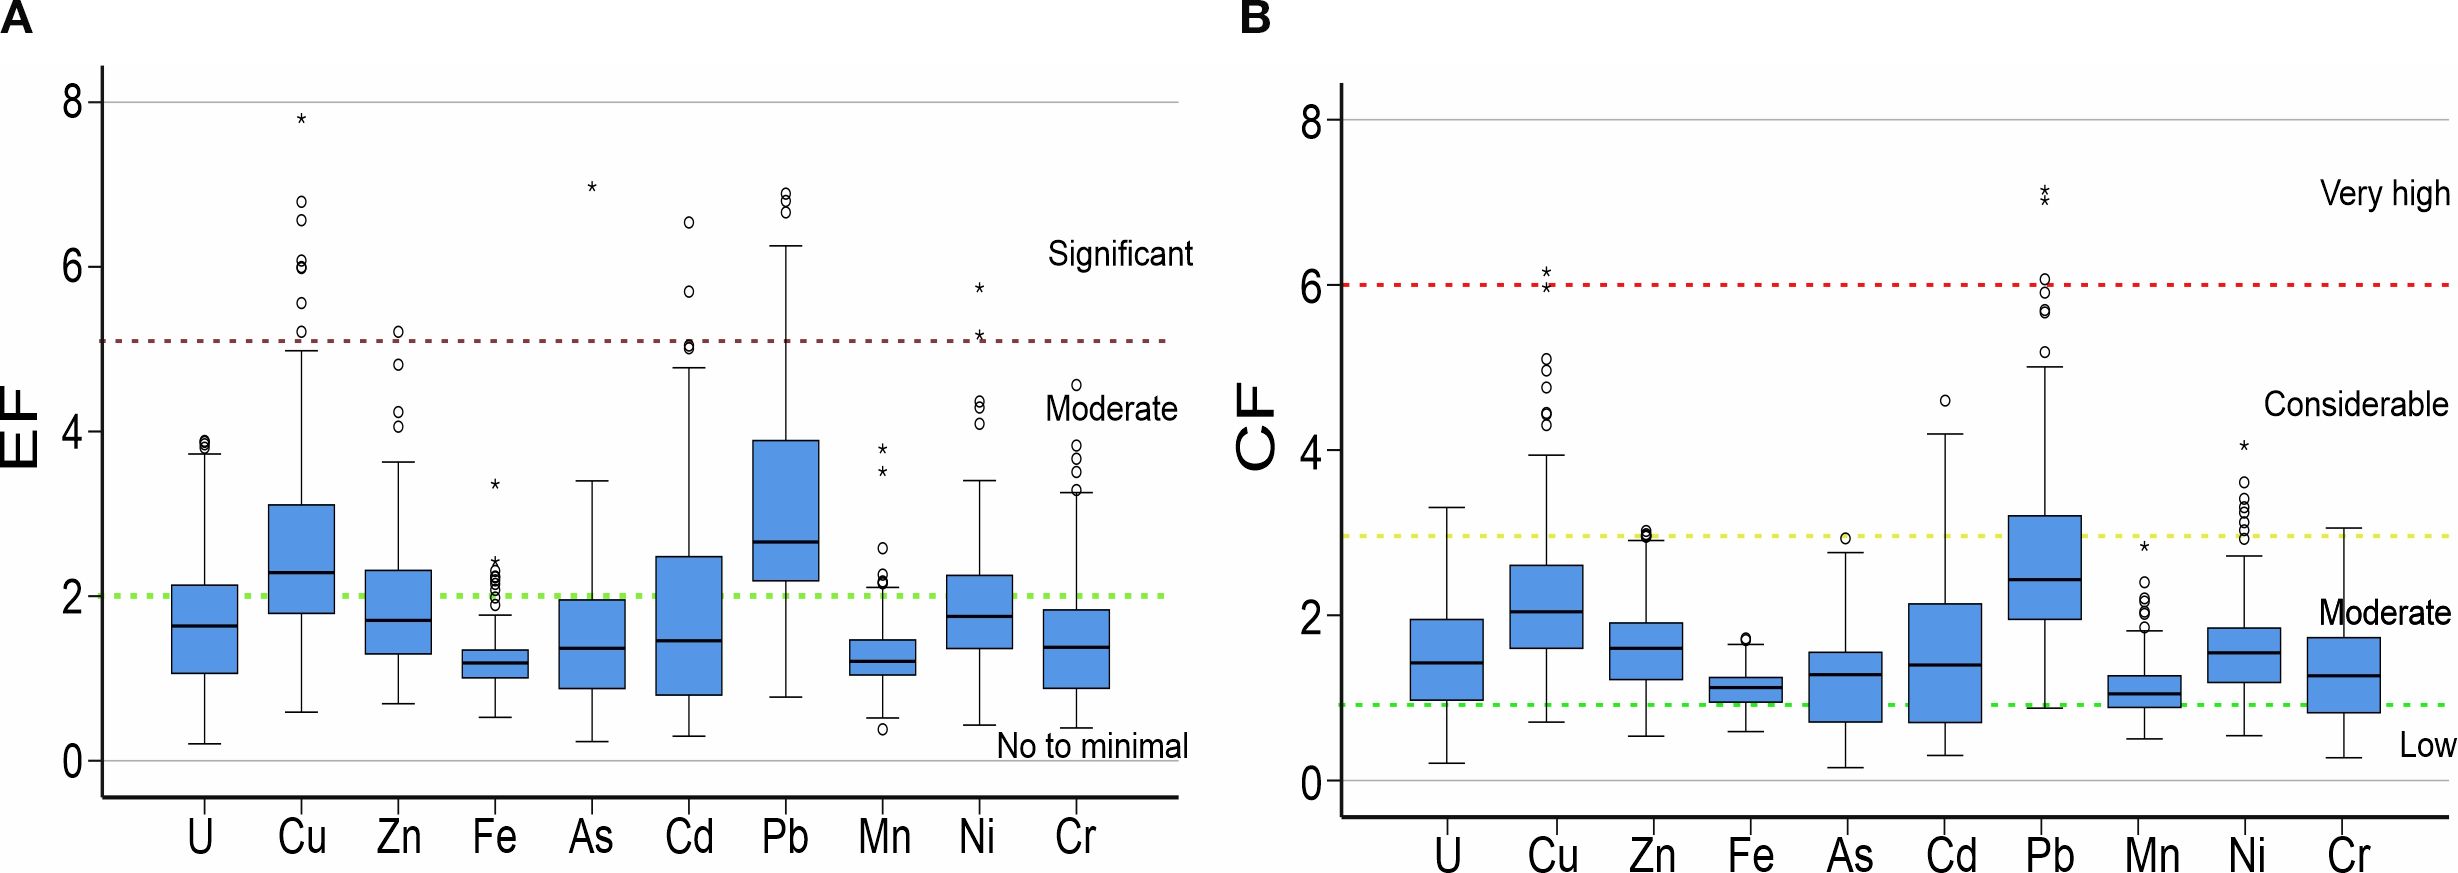
Figure 3. Box plot illustrates the environment factor (EF) and contamination factor (CF) for various elements in vegetable cultivated soils of the study area. Chart (a) shows EF with thresholds labeled as minimal, moderate, and significant. Chart (b) displays CF with low, moderate, considerable, and very high levels. Data points, median lines, and outliers are visible in each plot.
When evaluated with respect to crop rotation types, overall the RC–VG category showed higher CF values than others. Approximately 21% and 30% of sample sites of VG–VG and RC–VG were classified as having considerable levels of Pb contamination, respectively. Moreover, dominating of low to moderate contamination levels of other elements were noticed for both VG–VG and RC–VG. The comprehensive contamination level was estimated in the agricultural soils based on PLI. PLI values (Figure 4; Supplementary Table S2) also show that majority of the sites (about 89%) fell under the moderate level of pollution (PLI 1 to 2), while heavy pollution conditions (PLI 2 to 3) were recorded in only 10.7% of cases, with higher cases in the RC–VG compared to the VG–VG cropping system. This suggests that crop type and associated management practices are important factors influencing metal accumulation in vegetable-cultivated soils. Furthermore, the ecological risk factor (Ei) of individual metal was determined to detect the presence of priority hazard metals that constitute a possible threat to agricultural soils. Results varied significantly between elements (Supplementary Table S2). The highest Ei values were observed for Cd (9 to 137), followed by Pb (4.37 to 35.7), Cu (3.5 to 30.79), and others, while the majority of samples fell into the low ecological risk category (Ei < 40), and Cd had moderate risk (40 ≤ Ei < 80) in 5% of samples and considerable risk in 2.4% of samples. This highlights that Cd stands out as an important pollutant and is an ecological risk in the study area, warranting further study and remedial measures. The potential ecological risk index (RI), which represents the sensitivity of various biological communities, indicates the overall ecological risk caused by combined metal pollution. The RI values range from 41 to 250 (Figure 4; Supplementary Table S2), with most samples (73%) falling into the low-risk category, while over a quarter of samples (26.9%) are classified as moderate risk and no site reached the considerable or very high-risk threshold when considering local uncultivated soil as background value. This result indicates that heavy metal contamination generally remained below the levels expected to cause substantial ecological harm in the study area.
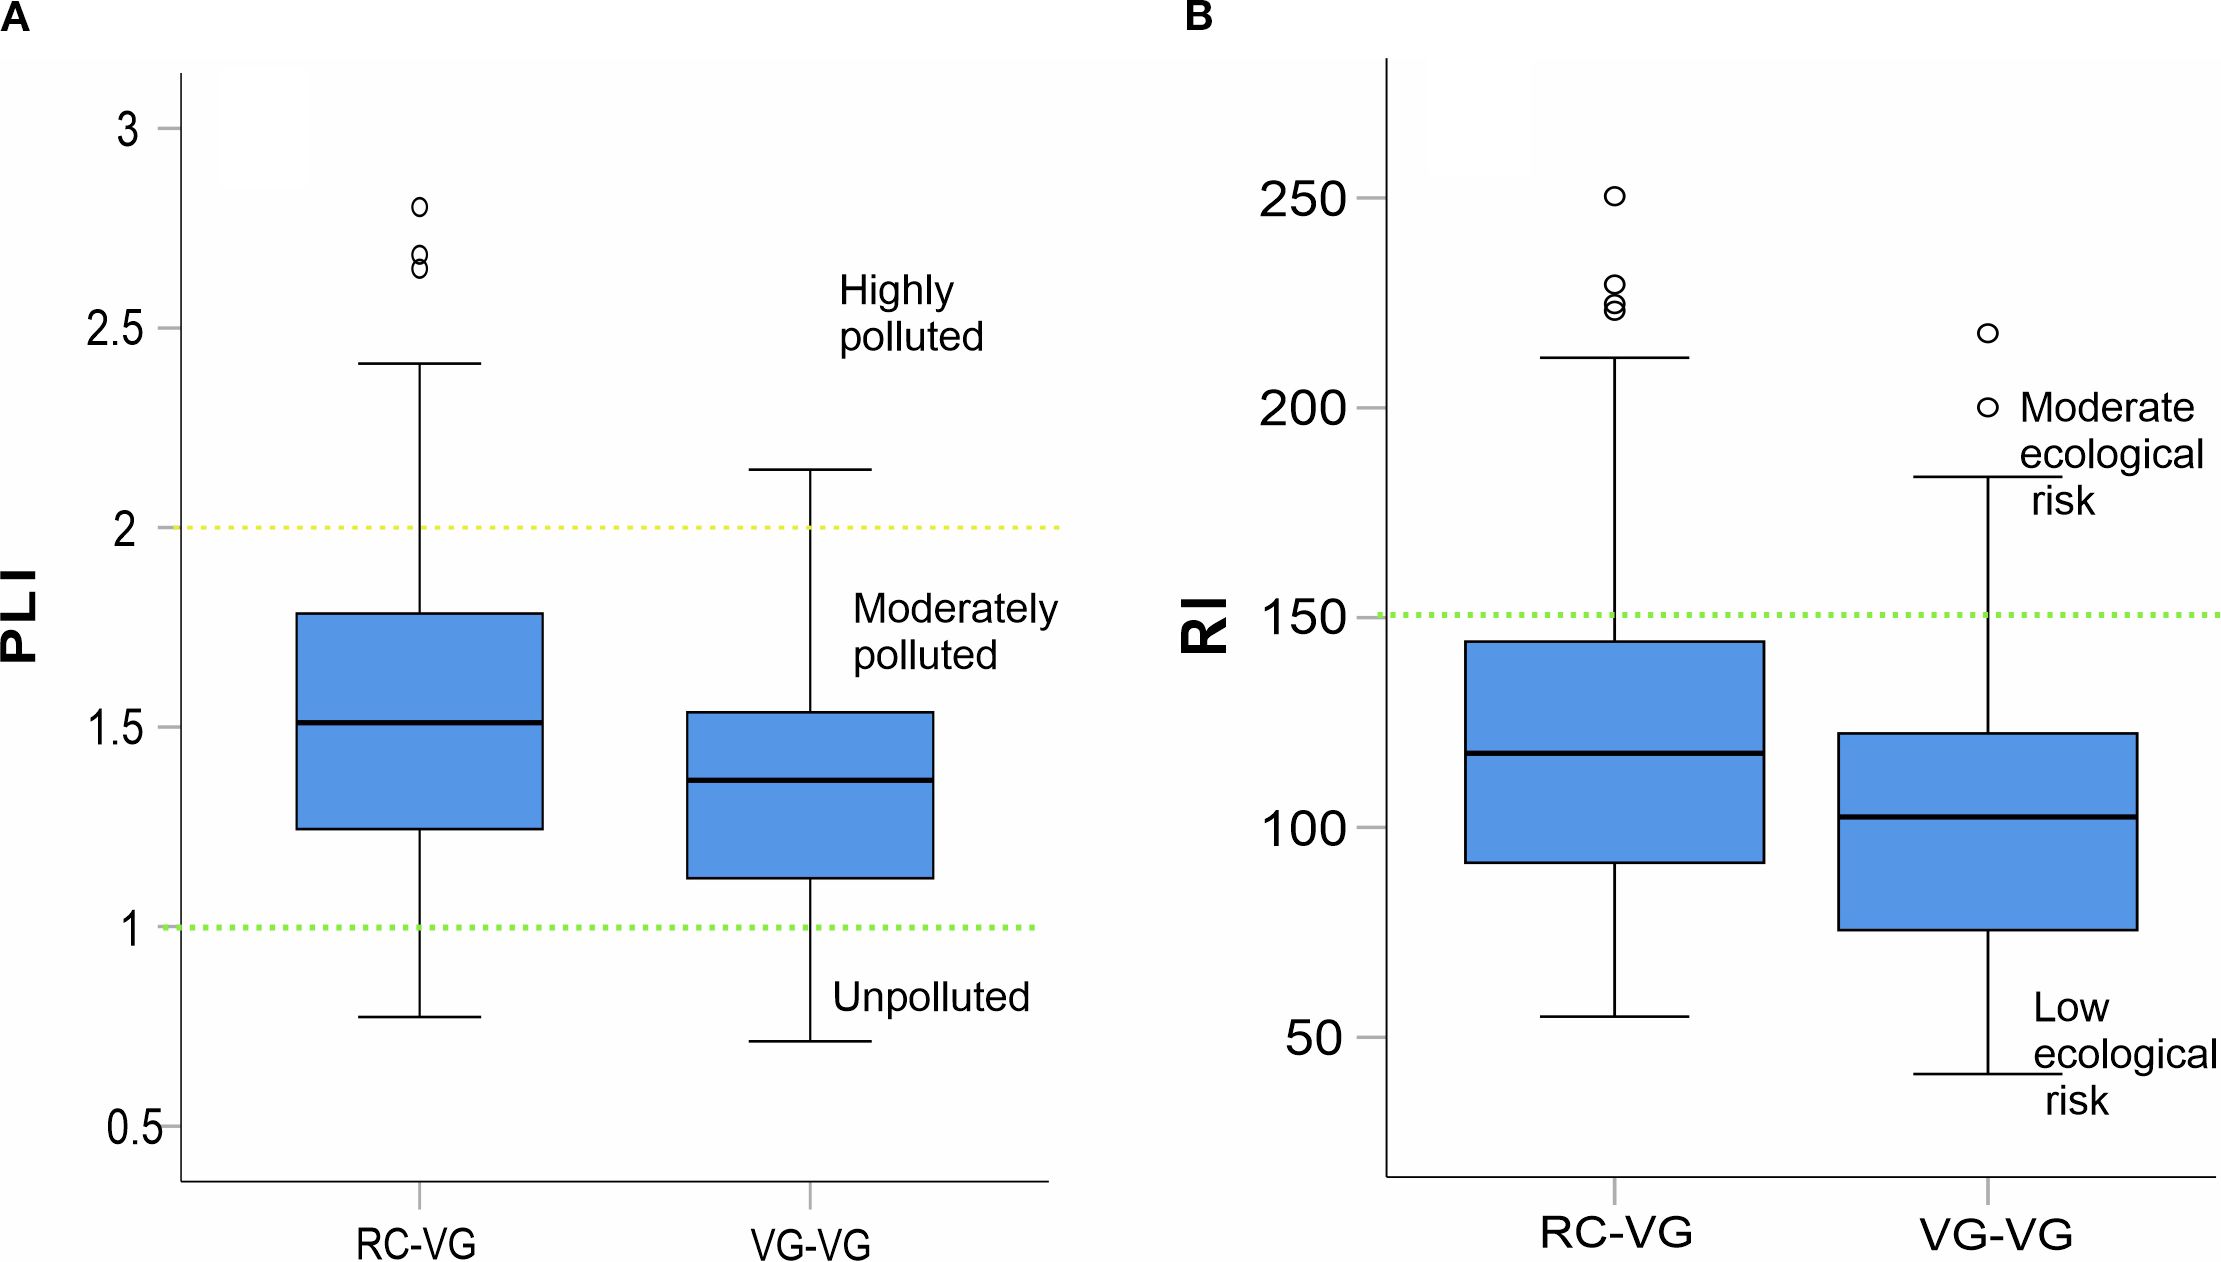
Figure 4. Box plot showing (a) the pollution load index (PLI) and (b) the potential ecological risk index (RI) in soils under different crop rotation fields. Crop codes indicate the sequence of cultivation at each site, where the first term refers to the previous (summer) crop and the second to the current (winter) crop (e.g., RC–VG = summer rice followed by winter vegetable; VG–VG = summer vegetable followed by winter vegetable).
3.6 Multivariate analysis and identification of potential factors of contamination
Since the cultivated soil samples in the region contain a higher content of PTEs compared to the uncultivated samples, it clearly indicates anthropogenic contamination from agricultural activity. Therefore, it is important to identify the potential factors of contamination. To achieve this, multivariate statistical analyses such as PCA and Spearman rank coefficients were applied (93). PCA was performed on geochemical data of cultivated soils including physicochemical parameters and PTEs. The four components of PCA with eigenvalues > 1 were found. Figure 5 shows the PCA loadings, where PC1 (Dim 1) accounts for 32.6% of total variance and is strongly correlated with Fe, Mn, Cu, Cr, Ni, Zn, Pb, Cd and U; PC2 shows 9.7% of total variance with a heavy loading of pH and TOC and moderately loading with Cu. The tight clustering of lithogenic elements (Fe, Al, and Mn) along with other PTEs in the biplot suggests a shared source or a common controlling factor for their distribution in soils (9). The strong positive correlations of these metals with Fe and Mn (Figure 5) imply that adsorption onto secondary mineral oxides (e.g., Fe-Mn oxyhydroxides) may be a key factor influencing their retention in soils. The organic matter is reported to act as an effective scavenger of trace elements by reducing their mobility and bioavailability in soils (94). However, very weak correlations were observed between soil TOC and PTEs, and no correlation was observed between pH and EC and other PTEs (Figure 6).
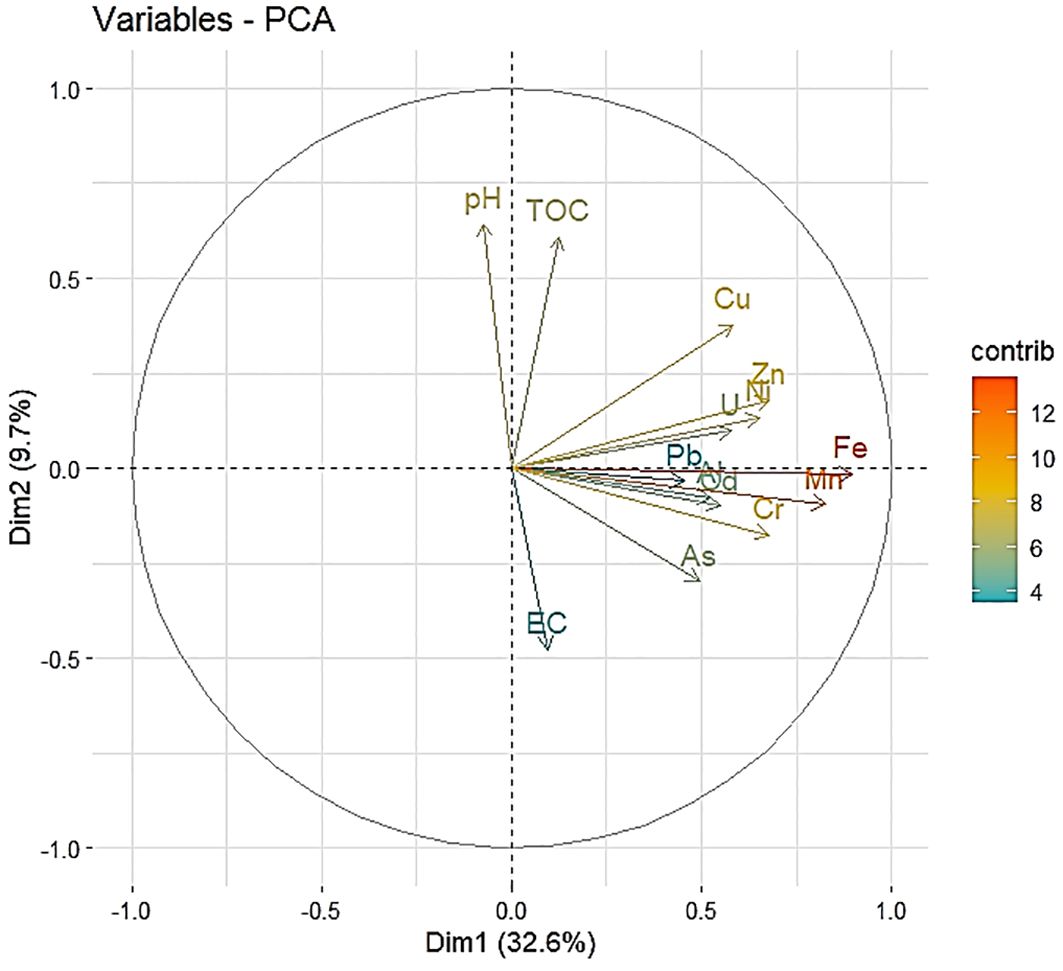
Figure 5. PCA biplot shows variable contributions in cultivated soils of the study area, where Dim1 captures 32.6% of the variance and Dim2 accounts for 9.7%. A color scale from blue to red shows the magnitude of these contribution, with longer arrows signify stronger contributions to the respective principal component.
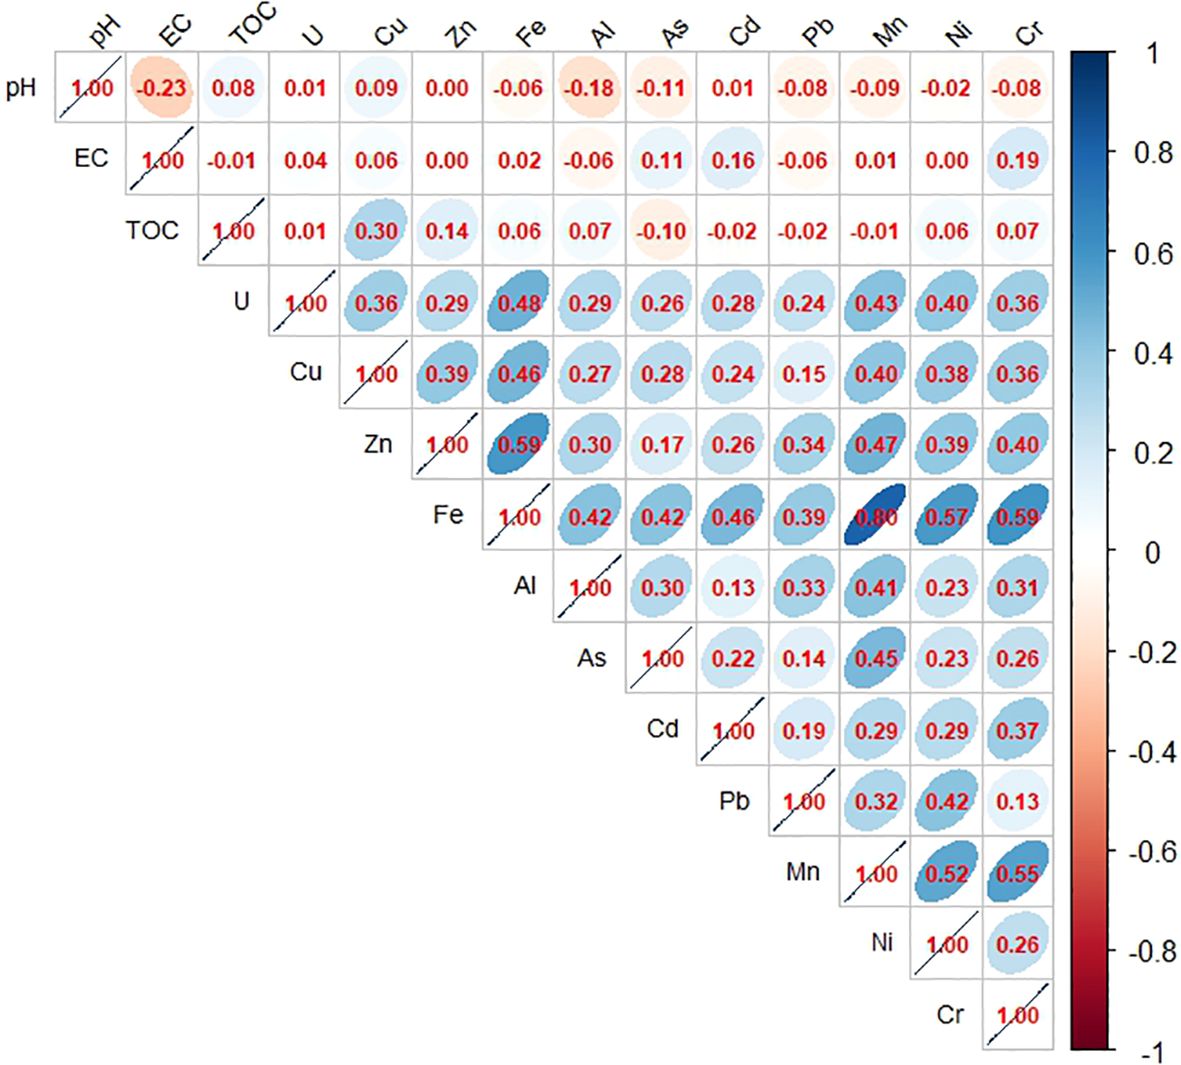
Figure 6. Spearman correlation matrix heatmap showing relationship between variables in cultivated soils of the study area. Color ranges from blue (positive correlation) to red (negative correlation), with numerical correlation values provided in each cell.
Furthermore, the strong positive relationships observed among PTEs (Figure 5) signify that they share a common source, which can be linked to anthropogenic contribution such as agricultural practices, as significantly higher concentrations of PTEs were recorded in cultivated soil compared to uncultivated soils. Important sources of PTEs such as Zn, Cu, Cd, As, Pb and U to agricultural soils could be due to the excessive application of agrochemicals, such as phosphate fertilizers, associated with specific crop rotation practices (88). The analysis of different chemical fertilizers and manures indicated that phosphate fertilizers are a major contributor to this contamination, while manures play a comparatively minor role. In addition, the application of pesticides and fungicides could also be an additional source of As, Cu, Cd, and Pb in the agricultural field (17). Zinc can be related to agrochemicals and natural factors (95). Although contaminated groundwater is predominantly used for irrigation in the study area, its contamination is largely limited to TDS and U, because other elements were mostly either below the detection limit or within the permissible limit. Moreover, despite having a high U content in groundwater and phosphate fertilizers, the U level remained at low to moderate levels in cultivated soils, which could be due to the sandy texture and low organic carbon content of the soils.
4 Conclusions
This study revealed that the cultivated soils in the region are characterized by an alkaline pH, high salt content, low organic carbon, and sandy texture, which are typical characteristics of semi-arid agriculture soils. The accumulation of U and PTEs in these soils varied, with average concentrations in vegetable-cultivated soils following the order: Fe > Al > Mn > Zn > Cr > Ni > Pb > Cu > As > U> Cd. Compared to undisturbed soils, a significantly higher content of PTEs was found in vegetable-cultivated soils. However, none of these elements exceeded the national and international soil reference values. Between different crop rotation types (based on the sequence of previous and current crops), slightly higher PTE levels were observed in the RC–VG category, likely due to greater fertilizer inputs required for rice/wheat crops. The pollution indices, calculated using the local background values, indicated low to moderate pollution with the PTEs, except Pb, which showed moderate to very high levels of pollution. This highlights the significant role of Pb accumulation in cultivated soils, which could be due to the application of higher doses of chemical fertilizers, especially phosphate-based fertilizers. In case of U, its higher values in cultivated soils compared to uncultivated soils could be attributed to both phosphate fertilizers and the irrigation of U-contaminated groundwater. PCA and Spearman correlation revealed the grouping of Fe-Mn-As-Ni-Cr-U-Cu-Zn on PC1, emphasizing the predominant role of Fe/Al/Mn oxyhydroxides as a major scavenger of PTEs in soil. Overall, this study provides the baseline status of the PTEs in vegetable-growing soils in the region and underscores the role of anthropogenic factors such as chemical fertilizer use and different cropping patterns. These findings are valuable for pollution control strategies in the Malwa region, contributing to the sustainable management of the region’s soil and crop quality, environmental protection, and human health.
Data availability statement
The original contributions presented in the study are included in the article/Supplementary Material. Further inquiries can be directed to the corresponding author.
Author contributions
PS: Formal analysis, Writing – original draft, Data curation, Investigation. HB: Writing – review & editing, Methodology, Data curation. HK: Writing – review & editing, Methodology. LN: Data curation, Methodology, Writing – review & editing. UC: Writing – review & editing, Software, Visualization, Methodology.
Funding
The author(s) declare financial support was received for the research and/or publication of this article. Funding received from core research grant (Ref. No. CRG/2021/002567).
Acknowledgments
PKS sincerely acknowledges the Science and Engineering Research Board (SERB), Department of Science & Technology (DST), Government of India, New Delhi for providing full financial support with Core Research Grant (Ref. No. CRG/2021/002567) to carry out this work. The authors are also thankful to the DST-FIST Instrumentation Lab of the Department of Environmental Science and Technology, and Central Instrumentation Facility (CIL) of Central University of Punjab for performing chemical analysis.
Conflict of interest
The authors declare that the research was conducted in the absence of any commercial or financial relationships that could be construed as a potential conflict of interest.
The author(s) declared that they were an editorial board member of Frontiers, at the time of submission. This had no impact on the peer review process and the final decision.
Generative AI statement
The author(s) declare that no Generative AI was used in the creation of this manuscript.
Any alternative text (alt text) provided alongside figures in this article has been generated by Frontiers with the support of artificial intelligence and reasonable efforts have been made to ensure accuracy, including review by the authors wherever possible. If you identify any issues, please contact us.
Publisher’s note
All claims expressed in this article are solely those of the authors and do not necessarily represent those of their affiliated organizations, or those of the publisher, the editors and the reviewers. Any product that may be evaluated in this article, or claim that may be made by its manufacturer, is not guaranteed or endorsed by the publisher.
Supplementary material
The Supplementary Material for this article can be found online at: https://www.frontiersin.org/articles/10.3389/fsoil.2025.1634647/full#supplementary-material
References
1. Martín JAR, Arias ML, and Corbí JMG. Heavy metals contents in agricultural topsoils in the Ebro basin (Spain). Application of the multivariate geoestatistical methods to study spatial variations. Environ pollut. (2006) 144:1001–12. doi: 10.1016/j.envpol.2006.01.045
2. Huang Y, Wang L, Wang W, Li T, He Z, and Yang X. Current status of agricultural soil pollution by heavy metals in China: A meta-analysis. Sci Total Environ. (2019) 651:3034–42. doi: 10.1016/j.scitotenv.2018.10.185
3. Liu X, Chen S, Yan X, Liang T, Yang X, El-Naggar A, et al. Evaluation of potential ecological risks in potential toxic elements contaminated agricultural soils: Correlations between soil contamination and polymetallic mining activity. J Environ Manage. (2021a) 300:113679. doi: 10.1016/j.jenvman.2021.113679
4. Liu Y, Ma Z, Liu G, Jiang L, Dong L, He Y, et al. Accumulation risk and source apportionment of heavy metals in different types of farmland in a typical farming area of northern China. Environ Geochemistry Health. (2021b) 43:5177–94. doi: 10.1007/s10653-021-01002-0
5. Yu B, Miao X, and Ouyang S. Soil heavy metal pollution trends for intensive vegetable production system in Beijing-Tianjin-Hebei Region, China, (2000– 2024) and human health implications. Environ Res. (2025) 283:122178. doi: 10.1016/j.envres.2025.122178
6. Shahid M, Khalid S, Abbas G, Shahid N, Nadeem M, Sabir M, et al. Heavy metal stress and crop productivity. Crop production Global Environ Issues. (2015), 1–25.
7. Kabata-Pendias A and Pendias H. Trace Elements in Soil and Plants. 3nd ed. Boca Raton: CRC Press (2001). p. 413.
8. Perković S, Paul C, Vasić F, and Helming K. Human health and soil health risks from heavy metals, micro (nano) plastics, and antibiotic resistant bacteria in agricultural soils. Agronomy. (2022) 12:2945.
9. Micó C, Recatalá L, Peris M, and Sánchez J. Assessing heavy metal sources in agricultural soils of an European Mediterranean area by multivariate analysis. Chemosphere. (2006) 65:863–72. doi: 10.1016/j.chemosphere.2006.03.016
10. Manegabe BJ, Msagati TA, Adeyimi A, Ntabugi MMK, Dewar JB, and De Bryun K. Assessment of heavy metals pollution in vegetables grown on irrigated soil and their potential threat to human health and global food security. Hygiene Environ Health Adv. (2025) 14:100129. doi: 10.1016/j.heha.2025.100129
11. Nicholson FA, Smith SR, Alloway BJ, Carlton-Smith C, and Chambers BJ. An inventory of heavy metals inputs to agricultural soils in England and Wales. Sci total Environ. (2003) 311:205–19. doi: 10.1016/S0048-9697(03)00139-6
12. Huang SW and Jin JY. Status of heavy metals in agricultural soils as affected by different patterns of land use. Environ Monit Assess. (2008) 139:317–27. doi: 10.1007/s10661-007-9838-4
13. Cao L, Li W, Deng H, Wang W, Liang Y, Wei Z, et al. Effect of land use pattern on the bioavailability of heavy metals: A case study with a multi-surface model. Chemosphere. (2022a) 307:135842. doi: 10.1016/j.chemosphere.2022.135842
14. Cao Z, Wei B, Yang L, Yu J, Meng M, Chen Q, et al. Different crop rotation patterns vary heavy metals behavior in soils under plastic sheds: Evidence from field research. Process Saf Environ Prot. (2022b) 162:543–52. doi: 10.1016/j.psep.2022.04.041
15. Yang W, Chen Y, Deng X, Tu P, Tan K, Liu Z, et al. Screening and rotating winter and summer crops to effectively remediate Cd-contaminated agricultural land and ensure safe production. Front Environ Sci Eng. (2025) 19:38. doi: 10.1007/s11783-025-1958-y
16. Ahadiyat YR, Fauzi A, Herliana O, and Hadi SN. Mapping heavy metals accumulation in conventional rice farming system at Banyumas Regency of Central Java, Indonesia. J Degraded Min Lands Manage. (2023) 10:4583–92. doi: 10.15243/jdmlm.2023.104.4583
17. Acosta JA, Faz A, Martínez-Martínez S, and Arocena JM. Enrichment of metals in soils subjected to different land uses in a typical Mediterranean environment (Murcia City, southeast Spain). Appl Geochemistry. (2011) 26:405–14. doi: 10.1016/j.apgeochem.2011.01.023
18. Rashid A, Schutte BJ, Ulery A, Deyholos MK, Sanogo S, Lehnhoff EA, et al. Heavy metal contamination in agricultural soil: environmental pollutants affecting crop health. Agronomy. (2023) 13:1521. doi: 10.3390/agronomy13061521
19. Srivastava V, De Araujo ASF, Vaish B, Bartelt-Hunt S, Singh P, and Singh RP. Biological response of using municipal solid waste compost in agriculture as fertilizer supplement. Rev Environ Sci Bio/Technology. (2016) 15:677–96. doi: 10.1007/s11157-016-9407-9
20. Tóth G, Hermann T, Da Silva MR, and Montanarella LJEI. Heavy metals in agricultural soils of the European Union with implications for food safety. Environ Int. (2016) 88:299–309. doi: 10.1016/j.envint.2015.12.017
21. Woldetsadik D, Drechsel P, Keraita B, Itanna F, and Gebrekidan H. Heavy metal accumulation and health risk assessment in wastewater-irrigated urban vegetable farming sites of Addis Ababa, Ethiopia. Int J Food Contamination. (2017) 4:1–13. doi: 10.1186/s40550-017-0053-y
22. Heikens A, Panaullah GM, and Meharg AA. Arsenic behaviour from groundwater and soil to crops: impacts on agriculture and food safety. Rev Environ Contamination Toxicology: Continuation Residue Rev. (2007) 189:43–87.
23. Gillispie EC, Sowers TD, Duckworth OW, and Polizzotto ML. Soil pollution due to irrigation with arsenic-contaminated groundwater: current state of science. Curr pollut Rep. (2015) 1:1–12. doi: 10.1007/s40726-015-0001-5
24. Smedley PL and Kinniburgh DG. A review of the source, behaviour and distribution of arsenic in natural waters. Appl geochemistry. (2002) 17:517–68. doi: 10.1016/S0883-2927(02)00018-5
25. Sahoo PK, Virk HS, Powell MA, Kumar R, Pattanaik JK, Salomão GN, et al. Meta-analysis of uranium contamination in groundwater of the alluvial plains of Punjab, northwest India: Status, health risk, and hydrogeochemical processes. Sci Total Environ. (2022) 807:151753. doi: 10.1016/j.scitotenv.2021.151753
26. Castro-González NP, Calderón-Sánchez F, Moreno-Rojas R, Moreno-Ortega A, and Tamariz-Flores JV. Health risks in rural populations due to heavy metals found in agricultural soils irrigated with wastewater in the Alto Balsas sub-basin in Tlaxcala and Puebla, Mexico. Int J Environ Health Res. (2017) 27:476–86. doi: 10.1080/09603123.2017.1386767
27. Chen H, Teng Y, Lu S, Wang Y, and Wang J. Contamination features and health risk of soil heavy metals in China. Sci total Environ. (2015) 512:143–53. doi: 10.1016/j.scitotenv.2015.01.025
28. Liu Z, Zhang Q, Han T, Ding Y, Sun J, Wang F, et al. Heavy metal pollution in a soil-rice system in the Yangtze river region of China. Int J Environ Res Public Health. (2016) 13:63. doi: 10.3390/ijerph13010063
29. Tongesayi T and Tongesayi S. Contaminated irrigation water and the associated public health risks. In: Food, Energy, and Water. Elsevier (2015). p. 349–81.
30. Alegbeleye OO and Sant’Ana AS. Risks associated with the consumption of irrigation water contaminated produce: on the role of quantitative microbial risk assessment. Curr Opin Food Sci. (2021) 41:88–98. doi: 10.1016/j.cofs.2021.03.013
31. Tomczyk P, Wdowczyk A, Wiatkowska B, and Szymańska-Pulikowska A. Assessment of heavy metal contamination of agricultural soils in Poland using contamination indicators. Ecol Indic. (2023) 156:111161. doi: 10.1016/j.ecolind.2023.111161
32. Gupta R. Agro-environmental revolution in Punjab: Case of the happy seeder technology. Discussion Papers. (2011) 11.
33. Bhatti SS, Kumar V, Singh N, Sambyal V, Singh J, Katnoria JK, et al. Physico-chemical properties and heavy metal contents of soils and kharif crops of Punjab, India. Proc Environ Sci. (2016) 35:801–8. doi: 10.1016/j.proenv.2016.07.096
34. Sharma P, Gill JS, and Sood A. Nutrient imbalance and soil health issues in Punjab: A critical appraisal. J Soil Water Conserv. (2020) 19(2):165–72.
35. Sharma T, Litoria PK, Bajwa BS, and Kaur I. Appraisal of groundwater quality and associated risks in Mansa district (Punjab, India). Environ Monit Assess. (2021) 193:159. doi: 10.1007/s10661-021-08892-8
36. Kaur M, Kaur J, Sood A, Katnoria JK, Nagpal AK, Bhatia A, et al. Potentially toxic metal contamination in semi-arid agricultural soils: sources, risk analysis, and spatial distribution. Environ Monit Assess. (2025) 197:783. doi: 10.1007/s10661-025-14237-6
37. Karanveer, Bala R, and Das D. Geochemical and health risk assessment of potentially toxic trace elements and nitrate via groundwater in an agro-ecosystem of the alluvial plain, Punjab, India. Hum Ecol Risk Assess. (2022) 28(9):983-101.
38. Chaudhari U, Kumari D, Tyagi T, Mittal S, and Sahoo PK. Geochemical signature and risk assessment of potential toxic elements in intensively cultivated soils of South-West Punjab, India. Minerals. (2024) 14:576. doi: 10.3390/min14060576
39. Verma F, Singh S, Dhaliwal SS, Kumar V, Kumar R, Singh J, and Parkash C. Appraisal of pollution of potentially toxic elements in different soils collected around the industrial area. Heliyon. (2021) 7(10).
40. Ahmad N and Pandey P. Spatio-temporal distribution, ecological risk assessment, and multivariate analysis of heavy metals in Bathinda District, Punjab, India. Water Air Soil pollut. (2020) 231:431. doi: 10.1007/s11270-020-04767-9
41. Kumar R, Mittal S, Peechat S, Sahoo PK, and Sahoo SK. Quantification of groundwater–agricultural soil quality and associated health risks in the agri-intensive Sutlej River Basin of Punjab, India. Environ geochemistry Health. (2020) 42:4245–68. doi: 10.1007/s10653-020-00636-w
42. CGWB. Aquifer mapping and management plan of Bathinda district, Punjab. Central Ground Water Board. (2017). Available online at: https://cgwb.gov.in/old_website/AQM/NAQUIM_REPORT/Punjab/Bhatinda.pdf (Accessed April 10, 2025).
43. Souza-Filho PWM, Sahoo PK, Silva MSD, Dall’Agnol R, Medeiros Filho CA, Leite AS, et al. Methodological approach and general guidelines to geochemical mapping and background-baseline analysis for environmental assessment: a case study in the Carajás Mineral Province, Brazil. Braz J Geology. (2022) 52:e20220018. doi: 10.1590/2317-4889202220220018
44. Sahoo PK, Dall’Agnol R, Salomão GN, da Silva Ferreira Junior J, da Silva MS, Martins GC, et al. Source and background threshold values of potentially toxic elements in soils by multivariate statistics and GIS-based mapping: a high-density sampling survey in the Parauapebas basin, Brazilian Amazon. Environ geochemistry Health. (2020) 42:255–82. doi: 10.1007/s10653-019-00345-z
45. Sutherland RA. Bed sediment-associated trace metals in an urban stream, Oahu, Hawaii. Environ geology. (2000) 39:611–27. doi: 10.1007/s002540050473
46. Hakanson L. An ecological risk index for aquatic pollution control. A sedimentological approach. Water Res. (1980) 14:975–1001. doi: 10.1016/0043-1354(80)90143-8
47. Tomlinson DL, Wilson JG, Harris CR, and Jeffrey DW. Problems in the assessment of heavy-metal levels in estuaries and the formation of a pollution index. Helgoländer meeresuntersuchungen. (1980) 33:566–75. doi: 10.1007/BF02414780
48. Zhang Z, Tang Z, Liu Y, He H, Guo Z, Feng P, et al. Study on the ecotoxic effects of uranium and heavy metal elements in soils of a uranium mining area in northern Guangdong. Toxics. (2023) 11:97. doi: 10.3390/toxics11020097
49. Kaur G, Kumar R, Mittal S, Sahoo PK, and Vaid U. Ground/drinking water contaminants and cancer incidence: A case study of rural areas of South West Punjab, India. Hum Ecol Risk assessment: an Int J. (2021) 27:205–26. doi: 10.1080/10807039.2019.1705145
50. Krishan G, Taloor AK, Sudarsan N, Bhattacharya P, Kumar S, Ghosh NC, et al. Occurrences of potentially toxic trace metals in groundwater of the state of Punjab in northern India. Groundwater Sustain Dev. (2021) 15:100655. doi: 10.1016/j.gsd.2021.100655
51. Kumar R, Mittal S, Sahoo PK, and Sahoo SK. Source apportionment, chemometric pattern recognition and health risk assessment of groundwater from southwestern Punjab, India. Environ Geochem Health. (2021) 43(2):733–55.
52. Bangotra P, Jakhu R, Prasad M, Aswal RS, Ashish A, Mushtaq Z, et al. Investigation of heavy metal contamination and associated health risks in groundwater sources of southwestern Punjab, India. Environ Monit Assess. (2023) 195(3):367.
53. Kailley SK and Virk HS. Uranium and heavy metal contamination of Sirhind canal water and groundwater in the Malwa belt of Punjab and its Mitigation strategies. Res reviews: J Toxicol. (2020) 10:34–41.
54. Kaur S and Kaur J. Comprehensive appraisal of water quality of Sirhind canal, Moga for its best designed use. Int J Sci Technol Manag. (2016) 5(1):136–41.
55. Purushothaman P, Someshwar Rao M, Rawat YS, Kumar CP, Krishan G, and Parveen T. Evaluation of hydrogeochemistry and water quality in Bist-Doab region, Punjab, India. Environ Earth Sci. (2014) 72:693–706. doi: 10.1007/s12665-013-2992-9
56. FAO. Water Quality for Agriculture. Food and Agriculture Organization. (1985). Rome, Italy. Available online at: http://www.fao.org/3/T0234E/T0234E00.htm (Accessed June 20, 2025).
57. FCO. Biofertilizers and Organic Fertilizers - The Fertiliser (Inorganic, Organic or Mixed) (Control) Order 1985 (2023). Available online at: https://nconf.dac.gov.in/uploads/quality_control/Green-Book-FCO-2023-Edition.pdf (Accessed December 2, 2025).
58. Sachdeva S, Varshney A, Barman HC, Powell MA, and Sahoo PK. Potentially toxic elements in different inorganic and organic fertilizers: A comprehensive review on global perspective and fertilizer-wise differences. Appl Soil Ecol. (2025) 209:105996. doi: 10.1016/j.apsoil.2025.105996
59. European Parliament and Council of the European Union. Regulation (EU) 2019/ 1009 of 5 June 2019 laying down rules on the making available on the market of EU fertilising products and amending Regulations (EC) No 1069/2009 and (EC) No 1107/2009 and repealing Regula- tion (EC) No 2003/2003. Off J Eur Union. (2019) 170:1–114.
60. Budianta D, Napoleon A, and Habi ML. (2022). Save our soil from heavy metals (Pb and Cd) accumulation for rice growth, in: IOP Conference Series: Earth and Environmental Science, , Vol. 1005. p. 012001.
61. Thomas EY, Omueti JAI, and Ogundayomi O. The effect of phosphate fertilizer on heavy metal in soils and Amaranthus caudatus. Agric Biol JN Am. (2012) 3:145–9. doi: 10.5251/abjna.2012.3.4.145.149
62. Mwalongo DA, Haneklaus NH, Lisuma JB, Mpumi N, Amasi AI, Mwimanzi JM, et al. Uranium dissemination with phosphate fertilizers globally: a systematic review with focus on east africa. Sustainability. (2024) 16:1496. doi: 10.3390/su16041496
63. Verma VK, Patel LB, Toor GS, and Sharma PK. Spatial distribution of macronutrients in soils of arid tract of Punjab, India. Indian J Agric Biol. (2005) 7:370–72.
64. Kumar R, Kumar R, Mittal S, Arora M, and Babu JN. Role of soil physicochemical characteristics on the present state of arsenic and its adsorption in alluvial soils of two agri-intensive region of Bathinda, Punjab, India. J Soils Sediments. (2016) 16(2):605–20.
65. Yadav BK, Sidhu AS, and Kumar D. Status of DTPA-extractable micronutrients in soils of Bathinda district of Punjab, India. Agric Res J. (2018) 55(2).
66. Zhang Y, Ye C, Su Y, Peng W, Lu R, Liu Y, et al. Soil Acidification caused by excessive application of nitrogen fertilizer aggravates soil-borne diseases: Evidence from literature review and field trials. Agriculture Ecosyst Environ. (2022) 340:108176. doi: 10.1016/j.agee.2022.108176
67. Adviento-Borbe MAA, Doran JW, Drijber RA, and Dobermann A. Soil electrical conductivity and water content affect nitrous oxide and carbon dioxide emissions in intensively managed soils. J Environ Qual. (2006) 35:1999–2010. doi: 10.2134/jeq2006.0109
68. USDA-NRCS. United States Department of Agriculture-Natural Resources Conservation Services. Soil electrical conductivity – Soil quality kit (Guides for educators) (2014). Available online at: http://www.nrcs.usda.gov/Internet/FSE (Accessed July 23, 2025).
69. Kahlon PA, Yadav BK, and Sharma SA. Spatial Distribution of Nutrients under Cotton-Wheat and Rice-Wheat Cropping Systems in Bathinda District, Punjab. J Agric Phys. (2021) 21(2):381–9.
70. Wang Y, Zhang Z, Li Y, Liang C, Huang H, and Wang S. Available heavy metals concentrations in agricultural soils: Relationship with soil properties and total heavy metals concentrations in different industries. J hazardous materials. (2024) 471:134410. doi: 10.1016/j.jhazmat.2024.134410
71. Bhatti SS, Bhat SA, Kumar V, Kaur M, Minakshi, Sambyal V, et al. Ecological risk assessment of metals in roadside agricultural soils: A modified approach. Hum Ecol Risk Assessment: Int J. (2018) 24:186–201. doi: 10.1080/10807039.2017.1373328
72. Kaur R, Pakade YB, and Katnoria JK. A study on physicochemical analysis of road and railway track side soil samples of Amritsar (Punjab) and their genotoxic effects. Int J Environ Chem Ecol Geol Min. Eng. (2014) 8:498–501.
73. Al-Wabel MI, Sallam AEAS, Usman AR, Ahmad M, El-Naggar AH, El-Saeid MH, et al. Trace metal levels, sources, and ecological risk assessment in a densely agricultural area from Saudi Arabia. Environ Monit Assess. (2017) 189:252. doi: 10.1007/s10661-017-5919-1
74. Salem MA, Bedade DK, Al-Ethawi L, and Al-Waleed SM. Assessment of physiochemical properties and concentration of heavy metals in agricultural soils fertilized with chemical fertilizers. Heliyon. (2020) 6(10):e05224. doi: 10.1016/j.heliyon.2020.e05224
75. Kaur G, Kaur R, Boparai JK, Sharma VK, and Sharma PK. Investigating the heavy metals and pesticides concentration in agricultural soil and groundwater of mansa district of Punjab, India: Insights into its impact on human health. Int J Innovat Res Sci Eng. (2017) 3:179–87.
76. Sharma P, Kaur J, and Katnoria JK. Assessment of spatial variations in pollution load of agricultural soil samples of Ludhiana district, Punjab. Environ Monit Assess. (2023) 195:222. doi: 10.1007/s10661-022-10816-z
77. Setia R, Dhaliwal SS, Singh R, Kumar V, Taneja S, Kukal SS, et al. Phytoavailability and human risk assessment of heavy metals in soils and food crops around Sutlej river, India. Chemosphere. (2021) 263:128321. doi: 10.1016/j.chemosphere.2020.128321
78. Sonkar V, Jaswal V, Chenlak S, and Nandabalan YK. Pollution status and health risk assessment of heavy metals in the soil of Sahibzada Ajit Singh (SAS) Nagar district of Punjab, India and its source apportionment. J Geochemical Explor. (2024) 261:107453. doi: 10.1016/j.gexplo.2024.107453
79. Awashthi SK. Central and state rules as amended for 1999: prevention of food adulteration act no 37 of 1954. New Delhi: Ashoka Law House (2000).
80. Kabata-Pendias A and Pendias H. Trace Elements in Soils and Plants. Boca Raton, FL, USA: CRC Press (1992).
81. Wedepohl KH. The composition of the continental crust. Geochimica Cosmochimica Acta. (1995) 59:1217–32. doi: 10.1016/0016-7037(95)00038-2
82. MEF (Ministry of the Environment, Finland). Government Decree on the Assessment of Soil Contamination and Remediation Needs. (2007).
83. CCME, Canadian Council of Ministers of the Environment. Canadian soil quality guidelines for uranium: environmental and human health. Scientific supporting document. Winnipeg: CCME (2007). Available online at: http://www.ccme.ca/assets/pdf/uranium_ssd_soil_1.2.pdf.
84. BBodSchV. Federal Soil Protection and Contaminated Sites Ordinance (1999). Available online at: https://www.sea.gob.cl/sites/default/files/migration_files/Normas_secundarias/Anexo_documental/Rep%C3%BAblica_Federal_de_Alemania/Suelo/AL-SU-05-FSP.pdf (Accessed January 3, 2025).
85. MEP (Ministry of Environmental Protection of the People's Republic of China). Environmental Quality Standards for Soils (GB15618-2008). Beijing: MEP (2008).
86. FAO/WHO, Food and Agricultural Organization (FAO)/World health organization (WHO). Joint FAO/WHO food standards programme—Codex Alimentarius Commission. Report of the 34th session of the codex committee on food additives and contaminants. Switzerland (2011).
87. Bala R, Das D, Karanveer, Naskar N, and Lahiri S. Vertical distribution and radiological risk assessment of natural radionuclides in the alluvial soil profile of south-west Punjab, India. J Radioanal Nucl Chem. (2022) 331(6):2561–72.
88. Kaur I, Gupta A, Singh BP, Sharma S, and Kumar A. Assessment of radon and potentially toxic metals in agricultural soils of Punjab, India. Microchemical J. (2019) 146:444–54. doi: 10.1016/j.microc.2019.01.028
89. Atafar Z, Mesdaghinia A, Nouri J, Homaee M, Yunesian M, Ahmadimoghaddam M, et al. Effect of fertilizer application on soil heavy metal concentration. Environ Monit Assess. (2010) 160:83–9. doi: 10.1007/s10661-008-0659-x
90. Dewi T, Martono E, Hanudin E, and Harini R. Impact of agrochemicals application on lead and cadmium concentrations in shallot fields and their remediation with biochar, compost, and botanical pesticides. IOP Conf Ser Earth Environ Sci. (2022) 1109(1):012050.
91. Reimann C, Filzmoser P, and Garrett RG. Background and threshold: critical comparison of methods of determination. Sci Total Environ. (2005) 346(1–3):1–16.
92. Salomão GN, Farias DDL, Sahoo PK, Dall’Agnol R, and Sarkar D. Integrated geochemical assessment of soils and stream sediments to evaluate source-sink relationships and background variations in the Parauapebas River Basin, Eastern Amazon. Soil Syst. (2021) 5(1):21.
93. Ma X, Zuo H, Tian M, Zhang L, Meng J, Zhou X, et al. Assessment of heavy metals contamination in sediments from three adjacent regions of the Yellow River using metal chemical fractions and multivariate analysis techniques. Chemosphere. (2016) 144:264–72. doi: 10.1016/j.chemosphere.2015.08.026
94. Wolińska A, Banach A, Szafranek-Nakonieczna A, Stępniewska Z, and Błaszczyk M. Easily degradable carbon - an indicator of microbial hotspots and soil degradation. International Agrophysics. (2010) 32:123–31.
Keywords: vegetable cultivated soil, potentially toxic elements, phosphate fertilizer, ecological health risk, Malwa region
Citation: Sahoo PK, Barman HC, Kumar H, Ngangom L and Chaudhari U (2025) Accumulation of potentially toxic elements in vegetable-cultivated soils from an agri-intensive region of southwest Punjab, India: contamination status and the effect of crop rotation. Front. Soil Sci. 5:1634647. doi: 10.3389/fsoil.2025.1634647
Received: 24 May 2025; Accepted: 18 August 2025;
Published: 01 October 2025.
Edited by:
Gustavo M. Vasques, Embrapa Solos, BrazilReviewed by:
Feng Jing, Zhejiang Agriculture and Forestry University, ChinaPradip Bhattacharyya, Indian Statistical Institute, India
Copyright © 2025 Sahoo, Barman, Kumar, Ngangom and Chaudhari. This is an open-access article distributed under the terms of the Creative Commons Attribution License (CC BY). The use, distribution or reproduction in other forums is permitted, provided the original author(s) and the copyright owner(s) are credited and that the original publication in this journal is cited, in accordance with accepted academic practice. No use, distribution or reproduction is permitted which does not comply with these terms.
*Correspondence: Prafulla Kumar Sahoo, cGsuc2Fob29AY3VwLmVkdS5pbg==