 Gobinath Rajendran1*†
 Vijayakumar Shanmugam1*†
 Aruna Lakshminarayanan2
 Lone Aabid Hussain3Biju Joseph4Vipin Kumar5Anil Kumar Pant6
 Ajith S7Prasad Babu MBB1
 Mahendra Kumar Rapolu1Sundaram Raman Meenakshi1
- 1Division of Crop Production, Indian Council of Agricultural Research (ICAR)-Indian Institute of Rice Research, Hyderabad, India
- 2Department of Soil Science and Agricultural Chemistry, Pandit Jawaharlal Nehru College of Agriculture and Research Institute, Karaikal, Puducherry, India
- 3Sher-e-Kashmir University of Agricultural Sciences & Technology of Kashmir, Srinagar, India
- 4Rice Research Station, Kerala Agricultural University, Moncompu, Kerala, India
- 5Department of Soil Science, Dr. Rajendra Prasad Central Agriculture University, Samastipur, Bihar, India
- 6G.B. Pant University of Agriculture and Technology, Pant Nagar, Uttarakhand, India
- 7Department of Agricultural Statistics, Uttar Banga Krishi Vishwavidyalaya, Cooch Behar, West Bengal, India
To address agricultural challenges like residue burning and excessive inorganic fertilizer use, a two-year (2023–2024) multi-location field experiment was conducted across five diverse Indian agro-ecological zones. Six integrated nutrient management strategies were tested: T1 (100% Recommended Dose of Fertilizers (RDF)), T2 (50% RDF + 50% RDF via residue), T3 (50% RDF + 50% RDF via residue + Pusa decomposer (PD)), T4 (50% RDF via residue + 50% RDF via green manure/green leaf manure), T5 (75% RDF + 25% via residue + PD), and T6 (control). Conventional fertilization (T1) consistently achieved the highest mean grain yield across locations. However, T5 (25% RDF substitution via crop residue) produced statistically comparable yields to T1, even surpassing it by 7.6% at Moncompu. Treatments T2 and T3 generally incurred yield penalties (10–28%), except at Karaikal, where T2 increased yield (+5% in 2023; +11.6% in 2024), due to favorable decomposition conditions. Despite yield trade-offs, T2 and T3 (50% RDF substitution via crop residue) exhibited superior yield stability across locations. Soil nutrient dynamics varied considerably by location and treatment. While T2 and T3 caused partial phosphorus (P) depletion, they consistently improved soil potassium (K) and organic carbon (OC). P buildup was seen in T2/T5 at Karaikal and T1-T5 at Pusa. Similarly, K buildup was seen across most treatments and sites, though K mining was widespread at Pantnagar. Nitrogen (N) and OC showed mixed results, with some treatments leading to accumulation and others depletion. The T6 consistently showed the highest nutrient depletion across all parameters. T1 yielded the highest partial factor productivity of nitrogen (PFP-N) at 47 kg grain/kg N, closely followed by T5 (44 kg grain/kg N). T3 (42.5 kg grain/kg N) was statistically similar to T5, establishing a PFP-N hierarchy of T1 > T5 ≈ T3 > T2 ≈ T4. Grain yield correlated positively with agronomic traits like tiller number, panicle density, and 1000-grain weight, all linked to N and K availability. Thus, co-application of 75% RDF via fertilizers and 25% using crop residues with microbial decomposers (T5) is recommended as a sustainable alternative integrated approach to conventional fertilization.
1 Introduction
Rice is vital for global food security, feeding billions, particularly in Asia. Its cultivation generates substantial by-products, notably rice straw, with global production estimated at approximately 731 million tonnes (MT) annually (1). In India, it is estimated that approximately 180 million tonnes of rice straw are produced annually, of which around 60% is burned in the field (2). Residue generation and burning are particularly high within intensive rice–wheat cropping systems, especially in states as Uttar Pradesh (60 Mt), Punjab (51 MT), and Maharashtra (46 MT) (3). While rice straw has traditionally been utilized for thatching, livestock feed, organic manure, and other agrarian purposes (2). However, the narrow interval between rice harvest and sowing of the subsequent dry-season crops (typically October to November) forced farmers to adopt open-field burning as a quick disposal method. Burning rice straw in-situ facilitates immediate land clearance and faster land drying.
This rice residue burning results in the loss of valuable nutrients contained within the straw, averaging approximately 400 kg carbon, 20-25% of potassium (25 kg K), 90% of nitrogen (5.5 kg N), 20-25% of phosphorus (2.3 kg P), and 60% of sulphur (1.2 kg S) per tonne, and contributes significantly to environmental degradation (3, 4). Furthermore, the burning of one ton of rice straw releases 3 kg of particulate matter, 1,460 kg of carbon dioxide, 60 kg of carbon monoxide, 199 kg of ash, and 2 kg of SO2, thereby exacerbating air pollution and contributing to global warming (5). The modernisation of crop production, driven by high-yielding varieties, has substantially increased residue volumes and associated management challenges (6).
Excess residue removal, coupled with fertiliser overuse aimed at maximizing yields, leads to significant nutrient depletion, soil degradation, undermining long-term productivity and ecological stability (7). Rice-based systems, particularly intensive rice-rice and rice-wheat rotations, are highly nutrient-demanding. Soils develop severe nutrient deficiencies and experience declining quality in the absence of proper nutrient management in these systems (8). Nutrient uptake and mining, especially N and K, are pronounced in the double-cropped rice-rice system compared to mono-cropping or cereal-pulse system (9). For instance, a rice-wheat system yielding 7 t/ha of rice and 5 t/ha of wheat removes over 300 kg N, 30 kg P, and 300 kg K from the soil (10). While optimized nutrient application can reduce mining, e.g., applying 90 kg K2O/ha reduced the K deficit to −99 kg ha-1year-1 compared to split application (7).
Indian agriculture remains heavily dependent on chemical fertilisers and organic manures, with average usage ranging between 120–130 kg ha-1, influenced by various socioeconomic factors (11). Farmers are heavily dependent on low-cost urea (₹245 per 45 kg bag, supplying ~ 20 kg N), leading to unsustainable application levels and skewed NPK ratios (11.8:4.6:1) compared to the recommended 4:2:1, indicating excessive N use relative to P and K (12). Moreover, continuous and excessive synthetic fertilisers in paddy fields lead to low nitrogen use efficiency (NUE). Despite the significant advancement in fertilizer products and application technology, the national average nitrogen recovery efficiency is 42.6%, lower than many upland crops (13). The low NUE results in substantial N losses via ammonia volatilisation, leaching, and fixation, contributing to environmental degradation, nutrient imbalance, and ultimately reduced crop yields (14).
The intensive puddling and use of heavy machinery induce soil compaction and hardpan formation, restricting root growth and impeding nutrient cycling, thereby accelerating soil health deterioration (15). Additionally, continuous mono cropping and frequent soil disturbance under irrigated paddy cultivation contribute to the rapid depletion of soil organic carbon (SOC) and N reserves, further undermining long-term soil productivity and sustainability (16). Sustainable management strategies are needed to address all these problems in rice-based systems. Promising alternatives include residue retention, in-situ incorporation, decomposition, or conversion into value-added products. Among these, in situ retention and incorporation offer significant agronomic benefits (17). Recycling residues through soil incorporation provides a dual advantage: transforming surplus waste into a valuable resource while simultaneously meeting the nutrient requirements of subsequent crops. Studies demonstrated that partial and full retention significantly improved soil health (increasing microbial counts by 47.9–60.4%) and crop productivity (9.8–11.3% higher grain), compared to conventional tillage with residue burning or removal (18).
In subtropical agricultural systems, crop residues are vital for nutrient cycling and maintaining agroecosystem ecological balance. However, farmer adoption of in-situ incorporation remains low due to the extended decomposition period required for stubble (typically 30–60 days; 19), with adoption rates as low as 1% in Punjab’s rice areas (20). To accelerate decomposition within the narrow sowing window, microbial consortia like Pusa decomposer (PD) have been developed, enabling residue breakdown in 20–25 days (21). Moreover, microbial decomposition of cereal residues facilitates slow and steady releases of essential nutrients, approximately 25% of N and P, 50% of S, and 75% of K, for subsequent crop uptake, enrich the soil with organic matter, and reduce the dependency on chemical fertilizers (22).
Consequently, there is a pressing need for integrated, sustainable agronomic practices. Combining crop residues with inorganic fertilizers, potentially accelerated by decomposers and supplemented by green manuring, offers a solution that enables in-situ nutrient recycling while improving grain yield and quality (23). This approach ensures balanced nutrient availability during critical growth periods while simultaneously enhancing soil health, reducing carbon losses, minimizing soil exposure, and decreasing dependence on chemical fertilizers through sustained organic recycling (24).
Therefore, this study hypothesized that partially substituting (25% or 50%) recommended NPK fertiliser input with crop residues could enable more sustainable nutrient management by reducing external inorganic fertilizer requirements while improving soil health and maintaining crop productivity. To test this hypothesis, multi-location trials were conducted with the following objectives, (1) to assess the impact of partially replacing inorganic fertilizers with crop residue (with or without microbial decomposer inoculants) on rice yields and soil health, and (2) to evaluate treatment stability across diverse locations and identify the most consistently effective practices for practical application.
2 Materials and methods
2.1 Study locations
The study was conducted at five strategically selected locations representing major rice-growing agro-ecological zones across India: Khudwani, Jammu & Kashmir (33.7237° N, 75.0916° E; northern zone), Karaikal, Puducherry (10.9504° N, 79.7797° E; southern zone), Moncompu, Kerala (9.4377° N, 76.4284° E; southern zone), Pant Nagar, Uttarakhand (25.9845° N, 85.6742° E; northern zone), and Pusa, Bihar (25.9845° N, 85.6742° E; eastern zone). This selection encompassed key rice cultivation regions in the northern, eastern, and southern parts of the country. This spatial diversity across these sites provided a robust framework for evaluating treatment effects under diverse climatic and edaphic conditions. Prior to trial initiation, composite surface soil samples (0–15 cm depth) were collected from each experimental site and analyzed for key initial physicochemical properties (Table 1). Samples were collected at two key stages: before and after the experiment. For each composite sample, five subsamples were collected from a given plot. A five-point zigzag pattern was used to minimize the impact of spatial variability.
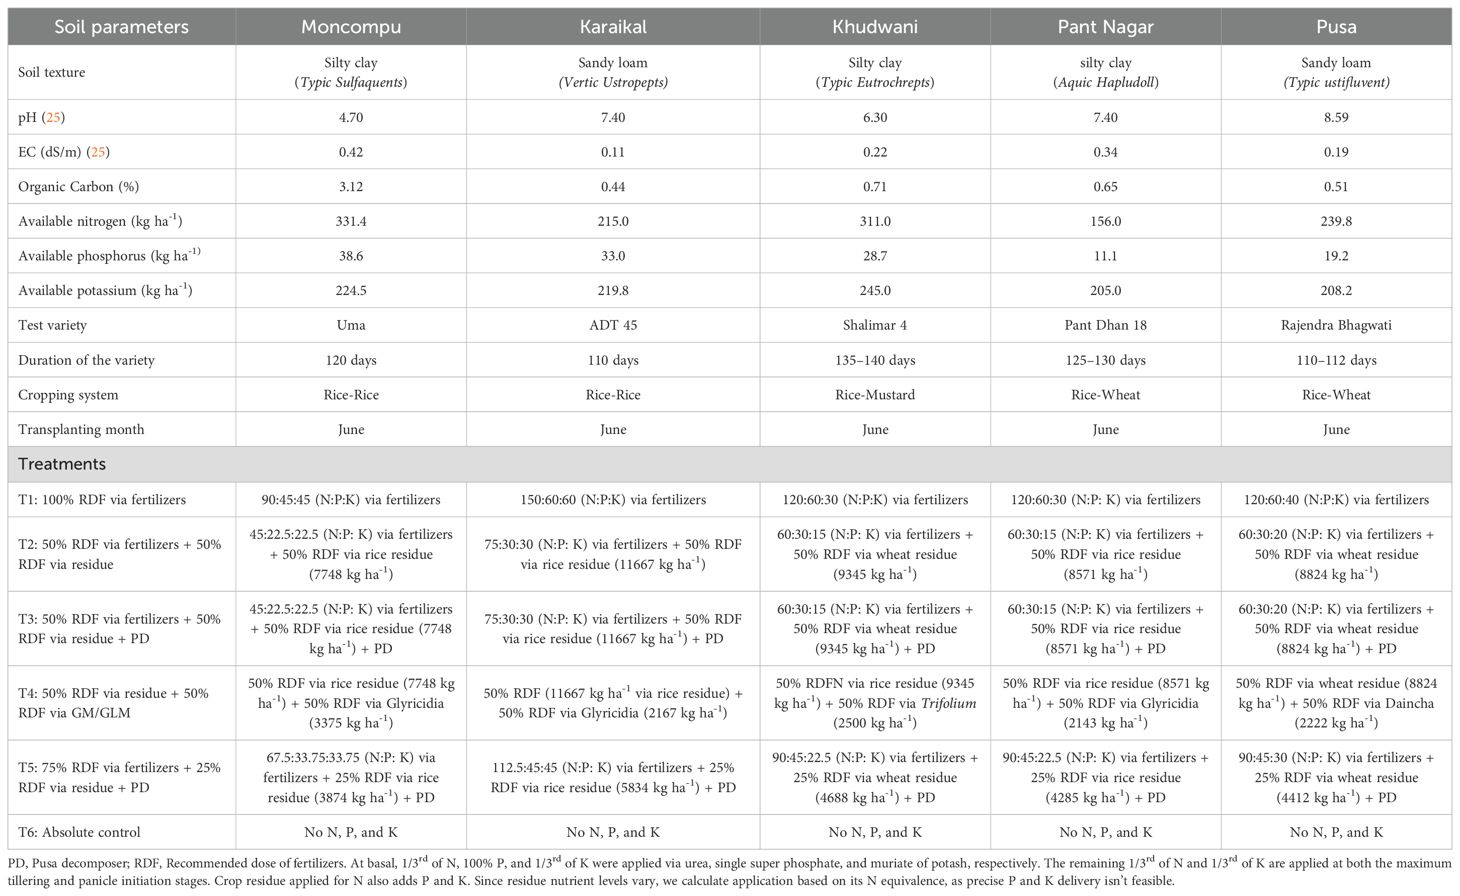
Table 1. Summary of the experimental soil characteristics and treatment details.
2.2 Climate and weather profile of the study sites
The climate of the study sites ranges from temperate (Khudwani), sub-tropical (Moncompu, Karaikal, and Pant Nagar), and tropical (Pusa). Mean maximum temperature, minimum temperature, and cumulative rainfall during the crop growth period are depicted in Figure 1.
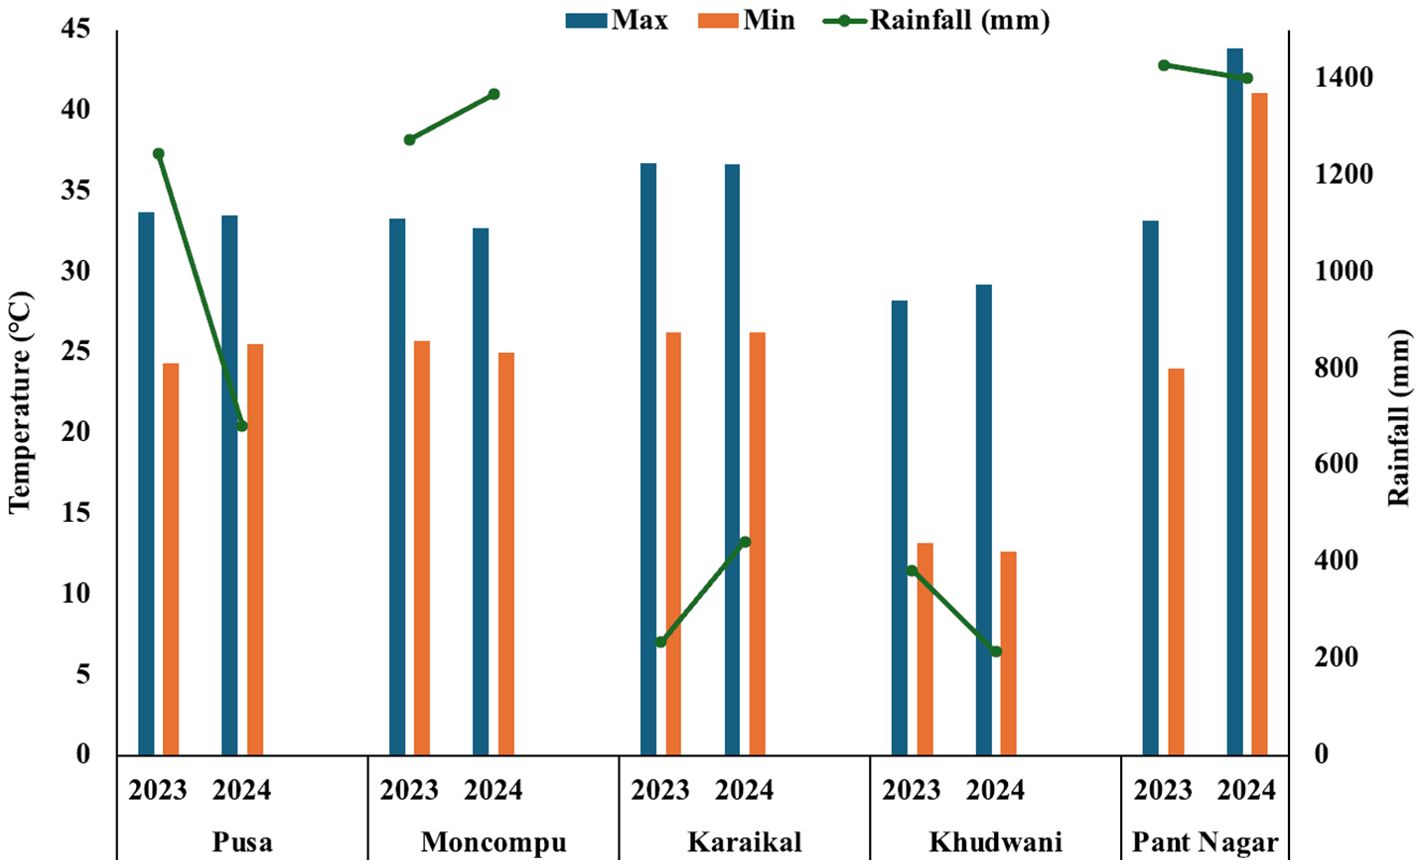
Figure 1. Mean maximum temperature, minimum temperature, and cumulative rainfall during the crop season of 2023 and 2024 across the study locations.
2.3 Experimental details
Field experiments were conducted during two consecutive wet seasons (2023 and 2024) across the five study locations. The experimental design was a randomized block design with six treatments. Treatments comprised varying fertiliser levels (50%, 75%, and 100% RDF) combined with crop residue incorporation (equivalent to 25% and 50% of the recommended dose of fertilizers) and/or green manure (GM)/green leaf manure (GLM). The specific treatments were T1 - 100% RDF via fertilizers, T2 - 50% RDF via fertilisers + 50% RDF via residue, T3 - 50% RDF + 50% RDF via residue + PD, T4 - 50% RDF via residue + 50% RDF via GM/GLM, T5- 75% RDF via fertilisers + 25% RDF via residue + PD, and T6 - absolute control. Detailed descriptions of all treatments and the initial characteristics of each location are provided in Tables 1 and 2.
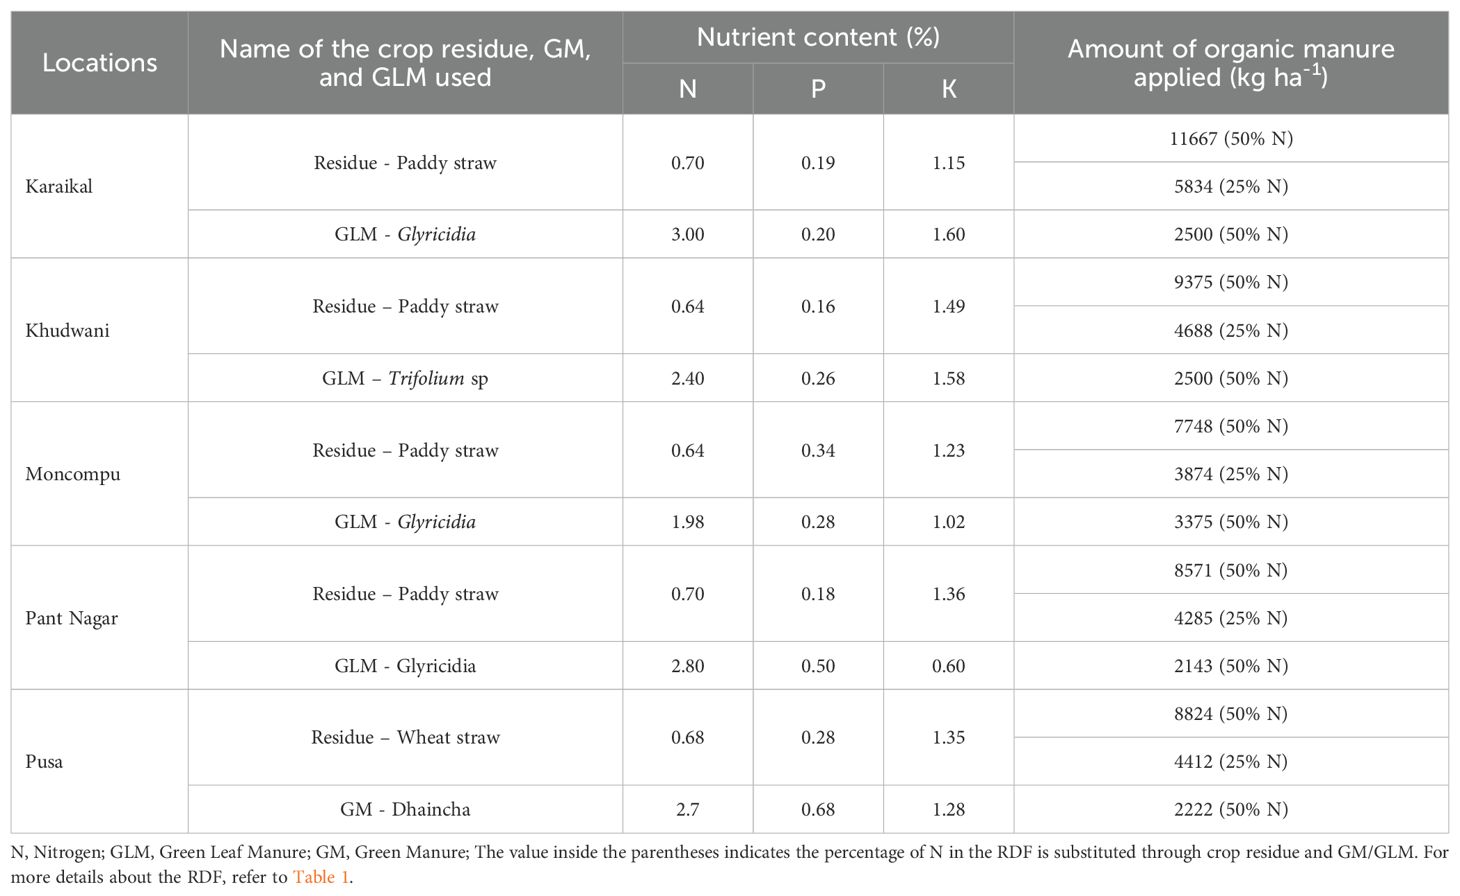
Table 2. Nutrient status of residue and green manures used in the study.
2.4 Cultural practices
Rice seedlings (25–30 days old) were transplanted at a spacing of 20 × 15 cm, with 2–3 seedlings per hill, across all study locations. The most common rice cultivar in each study location is utilized for experimental purposes. For details about the rice cultivar used in the study, refer to Table 1. The RDF varied by study location, adhering to state-specific recommendations. Moncompu received the lowest RDF, while Karaikal received the highest. Detailed RDF values for each location, along with their application intervals, are presented in Table 1. N, P, and K were supplied as urea, single super phosphate (SSP), and muriate of potash (MOP), respectively. Crop residues were incorporated into the soil at N-equivalent rates specific to each treatment.
Wider bunds and a water channel as a buffer zone measuring 1 m in length were used to separate the individual plots. This prevented the treatments from mixing and avoided cross-contamination or nutrient leaching between plots. Aerobic conditions were maintained in the field during the mid-tillering and panicle initiation stages to optimize N fertilizer application. All other agronomic management practices, including weed management, irrigation, and insect pest and disease control, followed the standard state recommendations for each respective location. Irrigation was applied manually to each experimental plot, with great care taken to prevent over-irrigation, nutrient leaching, and water movement between plots. The bunds separating the individual treatments were periodically plastered with mud to ensure an effective barrier against water flow between treatments.
2.5 Residue incorporation
The measured quantity of rice straw for each treatment was uniformly spread across the designated plots. Subsequently, the straw was incorporated into the soil via human foot treading after the final land preparation and three days before the transplanting of rice seedlings (Figure 2). The same procedure was followed for GM and GLM. Glyricidia sepium is used as GLM in Karaikal, Moncompu, and Pantnagar, while Trifolium is used in Khudwani and Sesbania aculeata (Daincha) in Pusa. The total quantity of crop residue incorporated in each treatment, along with its N content, was provided in Tables 1 and 2. To mitigate the risk of N immobilization associated with microbial decomposition of high-carbon rice residue, 50% of the recommended N dose was applied basally just before transplanting. It is assumed that this strategy will ensure adequate early-season N availability for both crop establishment and microbial activity.
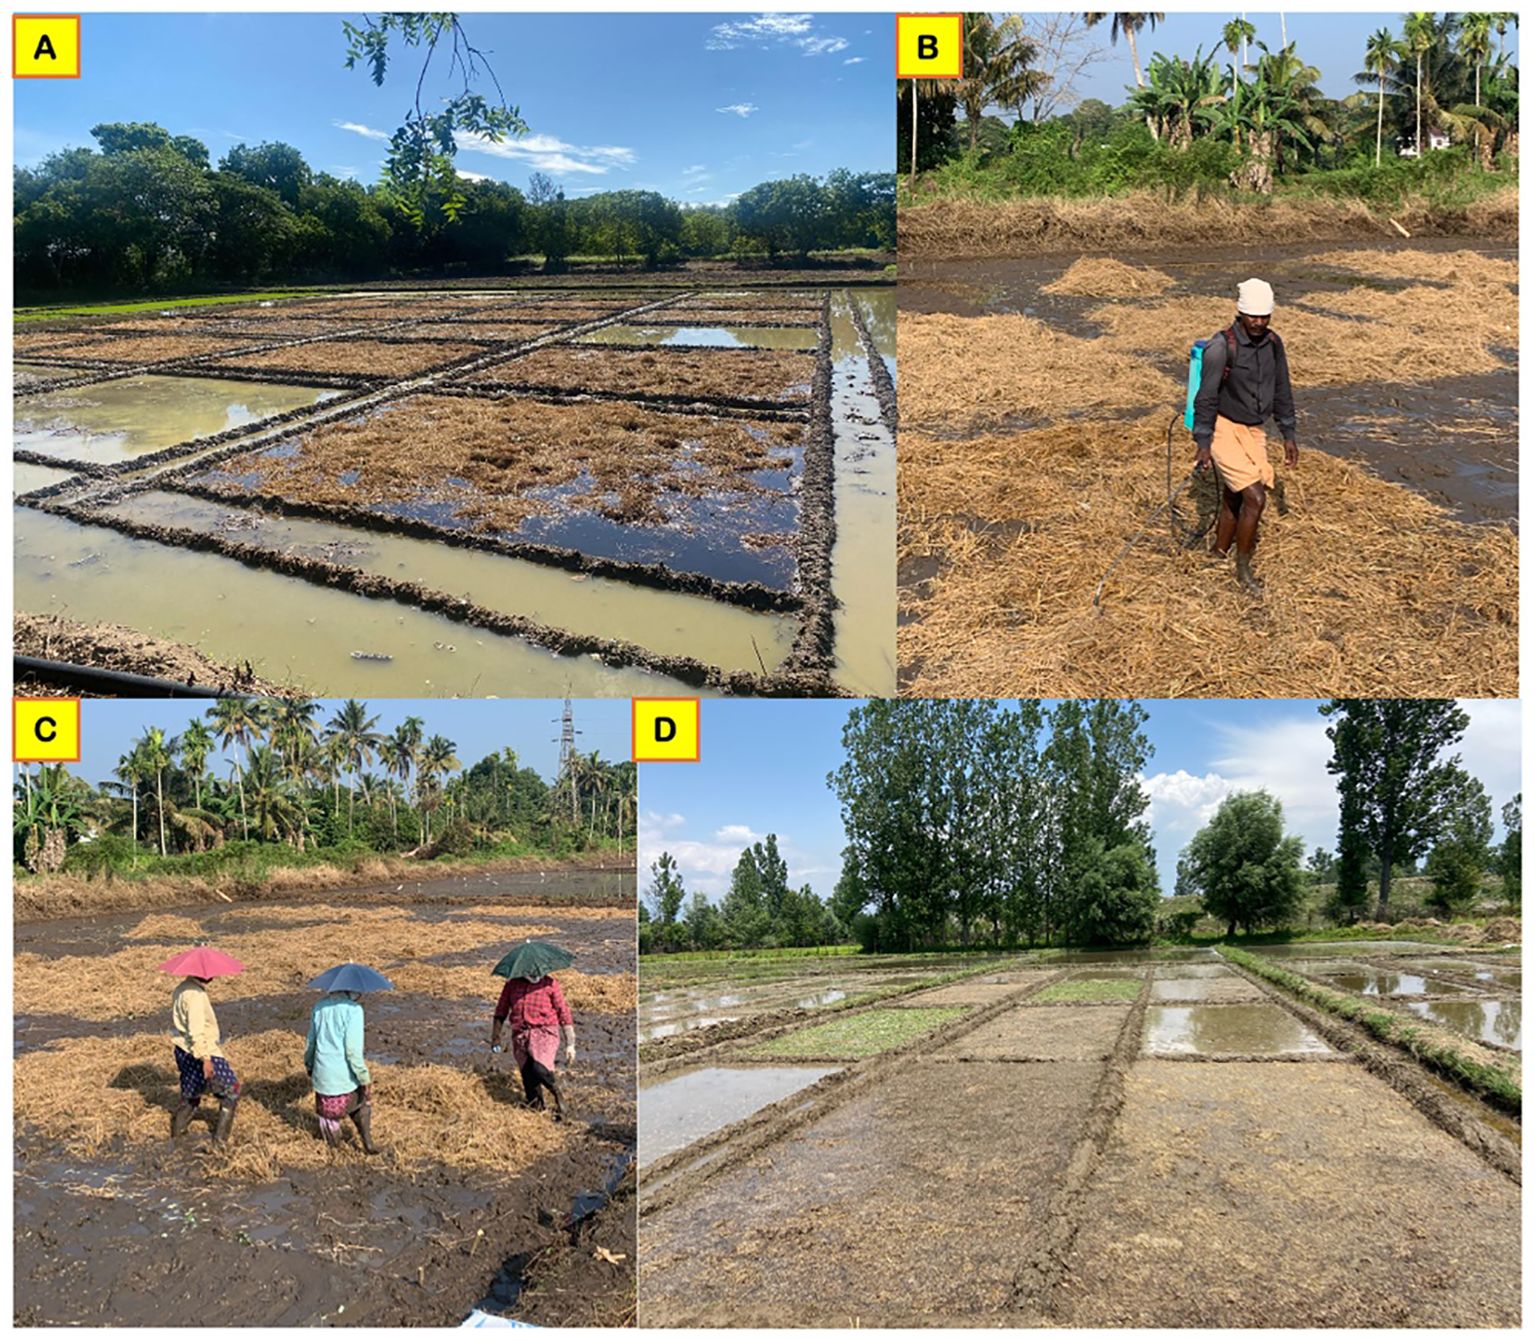
Figure 2. Experimental field setup for rice straw decomposition trials. (A) Manual spreading of rice straw in a designated treatment plot at the Karaikal station. (B) Pusa decomposer spray on rice straw at the Moncompu station. (C) Treading of rice straw after Pusa decomposer application at the Moncompu station. (D) General experimental plot view at the Khudwani station.
2.6 Preparation of pusa decomposer inoculum and application
The PD developed by the Division of Microbiology, ICAR - Indian Agricultural Research Institute (ICAR-IARI), New Delhi, is a fungal consortium that accelerates straw decomposition through the enzymatic breakdown of cellulose, lignin, and pectin (26). The PD solution was prepared as follows: 150 g of jaggery was dissolved in 5 L of boiled water and filtered through a sieve to remove impurities. After cooling, 50 g of chickpea flour was added to the solution. Four PD capsules were inoculated into the mixture. The solution was covered with a muslin cloth and incubated at ambient temperature (25–30 °C) for 10 days (Figure 3). The resulting culture was diluted with 100 L of water to prepare the final inoculum. The diluted inoculum was uniformly sprayed onto straw residue at a rate of 80 L per tonne using a manual knapsack sprayer with a spray nozzle (delivery point) maintained approximately 50 cm above the ground to prevent spray drift (Figure 2). Residues were incorporated after three days of application.
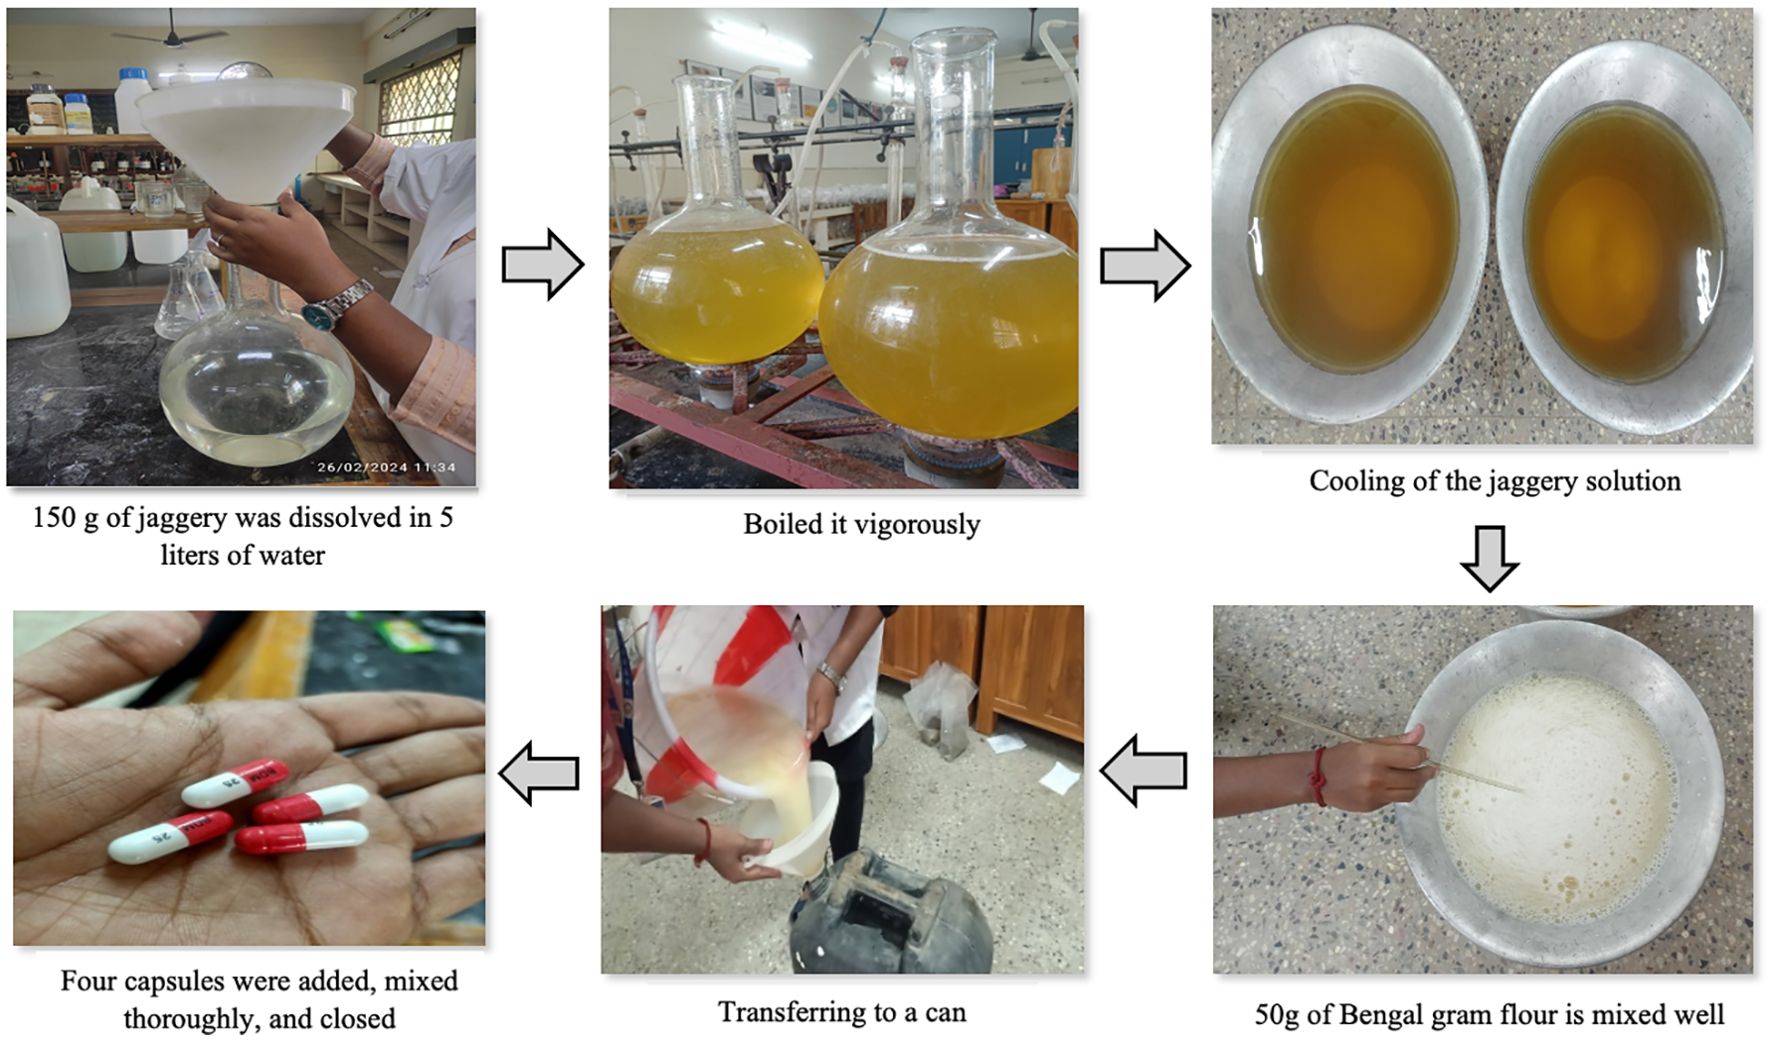
Figure 3. Pusa decomposer solution preparation.
2.7 Yield attributes and yield measurement
Yield attributes (tiller/m2 and panicle number/m2) were recorded from the specified area (1 m2) of each plot (30 m2). Representative fully developed plants were selected from each treatment for recording filled grain per panicle manually. Grain and straw yields were estimated in net plot areas, and plants were cut at 15 cm above the ground level. The crop was harvested at physiological maturity, determined by a grain moisture content reaching approximately 14–16%. Harvested plants were subsequently sun-dried for 3–4 days before threshing. After threshing, grain yield was weighed separately (~ 14% moisture content) and expressed in kg ha-1. The straw samples were dried in a hot-air oven at 70 °C for 72 hrs, and subsequently, straw yield was measured and expressed in kg ha-1. Also, the sample for thousand-grain weight is collected from each plot, weighed using a grain counter (A-Square, Ambala Associates, Haryana, India), and expressed in grams.
2.8 Soil sampling and analysis
Composite soil samples were collected immediately after harvest from the experimental sites at a depth of 0–15 cm for the analysis of the soil physicochemical properties. Collected samples were air dried at room temperature (25–28 °C), gently crushed, and sieved (< 2 mm) to remove gravel and plant debris. The processed samples were analyzed for key physicochemical parameters like pH and EC (1:2.5 ratio) using pH and EC meter; SOC using 1 N K2Cr2O7 (27), available N using Kjeldhal method (28), available P using Bray-1 method (29) at Momcompu and blue colour method (30) at other locations, and available K using ammonium acetate method (25).
2.9 Plant sample analysis
Harvested grain and straw samples were dried and ground using a high-speed blender. N content of straw and grain was determined through the macro-Kjeldahl method. Precisely, 0.5 g of finely ground grain and straw samples were digested separately with 10 mL of concentrated H2SO4. and a catalyst mixture in Kjeldahl digestion tubes until clear. The digest was then subjected to steam distillation using the Kelplus instrument, where liberated ammonia was captured in boric acid. Finally, the collected ammonia was quantified by titration with a standard acid, with a reagent blank included for accuracy. P and K in the grain and straw samples were analysed after wet digestion using a di-acid mixture (HNO3: HClO4 in the ratio of 4:1). For P, the digested aliquot was reacted with a vanadomolybdate solution. The absorbance of the resulting yellow phospho-vanadomolybdate complex was then measured at 470 nm using a visible spectrophotometer. K content in the digested extracts was determined using a flame photometer.
2.10 Partial factor productivity
The partial factor productivity of N (PFPN) was calculated using the formula below and expressed as kg grain/kg N applied. While calculating the N input, both fertilizer N and organic N via crop residue and GM/GLM were summed together in each treatment.
2.11 Statistical analysis
2.11.1 Treatment comparison
The effects of different treatments on rice grain yield, straw yield, and yield attributes including number of tillers, number of panicles, 1000-grain weight as well as N, P, and K content in both grain and straw, and N and OC content in soil, were evaluated using one-way analysis of variance (ANOVA). At first, the consistency of treatment effects across years for each response variable in each location was tested using an ANOVA model by including Treatment x Year as a factor. If the Treatment x Year interaction was found to be non-significant, a pooled analysis was conducted by averaging treatment values over two years. If the interaction was significant, analyses were performed separately for each year. Upon establishing statistical significance, treatment means were compared using Duncan’s Multiple Range Test (DMRT) at the 5% significance level (31).
2.11.2 Stability of treatments across locations and years
The stability of treatment performance across locations over the years was assessed using the Additive Main Effects and Multiplicative Interaction (AMMI) model (32). The AMMI Stability Value (ASV), which quantifies the stability of each treatment over location and years, was calculated using the following formula
where,
IPCA1 score is score of the treatment on the first interaction principal component axis.
IPCA2 score is score of the treatment on the second interaction principal component axis.
SSIPCA1 and SSIPCA2 are the sums of squares for IPCA1 and IPCA2, used to weight the contribution of each axis.
A lower AMMI Stability Value (ASV) indicates greater stability of a treatment across locations and years, whereas a higher ASV reflects greater instability and stronger environmental influence. Additionally, an AMMI biplot was generated, where stable treatments are located near the origin, indicating minimal interaction with the environment.
2.11.3 Treatment-wise influence of yield attributes and soil parameters on yield
Since each treatment involved different levels of nutrients and organic amendments, the empirical relationships between yield, yield attributes, grain and straw nutrient content, and soil parameters were expected to vary across treatments. Therefore, a treatment-wise analysis was conducted to assess how soil and nutritional parameters differentially influenced grain yield. These relationships were visualized using correlation heatmaps for each treatment. To further explore these associations, Partial Least Squares Regression (PLSR) was employed to explore these associations and identify which yield components and soil factors were most strongly linked to yield within each treatment. Unlike Principal Component Analysis (PCA), which focuses solely on maximizing variance within the predictor matrix (X), PLSR simultaneously decomposes both the predictor (X) and response (Y) matrices to extract components that maximize their shared covariance (33).
PLSR biplots were constructed using the first two PLSR components, which are expected to capture the majority of variation in the data. These components were plotted along the x-axis and y-axis, respectively. Variables positioned close to the vector of the response variable grain yield (GY) with an acute angle were interpreted as positively associated with yield. In contrast, variables forming an angle greater than 90° with the yield vector are negatively associated, while those oriented at approximately 90° exhibit little to no correlation with yield. Additionally, bivariate trade-off plots were used to visualize the relationships between yield and key nutrient parameters, specifically grain N and K, and straw N and K, highlighting the comparative performance of each treatment in achieving both high yield and enhanced nutrient content.
2.11.4 Magnitude of change in soil parameters due to treatment
We extended our analysis using a Bayesian hierarchical posterior probability model to quantify the magnitude of change in soil N, P, K, and OC in each treatment over the 100% RDF for each location. Treatment was modeled as a fixed effect and year and replication (nested within year) were included as random intercepts to account for experimental hierarchy. Informative priors assigned were Normal (0, 10) for fixed effects and Normal (0, 5) for random effects. Four Markov Chain Monte Carlo (MCMC) chains were run per model, each with 2000 iterations (including 1000 warm-up iterations). Convergence of posterior samples was assessed using the potential scale reduction factor (), with values below 1.00 indicating satisfactory convergence.
The 100% RDF (T1) was used as the reference treatment, and the marginal effects of other treatments over RDF were estimated along with 95% confidence intervals. If the confidence interval for a treatment’s effect contains zero, it indicates that the effect is not significantly different from the T1. Conversely, if the interval does not include zero, the effect is considered statistically significant. Further, the probability that the soil N, P, K, and OC in each treatment is greater than RDF is calculated using the model. The posterior probability that a given treatment T2 performs better than RDN, given the observed data, was derived as
where, and be the estimated effects of RDN and T2.
The percent change in soil N, P, K, and OC from before sowing of the crop in 2023 and after crop harvest in 2024 is calculated for each location as follows,
2.11.5 Statistical software used
All statistical analyses were conducted using R software (version 4.4.3; 34). The ‘agricolae’ package was used to perform ANOVA, DMRT, and AMMI model (35). Correlation heatmaps were generated using the ‘corrplot’ package (36), while PLSR analysis was carried out using the ‘pls’ package (37). A Bayesian hierarchical posterior model was implemented using the ‘brms’ package (38). All visualizations were created using the ‘ggplot2’ package (39).
3 Results
3.1 Effect of N substitution via crop residue on yield attributes
3.1.1 Tiller count
The number of tillers per m2 was significantly influenced by the nutrient management treatments with notable interactions between treatment and location. No significant yearly variation occurred in Karaikal, Moncompu, Pusa, Khudwani, or Pantnagar, allowing pooled analysis of these sites (Table 3). Across all locations, T1 (100% RDF via inorganic fertilisers) produced the highest tiller counts except Karaikal. T1 performance was statistically comparable to T5 (75% RDF via inorganic fertilisers + 25% RDF via crop residue + PD) at all sites except Pusa where it was registered as second-highest tiller count. Notably, T1 also matched T3 (50% RDF via inorganic fertilisers + 50% RDF via crop residue + PD) and T4 (50% RDF via crop residue + 50% RDF via GM/GLM) in Karaikal and Moncompu, though no significant differences emerged among treatments in Karaikal. While T3 produced statistically on par tiller count with T1 in Karaikal, while it yielded significantly lower tiller counts in Khudwani, and Pantnagar. The control (T6) treatment consistently recorded the lowest values across all locations and years.
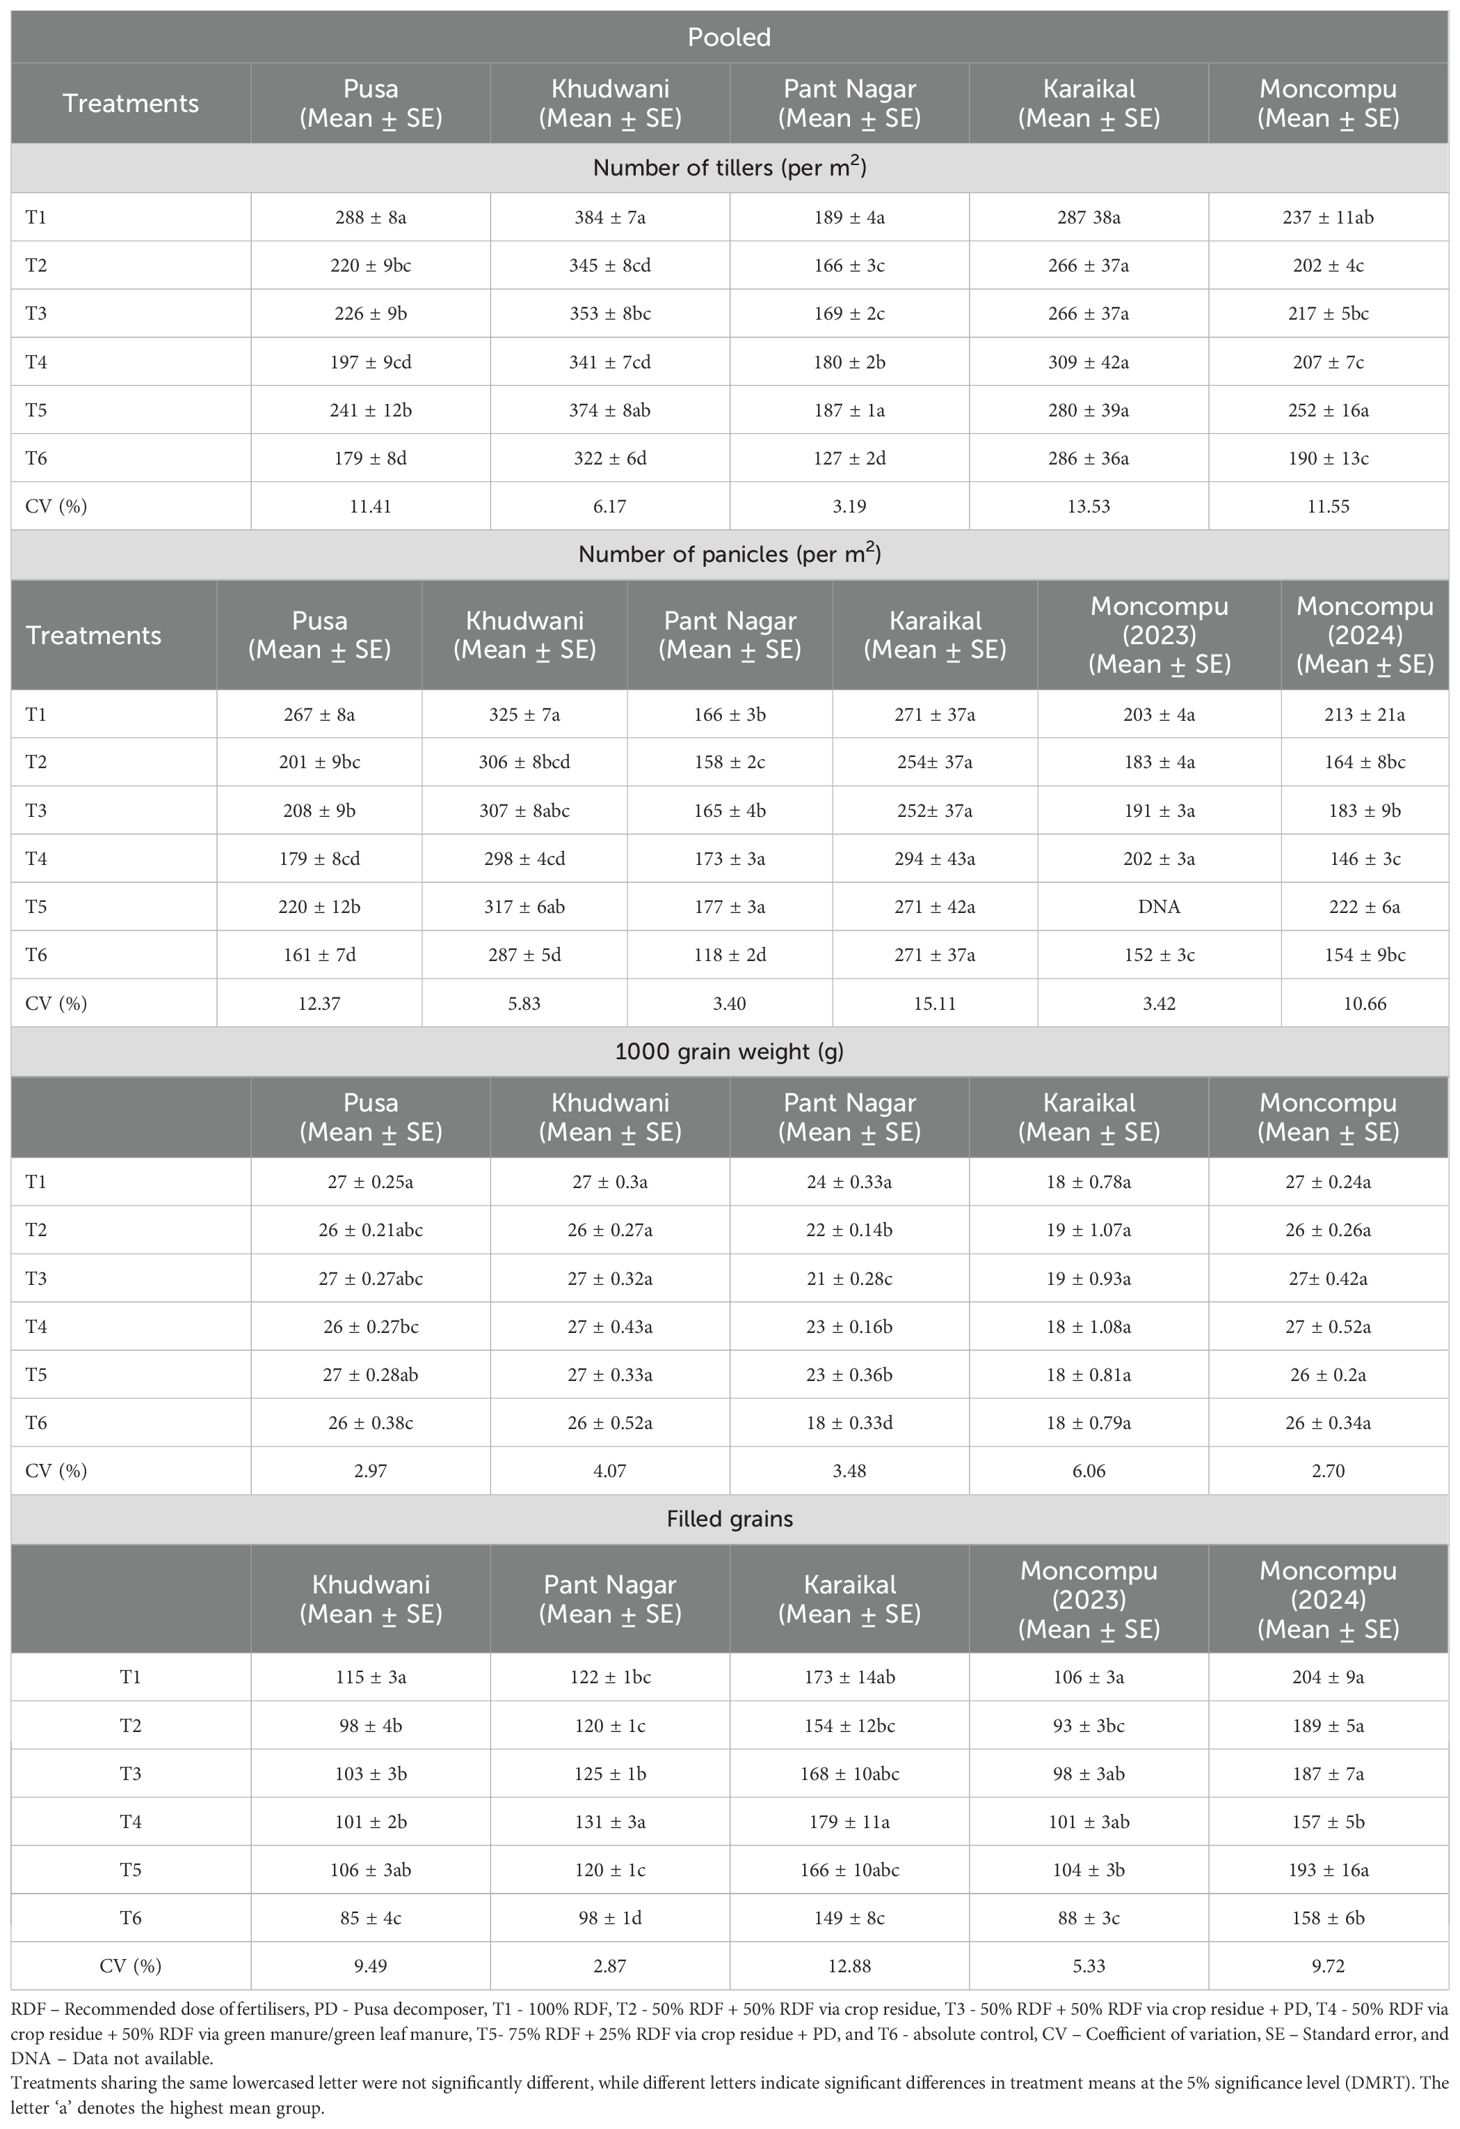
Table 3. Effect of different nutrient management practices on yield parameters of rice across various locations.
3.1.2 Panicle count
Panicle density largely followed the trend observed in tiller counts, with T1 and T5 consistently producing the highest value across most locations. Notably, T5 recorded the highest number of panicle at Pantnagar (177 ± 3 panicle per m2), statistically outperforming other treatments except T4, which included GLM. In Moncompu, results differed significantly across years, necessitating individual annual analysis. In contrast, pooled analysis was appropriate for Pusa, Karaikal, Khudwani, and Pantnagar due to non-significant inter-annual variation (Table 3). Panicle counts mirrored tiller trends, with T1 (100% RDF) yielding the highest panicle count at Pusa and Khudwani. In Khudwani, T1 remained statistically comparable to T3 (50% RDF + 50% RDF through crop residue + PD) and T5 (75% RDF + 25% RDF through crop residue + PD). Conversely, at Pusa, T1 significantly exceeded all other treatments (Table 3). At Pantnagar, T5 recorded the highest panicle counts and remained on par with T4 (50% RDF via crop residue + 50% RDF via GLM). At Karaikal, treatments showed no significant difference. Moncompu exhibited distinct annual variation. In 2023, T4 (50% crop residue + 50% GLM) performed equivalently to T1. By 2024, T5 generated the highest panicle counts, statistically indistinguishable from T1. The absolute control consistently produced the lowest panicle count across all locations.
3.1.3 1000-grain weight
Thousand-grain weight did not differ significantly among treatments at Khudwani, Karaikal, and Moncompu, indicating a minimal influence of nutrient substitution on seed mass under these conditions. However, at Pusa and Pantnagar, T1 (100% RDF) recorded the highest mean grain weights (27 ± 0.25 g and 24 ± 0.33 g, respectively), significantly surpassing the control (T6: 26.0 ± 0.38 g at Pusa; 18.0 ± 0.33 g at Pantnagar). The lower grain weight under T6 suggests poor nutrient availability at critical grain filling stages. The second-highest weights were recorded for T4 (50% RDF via crop residue + 50% RDF via GLM) and T5 (75% RDF + 25% RDF via residue + PD).
3.1.4 Filled grains
Filled grains per panicle was significantly influenced by the nutrient treatments. In Moncompu, results differed significantly across years, necessitating individual annual analysis. Conversely, no significant yearly variation occurred in Khudwani, Pantnagar, and Karaikal, allowing pooled analysis of these sites (Table 3). Substitution of 50% of the N through GLM and the remaining 50% through crop residue (T4) was effective at Karaikal and Pantnagar, recording 179 and 131 filled grains per panicle, respectively (Table 3). In Karaikal, T4 remained on par with T5. While in Khudwani and Moncompu, T1 (100% RDF) recorded the highest number of filled grains per panicle. In Khudwani, T1 remained on par with T5 (75% RDF + 25% RDF via residue + PD). At Moncompu, the 100% RDF (T1) consistently delivered the highest performance across both years, and it remained on par with T4 in 2023 and T2, T3, and T5 in 2024, indicating potential temporal adaptation in residue decomposition. The lowest filled grain count per panicle was recorded under absolute control (T6) across all locations, underscoring the importance of nutrient supplementation.
3.2 Effect of different nutrient management strategies on straw and grain yield
3.2.1 Grain yield
N substitution through residue incorporation and green manuring practices had a significant influence on the grain yield of rice across locations. In Moncompu, results differed significantly across years, necessitating individual annual analysis. Conversely, no significant yearly variation occurred in Pusa, Khudwani, Karaikal, and Pantnagar, allowing pooled analysis of these sites (Figure 4). Results indicated that the application of 100% RDF (T1) consistently resulted in the highest grain yields at Pusa (5440 kg ha-1), Khudwani (7454 kg ha-1) and Pantnagar (4238 kg ha-1), and remained statistically on par with T5 (75% RDF + 25% RDF via residue with PD) with the yield levels of 5140, 7344 and 3794 kg ha-1, respectively. In Moncompu, higher grain yield was recorded in 100% RDF treatment (5213 and 7035 kg ha-1 in 2023 and 24, respectively) over other treatments. In 2023, no significant differences were observed among T1 to T4 treatments. On the contrary, the absolute control (T6) recorded the lowest yields across all locations.
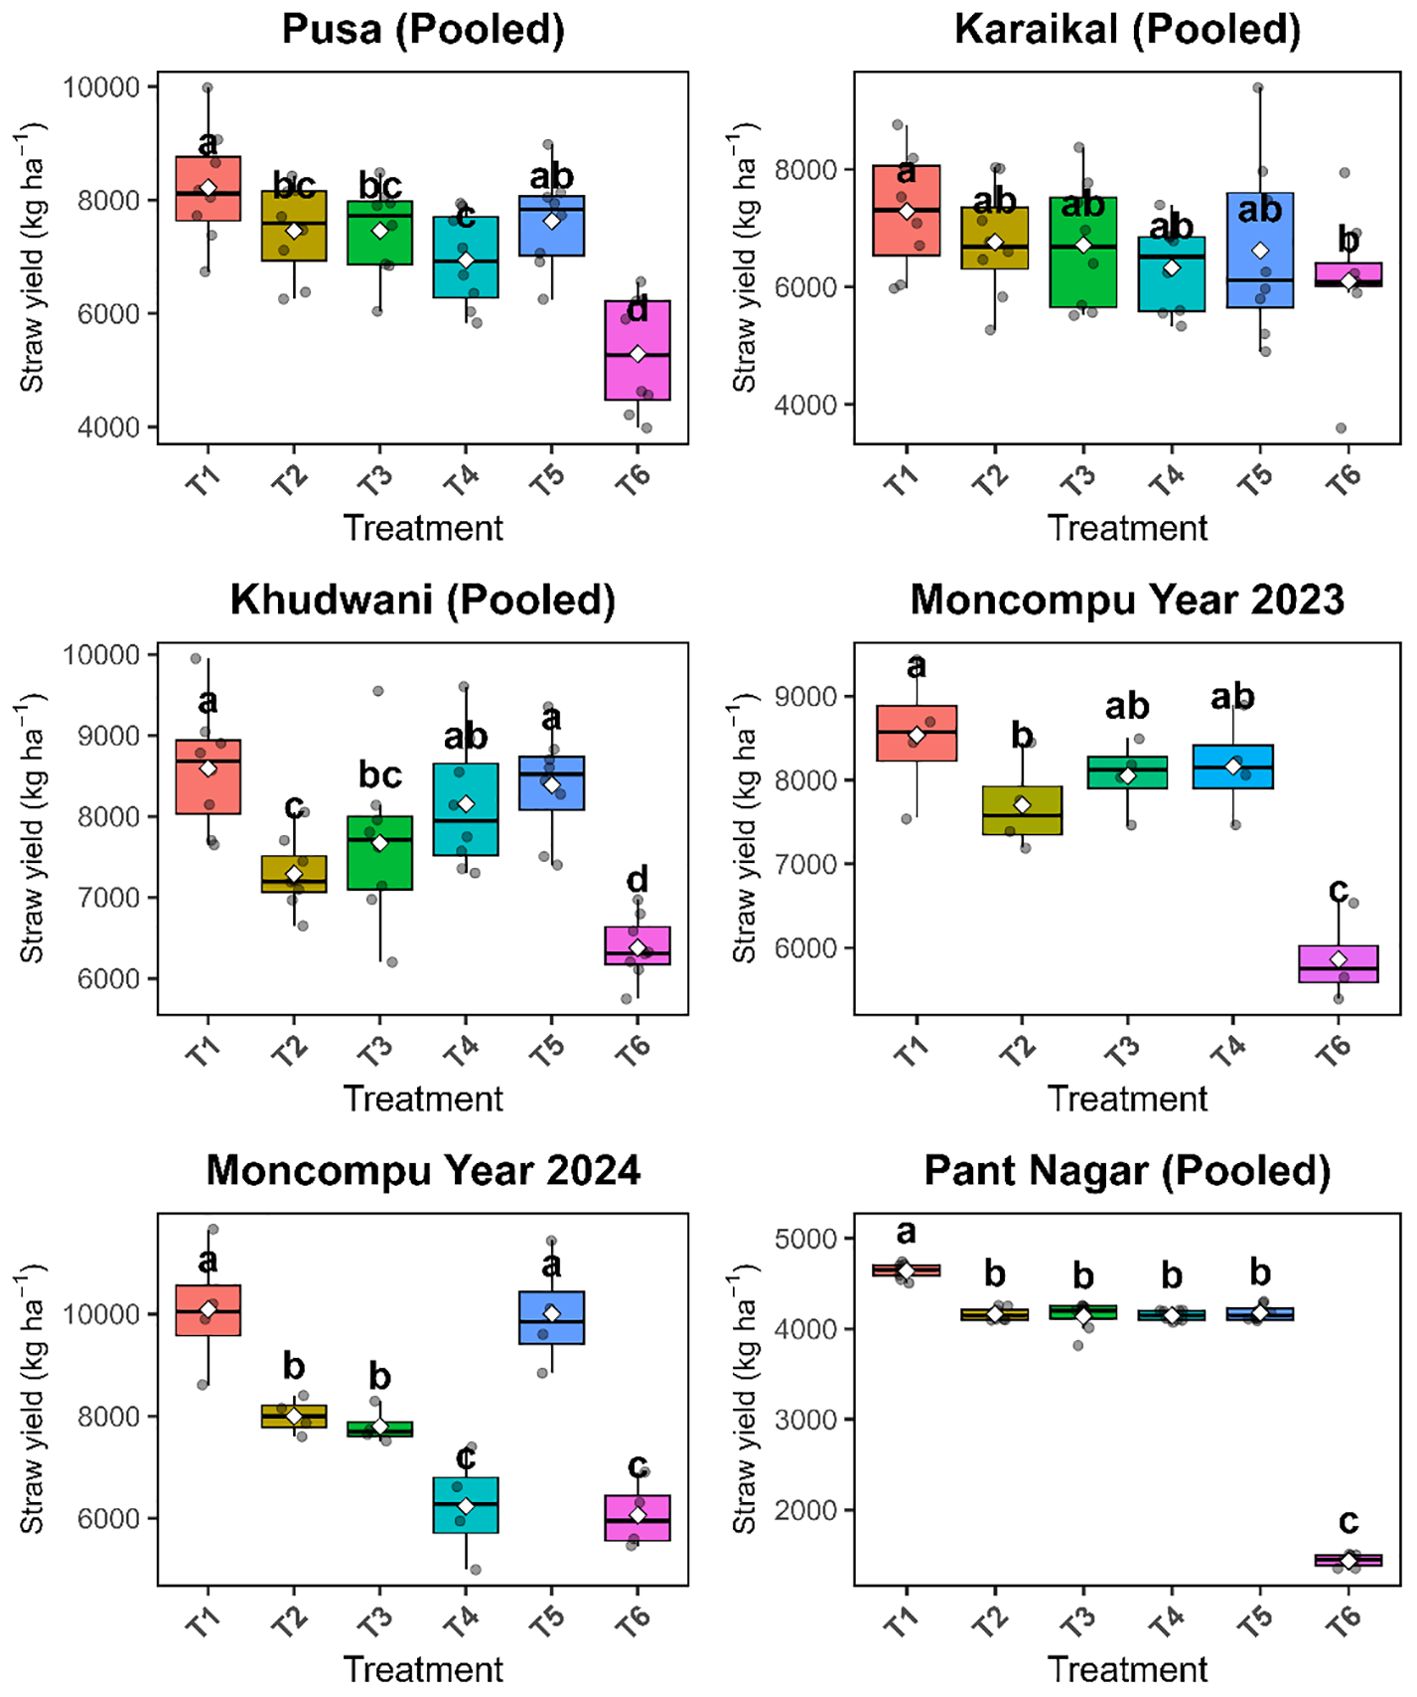
Figure 4. Effect of crop residue, pusa decomposer (PD), and green manure-based N substitution on the grain yield of rice. T1 - 100% recommended dose of fertilizer (RDF), T2 - 50% RDF + 50% RDF via crop residue, T3 - 50% RDF + 50% RDF via crop residue + PD, T4 - 50% RDF via crop residue + 50% RDF via green manure/green leaf manure, T5- 75% RDF + 25% RDF via crop residue + PD, and T6 - absolute control. Treatments sharing the same lowercased letter were not significantly different, while different letters indicate significant differences in treatment means at the 5% significance level (DMRT). The letter ‘a’ denotes the highest mean group.
Treatment T1 yielded significantly higher than the other treatments. Notably, T5 led to yield declined at Pusa (-1.5%), Khudwani (-5.8%), and Pantnagar (-12.6%). However, replacing 50% of N with residue in T2 and T3 resulted in notable yield penalties across locations: -28% and -15% at Pantnagar, -13.2% and -14.5% at Khudwani, and -13.2% and -10.1% at Pusa, respectively over T1. In Moncompu, T5 achieved the superior yield (6630 kg ha-1), and it remained statistically on par with T1. In contrast, an intermediate yield response was observed with 50% N substitution through residue, with or without the addition of PD (T2: 5138 and T3: 5255 kg ha-1). At Karaikal, T2 (50% RDF via urea + 50% RDF through residue) recorded the highest yield (4091 kg ha-1), which was 8% higher than T1, though statistically similar to all treatments except the control.
3.2.2 Straw yield
The N substitution through residue and green manuring had a significant influence on the straw yield of rice across locations. The yearly variations are non-significant across all sites, allowing pooled analysis of the data (Figure 5). The 100% RDF treatment (T1) consistently achieved the highest straw yields at Pusa (8221kg ha-1), Khudwani (8593 kg ha-1), Pantnagar (4638 kg ha-1), and Karaikal (7288 kg ha-1), and it remained on par with T5 in all the locations except Pant Nagar. The treatments containing 50% residue (T2 and T3) exhibited a reduction in yield compared to T1 across all locations. The decline was observed as follows: -10% at Pusa; -15% at Khudwani; -8% at Karaikal; and -11% at Pantnagar. At Moncompu, the yield reduction varied between years, recorded at -14%% in 2023, and -2% and -10% in 2024. The absolute control (T6) consistently recorded the lowest yields across all locations, ranging from 1435 kg ha-1 at Pantnagar to 6378 kg ha-1 at Khudwani.
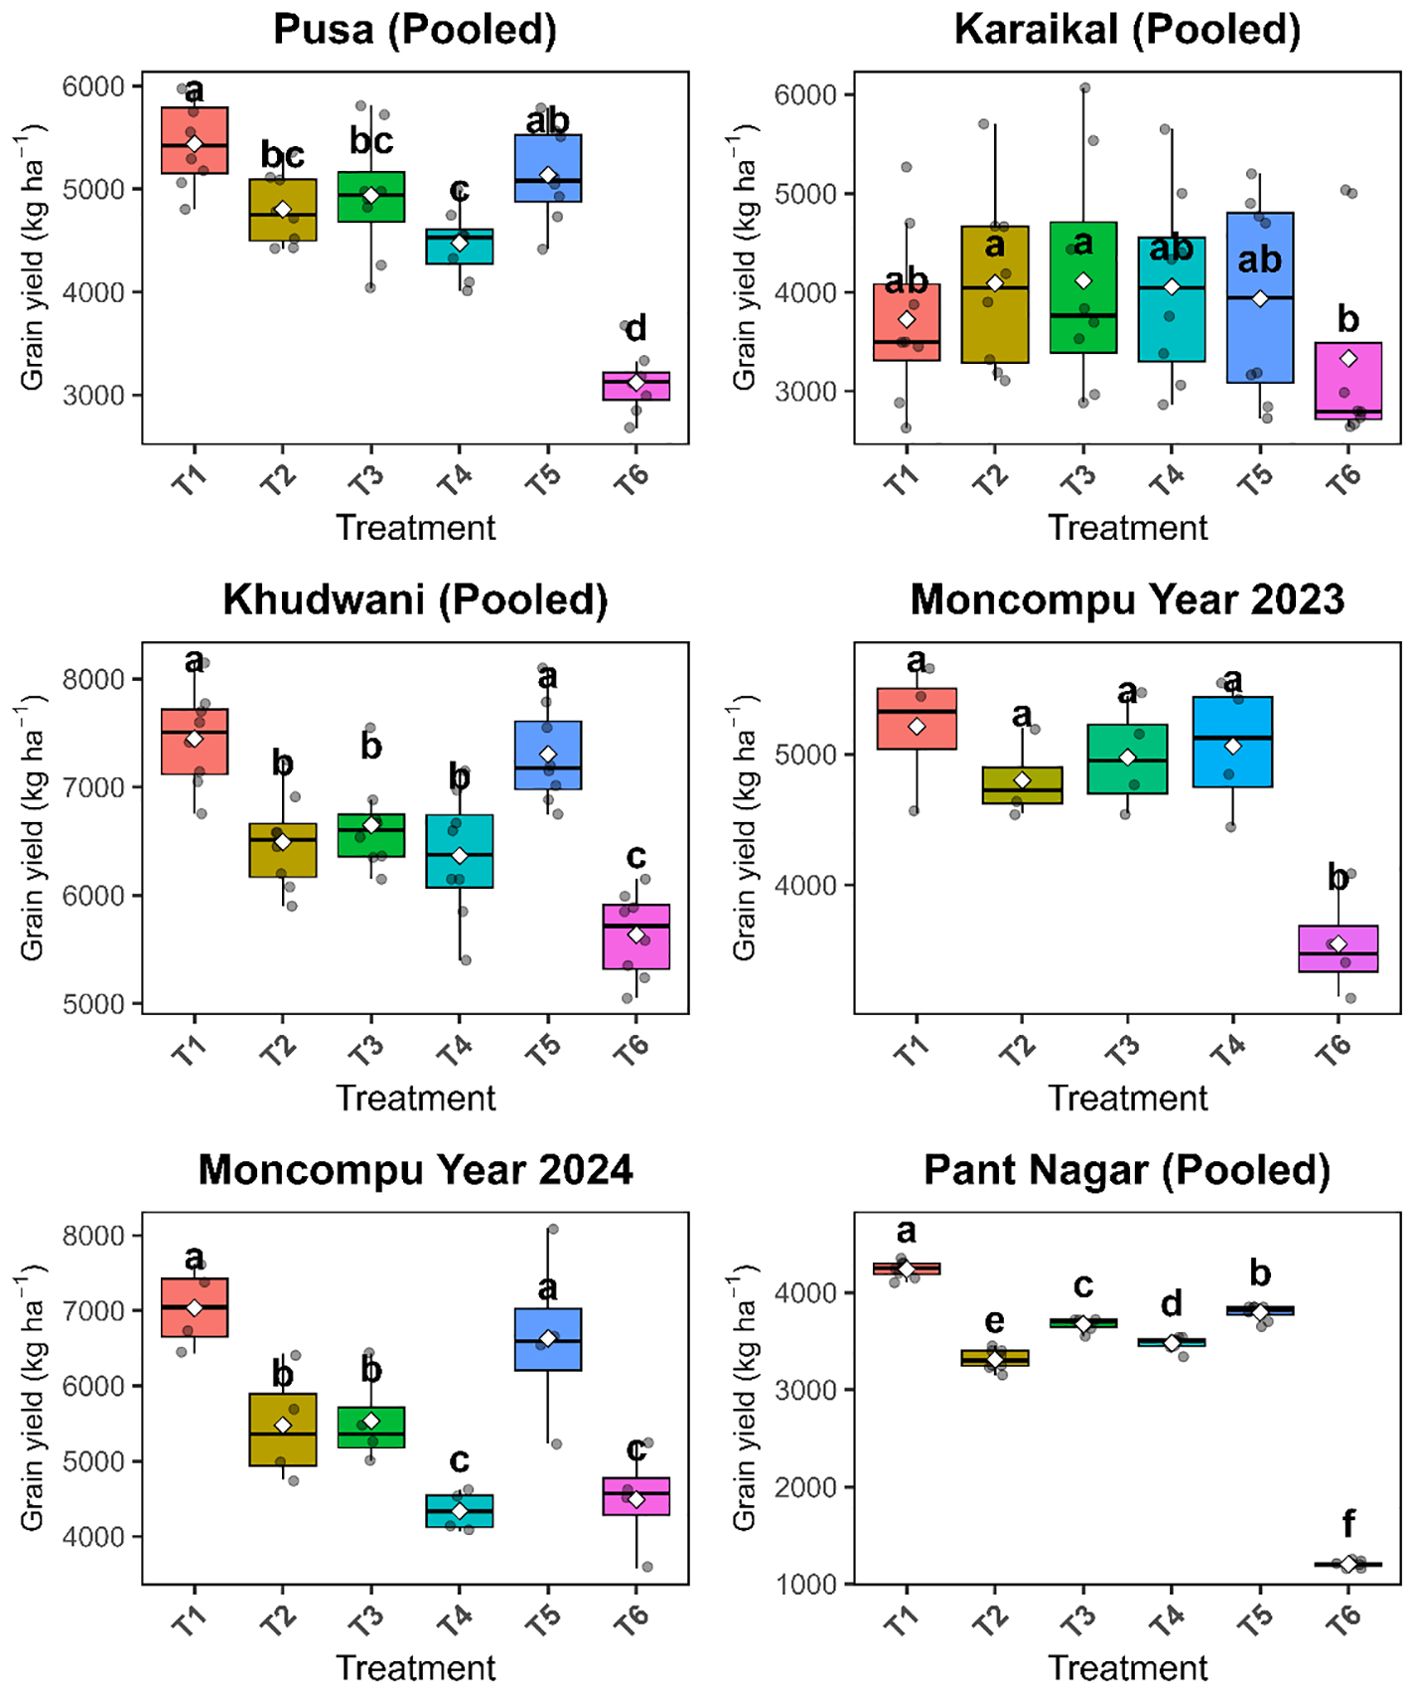
Figure 5. Effect of crop residue, pusa decomposer (PD), and green manure-based N substitution on the straw yield of rice. T1 - 100% RDF, T2 - 50% RDF + 50% RDF via crop residue, T3 - 50% RDF + 50% RDF via crop residue + PD, T4 - 50% RDF via crop residue + 50% RDF via green manure/green leaf manure, T5- 75% RDF + 25% RDF via crop residue + PD, T6 - absolute control, and RDF – Recommended dose of fertilisers. Treatments sharing the same lowercased letter were not significantly different, while different letters indicate significant differences in treatment means at the 5% significance level (DMRT). The letter ‘a’ denotes the highest mean group.
3.3 Effect on grain and straw N, P, and K content
The contents of N, P, and K in straw and grain remained generally consistent across treatments and locations, except Karaikal (Tables 4, 5). Treatment T1 (100% RDF via fertilizers) and T5 (75% RDF via fertilizers + 25% RDF via residue) resulted in statistically similar straw N content across sites, excluding Karaikal, where the variation was non-significant in both 2023 and 2024. At Khudwani and Pantnagar, substituting up to 50% of N with crop residues (T2 and T3) yielded comparable N assimilation (0.54 ± 0.02 and 0.55 ± 0.01, respectively). However, in Pusa, Moncompu, and Karaikal, N supplied solely through residue and GLM failed to significantly enhance N content compared to the absolute control.
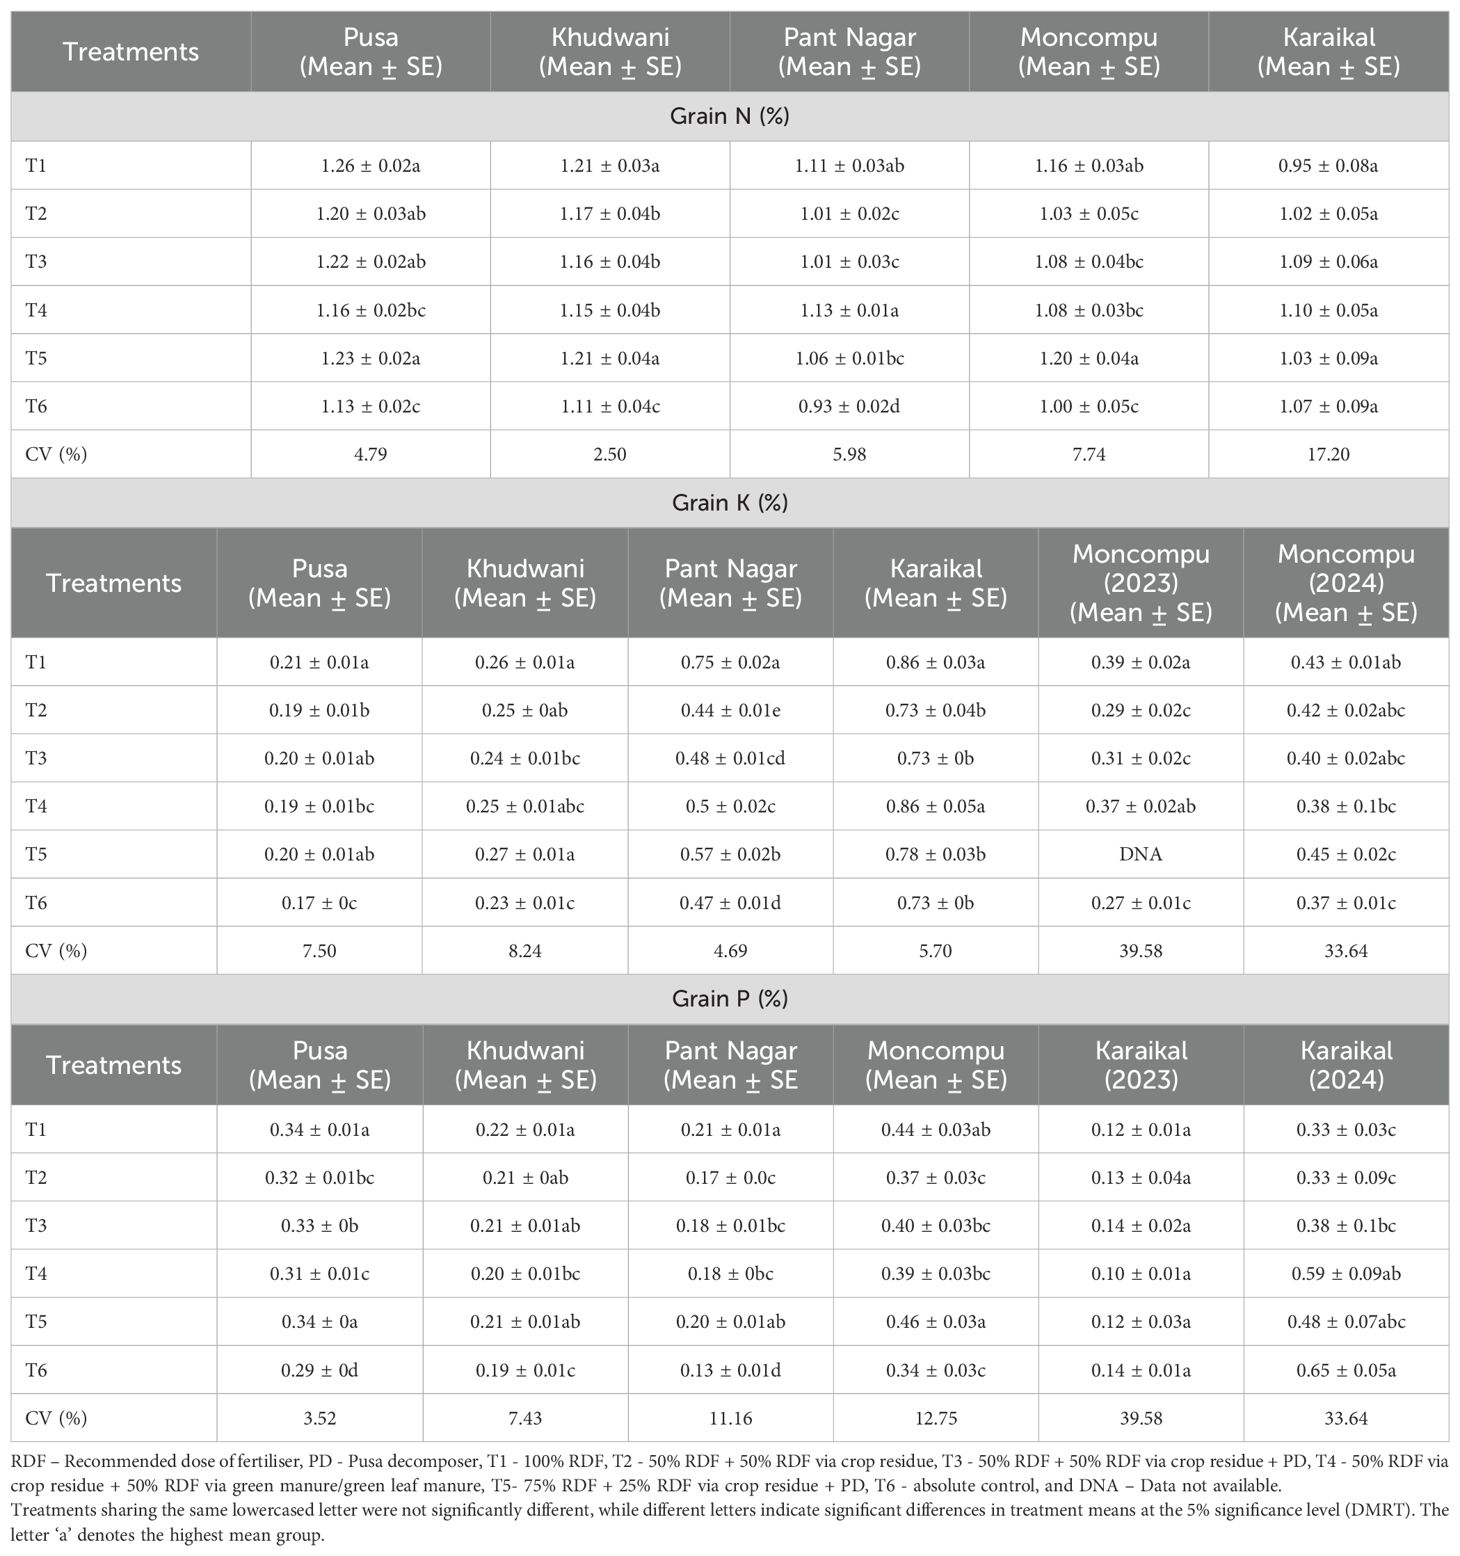
Table 4. Effect of N substitution through crop residues and green manures on grain N, P, and K content.
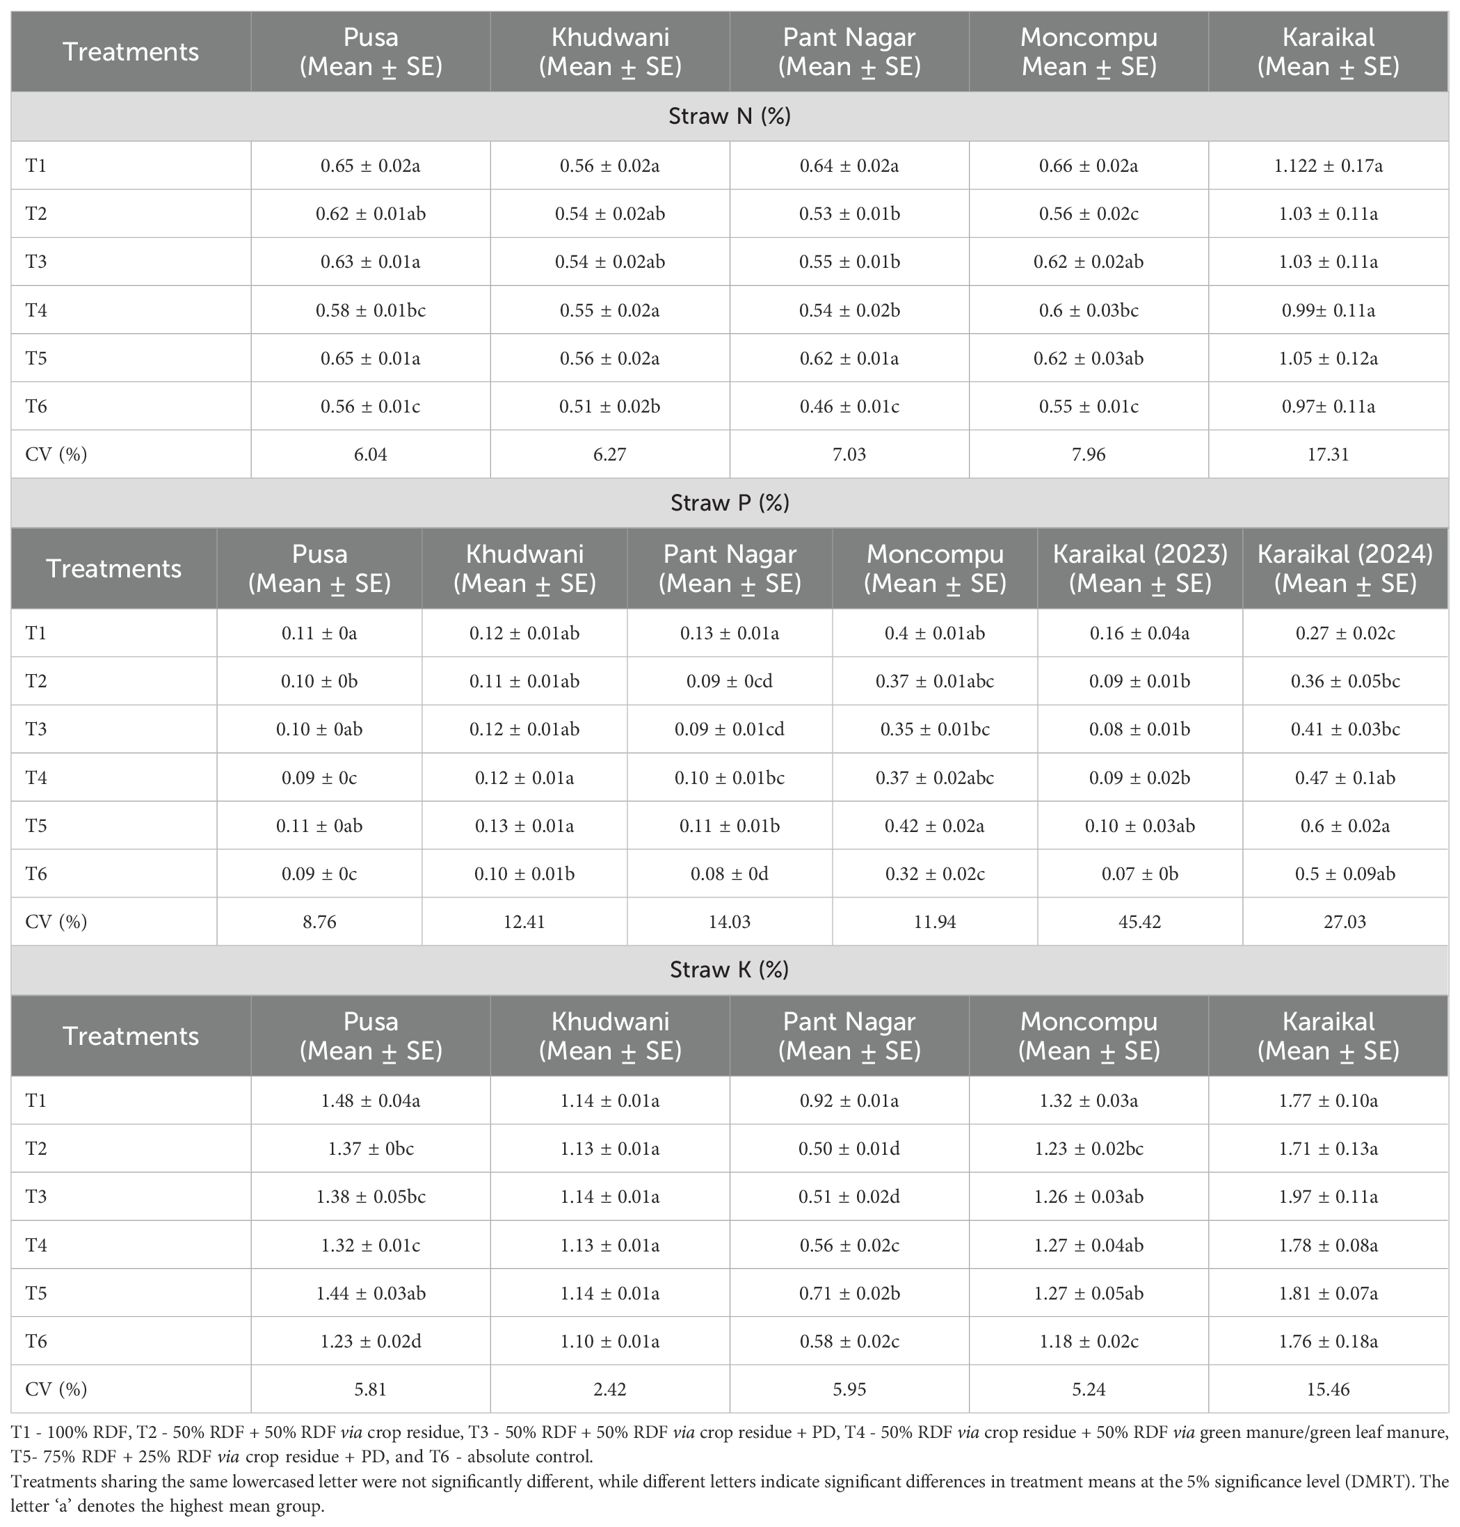
Table 5. Effect of N substitution through crop residues and green manures on straw N, P, and K content.
Grain P content showed inconsistent responses across years and locations, especially at Pusa, Pantnagar, and Karaikal. In Karaikal, no significant improvement in grain P was observed in 2023, and an unusual significant trend appeared in 2024, where the no-fertilizer (T6: 0.65%) and organic-only (T4: 0.59%) treatments recorded surprisingly higher values. At Pusa and Pantnagar, treatments with 100% RDF (T1) and PD combined with 25% rice residue and 75% urea N (T5) consistently enhanced grain P in both years. Pooled data highlighted the superiority of T1 (0.22% and 0.44%) and T5 (0.21% and 0.46%) at Khudwani and Moncompu, respectively. While residue-based substitutions (with or without decomposer) performed comparably to T1 and T5 at Khudwani, they led to poor P accumulation at Moncompu. In the case of straw P, treatments T1 and T5 recorded the significantly highest straw P content at Karaikal during 2023. Conversely, organic residue treatments (T2, T3, T4), aided by PD, maintained higher straw P content over both years by promoting labile soil P. Overall, pooled results indicated T1 to be significantly superior at Pusa (0.11%) and Pantnagar (0.13%), whereas T5 excelled at Moncompu (0.42%) and Khudwani (0.13%). Higher substitution levels (T2, T3, T4) with residues and GM/GLM reduced P availability, resulting in suboptimal P content.
For K, both straw K and grain K concentrations were significantly higher in T1. In Pusa and Kudwani, the concentrations in T1 were on par with T5, and in Karaikal, they were on par with T4. These treatments were followed by other residue-substituted options, which showed notable improvement in K content except in the silty clay soils of Pantnagar. Remarkably, the integration of rice straw residue with GLM (Glyricidia) achieved grain K levels comparable to those under RDF, particularly in the sandy loam soils of Karaikal, pressing the potential of organic amendments in enhancing K uptake under such soil conditions.
3.4 Bivariate analysis: nutrient concentration and grain yield
Our bivariate analysis clearly demonstrates a direct relationship between nutrient concentrations in the plant (both grain and straw) and grain yield across various locations.
3.4.1 Nitrogen concentration and grain yield
Regardless of location, treatments T1 and T5 consistently showed a strong positive correlation as majority of values fell within the “high grain N” and “high grain yield” categories (Figure 6). This indicates that higher N levels directly contribute to increased grain yield. A similar trend was observed for straw N versus grain yield, where higher N content in the rice straw also corresponded directly to higher grain yields, with most values clustering in the “high straw N” and “high grain yield” categories. Conversely, for treatment T6, most values clustered in the “low grain N” and “low grain yield” categories, unequivocally demonstrating that suboptimal grain N content directly leads to reduced grain yield. This pattern was mirrored in the straw N analysis, where lower N levels in the straw directly resulted in significant yield losses, with values falling into the “low straw N” and “low grain yield” categories. For treatments T2, T3, and T4, the values were more dispersed, appearing in multiple categories (e.g., high grain N/high yield, low N/high yield, and high N/low yield). However, their positions were notably closer to those of T1 and T5, rather than T6. This suggests that the N supply from T2, T3, and T4 was higher than T6 but slightly lower than T1 and T5, which, in turn, resulted in marginally lower grain yields for these treatments.
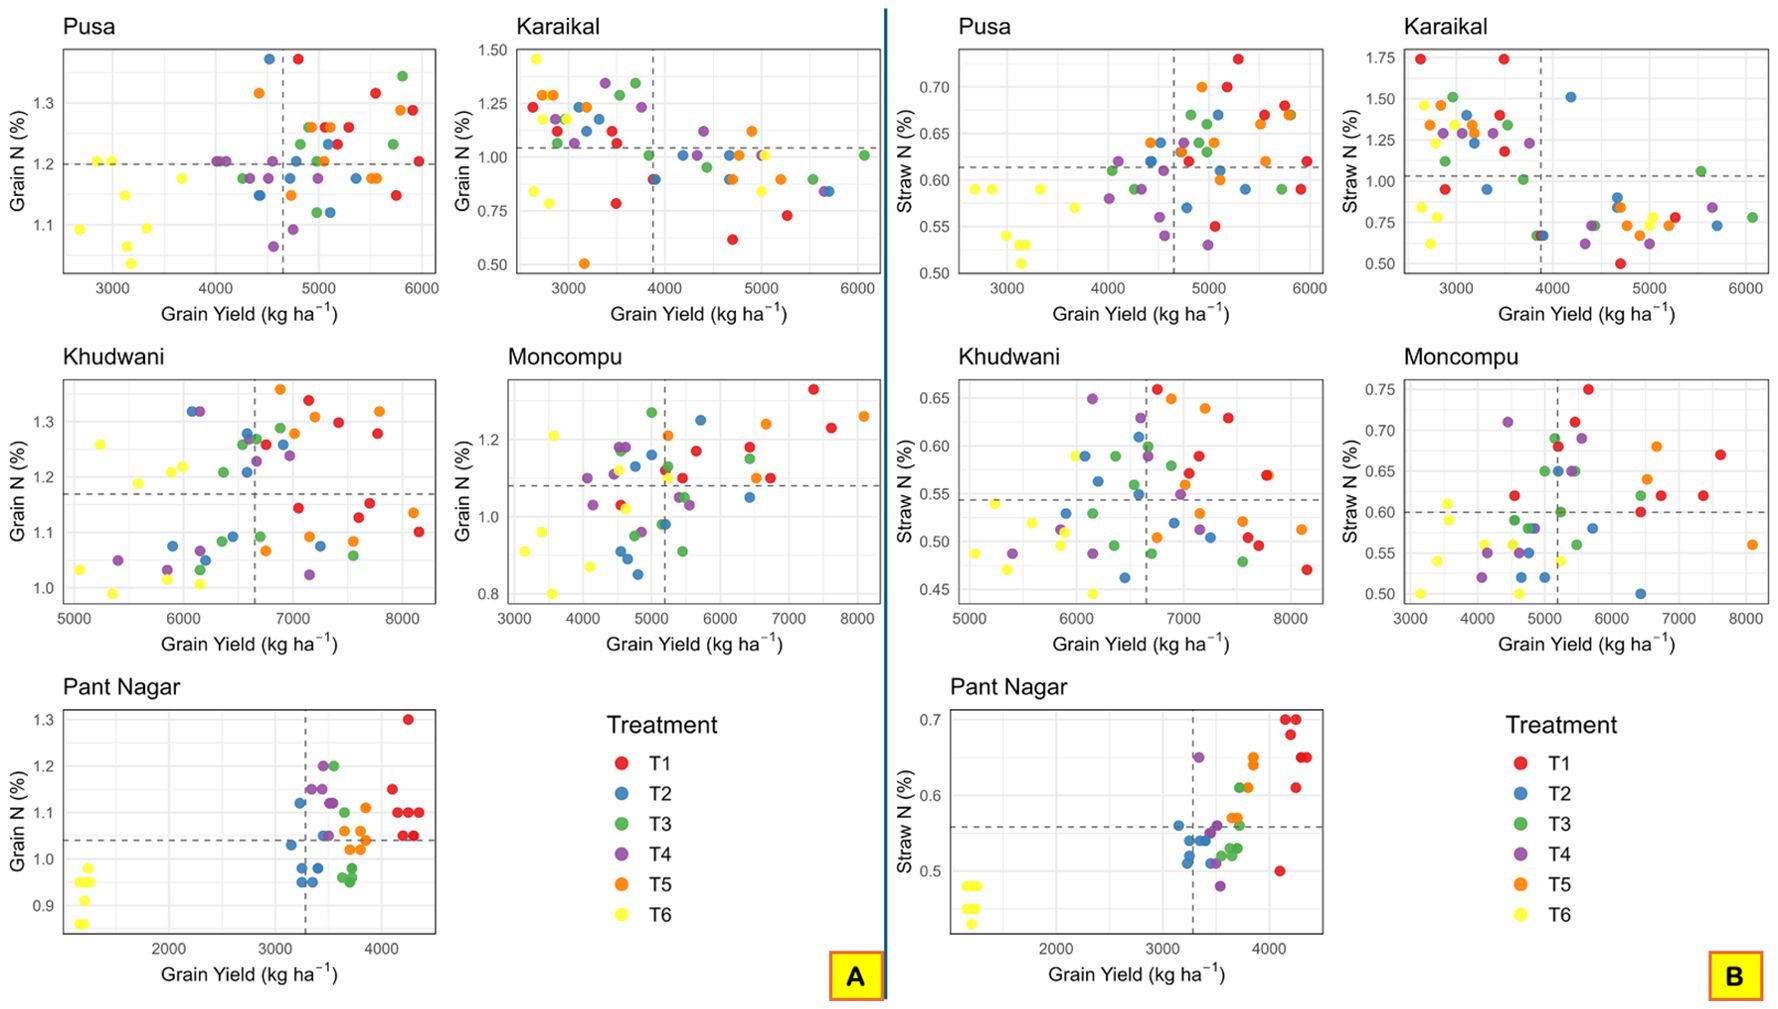
Figure 6. Relationship between grain nutrient content and grain yield (A) grain N and yield (B) straw N and yield. T1 - 100% RDF, T2 - 50% RDF + 50% RDF via crop residue, T3 - 50% RDF + 50% RDF via crop residue + PD, T4 - 50% RDF via crop residue + 50% RDF via green manure/green leaf manure, T5- 75% RDF + 25% RDF via crop residue + PD, and T6 - absolute control.
3.4.2 Physiological efficiency and nitrogen utilization
The bivariate analysis also provided insights into the physiological efficiency of the cultivars used in different locations. For example, in Khudwani, the cultivar produced a yield of 6650 kg ha-1 with a grain N content of 1.1% and a straw N content of 0.54%. In contrast, the cultivar in Moncompu, with a similar grain N content (1.1%) and slightly higher straw N content (0.60%), yielded only 5150 kg ha-1 (a difference of 1500 kg ha-1). This significant yield disparity highlights that cultivars vary considerably in their efficiency of utilizing N.
3.4.3 Potassium concentration and grain yield
The bivariate relationship between K and grain yield (both grain K and straw K versus grain yield) was even more pronounced than that observed for N (Figure 7). Across all locations, T6 treatment values were consistently found in the “low straw K/low grain yield” and “low grain K/low grain yield” columns. Conversely, T1 values were predominantly distributed in the “high straw K/high grain yield” and “high grain K/high grain yield” columns. This distribution clearly shows the role of K nutrition in determining the rice crop yield. The lower K supply always led to significantly lower grain yield. Treatment T5 showed a similar distribution to that of T1. However, its values were slightly lower than T1 in terms of grain and straw K, yet surprisingly, its grain yields were higher. This indicates that substitution of nutrients (25%) through crop residue is a viable option, as it led to statistically on par yield with farmer practices (T1).
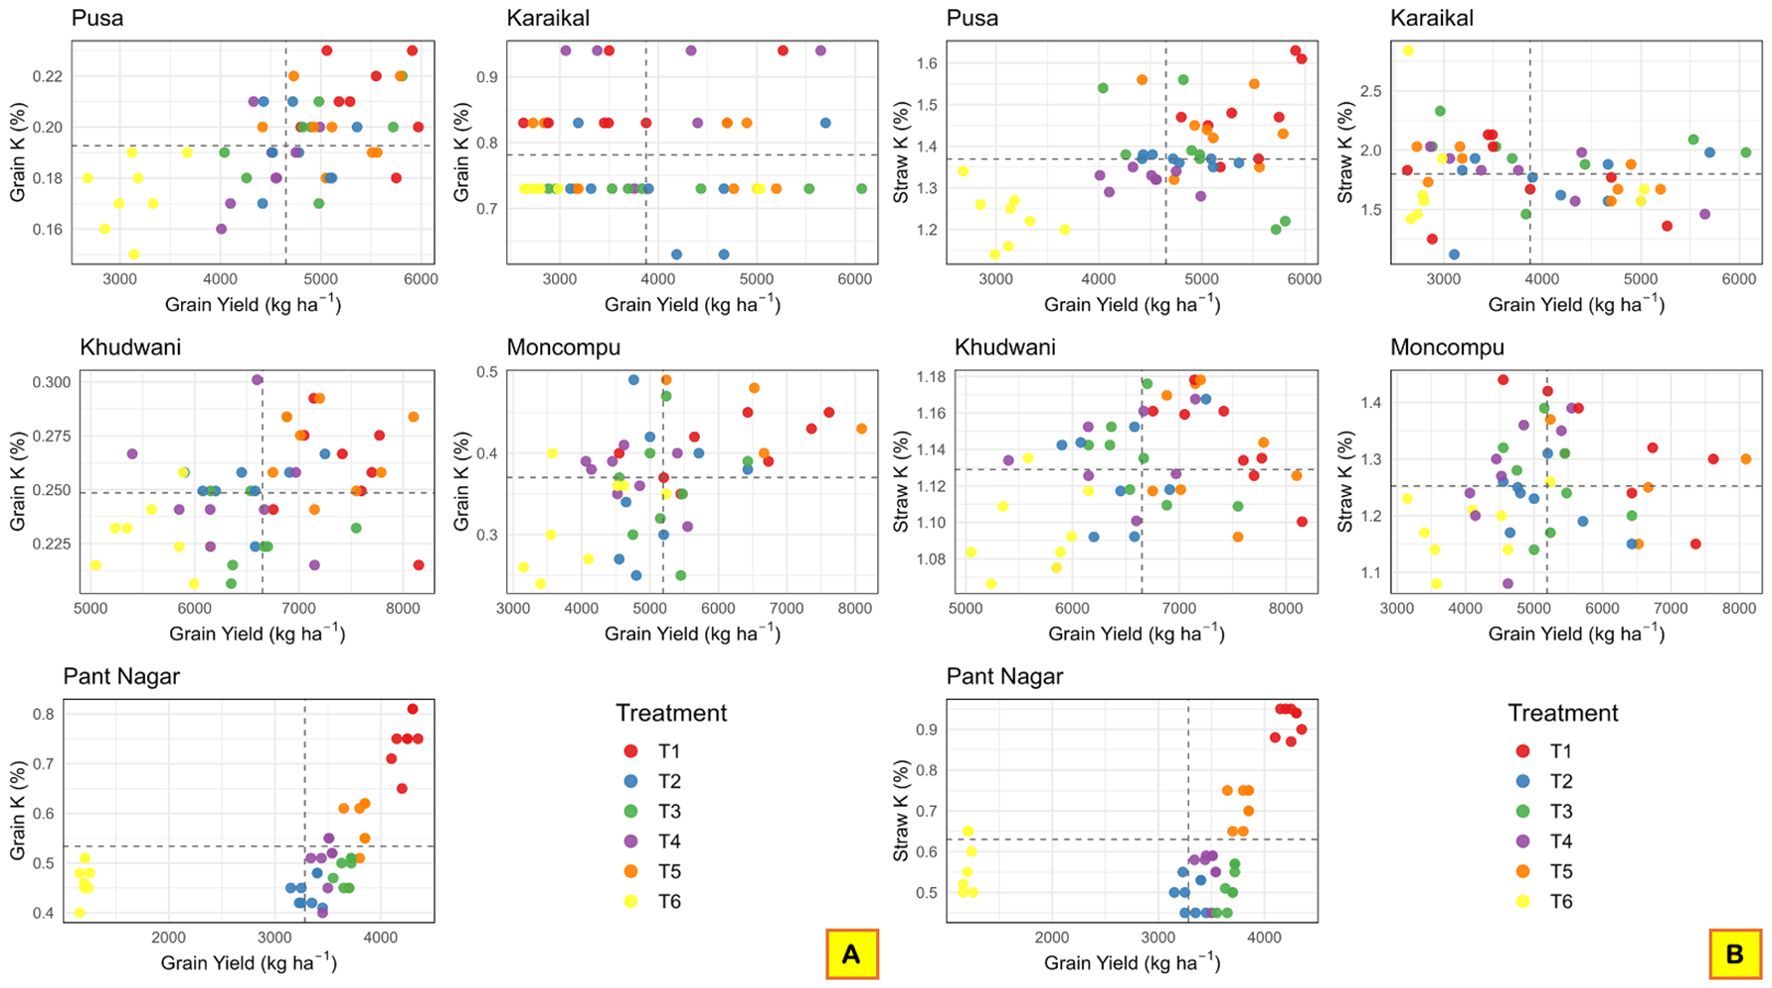
Figure 7. Ten scatter plots display the relationship between grain yield (in kilograms per hectare) and potassium percentage for grain and straw across five locations: Pusa, Karaikal, Khudwani, Moncompu, and Pant Nagar. Each plot contains colored dots representing six different treatments labeled T1 to T6. Treatments are distinguished by color, with a key provided for reference (red, orange, green, purple, blue, yellow). Dashed lines indicate average values for each axis in every plot.
Interestingly, in Pant Nagar, straw K levels were lower than in other locations, but the grain K levels were almost comparable. This suggests an efficient transport of K to the grain, coupled with potentially lower K uptake from the soil due to inherently lower availability. In stark contrast, the cultivar used in Karaikal exhibited maximum K uptake, likely attributable to the higher K availability in the sandy loamy soil of that region. However, our findings also clearly reveal that the cultivar used in Karaikal was less efficient in utilizing the absorbed K, whereas the cultivars in Khudwani and Moncompu demonstrated much higher efficiency. This is due to the production of a higher yield with lower uptake of K.
3.5 Partial factor productivity
The PFP of N varied significantly across treatments and locations (Figure 8). Treatment T1 (100% RDF) consistently yielded the highest PFP of N at all locations. However, in Khudwani, Moncompu, and Pusa, T1 was statistically comparable to T5. In contrast, at Pant Nagar, T5 recorded a significantly lower PFP of N than T1. No clear trend was observed in Karaikal, where differences were non-significant. The higher PFP of N under T1 and T5 suggests the immediate availability of N from the urea fertilizer source. Pooled analysis across all locations reflected a similar trend: T1 achieved the highest PFP of N (47 kg grain/kg N), followed closely by T5 (44 kg grain/kg N). Notably, treatment T3 (42.5 kg grain/kg N) was statistically equivalent to T5. Conversely, T4 recorded the lowest PFP of N (39 kg grain/kg N), underscoring the necessity for at least some mineral N input. Overall, the hierarchy of PFP of N was T1 > T5 ≈ T3 > T2 ≈ T4. This indicates potential for productivity gains by increasing N fertilization in T2 and T4, as substituting 50% RDF with crop residue resulted in slightly lower PFP compared to full fertilizer N supply (T1).
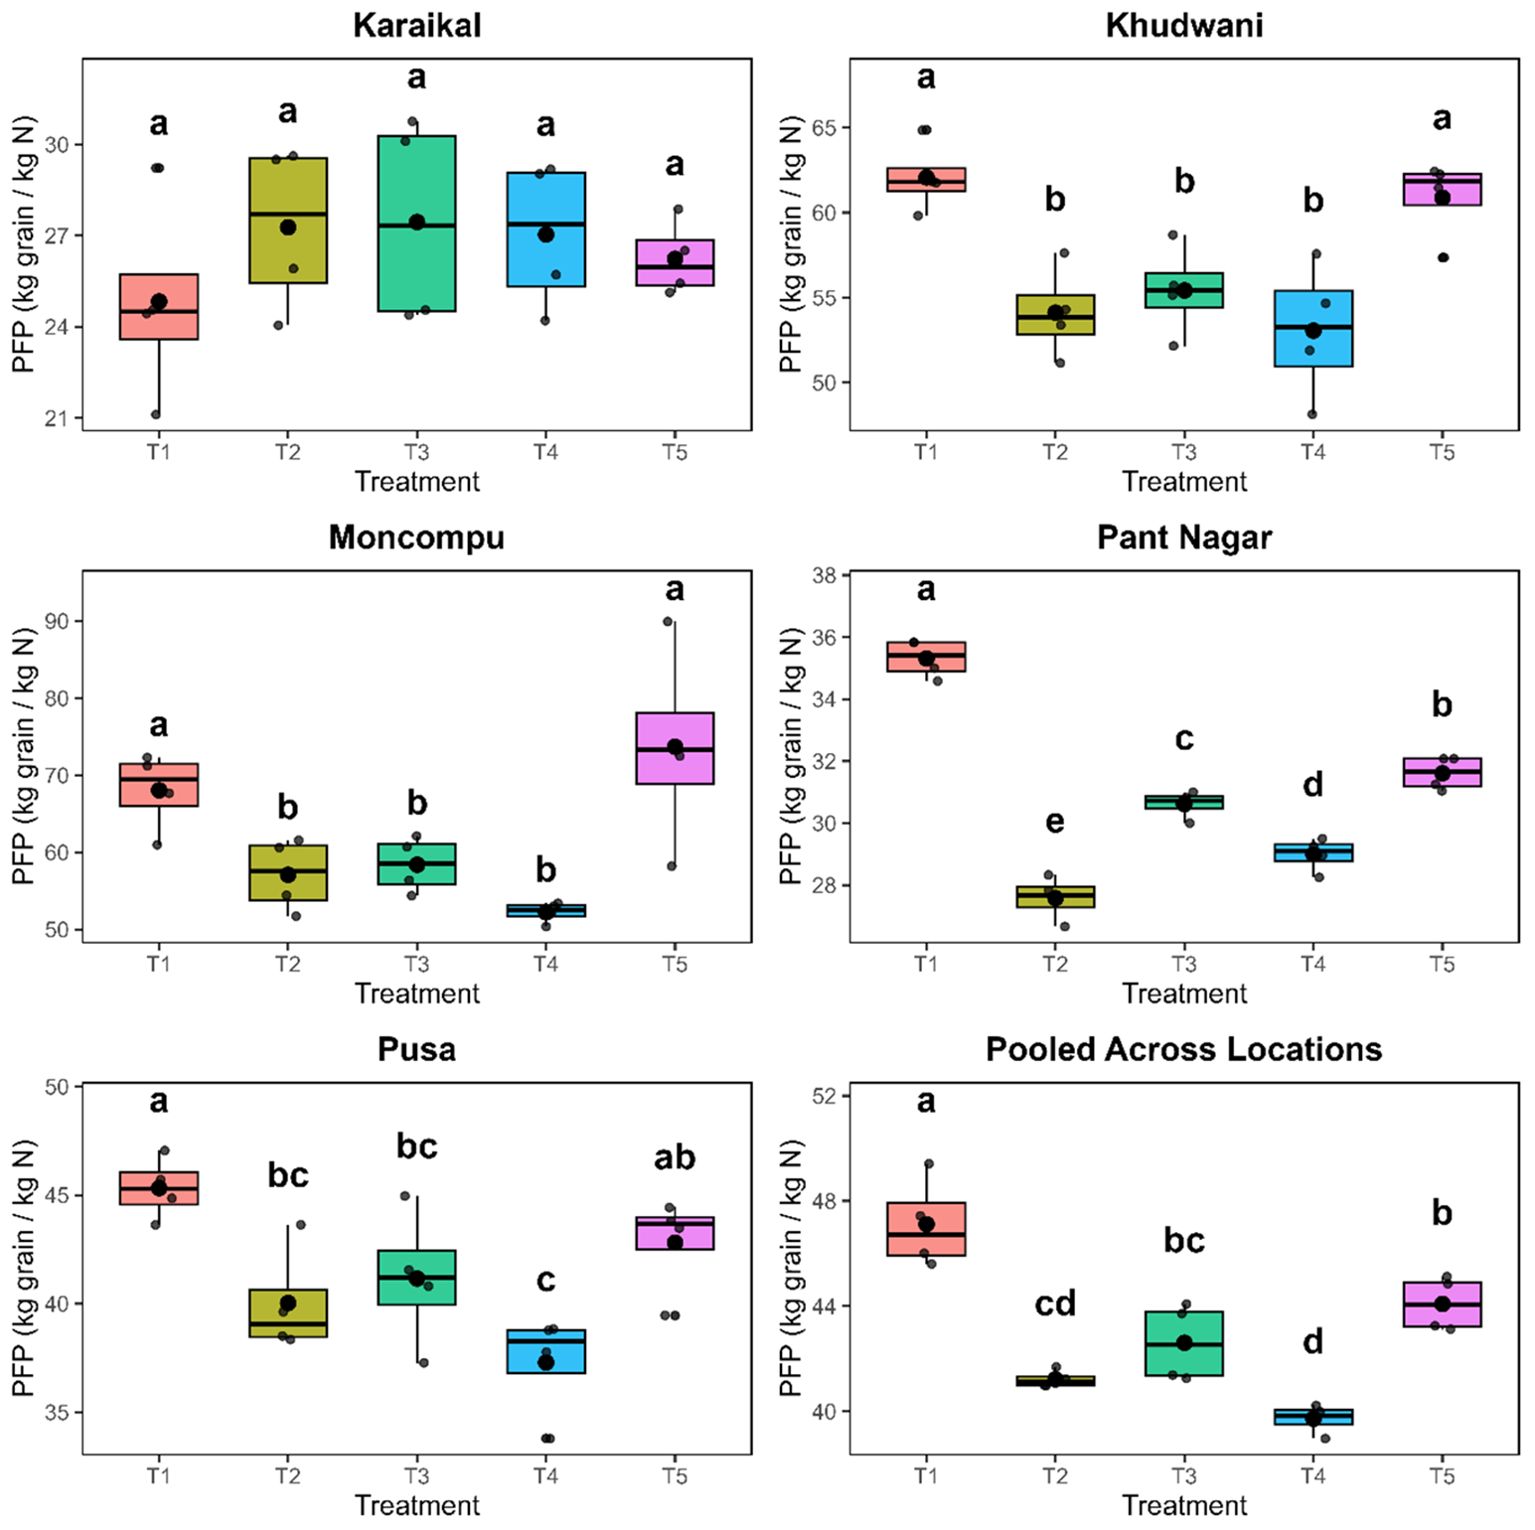
Figure 8. Effect of N substitution through crop residue and green manure/green leaf manure on partial factor productivity of N. Note: T1 - 100% RDF, T2 - 50% RDF + 50% RDF via crop residue, T3 - 50% RDF + 50% RDF via crop residue + PD, T4 - 50% RDF via crop residue + 50% RDF via green manure/green leaf manure, and T5- 75% RDF + 25% RDF via crop residue + PD. Treatments sharing the same lowercased letter were not significantly different, while different letters indicate significant differences in treatment means at the 5% significance level (DMRT). The letter ‘a’ denotes the highest mean group.
3.6 Impact on soil nitrogen and organic carbon
3.6.1 Impact on soil nitrogen
Treatments significantly influenced soil N content across all locations. However, the impact varied significantly depending on the location. Specifically, Karaikal and Moncompu showed significant year-to-year differences, requiring separate analyses for each year. In contrast, Pusa, Khudwani, and Pantnagar exhibited no significant annual variation, which allowed for a pooled analysis of their data (Table 6). In general, T1 recorded the elevated soil N across all locations. In most sites (excluding Pantnagar), spraying PD with either 25% or 50% crop residue (T5 and T3) achieved soil N levels statistically equivalent to 100% RDF (T1). At Pantnagar, the highest soil N content (176 kg ha-1) observed in T1 (100% RDF) was comparable to T5 (75% RDF + 25% RDF via residue + PD; 171 kg ha-1). Karaikal showed no significant treatment differences in 2023, but during 2024, T4 (50% residue + 50% GLM) recorded significantly higher soil N (239 kg ha-1). Moncompu exhibited annual variation: T4 (50% residue + 50% GLM) achieved maximal soil N (352 kg ha-1) in 2023, whereas T1 (100% RDF; 341 kg ha-1) led in 2024. Across all locations, the absolute control (T6) consistently yielded the lowest soil N content.
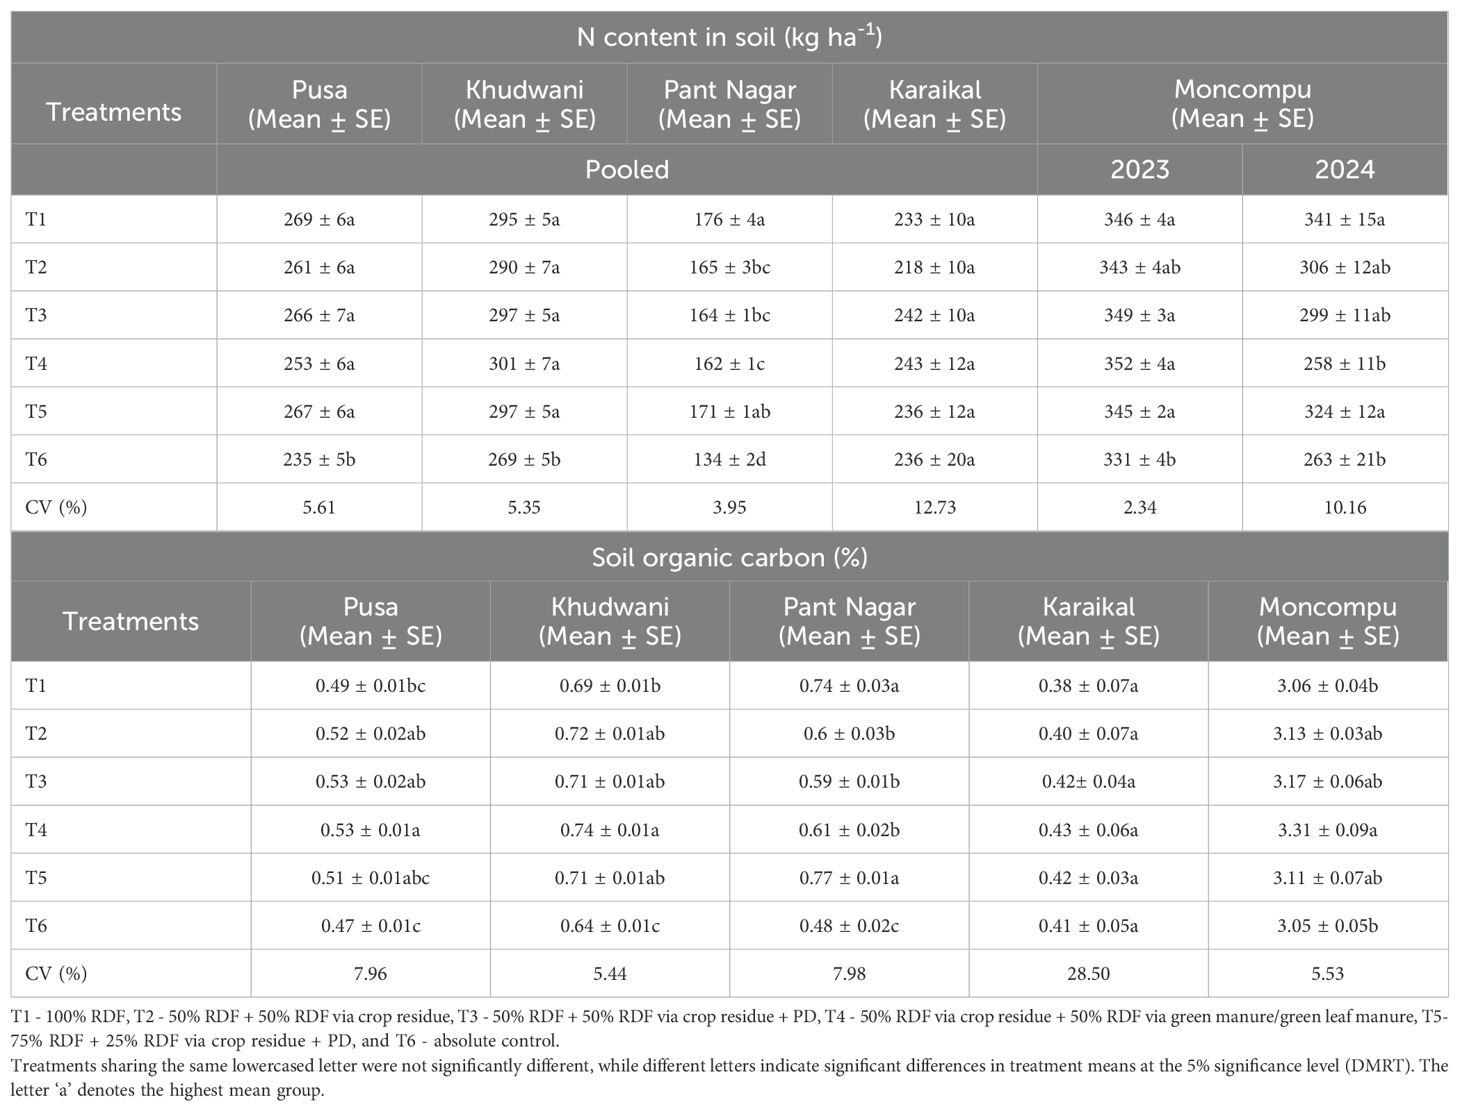
Table 6. Effect of different nutrient management practices on soil N and OC across different locations.
3.6.2 Impact on soil organic carbon
The absence of significant annual variation across all study locations allowed a pooled analysis of the soil OC data from these sites (Table 6). The OC varied significantly among treatments at all locations except Karaikal. Treatment T4 recorded the highest OC at Pusa (0.53%), Khudwani (0.74%), and Moncompu (3.31%). At Pantnagar, however, T5 achieved the highest OC (0.77%) and was statistically comparable to T1 (0.74%). In Pusa, Khudwani, and Moncompu, treatments T2, T3, and T5 were statistically equivalent to T4 (the highest OC treatment), indicating soil OC improvement from crop residue and GLM incorporation. Conversely, at Pantnagar, T2, T3, and T4 showed significantly lower OC than T5. The control (T6) consistently yielded the lowest OC across all locations.
3.6.3 Changes in the soil parameters after two years of residue incorporation
Soil nutrient status, particularly changes in soil N, P, K, and OC, after two years of the experiment revealed distinct patterns influenced by treatment and local soil conditions (Figure 9). At Karaikal, a general depletion of OC and N was observed across all treatments. While P mining was minimal, N and OC depletion were notably higher and roughly equal. For P, T2, T3, and T5 showed positive P balances, with T2 leading with a remarkable ~6% buildup and T5 showing a ~3% buildup. Conversely, available K significantly increased across all treatments, with the most substantial accumulation in T4, followed by T3 (~45%) and T5 (~35%). In Khudwani, all treatments resulted in a decline of N, P, and OC. The most intense reduction occurred for P, followed by N, with only marginal OC mining. Unsurprisingly, T6 (absolute control) recorded the highest nutrient depletion across all parameters (OC, N, P, and K). However, K buildup was observed in T1 (~8%), T3 (~3%), and T5 (~3%), suggesting that nutrient depletion is particularly pronounced in sub-optimally fertilized rice plots within this hilly region. The continuous addition of fertilizer combined with residue retention appeared to promote K accumulation in the soil.
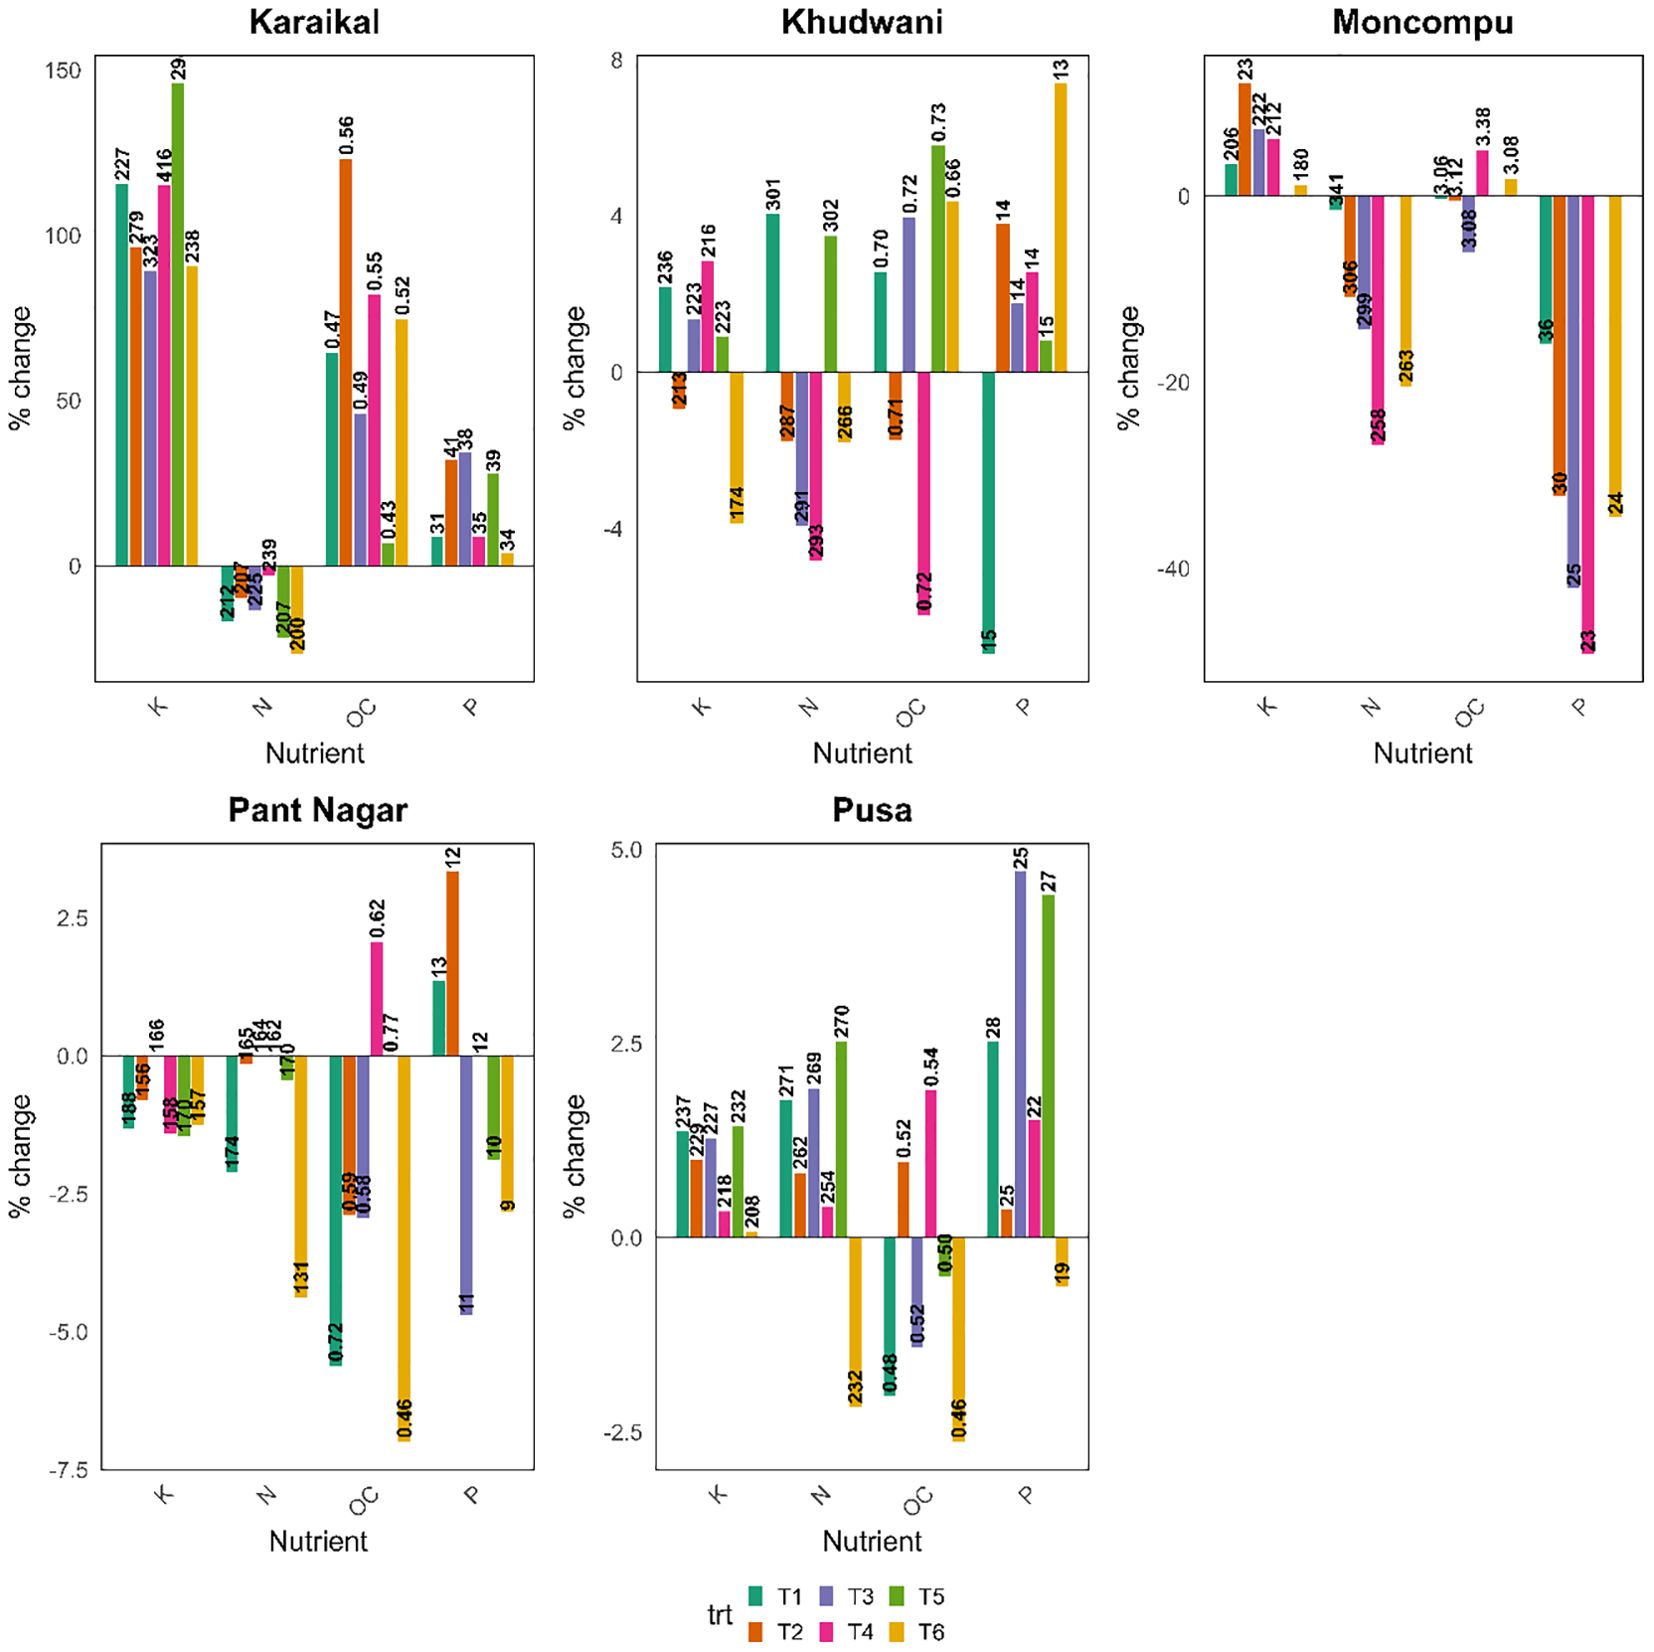
Figure 9. Changes in key nutrient parameters under the influence of residue retention for two years.
At Moncompu, only P consistently showed mining across all treatments, ranging from a 20% to 40% depletion from initial levels. For K, N, and OC, the impact was treatment-dependent. All treatments, except T6, led to K buildup. In the case of N, T3, T4, and T6 resulted in depletion, while other treatments showed accumulation. OC exhibited very minor changes, except for a notable ~8% buildup in T4, indicating slower decomposition rates and potentially limited P availability in the acidic soils of this region. The incorporation of GLM and crop residue contributed to a slight increase in OC. At Pantnagar, T1 and T5 demonstrated positive impacts on soil N, P, and OC content. T1 recorded the highest increase in N (~14%), while T5 showed the most substantial improvement in OC (~22%), highlighting the benefits of crop residue incorporation for enhancing soil health. Despite these positive trends, soil K levels declined by 10-20% across all treatments, indicating significant K mining in this silty clay soil regardless of management strategies. As anticipated, T6 showed a substantial decline in all measured nutrients (N, OC, K, and P).
Finally, at Pusa, all treatments, excluding T6, led to an improvement in soil K, N, OC, and P status. The most significant P buildup (~25%) was observed with T2, T3, and T4, while T1 and T5 achieved even higher accumulations (~40%), emphasizing improved P availability through both 100% inorganic fertilizer and residue incorporation. A similar, though smaller, buildup of approximately 10% was noted for N and K across treatments. It’s noteworthy that K buildup was consistently reported across all centres except Pant Nagar. Specifically, in Khudwani and Moncompu, only T6 exhibited soil K mining, while Pusa showed no change in K levels.
3.7 Predicted treatment effects on soil parameters (Bayesian Posterior Model)
3.7.1 Location-specific predictions
Across the experimental sites, the Bayesian posterior model projected significant patterns of soil nutrient dynamics relative to T1 (100% RDF). Notably, significant P mining was forecasted in treatments T2, T3, T4, and T6 across multiple locations (Table 7). T2 (50% RDF + 50% RDF via residue), significantly enhanced soil K levels (+11.51 kg ha-1), suggesting effective nutrient recycling from residues at Moncompu. However, it showed moderate depletion of N, P, and OC at Pantnagar and minor declines at Khudwani. T3 treatment showed a significant decline in soil P at Moncompu (–5.64 kg ha-1), indicating P mining under partial nutrient replacement. At Pantnagar, it also contributed to reductions in N (–7.38 kg ha-1), K (–15.64 kg ha-1), and OC (–0.15%). T4 significantly improved SOC (+0.05%), reflecting the beneficial effects of green manuring under neutral to alkaline soil in Pusa. However, it led to P depletion in Moncompu (–5.16 kg ha-1) and considerable nutrient reductions in Pantnagar, including N (–9.53 kg ha-1), K (–22.08 kg ha-1), and OC (–0.12%).
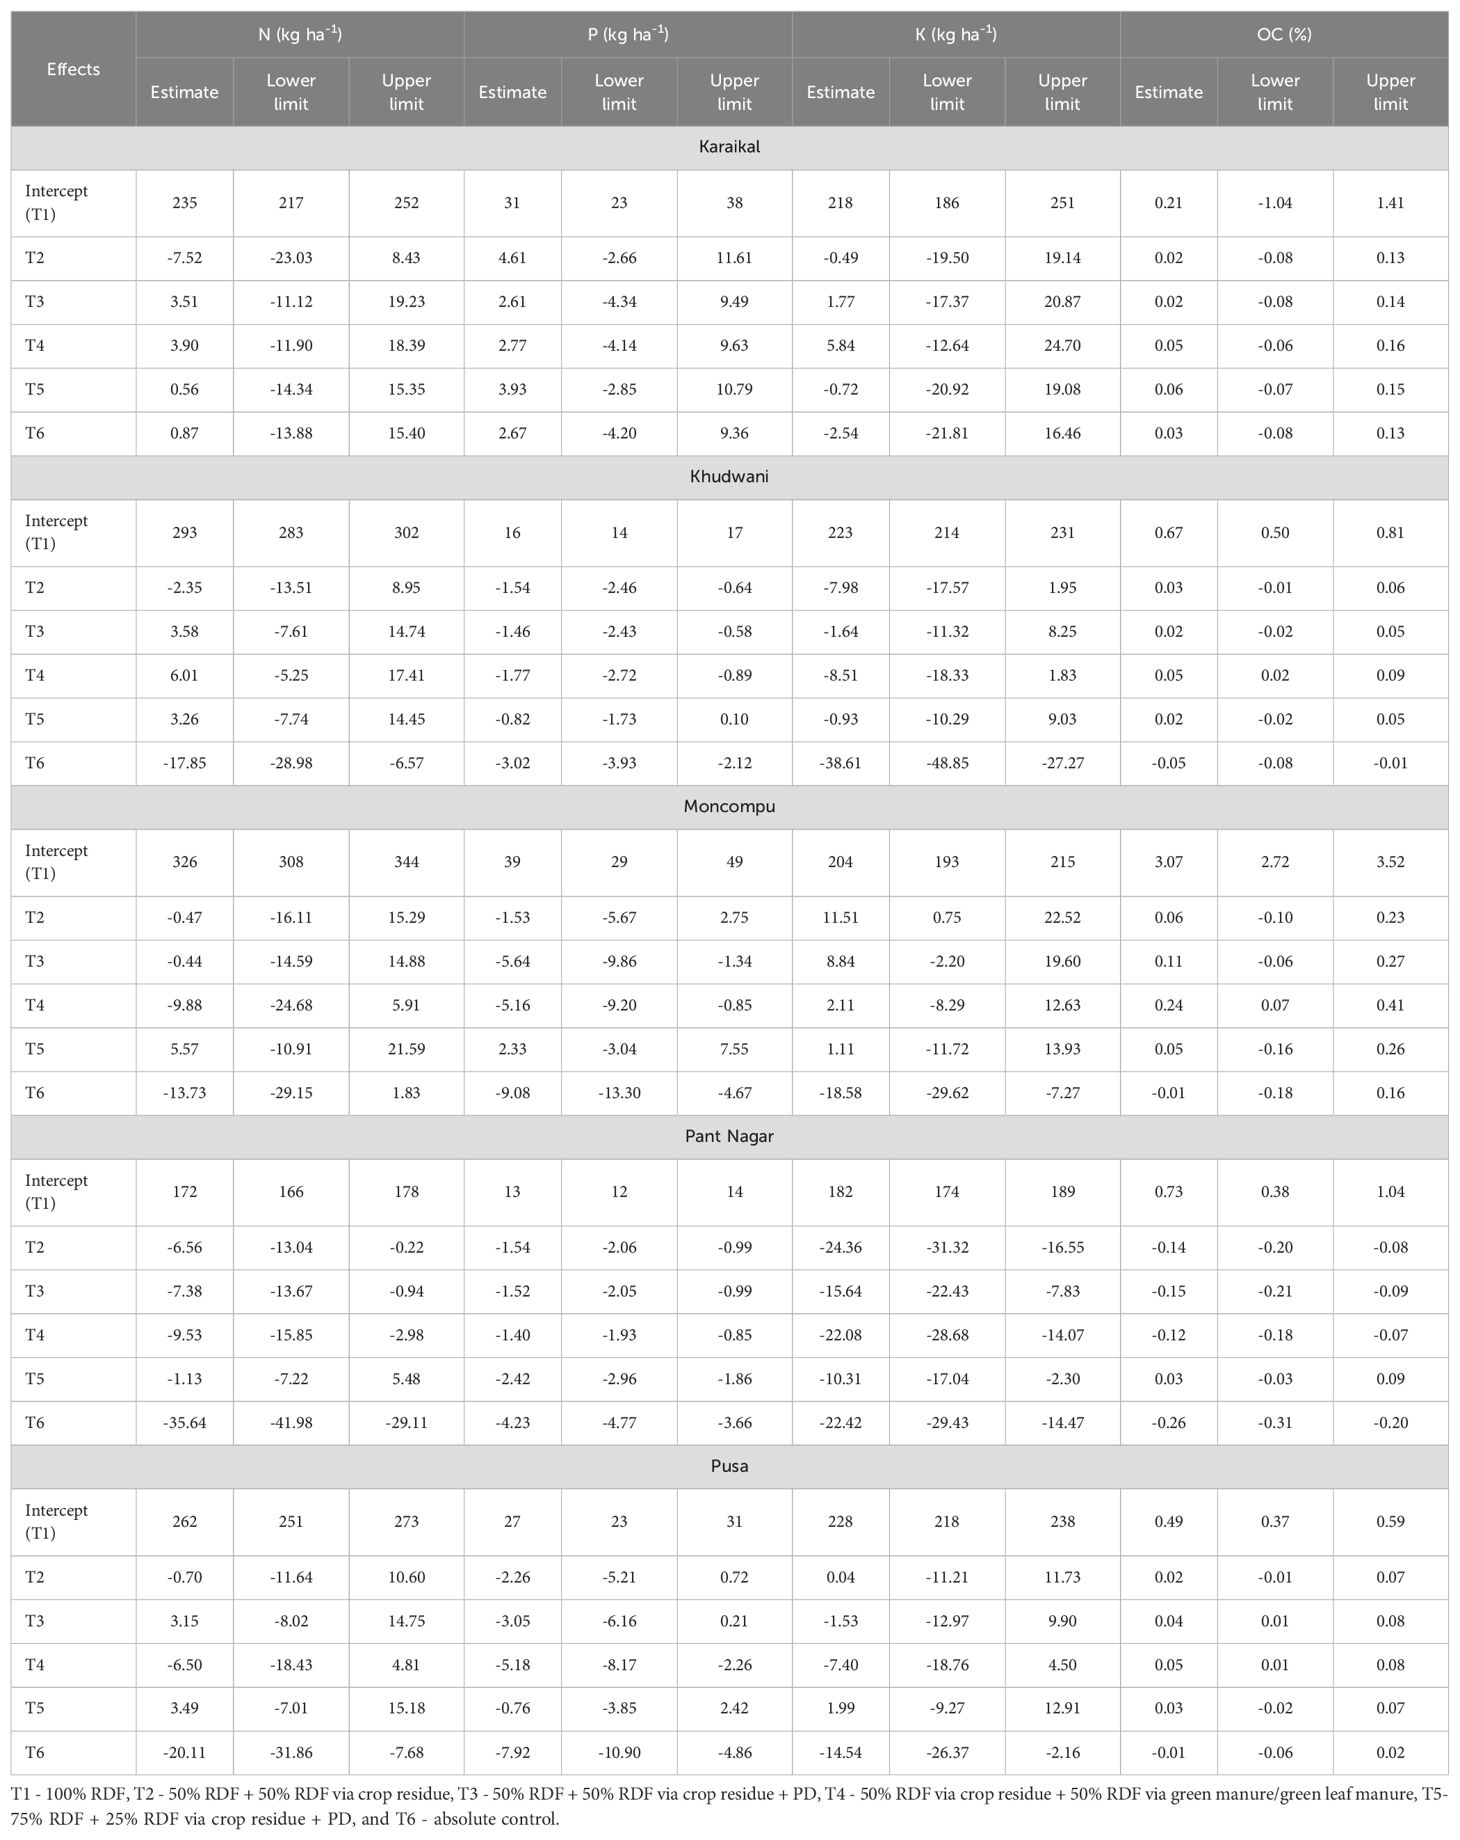
Table 7. Bayesian posterior model expression on soil parameters.
Integrated treatment (T5) was relatively effective in enhancing soil NPK nutrients. At Pantnagar, this treatment slightly improved OC (+0.03%) over T1. At Khudwani, it was the only treatment that did not significantly reduce soil P. Overall, it exhibited more sustainable nutrient dynamics than other treatments. Absolute control (T6) consistently recorded the highest depletion of all nutrients and across locations. At Pusa, it caused significant reductions in N (–20.11 kg ha-1), P (–7.92 kg ha-1), and K (–14.54 kg ha-1). At Moncompu, it showed sharp declines in soil P (–13.30 kg ha-1), while at Khudwani, it led to losses in N (–17.85 kg ha-1), P (–3.02 kg ha-1), K (–38.61 kg ha-1), and OC (–0.05%). Pantnagar also reflected this trend with the most severe nutrient depletion under T6: N (–36.64 kg ha-1), P (–4.23 kg ha-1), K (–22.42 kg ha-1), and OC (–0.26%). In sandy loam soils of Karaikal, none of the N replacement treatments demonstrated statistically significant deviations from T1 for N, P, K, or OC.
3.8 Effect size analysis
The effect size analysis of the different locations was explained using Eta2 (a measure of effect size indicating the proportion of total variation in a dependent variable explained by a treatment or factor, η2), Omega2 (a less biased estimate of the true treatment effect size compared to Eta2, ω2), and Minimum Effect Size of Detectable Difference (MESD), which is the magnitude and consistency of treatment responses across five experimental locations over two years. The effect analysis identified Pantnagar as the most responsive site, as it exhibited the highest Eta2 values for key parameters. The high Eta2 values for grain yield (1.00, 0.99), straw yield (1.00, 0.99), panicle number (0.90, 0.86), and 1000-grain weight (0.94, 0.84) in 2023 and 2024, respectively, suggest that treatment effects were strong and residual variation was minimal (Table 8). In contrast, lower MESD values were observed, except for grain (51.31, 85.97) and straw yield (75.0, 112.31), which indicates that smaller treatment differences were detected at this location.
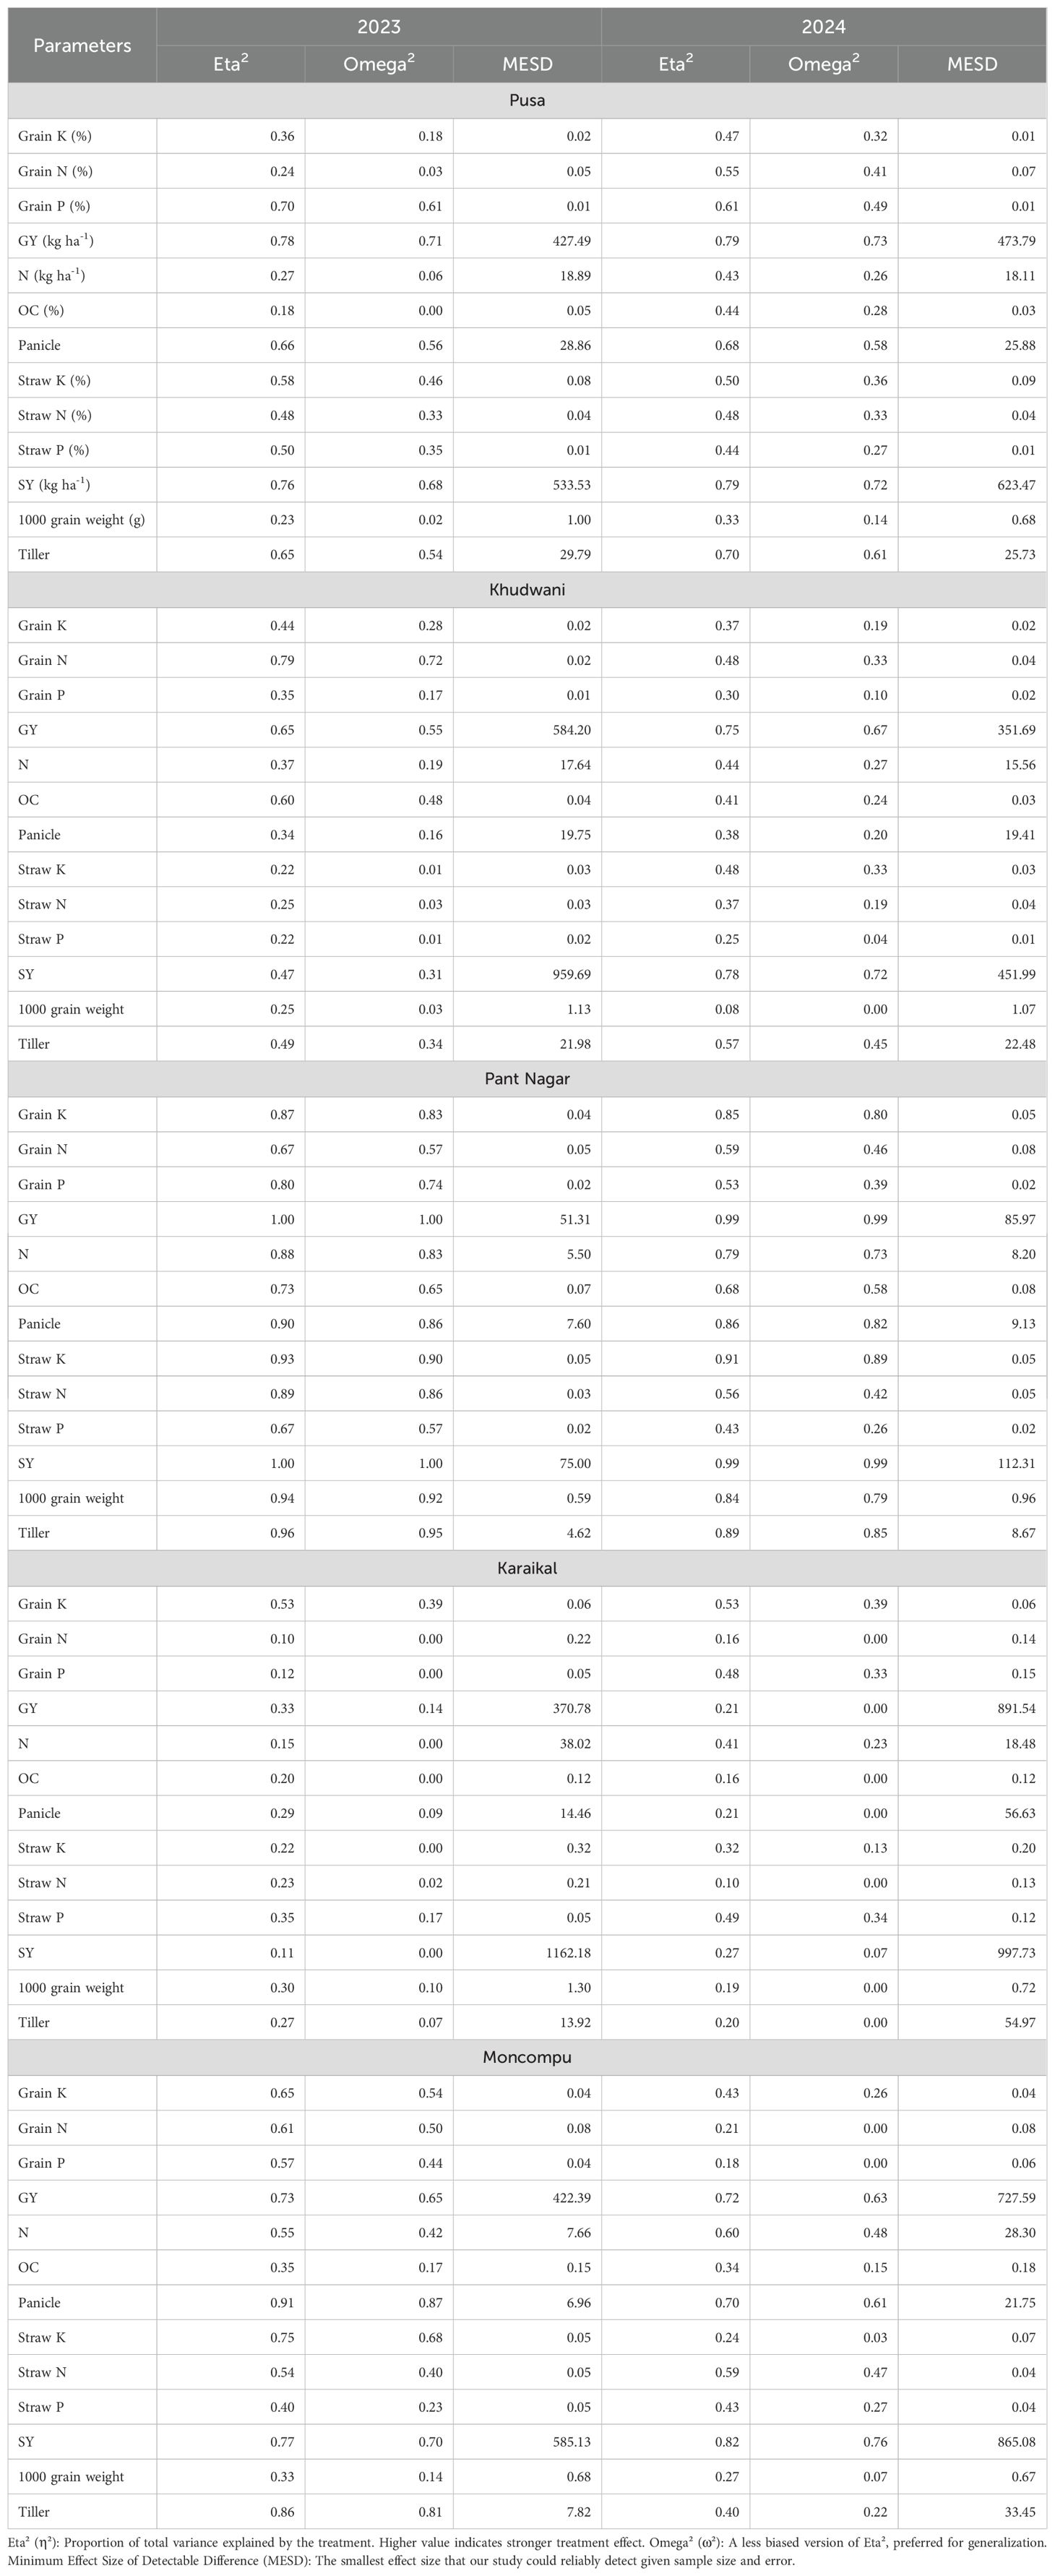
Table 8. Effect size analysis of the different locations using Eta2, Omega2, and minimum effect size of detectable difference.
At the Pusa center, a moderate to high treatment responsiveness was observed for most parameters. Grain and straw yield exhibited notable η2 values of 0.78 and 0.76 in 2023, which increased to 0.79 and 0.79 in 2024, respectively (Table 8). These values indicate that a significant proportion of the parameter variation was attributable to the treatment effects. Conversely, consistently poor η2 and ω2 values for panicle number, tiller count, and grain P suggest a more stable effect from the treatments. Moderately high MESD values for grain yield (427.49, 473.79) and straw yield (533.53, 623.47) indicate a high level of effect detection, whereas lower MESD values for other nutrient traits point to greater detection sensitivity.
At the Khudwani location, the effect size analysis revealed moderate and trait-specific treatment responsiveness over the two years (Table 8). In 2023, strong treatment-induced variation was observed for grain N (η2 = 0.79; ω2 = 0.72) and grain yield (η2 = 0.65; ω2 = 0.55). In contrast, lower η2 and ω2 values for grain P and panicle number suggested weaker treatment effects. The effect size for grain yield increased in 2024 (η2 = 0.75; ω2 = 0.67), indicating a moderate treatment influence. High MESD values for yield and 1000-grain weight, however, suggest that greater error variability was associated with these traits. The low effect size at Karaikal indicates a weak and variable treatment response, classifying it as a low-responsive site. For instance, the low η2 and ω2 values for grain yield (0.33, 0.14 in 2023 and 0.21, 0.00 in 2024) point to minimal treatment variance and high residual error (Table 8). Poor treatment effects were similarly observed for grain N, straw N, and organic carbon, which also showed low ω2 values. The high MESD values for straw yield (1162.18, 997.73) and grain yield (370.8, 891.4) in 2023 and 2024, respectively, suggest that only large treatment differences could be detected. An exception was the modest effect of P treatment on grain P in 2024 (η2 = 0.48; ω2 = 0.33; MESD = 0.15).
The Moncompu site exhibited moderate to high treatment responsiveness, as evidenced by the high η2 values for grain yield, straw yield, panicle number, and tiller count, though these values slightly decreased from 2023 to 2024 (Table 8). Panicle number (η2 = 0.91; ω2 = 0.87 in 2023) and tiller count (η2 = 0.86) showed particularly strong responsiveness, which suggests a clear and reproducible treatment effect. While MESD values for grain and straw yield were moderately high (e.g., grain yield = 422.39, 727.59; straw yield = 585.13, 865.08 in 2023 and 2024, respectively), indicating lower measurement precision, lower MESD values for other parameters point to a greater sensitivity for detecting treatment effects. Overall, this effect size analysis highlights that the strength, consistency, and performance of treatment effects are highly location and trait-specific. Among these experimental sites, Pantnagar expressed high experimental sensitivity, can be considered an optimal site for evaluating agronomic interventions. On the other hand, Karaikal require refined evaluation practices such as increased replication to enhance treatment effect.
4 Discussion
4.1 Yield attributes
This study indicated that a reduction in the recommended dose of fertiliser application, along with straw incorporation, resulted in statistically comparable improvement in tiller number and panicle number with the full recommended dose of fertiliser. This superior response in residue replacement treatment is due to better nutrient availability by residue decomposition, better synchronization of nutrient release and rice plants demand, and reduced tiller mortality. Moreover, this higher tiller and panicle number could be attributed to several factors, including improved soil structure due to residue retention, enhanced nutrient cycling, and increased microbial activity, and the balanced application of synthetic fertilisers, organic materials and decomposers (40, 41). Also, it could be attributed to the high N supply of the native soil of the respective locations. Reduced yield attributes observed in the control (T6) and less RDF plots involving 50% RDF and residues may be attributed to the limited nutrient supply capacity of these treatments. The 50% residue + 50% GM/GLM treatment led to a significant decline across all measured parameters compared to 100% RDF and 50% residue + 50% RDF treatments, except in Pant Nagar and Karaikal during 2023. These results highlight the need for balanced fertilisation to ensure robust early crop development. This finding is aligned with Lamba and Gill (21), who reported that the combined use of recommended fertilizer, residue, and microbial decomposer improves the nutrient availability and yield attributes under irrigated rice system.
4.2 Straw and grain yield
The 100% RDF treatment demonstrated superior grain and straw yield, reflecting an optimal balance of nutrition and synchronization with plant N demand, which significantly enhanced plant growth and dry matter accumulation. In contrast, partial residue incorporation (25%) combined with PD (T5) produced yields comparable to 100% RDF, attributed to improved nutrient availability and accelerated residue decomposition. The fungal consortia present in PD expedite the enzymatic breakdown of crop residues, leading to rapid nutrient release and enhanced uptake, thereby fostering plant development and productivity. This finding aligns with Singh et al. (42), who reported that the integration of PD with RDF accelerates rice straw decomposition and enhances both yield and yield parameters. Additionally, the observed increase in total dry matter accumulation could be attributed to multiple contributing factors, including improved soil physio-chemical properties, microbial activity, organic matter content, root development, enhanced K recycling, and faster N assimilation (mineralization).
Specifically, co-treatments incorporating 75% RDF, rice straw, GM, and decomposer synergistically improved soil N, K, and OC availability, further driving rice productivity. The mechanisms by which straw incorporation, in conjunction with N fertilization, enhances rice yield could be attributed to following factors, i.e. straw and N fertilization altered the soil’s physical structure, facilitated the leaching of salts from the soil, and less loss of NH4+-N and NO3−-N (43). Moreover, the combined application of organic and inorganic inputs effectively enhances soil fertility, boosts grain yield, and reduces dependency on synthetic fertilizers (44, 45). However, 50% N substitution through residue and GLM (with or without decomposer) failed to yield consistent results across locations due to spatial variability in nutrient release and soil nutrient reserves. This reduction is primarily associated with the high carbon-to-nitrogen (C: N) ratio of rice straw, which slows decomposition and induces N immobilization, limiting its availability for rice uptake (46, 47).
4.3 Yield stability analysis using AMMI model
T1 treatment achieved the highest average grain yield (5395 kg ha-1) among all treatments. However, it exhibited low stability across the study locations, as indicated by its relatively high ASV (30). This suggests that while it can produce excellent yields under optimal conditions, its performance might fluctuate significantly in varying environments. It is best suited for areas where the goal is to maximize yield, potentially with controlled conditions or in specific environments where its performance is consistently high (Table 9, Figure 10). T2 treatment yielded a moderate average grain yield (4767 kg ha-1) among all treatments. Crucially, it demonstrated the best stability across the study locations (lowest ASV = 10). This indicates that T2 is very reliable and consistent in its performance across different study locations, even under variable environmental conditions. While its yield isn’t the highest, its reliability makes it a strong candidate for farming systems prioritizing consistent returns.
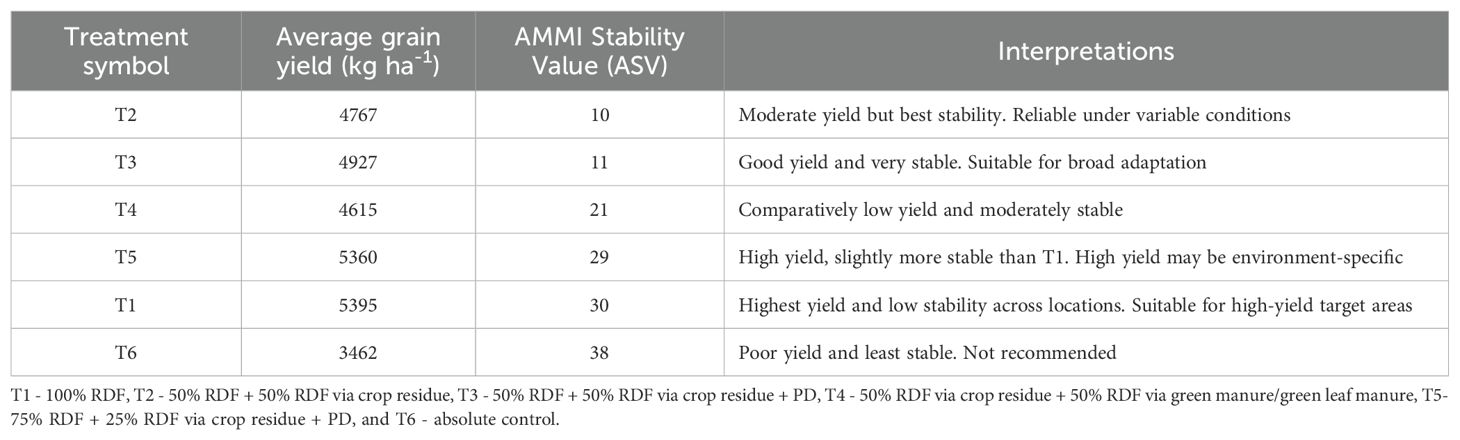
Table 9. AMMI stability value for grain yield across locations.
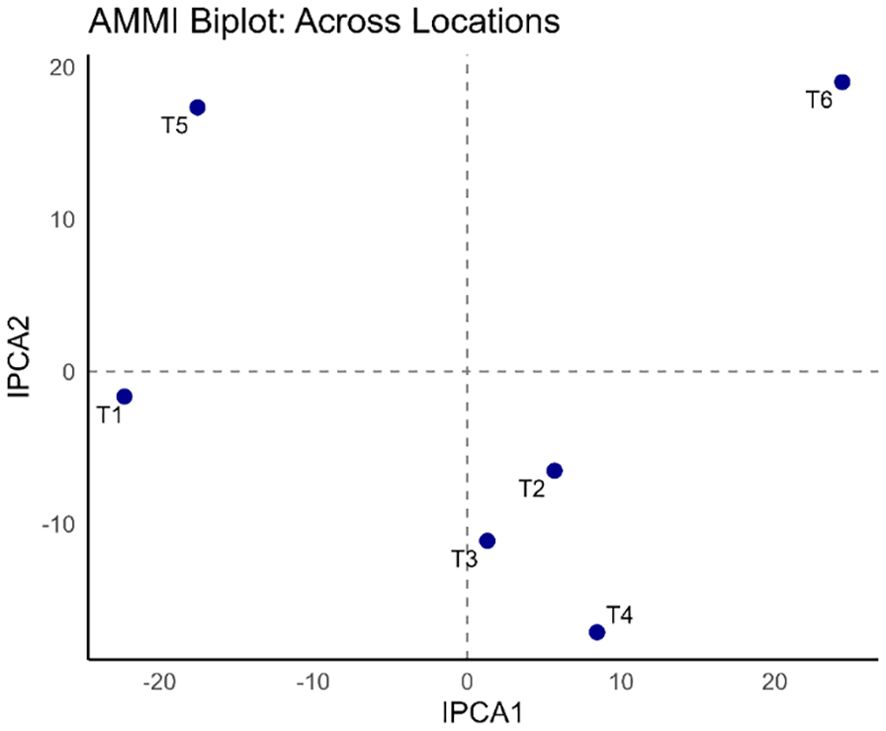
Figure 10. AMMI Biplot for treatment stability across locations. (Stable treatments positioned near the origin).
T3 achieved a good average grain yield (4927 kg ha-1) among all treatments and was found to be very stable, with an ASV (11) close to the best-performing T2. This excellent combination of good yield and high stability makes this treatment particularly suitable for broad adaptation. It suggests that T3 can perform well and consistently across a wide range of environments, offering a robust solution for diverse farming conditions. T4 treatment resulted in a comparatively low average grain yield (4615 kg ha-1) among the improved treatments. It showed moderate stability, falling somewhere in the middle of the stability range (ASV = 21). While it incorporates organic components, its overall performance in terms of both yield and stability is not as competitive as T1, T3, or T5.
T5 produced a high average grain yield (5360 kg ha-1), very close to the highest yield achieved by T1. It showed slightly better stability than T1 (lower ASV), suggesting a marginal improvement in consistency. However, similar to T1, its high yield may still be environment-specific, meaning its superior performance might not be consistent across all possible environmental variations. As expected, T6 (the absolute control with no external inputs) resulted in the poorest average grain yield (3462 kg ha-1) and was the least stable (highest ASV = 38) among all treatments. This confirms its unsuitability for optimal crop production and highlights the necessity of proper nutrient management and soil improvement strategies. It is not recommended for practical application.
Diagnostic checks were conducted to support the validity of the AMMI model. Residual normality was assessed using the Shapiro-Wilk test (W = 0.9577, p = 0.2705), which indicated no significant deviation from a normal distribution. This was further confirmed by a Q-Q plot (Supplementary Figure S1). Homogeneity of variance was tested using Levene’s test (F = 1.2897, p = 0.3008), suggesting that the assumption of equal variances across environments holds. The residual vs. fitted values plot showed no discernible pattern (Supplementary Figure S2), which supports the assumption of homoscedasticity. A histogram of the residuals also demonstrated a symmetric distribution centered around zero (Supplementary Figure S3), further supporting the normality assumption. Collectively, these diagnostics validate the core assumptions of the AMMI model for our multi-environment trial data. The multiplicative structure of the G×E interactions was supported by the first two significant interaction principal components (IPC1 and IPC2), which together explained over 95% of the interaction variance. IPC1, accounting for over 60% of the variation, was highly significant (p = 0.0071), while IPC2 also contributed meaningfully (p = 0.0635). These results confirmed that the AMMI model was appropriate and interpretable for capturing G × E patterns (Supplementary Figure S4).
4.4 NPK content in straw and grain
This study demonstrates that straw nutrient (NPK) concentrations were generally consistent across treatments and locations, with the exception of Karaikal, where high spatial variability in soil characteristics influenced nutrient dynamics. Treatments involving 100% RDF and 75% RDF with partial residue incorporation maintained comparable straw N levels across most sites, underscoring the efficacy of integrated nutrient management. Notably, T2 (50% substitution with residue and PD) resulted in substantial N assimilation at Khudwani (0.54 ± 0.02%) and Pantnagar (0.55 ± 0.01%), illustrating the potential of organic N recycling when optimized with microbial inputs. This outcome aligns with findings by Wang et al. (48), who reported that the co-application of straw and decomposers enhances N availability in soils with moderate fertility. However, at locations such as Pusa and Karaikal, N assimilation was comparatively lower, likely due to site-specific constraints such as suboptimal mineralization, poor microbial activity, or lower soil N reserves.
Rice straw, with its modest N content (~0.7%) and inherently high C:N ratio, undergoes slow decomposition, leading to N immobilization and delayed release (49). Sole reliance on residue or GM/GLM proved insufficient nutrient supply and synchronize to match the performance of inorganic or integrated treatments, reinforcing that organic sources alone often lack the rapid nutrient availability needed for high-yielding rice systems. The application of microbial decomposers in conjunction with inorganic N has been shown to significantly accelerate straw degradation, enhance microbial-mediated nutrient turnover, and improve N uptake efficiency (50). This synergy is vital for meeting crop N demands, especially during critical growth stages.
P dynamics revealed unique trends in the studied sites. At Karaikal, organic-only treatments outperformed conventional fertilizer treatments, likely due to localized variations in soil P and microbial activity. Research suggests that organic amendments, including microbial decomposers, can increase the bioavailability of labile P through mineralization and acidification processes (51). Despite this, the superiority of T1 and T5 across most locations highlights the critical need to maintain adequate inorganic P inputs under residue-based nutrient management. Organic inputs, though beneficial for building soil P pools, often fall short in delivering sufficient P to meet immediate plant demands, especially under high-residue scenarios with elevated P sorption or low mineralization rates. Interestingly, higher P concentrations in the control (T6) and organic-only treatments (T4) at Karaikal and Moncompu may be linked to P from past fertilization or enhanced microbial solubilization under low-input systems.
K concentrations in both straw and grain were significantly influenced by treatments T1 and T5, affirming the benefit of combining full or partial inorganic K with organic amendments. Residue-based treatments also elevated K levels across sites, except in the clay-heavy soils of Pantnagar, where K fixation likely limited its plant availability. This aligns with findings by Yan et al. (52), who reported that soil texture critically affects K dynamics and exchangeability. In particular, Karaikal’s sandy loam soils responded well to straw plus GM combinations, achieving grain K levels comparable to full RDF. This can be attributed to the high intrinsic K content of rice straw and the capacity of organic residues to recycle up to 80% of the crop’s K demand when adequately decomposed with microbial inoculants (43). Moreover, in coarse-textured soils, organic inputs enhance K retention by improving cation exchange capacity and microbial activity, which are essential for sustaining crop productivity in coastal and salt-affected environments.
4.5 Effects of treatment combinations on soil chemical properties
The combined application of synthetic N fertiliser and rice straw significantly influenced soil N and OC dynamics across treatments and locations. As primary indicators of soil fertility, both soil N and OC play pivotal roles in sustaining rice productivity. Treatments integrating synthetic fertilizer with rice straw (T5) demonstrated improved soil N availability, likely due to synergistic effects that promote a reduced C:N ratio and enhanced nutrient mineralization. The inclusion of PD further accelerated straw breakdown, facilitating quicker nutrient release and promoting microbial activity. In contrast, treatments relying solely on organic inputs such as crop residues and GM/GLM (T3 and T4) maintained a relatively higher C:N ratio, which slowed decomposition and resulted in reduced N mineralization.
Nonetheless, these treatments contributed to an increase in soil OC across locations, reflecting the long-term benefits of organic matter accumulation despite lower immediate nutrient availability. Significant differences in soil OC and N content suggest that continuous application of combined synthetic and organic inputs fosters gradual enrichment of soil organic matter and N pools. This aligns with findings by Chen et al. (53), who highlighted that residue retention enhances carbon transformation pathways, forming stable carbon intermediates that contribute to OC buildup. Similarly, Lal (54) emphasized that integrated nutrient strategies improve nutrient-use efficiency and support carbon sequestration, critical for maintaining soil health under intensive rice systems. Furthermore, studies by Bhattacharyya et al. (55) and Kumar et al. (56) corroborate that balanced N input with residue incorporation minimizes nutrient losses, stimulates microbial turnover, and enhances soil structure and fertility.
4.6 Nutrient dynamics over the years
Our two-year post-experiment assessment revealed complex, site-specific changes in soil OC, N, P, and K, driven by a combination of input types, climate, microbial activity, and inherent soil characteristics.
4.6.1 Organic carbon dynamics
A general trend of OC depletion was observed at Karaikal, Khudwani, and Moncompu, indicating that the rates of carbon input (even with residue retention in some treatments) were insufficient to offset decomposition or carbon losses. This is often typical in intensive rice systems where high temperatures and fluctuating moisture regimes can accelerate microbial activity and organic matter turnover. The “mining” of OC suggests that the soil’s existing carbon reserves were being utilized without adequate replenishment (57). However, a positive OC balance (buildup), was noted in T4 (50% RDF via GM + 50% RDF via crop residue) at Moncompu (~8% increase), and significantly in T5 (75% RDF via fertilizers + 25% RDF via crop residue) at Pantnagar (~22% increase), and across Pusa (except T1 and T6). According to Xu et al. (58), incorporating higher rate of rice and wheat straw resulted in the greatest improvement in soil OC content and quality (C: N ratio) compared to other straw return rates. These improvements are directly linked to the increased and consistent incorporation of organic matter, such as crop residues and GM, which provides a substrate for humification (59). While the decomposition of fresh organic matter initially releases nutrients, a portion of the carbon is stabilized into more recalcitrant forms, contributing to long-term OC accumulation. The contrasting results underscore the importance of both the quantity and quality of organic inputs, as well as site-specific decomposition rates.
4.6.2 Nitrogen dynamics
N, being highly dynamic, showed variable responses. Depletion of soil N was a common observation in Karaikal, Khudwani, and in specific treatments (T3, T4, T6) at Moncompu. This “N mining” points to several potential mechanisms: significant crop uptake exceeding supply, leaching of nitrate-N, and denitrification under anaerobic paddy conditions. The higher N depletion in T6 (absolute control) across all sites clearly demonstrates the continuous demand for N by the crop in the absence of external inputs. Conversely, treatments receiving synthetic N fertilizers (T1, T5) or substantial organic N inputs (T2, T3, T4 through residue/GM mineralization) often led to N buildup or mitigated depletion, as seen at Pantnagar (T1, T5) and Pusa. Similar N buildup was recorded in RDF application combined with rice straw at 5 ton/ha compared with no-straw and no-N application in rice-wheat system at Punjab (60). The efficacy of organic amendments in sustaining N levels, particularly in organic-based treatments, reflects the slow and steady mineralization of organic N, providing a more synchronized release of nutrients with crop demand, unlike the more transient availability from soluble inorganic fertilizers.
4.6.3 Phosphorus dynamics
P behavior was strongly influenced by soil type and pH. Significant P mining was observed in Khudwani and consistently across all treatments at Moncompu (20-40% depletion). This widespread depletion often occurs in acidic soils where P is readily fixed by aluminum and iron oxides, making it unavailable for plant uptake and increasing the need for higher P applications to meet crop demand. In contrast, positive P balances and substantial buildups were noted in T2, T3, and T5 at Karaikal, and remarkably high increases in T1, T2, T3, T4, and T5 at Pusa (25-40% buildup). This highlights the effectiveness of both inorganic P fertilizer application (T1, T5) and the strategic incorporation of residues (T2, T3, T4). Also, straw retention combined with fertilizer improved soil nutrient status and reduced the adsorption of soil P (61). Organic matter decomposition from residues can release organic acids that solubilize fixed inorganic P and contribute to organic P pools, which are subsequently mineralized, enhancing P availability.
4.6.4 Potassium dynamics
A pervasive trend of K buildup was observed across most sites, including Karaikal, Khudwani (T1, T3, T5), Moncompu (except T6), and Pusa. This is a significant finding, suggesting that K inputs from fertilizers and especially from crop residue retention are effectively compensating for or exceeding K removal by the crop. K is a macronutrient taken up in large quantities, and its return via crop residues can significantly recycle it within the soil-plant system. The notable exception was Pantnagar, where soil K consistently declined by 10-20% across all treatments, indicating inherent soil characteristics (e.g., high clay content leading to K fixation in non-exchangeable forms, or high leaching potential in silty clay soil) that predispose it to K mining irrespective of management. In Khudwani and Moncompu, K mining was confined largely to T6 (control), further emphasizing the role of external K inputs and residue recycling in maintaining K levels.
Integrated nutrient management practices involving both fertilizers and residue retention (T2, T3, T5) generally proved effective in sustaining or improving soil nutrient status, particularly for P and K, and in some cases, OC and N. However, the site-specific variability underscores that blanket recommendations are insufficient. Factors such as initial soil nutrient status, soil type (e.g., highly fixing soils for P or K), climate (affecting decomposition and leaching), and inherent microbial communities play critical roles in dictating the long-term changes in soil health and nutrient availability. These findings reinforce the need for site-specific nutrient management strategies that consider both external inputs and the internal recycling potential of organic resources for sustainable rice production.
4.7 Bayesian tile probabilities
The posterior probabilities for nutrient replacement through crop residue, GM and PD showed improvements in soil nutrient parameters (K, P, N, and OC) compared to the 100% RDF (T1) across five locations (Figure 11). N exhibited moderate improvement across locations, with enhanced response under integrated treatments. T2 (50% substitution through residue) showed lower efficacy at Karaikal and Khudwani, while Moncompu reported better N dynamics under T2 and T3. Pantnagar had largely negative N responses, except moderate improvement under T5 (partial residue + decomposer), which consistently performed better across locations.
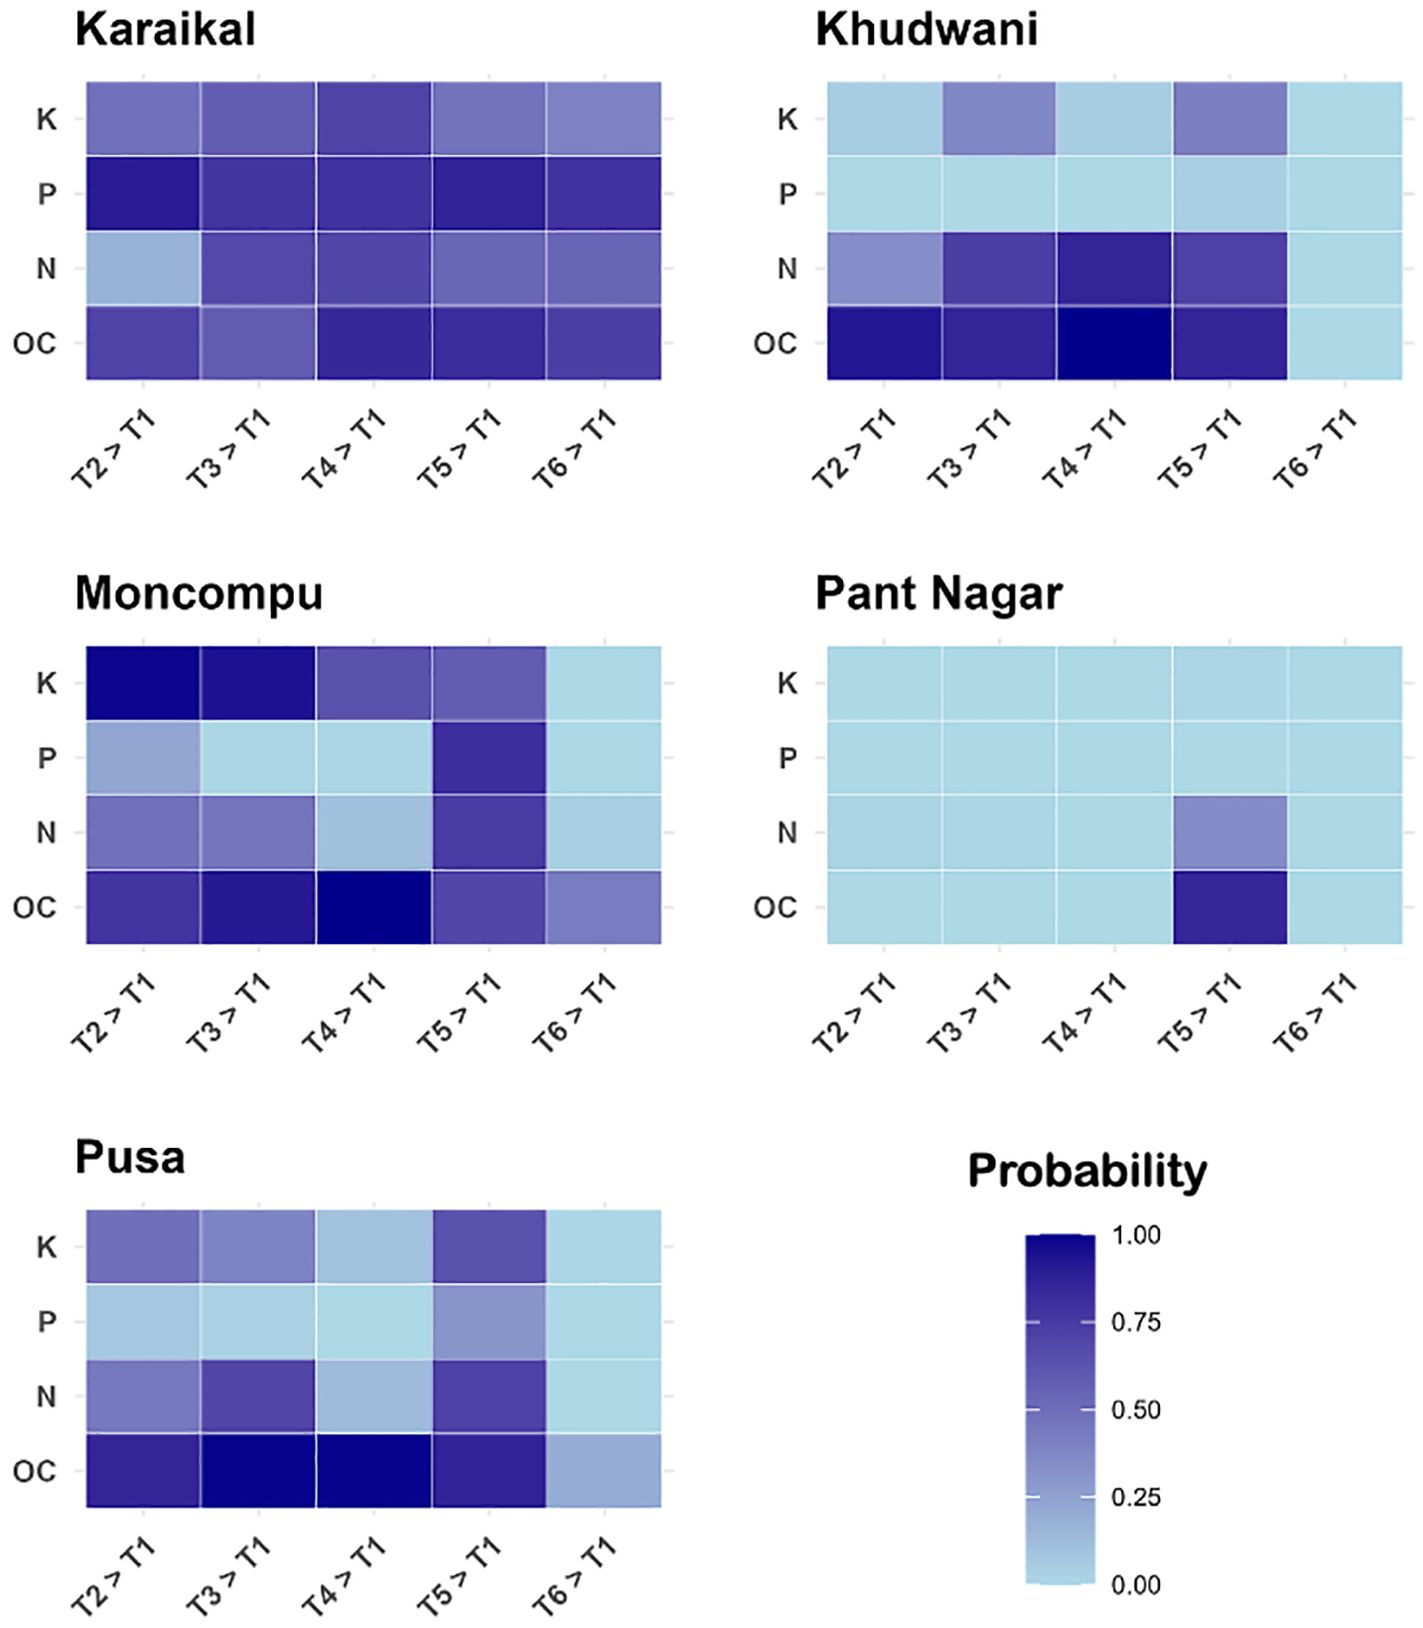
Figure 11. Five Bayesian tile probabilities heatmaps labelled Karaikal, Khudwani, Moncompu, Pant Nagar, and Pusa depict probabilities for variables K, P, N, OC across time intervals T2 to T6 compared to T1. The color gradient ranges from light blue (0.00 probability) to dark blue (1.00 probability).
P showed high spatial variability and was the most limiting nutrient across the locations due to poor nutrient mineralization from residues and GLM. Positive responses were seen at Karaikal, especially under T2, while Khudwani and Moncompu showed minimal improvements. Only T5 showed any P enhancement at Pantnagar, supporting the importance of integrated inputs and decomposer for efficient mineralization and P availability. K was the most responsive nutrient, especially at Moncompu under T2 and T3 due to efficient K release in coastal soils. Moderate K gains were noted at Karaikal and Khudwani under organic treatments, but Pantnagar showed poor response, likely due to leaching or fixation. Overall, residue-based treatments (T2 and T5) contributed positively to K improvement in Moncompu and Karaikal due to richer K content of straw.
As expected, OC showed the most consistent improvement across sites due to organic inputs. Karaikal and Moncompu recorded high OC probabilities, particularly under T4 and T5. Khudwani showed strong OC buildup under residue and GM (T2 and T4), while Pantnagar had limited gains, with T5 showing marginal improvement. Treatments involving residue and decomposer (T3, T4, and T5) demonstrated a strong role in enhancing soil OC, reinforcing the value of organic amendments in sustainable nutrient management.
4.8 Correlation
Irrespective of treatment, yield attributes (tillers, panicles, grain weight, 1000-grain weight) showed strong dependence on soil N and K availability. Similarly, yield attributes showed a strong positive correlation with grain yield across all treatments (Figure 12). On the contrary, grain K concentration and soil EC showed a negative correlation with grain yield across all treatments. In T1 (100% RDF), grain yield exhibited strong positive correlations with key yield parameters: tiller number (r = 0.83), panicle number (r = 0.76), thousand-grain weight (r = 0.56), and straw yield (r = 0.68). Soil N (r = 0.60), K (r = 0.50), and OC (r = 0.43) also correlated positively with grain yield. These results demonstrate that the supply of 100% nutrient requirement of the crop through synthetic fertilization ensures optimal nutrient supply, driving yield component development and final productivity.
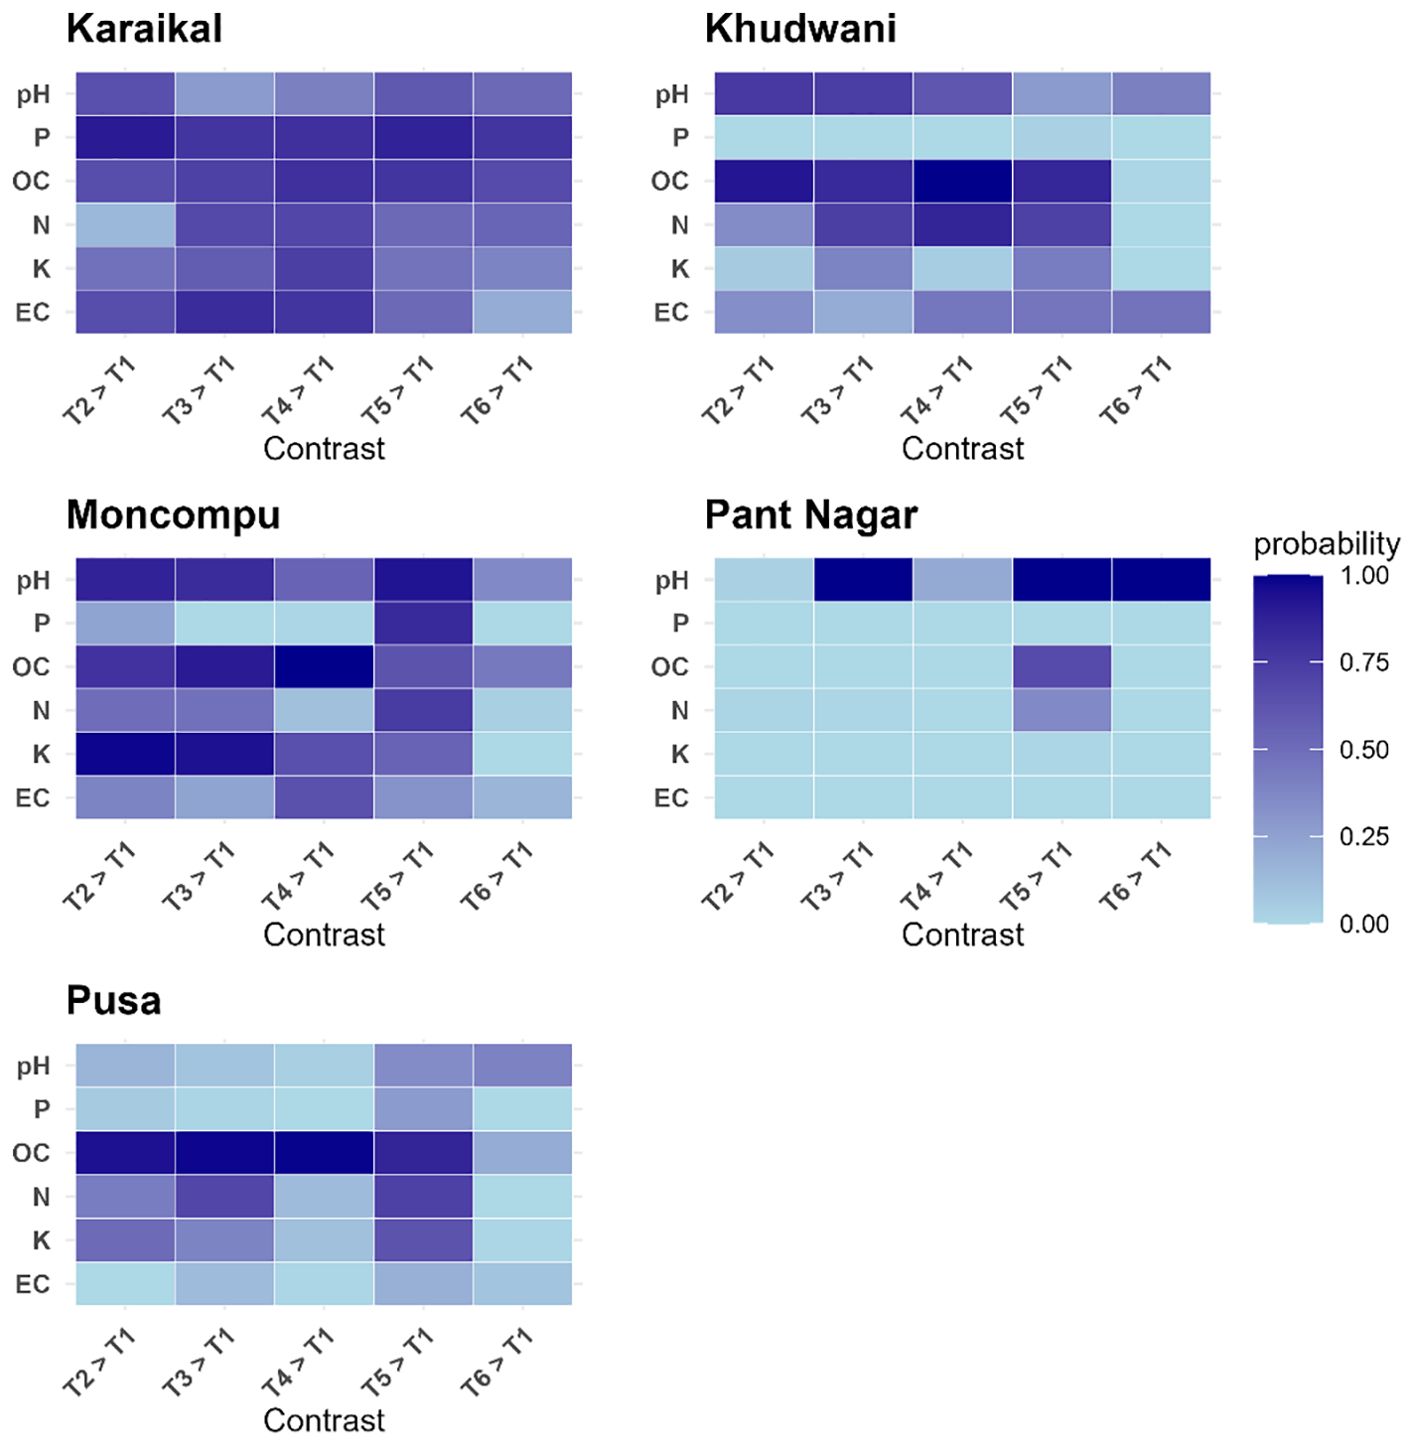
Figure 12. Pearson correlation heatmap of yield components and soil nutrients. (A) T1 - 100% RDF, (B) T2 - 50% RDF + 50% RDF via crop residue, (C) T3 - 50% RDF + 50% RDF via crop residue + PD, (D) T4 - 50% RDF via crop residue + 50% RDF via green manure/green leaf manure, (E) T5 - 75% RDF + 25% RDF via crop residue + PD, (F) T6 - absolute control, RDF - Recommended dose of fertilizer, and PD - Pusa decomposer. (P - soil phosphorus; N - soil nitrogen; OC - organic carbon; EC - electrical conductivity; Straw K - potassium content in rice straw; Straw P - phosphorus content in rice straw; Straw N - nitrogen content in rice straw; Grain K - potassium content in rice grain; Grain P - phosphorus content in rice grain; Grain N - nitrogen content in rice grain, Thous GW - thousand grain weight; Panicle - panicle count per m2; Tiller - tiller count per m2).
In T2 (50% RDF + 50% Residue), grain yield maintained robust correlations with tiller number (r = 0.83), panicle number (r = 0.79), soil N (r = 0.73), and soil K (r = 0.64), though linkage to thousand-grain weight weakened (r = 0.44). This confirms that substituting 50% synthetic N with residue sustains yield-critical relationships. Residue decomposition effectively releases nutrients, supporting growth dynamics and grain yield, indicating synergistic integration of chemical and organic N sources. In T3 (T2 + PD), the microbial inoculant amplified residue mineralization, strengthening grain yield correlations with tiller number (r = 0.87) and panicle number (r = 0.84). Soil N exhibited enhanced efficiency, showing exceptionally high correlations with straw yield (r = 0.88), thousand-grain weight (r = 0.87), and OC (r = 0.58). Soil K remained strongly linked to grain yield (r = 0.74) and N availability, confirming that accelerated residue breakdown improves K mobilization alongside N.
T4 (50% Residue + 50% GM/GLM) drove the strongest positive correlation between grain yield and yield-attribute: tiller number (r = 0.84), panicle number (r = 0.84), and straw yield (r = 0.81). Soil N remained pivotal for grain yield (r = 0.73), while K demonstrated integrated cycling with N (soil K-N: r = 0.58). This highlights GM/GLM as a functionally equivalent alternative to rice residue for N supplementation, enabling flexible organic sourcing strategies. Overall, the 50% N substitution through residue (T2, T3, and T4) outperformed 100% synthetic fertilization (T1) in nutrient-yield coupling, notably enhancing N-K synergies. This aligns with the synchrony hypothesis: Crop residue mineralization better matches rice growth stages than split-applied synthetic fertilizers. T3’s PD further amplified this effect, boosting N mineralization, confirming accelerated enzymatic breakdown of residue. T4’s GM/GLM-residue blend achieved the highest yield-attribute correlations, demonstrating functional complementarity such as slow-release N, K, reduced leaching losses, and physical soil structuring.
4.9 Unravelling rice yield drivers: A PLSR analysis across six treatments
This study utilized PLSR to identify key factors influencing rice grain yield (GY) across six treatments (T1-T6) (Figure 13). The PLSR models consistently explained a substantial proportion of the variability in both predictor variables and GY, with the first two components (PLS1 and PLS2) cumulatively accounting for 63.8% to 70.0% of predictor variance and 82.9% to 90.8% of GY variability across all treatments, demonstrating their efficacy in capturing complex relationships. T1 (100% RDF) captured 64.9% of predictor variability and 82.9% of GY; T2 (50% RDF via fertilizer + 50% RDF via residue) explained 69.4% of predictor variability and 85.0% of GY; T3 (50% RDF via urea + 50% RDF via residue + PD) accounted for 70.0% of predictor variability and 85.8% of GY; T4 (50% RDF via Residue + 50% RDF via GM/GLM) showed 67.5% of predictor variability and 86.2% of GY; T5 (75% RDF via fertilizer + 25% RDF via Residue + PD) captured 63.8% of predictor variability and 88.8% of GY; and T6 (Absolute Control) explained 64.7% of predictor variability and 90.8% of GY.
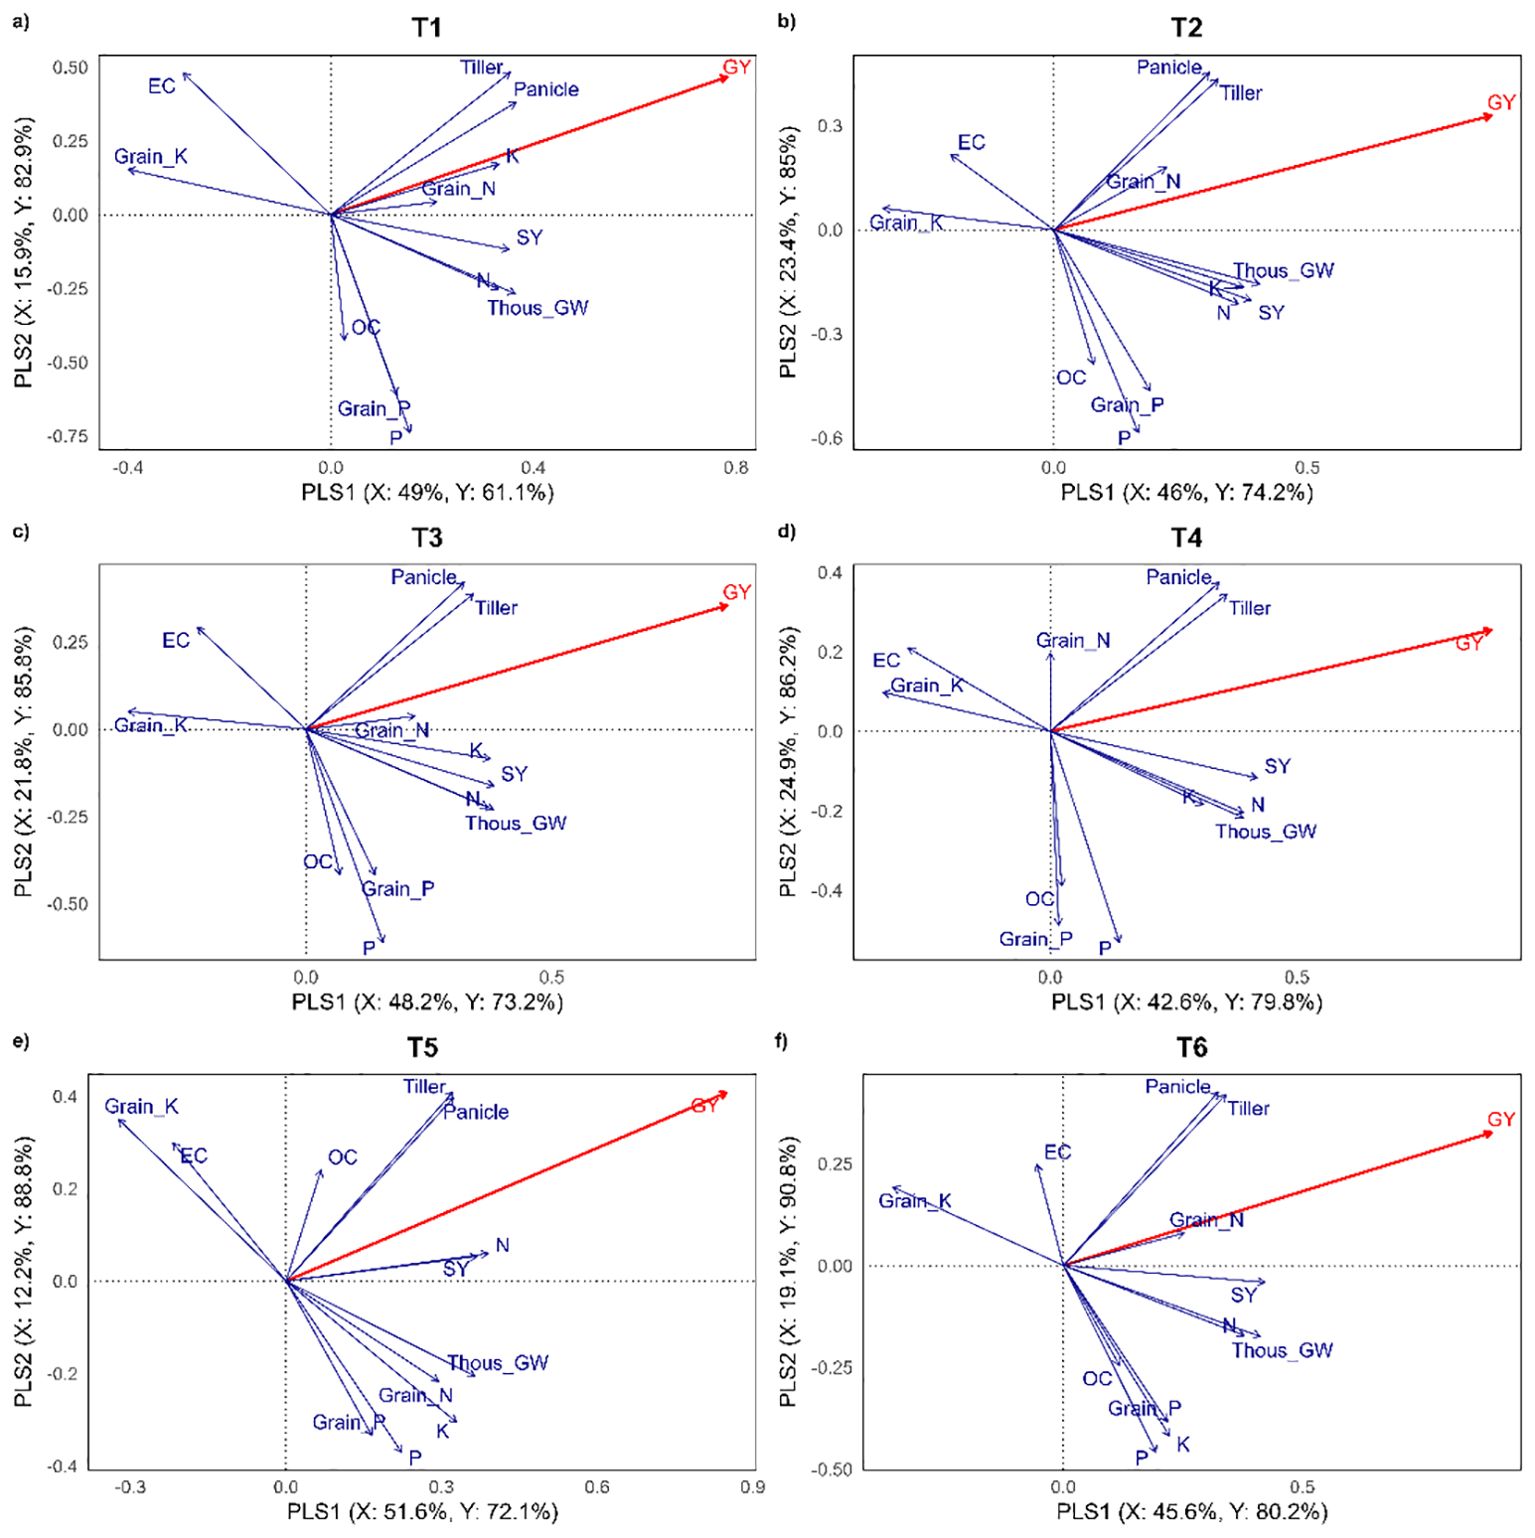
Figure 13. PLSR scatter plot on factors influencing grain yield enhancement. (A) T1 - 100% RDF, (B) T2 - 50% RDF + 50% RDF via crop residue, (C) T3 - 50% RDF + 50% RDF via crop residue + PD, (D) T4 - 50% RDF via crop residue + 50% RDF via green manure/green leaf manure, (E) T5 - 75% RDF + 25% RDF via crop residue + PD, (F) T6 - absolute control, RDF - Recommended dose of fertilizer, and PD - Pusa decomposer. (GY - grain yield; SY - straw yield; Grain N - grain nitrogen content; Grain P - grain phosphorus; Grain K - grain K content; EC - soil electrical conductivity, OC - soil organic carbon; N - soil nitrogen; P - soil phosphorus; K - soil potassium; Thous GW - thousand grain weight; Tiller - tiller count per m2; Panicle - panicle count per m2).
Across these treatments, several consistent patterns emerged regarding the drivers of GY. Grain nitrogen (Grain_N) and straw yield (SY) consistently appeared as dominant positive drivers, highlighting their crucial role in productivity across varying input levels. Similarly, key yield attributes such as tillers per m2, panicles per m2, and thousand-grain weight consistently exhibited strong positive associations with GY, emphasizing their fundamental importance in yield formation. Soil N and soil K were also frequently identified as significant positive contributors. Conversely, grain phosphorus (Grain_P), soil OC, soil P, and soil EC generally showed minimal direct influence or even negative associations with GY, while grain K often exhibited an inverse relationship. These findings collectively underscore the primary role of nitrogen availability (both in grain and soil), biomass production (SY), and core plant yield components in determining rice grain yield, with other soil factors playing a less direct or consistent role.
4.10 Strategies for large-scale rice straw recycling
Implementing large-scale rice straw residue recycling requires a combination of strong institutional support and effective extension services. Governments must lead the way by creating favorable policies and offering financial incentives, such as subsidies for essential machinery like balers. They also need to establish a stable market with fair prices for the baled straw. A robust regulatory framework is essential to enforce anti-burning laws and encourage public-private partnerships that build efficient supply chains. While some states in India have already implemented strict regulations, these policies need to be uniformly applied across the entire country. Extension services are critical for closing the gap between policy and on-the-ground practice. This includes extensive farmer training and awareness campaigns, which can be delivered through demonstration plots and on-farm workshops. These platforms allow farmers to see the environmental and economic benefits of recycling paddy straw. It’s also vital to provide technical guidance through well-trained extension agents and to promote farmer producer organizations and custom hiring centers. These initiatives empower farmers with the skills and resources to adopt sustainable practices, helping them transition away from burning residue and toward a more circular agricultural economy. To further accelerate this shift, governments should prioritize the year-round availability of low-cost microbial solutions, such as PD, across the country. This requires investing in infrastructure for the mass production of these microbial consortia while ensuring quality and price control. Finally, to promote wider adoption, on-farm and on-station trial videos demonstrating the entire process from sowing to harvest should be recorded and broadcast in all vernacular languages through television and other mass media.
4.11 Limitations and future perspectives
While this study provides valuable insights into the efficacy of rice straw recycling as a nutrient supplement, it is important to acknowledge certain limitations that may affect the generalizability of our findings. The experiment was conducted under specific agro-climatic conditions and soil type, which may not be fully representative of the diverse rice-growing regions across India. The effectiveness of the microbial inoculant and the decomposition rate of the rice straw can be highly sensitive to environmental factors such as temperature, moisture, and soil microbial communities, which vary significantly across different locations. Additionally, the composition and quality of rice residue itself can differ based on the rice variety, harvesting practices, and local conditions, which may influence the release of nutrients. Further investigation into the economic feasibility of this practice at the farm level is also warranted.
5 Conclusion
Our two-year, multi-location study conclusively demonstrates that integrating inorganic fertilizers with crop residues significantly enhances both crop yield and soil health in rice-based systems. Specifically, applying either 100% of the RDF through inorganic sources (T1) or a combination of 75% RDF from inorganic sources and 25% from crop residues (based on N equivalence, along with microbial decomposers) consistently delivered high yields across all tested locations. This indicates a clear opportunity for farmers to utilize readily available crop residues as a partial substitute for inorganic fertilizers. This practice offers multiple benefits: it can reduce the financial investment in synthetic fertilizers, improve nutrient use efficiency, minimize environmental issues associated with excessive inorganic fertilizer use, solve the problem of residue burning, and, crucially, enhance soil health by increasing OC, N, and K levels.
While the effectiveness of these treatments showed some variation influenced by site-specific soil characteristics and residue decomposition, the overall trend is clear. It’s important to note that while a 50% substitution of nutrients through crop residue did improve soil health (notably promoted OC and K accumulation), it resulted in a significant yield reduction compared to current farmer practices (T1). Similarly, 100% organic treatment (T4) also led to improved soil properties, including increases in soil N, P, and OC, but unfortunately, it was accompanied by significant yield loss. In summary, our findings strongly suggest that a partial substitution (25%) of inorganic fertilizer with organic sources, especially when combined with microbial decomposers, provides a highly sustainable and effective nutrient management strategy for rice-based agricultural systems.
Data availability statement
The original contributions presented in the study are included in the article/Supplementary Material. Further inquiries can be directed to the corresponding author.
Author contributions
GR: Conceptualization, Data curation, Writing – original draft, Writing – review & editing. VS: Conceptualization, Formal analysis, Funding acquisition, Methodology, Supervision, Visualization, Writing – original draft, Writing – review & editing. AL: Data curation, Investigation, Writing – original draft, Writing – review & editing. LA: Data curation, Investigation, Writing – original draft, Writing – review & editing. BJ: Data curation, Investigation, Writing – original draft, Writing – review & editing. VK: Data curation, Investigation, Writing – original draft, Writing – review & editing. AP: Data curation, Investigation, Writing – original draft, Writing – review & editing. AS: Formal analysis, Methodology, Writing – original draft, Writing – review & editing. PM: Project administration, Supervision, Writing – review & editing. MR: Project administration, Supervision, Writing – review & editing. SR: Funding acquisition, Project administration, Resources, Supervision, Writing – review & editing.
Funding
The author(s) declare that no financial support was received for the research, and/or publication of this article.
Acknowledgments
The authors acknowledge the Indian Institute of Rice Research, Rajendranagar, Hyderabad, India, for providing data from the All India Coordinated Research Project on Rice (AICRPR). This work was supported by the Indian Council of Agricultural Research (ICAR), Department of Agricultural Research and Education (DARE), Government of India.
Conflict of interest
The authors declare that the research was conducted in the absence of any commercial or financial relationships that could be construed as a potential conflict of interest.
Generative AI statement
The author(s) declare that no Generative AI was used in the creation of this manuscript.
Any alternative text (alt text) provided alongside figures in this article has been generated by Frontiers with the support of artificial intelligence and reasonable efforts have been made to ensure accuracy, including review by the authors wherever possible. If you identify any issues, please contact us.
Publisher’s note
All claims expressed in this article are solely those of the authors and do not necessarily represent those of their affiliated organizations, or those of the publisher, the editors and the reviewers. Any product that may be evaluated in this article, or claim that may be made by its manufacturer, is not guaranteed or endorsed by the publisher.
Supplementary material
The Supplementary Material for this article can be found online at: https://www.frontiersin.org/articles/10.3389/fsoil.2025.1649105/full#supplementary-material
References
1. FAO. Establishing residue supply chains to reduce open burning. The case of rice straw and renewable energy in Punjab, India. Rome: Environment and Natural Resources Management Working Paper No. 95 (2022).
2. Bhattacharyya P, Bisen J, Bhaduri D, Priyadarsini S, Munda S, Chakraborti M, et al. Turn the wheel from waste to wealth: Economic and environmental gain of sustainable rice straw management practices over field burning in reference to India. Sci Total Environ. (2021) 775:145896. doi: 10.1016/j.scitotenv.2021.145896
3. Lohan SK, Jat HS, Yadav AK, Sidhu HS, Jat ML, Choudhary M, et al. Burning issues of paddy residue management in north-west states of India. In: Renewable and Sustainable Energy Reviews, vol. 81. Elsevier (2018). p. 693–706.
4. Dobermann A and Fairhurst TH. Rice straw management. Better Crop Int. (2002) 16:7–11. doi: 10.5251/abjna.2011.2.12.1427.1436
5. Gupta PK, Sahai S, Singh N, Dixit CK, Singh DP, Sharma C, et al. Residue burning in rice–wheat cropping system: Causes and implications. 713-1717: Current Science (2004).
6. Kumar N, Chaudhary A, Ahlawat OP, Naorem A, Upadhyay G, Chhokar RS, et al. Crop residue management challenges, opportunities and way forward for sustainable food-energy security in India: A review. Soil Tillage Res. (2023) 228:105641. doi: 10.1016/j.still.2023.105641
7. Vijayakumar S, Gobinath R, Kannan P, and Murugaiyan V. Optimizing potassium mining in rice-wheat system: Strategies for promoting sustainable soil health - A review. Farming Syst. (2024) 2:100099. doi: 10.1016/j.farsys.2024.100099
8. Singh VK, Dwivedi BS, Mishra RP, Shukla AK, Timsina J, Upadhyay PK, et al. Yields, soil health and farm profits under a rice-wheat system: long-term effect of fertilizers and organic manures applied alone and in combination. Agronomy. (2019) 9:1. doi: 10.3390/agronomy9010001
9. Vijayakumar S, Kumar D, Ramesh K, Bussa B, Kaje VV, and Shivay YS. Effect of split application of potassium on nutrient recovery efficiency, soil nutrient balance, and system productivity under rice-wheat cropping system (RWCS). J Plant Nutr. (2024) 47:1546–63. doi: 10.1080/01904167.2024.2315974
10. Bijay-Singh Y-S, Imas P, and Xie JC. Potassium nutrition of the rice-wheat cropping system. Adv Agron. (2004) 81:203–59.
12. Vijayakumar S, Kumar V, Peramaiyan P, and Sundaram RM. Continental variations in fertilizer use and efficiency call for judicious fertilization to ensure agricultural sustainability and environmental safety. Next Res. (2025) 2(3):100476. doi: 10.1016/j.nexres.2025.100476
13. Mohanty S, Nayak AK, Tripathi R, Bhaduri D, Chatterjee D, Kumar A, et al. Nitrogen use efficiency of rice in India: a regional analysis. Int J Sustain Dev World Ecol. (2023) 12:1–14. doi: 10.1080/13504509.2023.2211542
14. Fageria NK, dos Santos AB, and Coelho AM. Growth, yield and yield components of lowland rice as influenced by ammonium sulfate and urea fertilization. J Plant Nutr. (2011) 34:371–86. doi: 10.1080/01904167.2011.536879
15. Vijayakumar S, Vikas CT, Gobinath R, Suvarna Rani C, Arun Kumar S, Mariadoss A, et al. Perennial rice – An alternative to the ‘one-sow, one-harvest’ rice production: Benefits, challenges, and future prospects. Farming Syst. (2025) 3:100137. doi: 10.1016/j.farsys.2025.100137
16. Yadav GS, Babu S, Das A, Bhowmik SN, Datta M, and Singh R. Soil carbon dynamics and productivity of rice–rice system under conservation tillage in submerged and unsubmerged ecologies of Eastern Indian Himalaya. Carbon Manage. (2019) 10:51–62. doi: 10.1080/17583004.2018.1545518
17. Dutta A, Patra A, Hazra KK, Nath CP, Kumar N, and Rakshit A. Environmental Challenges, vol. 8. (2022). p. 100581. doi: 10.1016/j.envc.2022.100581
18. Korav S, Yadav DB, Yadav A, Rajanna GA, Parshad J, Sridevi T, et al. Rice residue management alternatives in rice–wheat cropping system: impact on wheat productivity, soil organic carbon, water and microbial dynamics. Sci Rep. (2024) 14:1822. doi: 10.1038/s41598-024-52319-6
19. Sidhu BS and Beri V. Experience with managing rice residues in intensive rice-wheat cropping system in Punjab. Conserv Agric Status Prospect. (2005), 55–63.
20. Porichha GK, Hu Y, Rao KTV, and Xu CC. Crop Residue Management in India: Stubble Burning vs. Other Utilizations including Bioenergy. Energies. (2021) 14:4281. doi: 10.3390/en14144281
21. Lamba S and Gill RS. Microbial decomposer for crop residue management in rice-wheat cropping system. Lett Appl Microbiol. (2024) 77:106. doi: 10.1093/lambio/ovae106
22. Trinh MV, Loan BTP, and Van The T. Developing crop residue collection, treatment of crop residue to reduce greenhouse gas emission in rural area in Red River Delta, Report results of project from Ministry of Agriculture and Rural Development period 2011–2014. (2014).
23. Guo T, Qian Z, Chao A, Guoqing L, Ping H, and Wei Z. Nitrogen enrichment regulates straw decomposition and its associated microbial community in a double-rice cropping system. Sci Rep. (2018) 8:1847 (1–12). doi: 10.1038/s41598-018-20293-5
24. Sandhu PS, Walia SS, Gill RS, and Dheri GS. Thirty-one years study of integrated nutrient management on physico-chemical properties of soil under rice–wheat cropping system. Commun Soil Sci Plant Anal. (2020) 51:1641–57. doi: 10.1080/00103624.2020.1791156
26. IARI. The Annual Report-2020. New Delhi: ICAR-Indian Agricultural Research Institute (2021). p. 105.
27. Walkley A and Black IA. An examination of the Degtjareff Method for Determining Soil Organic Matter, and a proposed Modification of the Chromic Acid Titration Method. Soil Sci. (1934) 37:29–38. doi: 10.1097/00010694-193401000-00003
28. Subbiah BV and Asija GL. A rapid procedure for the estimation of available nitrogen in soils. Curr Sci. (1956) 25:259–60.
29. Bray RH and Kurtz LT. Determination of total organic and available forms of phosphorus in soils. Soil Science, (1945) 59, 39–45. doi: 10.1097/00010694-194501000-00006
30. Olsen SR, Cole CV, and Watanabe FS. Estimation of Available Phosphorus in Soils by Extraction with Sodium Bicarbonate. Washington DC: USDA Circular No. 939, US Government Printing Office (1954).
31. Duncan DB. Multiple range and multiple F tests. Biometrics. (1955) 11:1–42. doi: 10.2307/3001478
32. Gauch JHG and Zobel RW. Identifying mega-environments and targeting genotypes. Crop Sci. (1997) 37:311–26. doi: 10.2135/cropsci1997.0011183X003700020002x
33. Ajith S, Debnath MK, and Karthik R. Statistical and machine learning models for location-specific crop yield prediction using weather indices. Int J Biometeorol. (2024) 68:2453–75. doi: 10.1007/s00484-024-02763
34. R Core Team. R: A language and environment for statistical computing (Version 4.4.3). R Foundation for Statistical Computing (2024) Available online at: https://www.R-project.org/. (Accessed May 30, 2025).
35. Mendiburu F. agricolae: Statistical procedures for agricultural research (R package version 1.3-5) (2020). Available online at: https://CRAN.R-project.org/package=agricolae (Accessed May 30, 2025).
36. Wei T and Simko V. corrplot: Visualization of a correlation matrix (R package version 0.92) (2021). Available online at: https://CRAN.R-project.org/package=corrplot (Accessed May 30, 2025).
37. Mevik BH, Wehrens R, and Liland KH. pls: Partial Least Squares and Principal Component Regression (R package version 2.7-3) (2019). Available online at: https://CRAN.R-project.org/package=pls (Accessed May 30, 2025).
38. Bürkner PC. brms: an R package for bayesian multilevel models using stan. J Stat Softw. (2017) 80:1–28. doi: 10.18637/jss.v080.i01
39. Wickham H. ggplot2: Elegant graphics for data analysis. Springer (2016). Available online at: https://ggplot2.tidyverse.org/ (Accessed May 15, 2025).
40. Singh Y, Singh B, Ladha JK, Khind CS, Khera TS, and Bueno CS. Effects of residue decomposition on productivity and soil fertility in rice–wheat rotation. Soil Sci Soc America J. (2004) 68:854–64. doi: 10.2136/sssaj2004.8540
41. Singh D and Mina U. (2022). Comparative assessment of available soil nutrients under different tillage and crop residue management practices in rice-wheat cropping system, in: EGU22, the 24th EGU General Assembly, Vienna, Vienna (Austria): EGU General Assembly. 23–27 May, 2022.
42. Singh Y, Shivay YS, Shukla L, Sharma VK, Saha ND, Shekhawat K, Bandopadhyay KK, and Gouda HS. Nitrogen budgeting under the influence of in situ rice residue management options in rice (Oryza sativa)–wheat (Triticum aestivum) cropping system. Indian Journal of Agricultural Sciences. (2023) 93(2):151–6.
43. Bai T, Ran C, Ma Q, Miao Y, Li S, Lan H, et al. The application of straw return with nitrogen fertilizer increases rice yield in saline–sodic soils by regulating rice organ ion concentrations and soil leaching parameters. Agronomy. (2024) 14:2807. doi: 10.3390/agronomy14122807
44. Dhaliwal SS, Sharma V, Shukla AK, Verma V, Kaur M, Singh P, et al. Effect of addition of organic manures on basmati yield, nutrient content and soil fertility status in north-western India. Heliyon. (2023) 9:e14514. doi: 10.1016/j.heliyon.2023.e14514
45. Okonji CJ, Okeleya KA, Aderibigbe SG, Oyekanmi AA, Sakariyawo OS, and Okelana MAO. Effect of cowpea residue in corporation and nitrogen application rates on the productivity of upland rice. World J Agric Sci. (2011) 7:710–7.
46. Li D, He H, Zhou G, He Q, and Yang S. Rice yield and greenhouse gas emissions due to biochar and straw application under optimal reduced N fertilizers in a double season rice cropping system. Agronomy. (2023) 13:1023. doi: 10.3390/agronomy13041023
47. Mi W, Wu L, Brookes PC, Liu Y, Zhang X, and Yang X. Changes in soil organic carbon fractions under integrated management systems in a low-productivity paddy soil given different organic amendments and chemical fertilizers. Soil Tillage Res. (2016) 163:64–70. doi: 10.1016/j.still.2016.05.009
48. Wang J, Hussain S, Sun X, Zhang P, Javed T, Dessoky ES, et al. Effects of nitrogen application rate under straw incorporation on photosynthesis, productivity and nitrogen use efficiency in winter wheat. Front Plant Sci. (2022) 13:862088. doi: 10.3389/fpls.2022.862088
49. Chivenge P, Rubianes F, Van Chin D, Van Thach T, Vu Tien K, Romasanta RR, et al. Rice straw incorporation influences nutrient cycling and soil organic matter. In: Gummert M, Hung N, Chivenge P, and Douthwaite B, editors. Sustainable Rice Straw Management. Springer, Cham (2020). doi: 10.1007/978-3-030-32373-8_8
50. Liu W, Tang J, Zhang D, Jiang X, Lu B, Yang W, et al. Improvement of straw decomposition and rice growth through co-application of straw-decomposing inoculants and ammonium nitrogen fertilizer. BMC Plant Biol. (2023) 23:244. doi: 10.1186/s12870-023-04254-3
51. Meena JR, Behera UK, Chakraborty D, and Sharma AR. Tillage and residue management effect on soil properties, crop performance and energy relations in green gram (Vigna radiata L.) under maize-based cropping systems. Int Soil Water Conserv Res. (2015) 3:261–72. doi: 10.1016/j.iswcr.2015.11.001
52. Yan F, Sun Y, Hui X, Jiang M, Xiang M, Wu Y, et al. The effect of straw mulch on nitrogen, phosphorus and potassium uptake and use in hybrid rice. Paddy Water Environ. (2019) 17:23–33. doi: 10.1007/s10333-018-0680-9
53. Chen J, Gong Y, Wang S, Guan B, Balkovic J, and Kraxner F. To burn or retain crop residues on croplands? An integrated analysis of crop residue management in China. Sci Total Environ. (2019) 662:141–50. doi: 10.1016/j.scitotenv.2019.01.150
54. Lal R. Restoring soil quality to mitigate soil degradation. Sustainability. (2015) 7:5875–95. doi: 10.3390/su7055875
55. Bhattacharya S, Asha Sahu A, Phalke DH, Manna MC, Thakur JK, Asit Mandal A, et al. In situ decomposition of crop residues using lignocellulolytic microbial consortia: a viable alternative to residue burning. Environ Sci Pollu Res. (2021) 28:32416–33. doi: 10.1007/s11356-021-12611-8
56. Kumar A, Kushwaha KK, Singh S, Shivay YS, Meena MC, and Nain L. Effect of paddy straw burning on soil microbial dynamics in sandy loam soil of Indo-Gangetic plains. Environ Technol Innov. (2019) 16:100469. doi: 10.1016/j.eti.2019.100469
57. Cui SY, Zhu XK, Zhang CX, Cao GQ, Chen XH, and Shen YB. Effects of years of rice straw retention on soil carbon and nitrogen sequestration in rice-wheat system. Trans Chin Soc Agric Eng. (2019) 35:115–21. doi: 10.11975/j.issn.1002-6819.2019.07.014
58. Xu JL, Hu NJ, Zhang ZW, and Zhu LQ. Effects of continuous straw returning on soil nutrients and carbon pool in rice-wheat rotation system. Soils. (2016) 48:71–5.
59. Chen SH, Zhu ZL, Liu DH, Shu L, and Wang CQ. Influence of straw mulching with no-till on soil nutrients and carbon pool management index. J Plant Nutr Fertilizer. (2008) 14:806–9. doi: 10.11674/zwyf.2008.0429
60. Sharma S, Singh P, Choudhary OP, and Neemisha. Nitrogen and rice straw incorporation impact nitrogen use efficiency, soil nitrogen pools and enzyme activity in rice-wheat system in north-western India. Field Crops Res. (2021) 266:108131. doi: 10.1016/j.fcr.2021.108131
Keywords: AMMI model, fertilisers, integrated nutrient management, stability analysis, residue recycling
Citation: Rajendran G, Shanmugam V, Lakshminarayanan A, Aabid Hussain L, Joseph B, Kumar V, Pant AK, S A, MBB PB, Rapolu MK and Raman Meenakshi S (2025) Rice crop residue as fertiliser substitute for enhancing yield and soil health: Identifying the optimum level from multilocation trials in India. Front. Soil Sci. 5:1649105. doi: 10.3389/fsoil.2025.1649105
Received: 18 June 2025; Accepted: 26 August 2025;
Published: 23 September 2025.
Edited by:
Ngonidzashe Chirinda, Mohammed VI Polytechnic University, MoroccoReviewed by:
Abhilasha Pathak, Government of Uttar Pradesh, IndiaSaleha Khatun Ripta, EXIM Bank Agricultural University Bangladesh, Bangladesh
Copyright © 2025 Rajendran, Shanmugam, Lakshminarayanan, Aabid Hussain, Joseph, Kumar, Pant, S, MBB, Rapolu and Raman Meenakshi. This is an open-access article distributed under the terms of the Creative Commons Attribution License (CC BY). The use, distribution or reproduction in other forums is permitted, provided the original author(s) and the copyright owner(s) are credited and that the original publication in this journal is cited, in accordance with accepted academic practice. No use, distribution or reproduction is permitted which does not comply with these terms.
*Correspondence: Vijayakumar Shanmugam, dmlqaXRuYXVAZ21haWwuY29t; VmlqYXlha3VtYXIuc0BpY2FyLm9yZy5pbg==; Gobinath Rajendran, Z25hdGhhdHJAZ21haWwuY29t
†These authors have contributed equally to this work and share first authorship