 Antonio R. Sánchez-Rodríguez1,2*
 Alison M. Carswell3
 Rory Shaw1
 John Hunt3Karen Saunders3Joseph Cotton1Dave R. Chadwick1
 Davey L. Jones1
 Tom H. Misselbrook3
- 1School of Environment, Natural Resources & Geography, Bangor University, Bangor, United Kingdom
- 2Departamento de Agronomía, Escuela Técnica Superior de Ingeniería Agronómica y de Montes (ETSIAM), Universidad de Córdoba, Córdoba, Spain
- 3Sustainable Agricultural Systems—North Wyke, Rothamsted Research, Devon, United Kingdom
The anaerobic digestion of food waste converts waste products into “green” energy. Additionally, the secondary product from this process is a nutrient-rich digestate, which could provide a viable alternative to synthetically-produced fertilizers. However, like fertilizers, digestate applied to agricultural land can be susceptible to both ammonia (NH3) and nitrous oxide (N2O) losses, having negative environmental impacts, and reducing the amount of N available for crop uptake. Our main aim was to assess potential methods for mitigating N losses from digestate applied to a winter wheat crop and subsequent impact on yield. Plot experiments were conducted at two UK sites, England (North Wyke-NW) and Wales (Henfaes-HF), to assess NH3 and N2O losses, yield and N offtake following a single band-spread digestate application. Treatments examined were digestate (D), acidified-digestate (AD), digestate with the nitrification inhibitor DMPP (D+NI), AD with DMPP (AD+NI), and a zero-N control (C). Ammonium nitrate (NH4NO3) fertilizer N response plots (from 75 to 300 kg N ha−1) were included to compare yields with the organic N source. Across both sites, cumulative NH3-N losses were 27.6% from D and D+NI plots and 1.5% for AD and AD+NI of the total N applied, a significant reduction of 95% with acidification. Cumulative N2O losses varied between 0.13 and 0.35% of the total N applied and were reduced by 50% with the use of DMPP although the differences were not significant. Grain yields for the digestate treatments were 7.52–9.21 and 7.23–9.23 t DM ha−1 at HF and NW, respectively. Yields were greater from the plots receiving acidified-digestate relative to the non-acidified treatments but the differences were not significant. The yields obtained for the digestate treatments ranged between 84.2% (D+NI) and 103.6% (D) of the yields produced by the same N rate from an inorganic source at HF. Advanced processing of digestate reduced N losses providing an environmentally sound option for N management.
Introduction
During the last few decades, the interest in anaerobic digestion in the European Union (EU) has increased due to the development of regulations and guidelines that encourage the production of renewable energy to benefit the environment (Siebert et al., 2008; EU, 2009; BSI, 2010). Anaerobic digestion plants generate biogas (rich in methane), a source of “green” energy, and a liquid by-product known as digestate, with a high potential as fertilizer or soil conditioner depending on its nutrient content (Nkoa, 2014). The EU has promoted nutrient recovery as part of the circular economy (EU, 2014) encouraging digestate to be valued as an alternative to inorganic and non-renewable fertilizers in agriculture, as a potential source of income rather than a waste or by-product (Alburquerque et al., 2012a,b; Nkoa, 2014; Kataki et al., 2017).
The main feedstocks for biogas plants are energy crops, animal manures, and other organic wastes (Lukehurst et al., 2010) depending on what is locally available. In some countries of the EU, including the UK, anaerobic digestion is the recommended technology for sanitizing food waste from supermarkets, catering, and kitchen waste (Lukehurst et al., 2010), and their treatment through anaerobic digestion is increasing (Styles et al., 2016). Nevertheless, there is a lack of evidence for the agronomic and environmental effects of the application of food waste derived digestate to agricultural land.
Anaerobic digestion modifies the former properties of the feedstocks, affecting N cycling and bioavailability once the digestate is applied to the soil as a source of nutrients for crops. The enhanced microbial degradation of organic matter and emission of carbon (C), particularly as methane, results in an increase in the proportion of total N that is more readily plant available (i.e., in increase in the ratio of ammonium-N (-N) to total N, typically to >70%), a decrease in the C:N ratio and a lower organic matter and dry matter (DM) content (Webb and Hawkes, 1985; Möller et al., 2008; Tampio et al., 2016). Anaerobic digestion can significantly reduce greenhouse gas and odor emissions (if fugitive emissions are minimized) in comparison with the feedstock (Massé et al., 2011; Battini et al., 2014), and produces a more sanitized product when the feedstock is manure (Orzi et al., 2015). However, the increase in pH and -N content through anaerobic digestion enhance the polluting potential of the digestate during storage (Sommer and Husted, 1995) and following land spreading (Möller, 2015). The main concerns regarding application of digestate and other organic wastes to agricultural land are emissions of N to the environment through ammonia (NH3) volatilization, nitrate () leaching and greenhouse gas emissions as nitrous oxide (N2O), with associated impacts on air and water quality, ecosystem functioning and human health (Galloway et al., 2003).
Tiwary et al. (2015) reported that 35–65% of the total N applied in digestate can be lost through NH3 volatilization if the digestate is surface broadcast. Potential methods to reduce NH3 volatilization include the rapid incorporation of manures and digestates into the soil after application (Möller et al., 2008; Tiwary et al., 2015), soil injection (Riva et al., 2016), band-spreading (Nicholson et al., 2017), and acidification of slurries (Fangueiro et al., 2015a).
Nitrous oxide emissions following digestate application to land are thought to be lower than those emitted from the undigested material because most of the available C has been converted to biogas prior to land application. However, there are contradictory reports from the literature (Möller, 2015) suggesting that emissions are related to the feedstocks and soil properties to which they are applied, e.g., soil organic matter content, soil texture, water content, and aeration (Chantigny et al., 2009; Eickenscheidt et al., 2014). Reported N losses as N2O emissions following the application of food-based digestate vary from 0.45% (Nicholson et al., 2017) to 4–10% (Tiwary et al., 2015) of the total N applied. A method to reduce N2O emissions from manure applications, which may be equally applicable to digestates is the use of nitrification inhibitors (NI), such as 3,4-Dimethylpyrazole phosphate (DMPP) (Owusu-Twum et al., 2017), that delay the process in which transforms into . Nitrate is a readily mobile form of N, which can be lost by leaching, therefore, keeping N in the form of (less-mobile) could prevent leaching while minimizing N2O losses (Subbarao et al., 2006; MarkFoged et al., 2011).
The main objective of this study was to compare the efficiency of different N loss mitigation strategies (acidification, use of a nitrification inhibitor, and the combination of both) to reduce N losses (NH3 volatilization and N2O emissions) and enhance the value of food waste based digestate as a source of N for a winter wheat crop. Our hypothesis was that the acidification of the digestate and the use of a nitrification inhibitor (i.e., DMPP) would decrease N losses in relation to untreated digestate, improving the N use efficiency for crop yield and thereby the potential of digestate as an alternative to an inorganic fertilizer N source.
Materials and Methods
Site Description and Experimental Design
Two field experiments were conducted on a winter wheat crop over the 2016-2017 UK growing season. The first site was at the Henfaes Research Station (HF), in Abergwyngregyn, North Wales (53°14′21.3′′N, 4°0′50.3′′W; 10 m above sea level). The second site was at Rothamsted Research North Wyke (NW), in Devon, South West England (50°79′39.8′′N, 3°95′25.1′′E; 180 m above sea level). The former crop was barley at HF and grassland at NW. Both sites have a temperate climate with average annual rainfall of 1,060 and 1,107 mm, respectively. The soil at HF is a free-draining Eutric Cambisol with a sandy clay loam texture and at NW is a free-draining Dystric Cambisol with a clay loam texture (IUSS, 2015). Five representative soil samples were collected from each field site to a depth of 15 cm. Each soil sample was then crumbled by hand, vegetation, roots, and stones manually removed and the soil thoroughly mixed prior to analysis. The main soil characteristics are shown in Table 1.
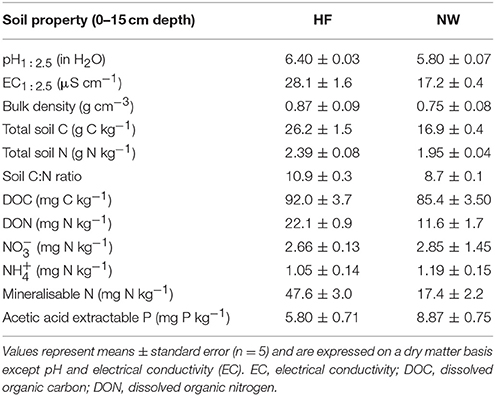
Table 1. Background soil properties at the Henfaes (HF) and North Wyke (NW) sites.
Triticum aestivum (var. KWS Siskin) was drilled on the 10th October 2016 at both sites with a row spacing of 0.1 m. Prior to this, the fields were plowed to 15 cm depth and limed to increase the soil pH. Phosphorus (P, as Ca(H2PO4) and potassium (K, as KCl) were applied during the same week of sowing. Kieserite (MgSO4·H2O) was applied in March at both sites. Application rates were based on routine soil analyses and national fertilizer guidelines (DEFRA, 2010), so that these elements were non-limiting. Herbicides at both sites, and insecticides and fungicides only at NW were also applied according to manufacturers' recommendations. See Table S1 for additional information.
A randomized complete block design was established at each site with one replication in each block equalling five replications per treatment (n = 5), with plot size 14 × 1.2 m at HF and 9 × 2 m at NW. There were four “digestate treatments” and a control:
1. control (C): zero-N, no digestate or fertilizer N applied
2. digestate (D);
3. digestate + the nitrification inhibitor 3,4-dimethylpyrazole phosphate (D+NI): DMPP (2 l ha−1) was added to the digestate and gently stirred before application;
4. acidified digestate (AD): digestate previously acidified in 1 m3 tanks;
5. acidified digestate with nitrification inhibitor (AD+NI): DMPP (2 l ha−1) was added to acidified digestate and gently stirred before application.
The target application rate was 190 kg N ha−1 as digestate, although actual application rate achieved in the field varied (Table 2). The digestate was band-spread parallel with crop rows (30 cm between bands) at a rate equivalent to 40 m3 ha−1 using 20 l capacity watering cans on April 19th 2017 at HF and March 20th 2017 at NW, at the start of stem elongation and never after early May, according to DEFRA (2010). The digestate remained in bands in the “digestate treatments” at NW but not at HF because of the lower DM content. The plots were divided into two different areas: (1) the harvest area, which was used to determine grain yields and plant production; and (2) the sampling area, which was used for periodic soil sampling, NH3 volatilization measurements (wind tunnels) and daily N2O emissions (manual or automatic chambers, Table 2). At HF, NH3 emission measurements were made on the main plots, whereas at NW separate “mini-plots” (2 × 0.5 m) were established for these measurements at the prevailing wind (south westerly) edge of the trial site.
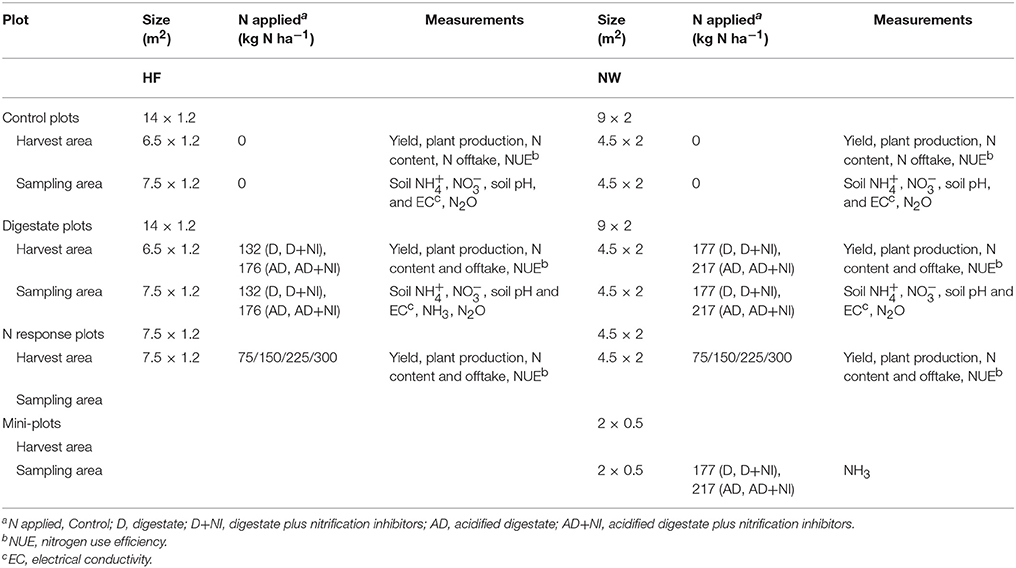
Table 2. Plots dimensions, N application rates, and measurements conducted at the Henfaes (HF) and North Wyke (NW) field experiments.
Additionally, to be able to calculate the fertilizer replacement rate of the N mitigation digestate treatments, N response plots were included at both sites. Ammonium nitrate (NH4NO3) was applied at four different rates: 75, 150, 225, and 300 kg N ha−1 split into three applications between March and April 2017 according to the suggestions by DEFRA (2010) for winter wheat. The N response plots were 6.5 × 1.2 m at HF, where they were included in the randomized block design, and 4.5 × 2 m at NW, where they were established in a separate part of the field. Nitrogen response plots were for yield measurement only with no soil or gaseous emission sampling.
Table 3 gives the main properties of the anaerobic digestate used in the field experiments from six (HF) and 12 (NW) digestate samples. The digestate, based on food waste and without separating solid and liquid fractions, was provided from local anaerobic digestion plants. Half of the digestate used at each site was acidified, to a target pH of 5.5, with concentrated H2SO4 before application. Approximately 1 l of concentrated H2SO4 was added in total per 100 l of digestate. The pH of the digestate at application was determined in a 1:6 (v/v) fresh digestate:distilled water suspension and was lower for the acidified digestate than in the non-acidified digestate at both sites, as expected (Table 3), although the reduction in pH to < 3 for the NW site was greater than anticipated based on previous laboratory tests.
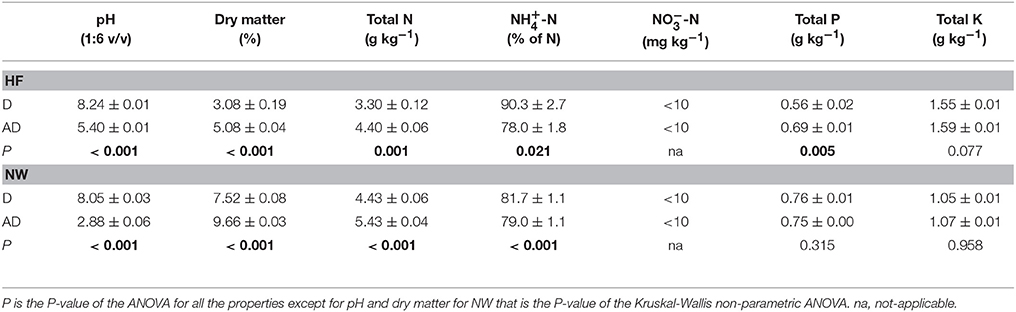
Table 3. Properties of the digestate (D) and acidified digestate (AD) used at Henfaes (HF, n = 3, mean ± standard error) and North Wyke (NW, n = 6; mean ± standard error) expressed on a fresh weight basis.
Soil Sampling
During the experiment, soil was sampled from the sampling area of each plot three times per week for the first 2 weeks after digestate application, two times per week for the next 2 weeks, followed by weekly sampling thereafter. Subsequently, soil samples were taken once per month until the end of the experiment. On each occasion, eight soil samples were taken per plot to 15 cm depth and pooled to provide one representative sample per plot. At NW, soil was sampled proportionally from within and between the digestate bands. At HF, soil was sampled randomly, as there were no distinct digestate bands. Soil samples were stored at 4°C and in the dark prior to analyses. Soil moisture, pH, EC, NH4+, and NO3− were determined as detailed previously.
Analytical Methods
Chemical Properties
Soil pH and electrical conductivity (EC) were determined in a 1:2.5 (w/v) soil:distilled water suspension with standard electrodes using a Model 209 pH meter (Hanna Instruments Ltd., Leighton Buzzard, UK) and a Jenway 4520 conductivity meter (Cole-Palmer Ltd., Stone, UK). Total soil C and N were determined using a TruSpec®; analyser (Leco Corp., St Joseph, MI) and ground oven-dried soil (105°C, 24 h). A soil sub-sample was taken to determine soil moisture and another for mineral N extractions: a 0.5 M K2SO4 solution was used in a 1:5 soil:extractant ratio (w:v) shaking at 150 rev min−1 for 30 min and then centrifuging at 10,000 g for 10 min. The supernatant was stored at −20°C until analyses. Total dissolved organic C (DOC) and total dissolved N (TDN) in the extracts were measured using a Multi N/C 2100/2100 analyser (AnalytikJena AG, Jena, Germany). Dissolved organic N (DON) was calculated by subtracting and from the TDN value. Ammonium in the extract was determined colorimetrically using the salicylate method of Mulvaney (1996) and following the salicylate method of Miranda et al. (2001) in an Epoch® microplate spectrophotometer (Bio Tek Instruments Inc., Winooski, VT). Mineralisable N was determined after anaerobic incubation according to Keeney (1982) using 5 g of soil and calculating the differences in between the initial concentrations and the concentrations after 7 days of anaerobic incubation. Acetic acid extractable P was used as a proxy for plant-available P, determined after extracting the soil with 0.5 M acetic acid (1:5 w/v, 200 rev min−1 for 1 h) by the molybdate blue method (Murphy and Riley, 1962) following centrifugation (10,000 g, 10 min).
Total N, and -N in the digestates were determined as previously described, and -N was significantly higher in the anaerobic digestate for both sites. A digestate sub-sample was oven-dried at 105°C for 24 h and ground to pass 1 mm sieve to determine the dry matter (DM) content. Dry matter content was greater in the digestate than in the acidified digestate, and greater at NW than at HF (mean values, Table 3). A sample of each digestate was digested with concentrated hydrochloric and nitric acid (aqua-regia) to analyse mineral elements by ICP-OES / ICP-MS as detailed in EPA (1996); the acidified digestate had a significantly higher content in Mg at HF and in S at both sites but a lower content in Zn at NW (Table S2).
Ammonia Volatilization
Ammonia volatilization measurements were made using a system of small wind tunnels as described by Misselbrook et al. (2005). One wind tunnel was placed on each of the “digestate plots” of the four first blocks at HF and on each of the mini-plots at NW directly after the application of the “digestate treatments” (n = 4 for each treatment). Ammonia concentrations of the inlet and outlet air of each wind tunnel were determined using 0.02 M H3PO4 acid traps (100 ml) changed every day, except for the first day when higher volatilization rates were expected they were changed twice at HF and three times at NW. After each sampling, the acid trap samples were made up to 100 ml with distilled water in the laboratory and a subsample was frozen before analysis for -N as described previously. Ammonia fluxes (FNH3, μg m−2 s−1) were calculated according to equation 1:
where Co and Ci are the outlet and inlet concentrations, respectively, v is the air volume (m3) drawn through the wind tunnel over the sampling period (t, s), and A the area covered by the wind tunnel (m2).
Cumulative NH3 emissions over the 7 day measurement period were derived by summing the flux from each sampling time. Total N lost through NH3 volatilization was expressed as a percentage of the total N applied for each treatment to normalize for the different N application rates at the two sites.
Nitrous Oxide Emissions
Nitrous oxide emissions were measured with a combination of static manual and automated chambers at HF and only manual chambers at NW. Specifically, three replicate plots with one automated chamber (0.5 × 0.5 × 0.2 m) per plot were used for the “digestate” treatment plots at HF, with one manual static chamber (0.5 × 0.5 × 0.3 m) per plot for three control plots (i.e., n = 3 per treatment at HF). At NW, one manual static chamber (0.5 × 0.5 × 0.3 m) was used on each replicate plot for all treatments (n = 5 per treatment). The automatic chambers at HF were linked to an Isotopic N2O Analyser (Los Gatos Research Inc., San Jose, CA, USA) for measurement of N2O concentration. All chambers were installed at least 1 week before digestate application, with edges pushed at least 5 cm into the soil and packing soil around the external edge of the chamber to ensure a proper seal. Gas tight extensions (0.3 m height) were fitted to the chambers during the growing season to accommodate the height of the growing wheat. Readings from 10 (HF) and 5 (NW) SDI 12 soil moisture sensors (Acclima Inc., USA) at 2.5 cm depth and soil bulk density (Table 1) were used to calculate water filled pore space (WFPS, Figure S1) to explain daily N2O fluxes.
Sampling from the manual chambers was done at the same frequency as the soil sampling described above, between 10:00 and 12:00 h. Lids were placed on the chambers and gas samples were taken at 20, 40, and 60 min, and 10 ambient air samples taken (5 before and 5 after the sampling period) away from the plot areas as a measure of concentration at time 0 min for each chamber. All gas samples were collected and stored in pre-evacuated vials prior to N2O analysis. All gas samples collected from the manual static chambers were analyzed using a Perkin Elmer 580 Gas Chromatograph fitted with an electron-capture detector and an automated sample injection system and calibrated using certified N2O standards. The installation of the automatic chambers at HF was the same but metal chamber bases were inserted in the soil to a depth of at least 5 cm and the chambers attached to these. Chambers were programmed to close sequentially using pneumatic actuators, for 30 min for gas sampling, resulting in four measurements per chamber per day. Gas was sampled from the chambers via a sampling port at a rate of 1 l min−1, and to avoid a negative pressure, the chambers allowed ambient air entry via an air inlet hole of the same diameter as the sampling one, i.e. these were through-flow chambers. Gas samples were delivered to an Isotopic N2O Analyser via 0.17 mm internal diameter PFA tubing, with the same length for all chambers. Nitrous oxide concentrations were recorded at 0.1 Hz during the 30 min chamber closure. N2O concentration data for the first 0.5 min was discarded from calculations to account for the dead volume in the sample lines. Every four chambers, a standard (1.5 ppm N2O) was introduced into the analyser for calibration.
Hourly N2O fluxes (μg N2O-N m−2 h−1) were calculated using linear regression, with the assumption of linearity for manual and automatic chambers. Calculations for the automatic chamber determinations were made using the lm() function in R (version 3.3.2., R Core Team 2016). The manual chamber N2O emissions (FN2O) were calculated as described by de Klein and Harvey (2012); (Excel, Office 2016) using Equation (2):
where H is the ratio of chamber volume to soil surface area (l3 to l−2), C is the concentration of N2O within the chamber at the time (t) of sampling and Ct0 is the N2O concentration measured at 0 min, measured after the chamber had been sealed. Cumulative N2O emissions were calculated for each plot using the area under a curve function “cumtrapz()” from the “pracma” package (Hans Werner Borchers; R Core Team, 2016). Finally, total N lost as N2O was expressed as the percentage of total N applied in each treatment after subtracting the cumulative N2O emissions from the control plots.
Grain, Plant Production, and Nitrogen Use Efficiency
Grain and plant production were determined from the “harvest area” of each plot at the end of the experiment (8 and 15th August 2017 at NW and HF, respectively). At HF, wheat plants from three 0.4 × 0.4 m quadrats were harvested 2 cm above the ground and grain and straw were separated by hand and weighed. At NW, a Sampo small-plot combine harvester was used to harvest the wheat, separating the grain and straw, which were weighed. A sub-sample from each plot was used to determine grain and straw moisture. Total N was analyzed using a TruSpec® analyser (Leco Corp., St Joseph, MI) from ground oven-dried plant tissue (80°C, 24 h); N offtake by the total crop was calculated by multiplying the N content of the grain and the straw by the grain and straw yield, respectively. Thousand-grain weight (TGW) was also determined by weighing 1,000 oven-dried grains. Grain yield, straw yield and TGW are reported at 85% dry matter.
Nitrogen Use Efficiency of the crop (total for grain and straw, NUEc) and grain (NUEg) were calculated according to Equations (3, 4), respectively:
where Nt is the crop N offtake from N (digestate or NH4NO3) treatment plots, Nc is the mean crop N offtake from the control plots and Napplied is the N fertilizer applied to the plots. All units are in kg N ha−1.
where Ngt is the grain N offtake from N (digestate or NH4NO3) treatment plots, Ngc is the mean grain N offtake from the C plots and Napplied is the N fertilizer applied to the plots. All units are kg N ha−1.
Statistical Analyses
A factorial analysis of variance (ANOVA) with two factors (site: HF and NW; and treatment: C, D, D+NI, AD, AD+NI) and a blocking factor was performed for cumulative NH3 and N2O losses (expressed as % of the total N applied), grain and straw yield, N offtake (grain, straw and total), TGW, NUEc, and NUEg. Tukey's post-hoc was used to detect differences between sites and treatments. The t-test was performed to examine variation between the different properties of the digestate and acidified digestate used at both sites, except for pH and DM at NW where a Kruskal-Wallis non-parametric ANOVA was used. One-way ANOVA was used to compare NUEc, NUEg, grain yields, and plant production for the different “digestate treatments” and fertilizer N rates at HF. Cumulative NH3 losses, N offtake by straw, and plant production were log transformed to ensure the requirements for ANOVA. Statistical significance is defined as p < 0.05. In addition, linear (without including the highest dose) and quadratic regressions were derived for yield and total crop production for the fertilizer N response plots (0 to 300 kg N ha−1) to calculate the fertilizer N replacement value of the different digestate treatments. All statistical analyses were performed using SPSS v22.0 (IBM Corp., Armonk, NY).
Results
Soil Analyses
Soil pH, total C, total N, C:N ratio and mineralizable N were higher in HF than NW (Table 1). Changes in soil pH, , and during the experiment are presented in Figure 1 for both sites. Soil pH decreased following addition of the acidified digestate treatments (AD and AD+NI were between 5.2–6.3 at HF and AD+NI between 4.6–5.4 at NW) relative to the non-acidified treatments (C, D, and D+NI; 6.0–6.8 at HF, and C and D between 5.0–6.0 at NW; Figures 1A,B). This effect was observed a few days after digestate application and pH remained lower until harvest at both sites, reaching maximum difference 1 month before harvest (around 1.0 pH unit). The application of the digestate also led to changes in soil EC, with the greatest values for AD and AD+NI, followed by D and D+NI and, finally, by C (Figure S2).
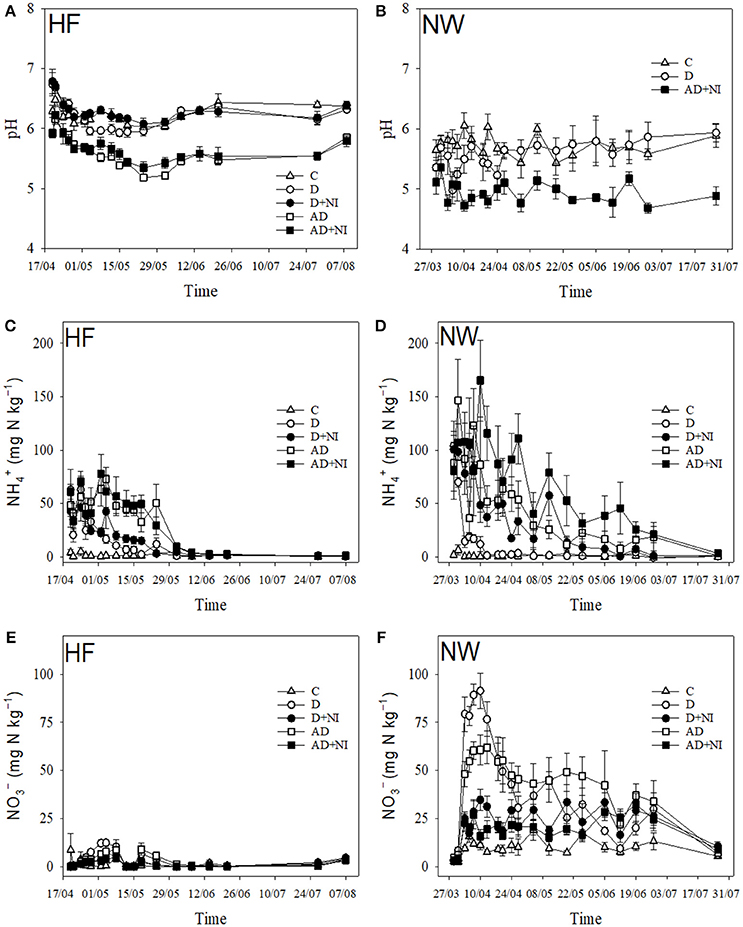
Figure 1. Time course of soil pH, soil and contents (means ± standard error) at Henfaes (HF; A,C,E) and North Wyke (NW; B,D, F) following digestate application. C, control; D, digestate; D+NI, digestate plus nitrification inhibitors; AD, acidified digestate; AD+NI, acidified digestate plus nitrification inhibitors; n = 5 for each treatment.
Peaks in soil -N content were observed in the first month after digestate application (Figures 1C,D). Ammonium contents between 150 and 200 mg N kg−1 were found at NW, which were double that measured at HF (80 mg N kg−1) in this period. Following the initial peaks, a general decrease in soil -N content was observed with time, with a faster rate of decrease at HF. Soil -N contents were greatest for AD+NI and AD. A similar trend occurred for soil -N content (Figures 1E,F), however, the greatest -N concentrations were observed for treatments without the nitrification inhibitor (D and AD), within the first month following digestate application. Peak soil -N contents were ~90 and 60 mg N kg−1 for D and AD respectively at NW, and 13 and 10 mg N kg−1 for D and AD, and C respectively, just 1 day after digestate application at HF. Soil -N contents for D+NI and AD+NI were more constant through the whole experiment and their values were comparable with other treatments in the last 2 months at both sites. Soil -N and -N contents were below 20 mg N kg−1 for the controls at both sites throughout the experiment (Figures 1C–F).
Nitrogen Losses
The percentage of total N applied lost as NH3 and N2O averaged across all “digestate treatments” were significantly higher at HF (17.4 and 0.45% of the total N applied, respectively) than at NW (11.6 and 0.13% of the total N applied, respectively; Table 4). The majority of the NH3 loss occurred during the first and second days following digestate application (Figure 2). Cumulative NH3 volatilization losses were significantly reduced by the acidification of the digestate (P < 0.001), being 1.5% of the total N applied for the mean of AD and AD+NI treatments and 27.6% of the total N applied for the mean of D and D+NI treatments across both sites. Mean N2O loss from digestate treatments with the nitrification inhibitor (D+NI and AD+NI) was 0.17 kg N ha−1 and 0.35 kg N ha−1 for those without the nitrification inhibitor, a >50% reduction although the differences were not significant (P = 0.097, Table 4). The peaks in daily N2O emissions (Figure S3) were related to higher WFPS (Figure S1), especially for the “digestate” treatments at HF. The airline to one of the automatic chambers used to determine N2O fluxes at HF appeared to be blocked (Figure S4, chamber 2 for AD treatment), so its values were replaced by the mean value of the other two chambers from the same treatment for statistical analysis because only three chambers per treatment were used at HF. A similar ranking was obtained for cumulative N2O emissions at both sites (AD > D > AD+NI > D+NI > C, Figure S4).
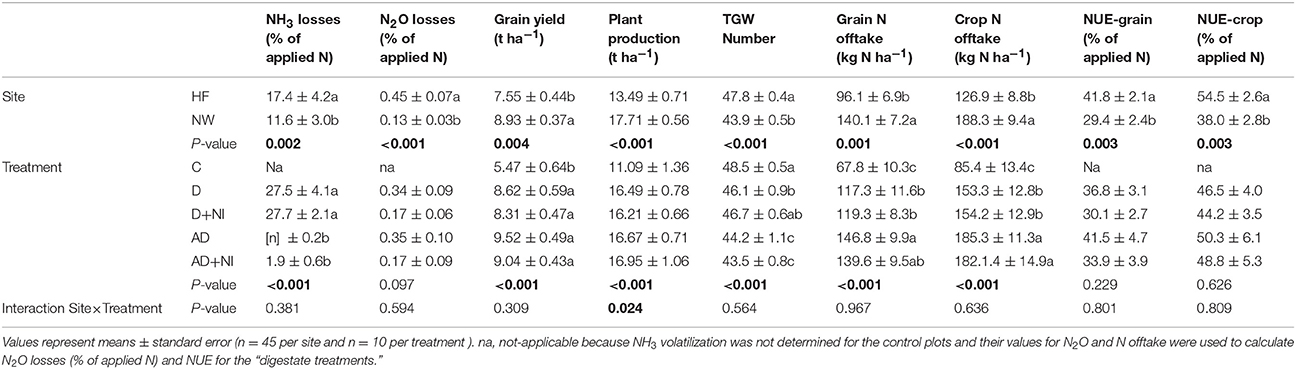
Table 4. Factorial ANOVA for cumulative nitrogen losses (NH3 and N2O, as % of the total N applied for the different treatments and sites), grain and plant production, thousand-grain weight (TGW), N offtake (grain and crop, including grain and straw), and nitrogen use efficiency (NUE) for the winter wheat crop at the Henfaes (HF) and North Wyke (NW) sites for the different treatments (C, control without N application; D, digestate; D+NI, digestate plus nitrification inhibitors; AD, acidified digestate; AD+NI, acidified digestate plus nitrification inhibitors).
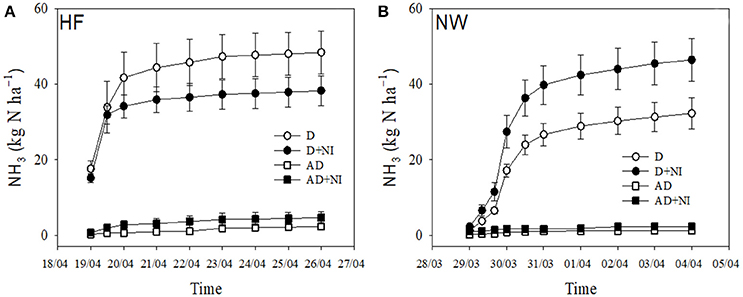
Figure 2. Time course of ammonia volatilization (means ± standard error) during the week after digestate application at Henfaes (HF, A) and North Wyke (NW, B). D, digestate; D+NI, digestate plus nitrification inhibitors; AD, acidified digestate; AD+NI, acidified digestate plus nitrification inhibitors; n = 4 for each treatment.
Yield, Nitrogen Offtake, Nitrogen Use Efficiency (NUE), and Inorganic Nitrogen Replacement
Grain yield and total crop production were influenced by the site in a different way for the control and digestate treatments (Table 4). Higher mean grain yields (P = 0.004) were measured at NW (8.93 ± 0.37 t ha−1) than at HF (7.55 ± 0.44 t ha−1). The same effect was observed for plant production (P < 0.001), 15.36 ± 0.45 t ha−1 at NW and 11.37 ± 0.50 t ha−1 at HF. The application of the different digestate treatments resulted in a significant increase in grain yield (P < 0.001) and total crop production (P < 0.001) in relation to the control treatment (grain yield, 5.47 ± 0.64 t ha−1, and plant production, 11.09 ± 1.36 t ha−1) without N application but no significant differences were observed between the “digestate” treatments (grain yield, between 8.31 ± 0.47 t ha−1 for D+NI and 9.52 ± 0.49 t ha−1 for AD, and plant production, between 16.21 ± 0.66 t ha−1 for D+NI and 16.95 ± 1.06 t ha−1 for AD+NI; Table 4). The interaction site × treatment was not significant for grain yield because an analogous trend for the “digestate” treatments was observed at both sites (Figure 3), however, it was significant for plant production (P = 0.024), because the highest mean values were observed for AD > AD+NI > D > D+NI > C at HF, and for AD+NI > D+NI > D > AD > C at NW (Figure 4). Thousand grain weight was lower (P < 0.001) at NW (43.9 ± 0.5 g) than at HF (47.8 ± 0.4 g) and was reduced (P < 0.001) in the following order in relation to the different “digestate treatments,” C >, D+NI >, D >, AD > AD+NI (Table 4).
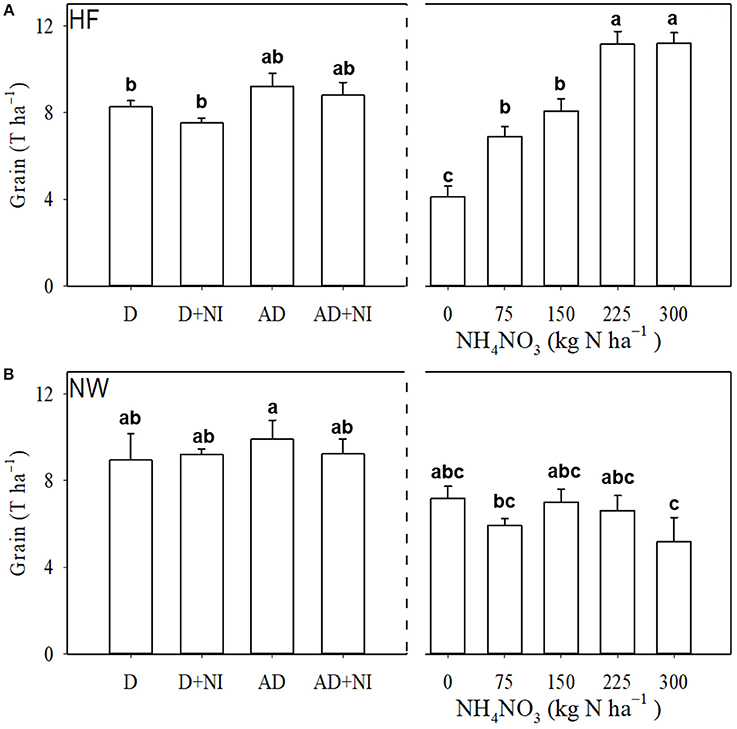
Figure 3. Grain yields (means ± standard error) at Henfaes (HF, A) and North Wyke (NW, B) at the end of the experiment as a function of the treatment. C, control; D, digestate; D+NI, digestate plus nitrification inhibitors; AD, acidified digestate; AD+NI, acidified digestate plus nitrification inhibitors; and several rates of N applied as NH4NO3, including the control treatment (C, 0 kg N ha−1); n = 5 for each treatment. Different letters indicate differences according to Tukey's HSD test at a probability level of 0.05.
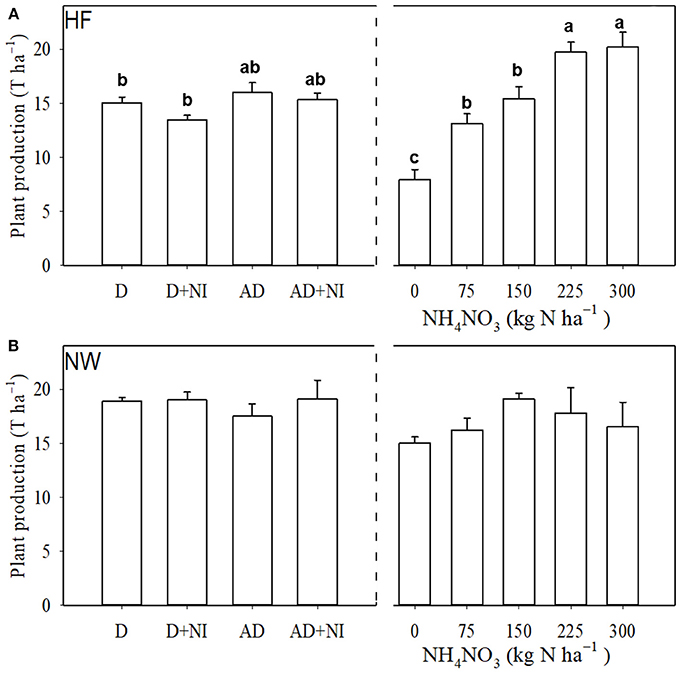
Figure 4. Plant production (straw and grain, means ± standard error) at Henfaes (HF, A) and North Wyke (NW, B) at the end of the experiment as a function of the treatment. D, digestate; D+NI, digestate plus nitrification inhibitors; AD, acidified digestate; AD+NI, acidified digestate plus nitrification inhibitors; and several rates of N applied as NH4NO3, including the control treatment (C, 0 kg N ha−1); n = 5 for each treatment. Different letters indicate differences according to Tukey's HSD test at a probability level of 0.05.
The mean grain N offtake and crop N offtake the means across the ‘digestate' treatments were significantly higher at NW than at HF, but NUEg and NUEc were lower than that at HF (Table 4). Digestate application significantly increased grain N offtake and crop N offtake in comparison to the control, as expected (Table 4). Highest N offtake values were from AD followed by AD+NI for both grain and crop, and NUEg and NUEc were also highest for these treatments although differences were not significant (Table 4). There were no significant site × treatment interactions for N offtake, NUEg or NUEc.
Fertilizer replacement value was significantly greatest for AD and significantly least for D+NI for both grain and total crop yield at HF (Table S3) and followed the same order whether fitting a linear (or quadratic function; P < 0.100 for data calculated with both fittings): AD (168 ± 20 kg N ha−1) > AD+NI (154 ± 18 kg N ha−1) > D (137 ± 9 kg N ha−1) > D+NI (111.1 ± 7.7 kg N ha−1), for the linear approach and grain N fertilizer replacement. The differences between the linear and the quadratic approaches for the calculation of the inorganic N replacement by digestate were 4.5% for grain yield and 8.1% for total crop production. However, when fertilizer replacement was calculated as a function of the total N applied per treatment, the differences were not significant between the “digestate treatments” (Table S3) and ranged between 84.2 ± 5.9% for D+NI treatment and 103.6 ± 6.9% for D treatment. At NW, the fertilizer N response plots were severely affected by lodging and data were subsequently not used.
Discussion
Digestate and Soil Characteristics
The properties of the digestate used in our field experiments were comparable to these reported elsewhere (Möller and Müller, 2012; Nkoa, 2014): high pH (>7.0), low DM content, high proportion of total N as -N, negligible -N content, and similar total N, P and K contents. In general, the application of digestate does not alter soil properties in the short-term but can increase microbial activity and biomass (Melero et al., 2016), N mineralization and NH3 oxidation (Odlare et al., 2008), soil mineral N content (Möller et al., 2008), hydraulic conductivity, and decrease soil bulk density (Garg et al., 2005), in relation to undigested feedstocks.
Unfortunately, the N loading rates for the different treatments in our study were not the same, and not exactly the 190 kg N ha−1 (equivalent) that we targeted. This is something that has been reported in other studies (Pezzolla et al., 2012; Riva et al., 2016). To address this, the N losses were presented as a percentage of the total N applied. The variability of the feedstocks, digestate handling, transport, and storage in the local biogas plants and in tanks in the fields before the application could have caused changes in the digestate N content between the initial sampling time and the time of land application. It is well known that open stores (Wang et al., 2014), and the lack of semi-permeable materials to cover the tanks (Börjesson and Berglund, 2007) and protective gas-tight layers (Battini et al., 2014) can lead to large N losses, predominantly via NH3 volatilization (Petersen and Sørensen, 2008; Fangueiro et al., 2015a), in comparison with the undigested feedstocks. Moreover, the pH of our digestate was 8.24 ± 0.01 at HF and 8.05 ± 0.01 at NW, and according to Muck and Steenhuis (1982), very high losses of NH3 from digestate occurs above pH 8.0, and small losses below pH 6.0. The lower pH of the acidified digestate applied to our fields (5.40 ± 0.01 at HF and 2.88 ± 0.06) and the time between acidification and field application of the digestate (1 week at HF and 2 days at NW) would also contribute in part to explain the higher N content in relation to the non-acidified digestate because the equilibrium / NH3 favors volatilization at higher pH (Möller, 2015). The tanks used for the storage of the digestate in our fields before application had a simple thread lid and were only loosely fixed to prevent pressurization of the tanks, so were not gas-tight, which may have contributed to greater N loss via NH3 volatilization, especially from the non-acidified treatment (Möller, 2015).
The different dry matter (DM) content (%) of the digestate applied at HF (3.08 ± 0.19 for D and 5.08 ± 0.04 for AD) and at NW (7.52 ± 0.08 for D and 9.66 ± 0.03 for AD) explains the variable distribution of the applied digestate at both sites following simulated bandspreading. The higher DM content at NW resulted in discrete bands of digestate, whereas the lower DM content at HF meant that the digestate did not remain within bands resulting in a more homogeneous distribution covering almost the whole surface of the plots that received digestate. The higher surface area of digestate in contact with the air at HF helps to explain the higher N losses at HF (mainly as NH3 but also as N2O despite the lower WFPS at HF, Figure S1 and Table 4), and differences in soil -N and -N contents between NW and HF (Figure 1), especially during the first months after digestate application. In this study, the higher DM content for NW digestate compared with that at HF did not result in higher NH3 emissions as would be expected for slurries (e.g., Misselbrook et al., 2004), suggesting that other factors (such as the increased emitting surface area) were important in controlling NH3 volatilization. The greater post-harvest soil -N content at NW could indicate more risk of leaching than at HF (Figures 1E,F).
Nitrogen Losses: Acidification and Nitrification Inhibitors
Acidification to a pH of < 6.0 reduced NH3 volatilization to < 2.0% of the total N applied (AD and AD+NI plots), a similar reduction to that reported by other authors when non-acidified digestate or slurries were injected into the soil (Fangueiro et al., 2015b; Riva et al., 2016; Baral et al., 2017). These values were significantly lower than when the digestate was not acidified (D and D+NI), resulting in NH3 losses of more than 27% of the total applied N (Table 4). High content and pH of the digestate facilitate N losses via NH3 volatilization (Fangueiro et al., 2015a; Möller, 2015) that can account up to more than a 40% of the total applied N if not managed carefully (e.g., Riva et al., 2016; Nicholson et al., 2017). Our results for the digestate treatments when the digestate was not acidified (D and D+NI) are consistent with these studies. Ammonia is quickly emitted, normally during the first few hours after slurry (Ni et al., 2012) or digestate (Figure 2 of this experiment; Nicholson et al., 2017) are applied. Consequently, measures to reduce its emission should be focused in the first few hours after application (e.g., rapid incorporation) and on production or storage phases of the digestate, to reduce N losses at the different phases. The large, significant decrease in N losses from NH3 volatilization we measured following acidification of digestate (ca. 95% reduction compared with non-acidified digestate) demonstrates the effectiveness of this method to control and reduce these emissions, addressing a key knowledge gap identified by Nicholson et al. (2017). Although more experiments under different weather conditions, physico-chemical soil properties and crops are necessary, our study supports the use of acidification of food based digestate, consistent with this technique being called the Best Available Technology (BAT) for reducing NH3 losses from slurries in some countries (Kai et al., 2008). Rapid soil incorporation has also been shown to reduce NH3 losses by up to a 85% when following application of food waste based digestate (Tiwary et al., 2015) but it could increase N losses in the form of N2O as observed for slurries (Thorman, 2011).
When the pH of the digestate is >6.00 the high soil contents after the application of the digestate stimulate nitrification (Muck and Steenhuis, 1982), and, consequently, N2O emissions. The intensive frequency of N2O sampling and analysis at HF (Figure S3), and the higher mineralizable N measured at HF (Table 1) might explain the greater cumulative N2O losses compared to NW, as some N2O peaks may have been missed because of the lower frequency of sampling at NW. Nitrification could have been responsible for most of the N2O emissions because the WFPS was always < 50% at both sites (between ≈10 and 25% at HF and between 15 and 50% at NW, Figures S1A,B) and the N2O peaks were related to higher WFPS in soil (Figures S1, S3; Zhu et al., 2013).
Nitrous oxide emissions as a result of denitrification are stimulated after the application of organic amendments with a large content of C (Rochette et al., 2000). Therefore, we do not discard that denitrification was, in part, responsible of some N2O emissions observed after digestate application (Figure S3), although the initial -N contents in soil were lower (Figures 1E,F) than in a previous study by Fangueiro et al. (2015b) where high soil -N content (c. 80 mg kg−1) resulted in significant N2O emissions. In addition, hot spots where both nitrification and denitrification processes occur are created in soil after the addition of organic manures, including even when bulk WFPS is below 50%, resulting in N2O emissions (MarkFoged et al., 2011; Zhu et al., 2015). Baral et al. (2017) found that the highest N2O emissions were produced at WFPS between 53 and 56% in a field experiment in which spring barley was fertilized with manure and digestate and that coupled nitrification-denitrification was the source of these emissions.
A decrease in the nitrification process was observed for the treatments in which DMPP was added; i.e. higher -N and lower -N contents were measured at both experimental sites for D+NI and AD+NI treatments during the experiment (Figures 1C–F). The addition of DMPP resulted in a reduction of N2O emission of up to a 50% in comparison to the digestate without the nitrification inhibitor (D and AD), although the differences were not significant (P = 0.097, Table 4). The use of nitrification inhibitors such as DMPP and dicyandiamide (DCD) have been proved to be an effective strategy to reduce N losses from soils where mineral fertilizers (Liu et al., 2013) or slurries (Vallejo et al., 2005; Fangueiro et al., 2016) are applied. The acidification of slurries has also been shown to delay nitrification in some soils (Fangueiro et al., 2013) but not in others, e.g., soils with a high buffering capacity where the soil pH was not altered after the application of the acidified digestate (Fangueiro et al., 2016). Owusu-Twum et al. (2017) recently demonstrated in a short-term experiment under controlled conditions that acidification of slurries could significantly reduce N2O emissions, but to a lesser extent than when DMPP was used. We found some evidence of a delay in the nitrification process for the acidified digestate, where peak soil -N content was observed a few weeks later than for unacidified digestate at HF (Figure 1E), and soil -N contents were higher for AD than for D on the majority of measurement occasions (Figures 1C,D), although this could also be attributed to the initial higher -N contents of the acidified digestate (Table 3). This inhibition of nitrification could have been caused by the decrease in soil pH after spreading the acidified digestate, an effect that was persistent until the end of the experiment, because the population and activity of denitrifying bacteria is affected by soil pH (Gandhapudi et al., 2006). However, acidification did not alter N2O emissions (these were only affected by the addition of DMPP). The presence of a substantial amount of C and inorganic N could have promoted completed denitrification to N2 for AD and AD+NI treatments (where the nitrifying bacteria activity could have been inhibited by acidification) as indicated by Pezzolla et al. (2012) with comparable WFPS values for soils amended with digestate. The percentage of applied N lost via N2O in our experiment ranged between 0.13 and 0.45% (Table 4), in accordance with 0.10–0.41% calculated by Baral et al. (2017) and with 0.45 ± 0.15% reported by Nicholson et al. (2017) under comparable conditions, all lower than the 1% default IPCC emission factor (IPCC, 2006).
Nitrogen Uptake, Nitrogen Use Efficiency, Fertilizer Replacement Rates, and Yields
Although grain and crop N offtakes were improved when the applied digestate was acidified, the differences were not significant for NUEg or NUEc (Table 4). The results for HF indicate that digestate can be an effective replacement for inorganic fertilizers such as NH4NO3 in terms of crop production (Figures 3, 4). These results are in agreement with similar experiments: Walsh et al. (2012) for a grassland, Riva et al. (2016) for a maize silage crop in which they used manure- and crop-based digestates, Furukawa and Hasegawa (2006) for spinach, Haraldsen et al. (2011) for barley, and Pezzolla et al. (2012) for a grassland using food waste based digestate. On the one hand, yields for D and D+NI treatments were similar to those obtained for doses of inorganic N of 136.7 ± 9.1 and 111.1 ± 7.7 kg N ha−1, and the mean values were higher when the digestate was acidified, i.e., AD and AD+NI, which produced similar yields to doses of 168.3 ± 20 and 154.2 ± 17.5 kg N ha−1 at HF. However, no significant differences were found between the different “digestate treatments” (D, D+NI, AD, and AD+NI) when these fertilizer replacement values are based on the total N applied with each “digestate treatment” at HF. The reduction of yields observed in our experiment (only for the mean values, not significantly) when NI were added to the digestate in comparison to the treatments without NI agrees with Misselbrook et al. (2014) but not with the increase in yields reported by Abalos et al. (2014) in their meta analysis. However, in order to achieve effective mitigation of N losses and fertilizer replacement values, digestate should be acidified or rapidly incorporated into the soil following application, as shown in this experiment and by Möller et al. (2008), respectively.
Conclusions
Acidification of digestate and the inclusion of a nitrification inhibitor are good strategies for the utilization of food waste based digestates because they contributed to the mitigation of N losses following application to a winter wheat crop. Without acidification, NH3 volatilization accounted for almost a 30% of the total N applied in digestate. This emission was reduced by 95% with acidification. We demonstrated that wheat yields when acidified digestate was applied at HF (176 kg N ha−1) were similar to these produced by an inorganic N form (NH4NO3) applied at a rate of 154–168 kg N ha−1. Acidification of the digestate seems to be an effective technique after digestate spreading, producing higher mean yields and inorganic N replacements than when the digestate is not acidified. Without the acidification of the digestate, NH3 volatilization accounted for almost a 30% of the total N applied resulting in a serious economic cost and environmental damage. This study encourages the use of digestate from the anaerobic digestion of food waste alongside acidification and with the addition of a nitrification inhibitor, as an environmentally sound option for N management. However, the reduction in soil pH that was measured in the acidified treatments at both sites, suggest that the effect of slurry and digestate acidification on soil quality and function needs to be assessed in the long-term.
Author Contributions
AS-R, AC, RS, DC, DJ, and TM: Conceptualization; AS-R, AC, JH, KS, and JC: Formal analysis; DC, DJ, and TM: Funding acquisition; AS-R, and AC: Investigation; AS-R, AC, RS, JH, KS, and JC: Methodology; DC, DJ, and TM: Supervision; AS-R, Wrote the manuscript; All the authors review and approved the last version of the manuscript.
Conflict of Interest Statement
The authors declare that the research was conducted in the absence of any commercial or financial relationships that could be construed as a potential conflict of interest.
Acknowledgments
This work was supported by the UK-China Virtual Joint Centre for Agricultural Nitrogen (CINAg, BB/N013468/1), which is jointly supported by the Newton Fund, via UK BBSRC and NERC, and the Chinese Ministry of Science and Technology, and also it was undertaken as part of NUCLEUS, a virtual joint centre to deliver enhanced N-use efficiency via an integrated soil–plant systems approach for the United Kingdom and Brazil. NUCLEUS is funded in Brazil by FAPESP—São Paulo Research Foundation [grant number 2015/50305-8]; FAPEG—Goiás Research Foundation [grant number 2015-10267001479]; and FAPEMA—Maranhão Research Foundation [grant number RCUK-02771/16]; and in the United Kingdom by the Biotechnology and Biological Sciences Research Council [grant number BB/N013201/1] under the Newton Fund scheme. We would like to thank Sabine Reinsch (CEH-Bangor), Marina Poyatos, Alvaro Uceda, Juan Espinasa, and Carmen Millan for their help applying the digestate and with different samplings, Llinos Hughes and Mark Hughes for technical support, and Inma Robinson (CEH-Bangor) for particle size distribution analysis. Finally, we would like to thank Fre-Energy Ltd (Wrexham, UK) and Andigestion Ltd (Holsworthy, UK) for providing us with the digestate.
Supplementary Material
The Supplementary Material for this article can be found online at: https://www.frontiersin.org/articles/10.3389/fsufs.2018.00035/full#supplementary-material
References
Abalos, D., Jeffery, S., Sanz-Cobena, A., Guardia, G., and Vallejo, A. (2014). Meta-analysis of the effect of urease and nitrification inhibitors on crop productivity and nitrogen use efficiency. Agric. Ecosyst. Environ. 189, 136–144. doi: 10.1016/j.agee.2014.03.036
Alburquerque, J. A., de la Fuente, C., Campoy, M., Carrasco, L., Nájera, I., Baixauli, C., et al. (2012a). Agricultural uses of digestate for horticultural crop production and improvement of soil properties. Eur. J. Agron. 43, 119–128. doi: 10.1016/j.eja.2012.06.001
Alburquerque, J. A., de la Fuente, C., Ferrer-Costa, A., Carrasco, L., Cegarra, J., Abad, M., et al. (2012b). Assessment of the fertiliser potential of digestates from farm and agroindustrial residues. Biomass Bioenergy 40, 181–189. doi: 10.1016/j.biombioe.2012.02.018
Baral, K. R., Labouriau, R., Olesen, J. E., and Petersen, S. O. (2017). Nitrous oxide emissions and nitrogen use efficiency of manure and digestates applied to spring barley. Agric. Ecosyst. Environ. 239, 188–198. doi: 10.1016/j.agee.2017.01.012
Battini, F., Agostini, A., Boulamanti, A. K., Giuntoli, J., and Amaducci, S. (2014). Mitigating the environmental impacts of milk production via anaerobic digestion of manure: case study of a dairy farm in the Po Valley. Sci. Tot. Environ. 481, 196–208. doi: 10.1016/j.scitotenv.2014.02.038
Börjesson, P., and Berglund, M. (2007). Environmental system analysis of biogas systems. Part II: the environmental impact of replacing various reference systems. Biomass Bioenergy 31, 326–344. doi: 10.1016/j.biombioe.2007.01.004
BSI (2010). PAS 110:2010 Specification for Whole Digestate, Separated Liquor and Separated Fibre Derived From the Anaerobic Digestion of Source-Segregated Biodegradable Materials. British Standards Institution Publications, 60. Available online at: http://www.wrap.org.uk/content/bsi-pas-110-producing-quality-ana (Accessed January 12, 2018).
Chantigny, M. H., MacDonald, J. D., Beaupré, C., Rochetter, P., Angers, D. A., Massé, D., et al. (2009). Ammonia volatilization following surface application of raw and treated liquid swine manure. Nutr. Cycl. Agroecosyst. 85, 275–286. doi: 10.1007/s10705-009-9266-7
Eickenscheidt, T., Freibauer, A., Heinichen, J., Augustin, J., and Drösler, M. (2014). Short-term effects of biogas digestate and cattle slurry application on greenhouse gas emissions affected by N availability from grasslands on drained fen peatlands and associated organic soils. Biogeosciences 11, 6187–6207. doi: 10.5194/bg-11-6187-2014
EPA (1996). “Method 3050B. Acid Digestion of Sediments, Sludges, and Soils. Revision 2,” in Test Methods for Evaluating Solid Wastes: Physical/Chemical Methods, EPASW-846, 3rd Edn, Vol. I, Section A, Chapter 3 (Inorganic Analytes), U.S. Environmental Protection Agency, Office of Solid Waste and Emergency Response: U.S. (Washington, DC: EPA).
EU (2009). Directive 2009/28/EC of the European Parliament and of the Council of 23 April 2009 on the Promotion of the Use of Energy From Renewable Sources and Amending and Subsequently Repealing Directives 2001/77/EC and 2003/30/EC
EU (2014). Communication from the Commission to the European Parliament, the Council, the European Economic and Social Committee and the Committee of the Regions. Towards a circular economy: A zero waste programme for Europe. COM/2014/0398 final/2 */.
Fangueiro, D., Hjorth, M., and Gioelli, F. (2015a). Acidification of animal slurry: a review. J. Environ. Manage. 149, 46–56. doi: 10.1016/j.jenvman.2014.10.001
Fangueiro, D., Pereira, J., Bichana, A., Surgy, S., Cabral, F., and Coutinho, J. (2015b). Effects of cattle-slurry treatment by acidification and separation on nitrogen dynamics and global warming potential after surface application to an acidic soil. J. Environ. Manage. 162, 1–8. doi: 10.1016/j.jenvman.2015.07.032
Fangueiro, D., Surgy, S., Coutinho, J., and Vasconcelos, E. (2013). Impact of cattle slurry acidification on carbon and nitrogen dynamics during storage and after soil incorporation. J. Plant Nutr. Soil Sci. 176, 540–550. doi: 10.1002/jpln.201200117
Fangueiro, D., Surgy, S., Fraga, I., Monteiro, F. G., Cabral, F., and Coutinho, J. (2016). Acidification of animal slurry affects the nitrogen dynamics after soil application. Geoderma 281, 30–38. doi: 10.1016/j.geoderma.2016.06.036
Furukawa, Y., and Hasegawa, H. (2006). Response of spinach and Komatsuna crops to biogas effluent made from source-separated kitchen garbage. J. Environ. Qual. 35, 1939–1947. doi: 10.2134/jeq2005.0482
Galloway, J. N., Aber, J. D., Erisman, J. W., Seitzinger, S. P., Howarth, R. W., Cowling, E. B., et al. (2003). The nitrogen cascade. Bioscience 53, 341–356. doi: 10.1641/0006-3568(2003)053[0341:TNC]2.0.CO;2
Gandhapudi, S. K., Coyne, M. S., Angelo, E. M. D., and Matocha, C. (2006). Potential nitrification in alum-treated soil slurries amended with poultry manure. Bioresour. Technol. 97, 664–670. doi: 10.1016/j.biortech.2005.03.017
Garg, R. N., Pathak, H., Das, D. K., and Tomar, R. K. (2005). Use of fly ash and biogas slurry for improving wheat yield and physical properties of the soil. Environ. Monit. Assess. 107, 1–9. doi: 10.1007/s10661-005-2021-x
Haraldsen, T. K., Andersen, U., Krogstad, T., and Sørheim, R. (2011). Liquid digestate from anaerobic treatment of source-separated household waste as fertilizer to barley. Waste Manage. Res. 29, 1271–1276. doi: 10.1177/0734242X.11411975
IUSS Working Group WRB (2015). World Reference Base for Soil Resources 2014, Update 2015. International soil classification system for naming soils and creating legends for soil maps. World Soil Resources Reports No. 106. FAO, Rome.
Kai, P., Pedersen, P., Jesen, J. E., Hansen, M. N., and Sommer, S. G. (2008). A whole-farm assessment of the efficacy of slurry acidification in reducing ammonia emissions. Eur. J. Agron. 28, 148–154. doi: 10.1016/j.eja.2007.06.004
Kataki, S., Hazarika, S., and Baruah, D. C. (2017). Assessment of by-products of bioenergy systems (anaerobic digestion and gasification) as potential crop nutrient. Waste Manage. 59, 102–117. doi: 10.1016/j.wasman.2016.10.018
Keeney, D. R. (1982). “Nitrogen—Availability indices,” in Methods of Soil Analysis. Part 2, 2nd Edn. Chemical and Microbiological Properties, ed A. L. Page (Madison, WI; SSSA and ASA, Agron. Monogr. 9), 711–733.
Liu, C., Wang, K., and Zheng, N. (2013). Effects of nitrification inhibitors (DCD and DMPP) on nitrous oxide emissions, crop yield and nitrogen uptake in a wheat-maize cropping system. Biogeosciences 10, 711–737. doi: 10.5194/bg-10-2427-2013
Lukehurst, C. T., Frost, P., and Al Seadi, T. (2010). Utilisation of Digestate from Biogas Plants as Biofertilizer. Kent, UK: IEA Bioenergy Task 37.
MarkFoged, R., Nielsen, L. P., Nyord, T., Ottosen, L. D., and Revsbech, N. P. (2011). Transient N2O accumulation and emission caused by O2 depletion in soil after liquid manure injection. Eur. J. Soil Sci. 63, 541–550. doi: 10.1111/j.1365-2389.2010.01345.x
Massé, D. I., Talbot, G., and Gilbert, Y. (2011). On farm biogas production: a method to reduce GHG emissions and develop more sustainable livestock operations. Anim. Feed Sci. Technol. 166–167, 436–445. doi: 10.1016/j.anifeedsci.2011.04.075
Melero, S., Ruiz Porras, J. C., Herencia, J. F., and Madejón, E. (2016). Chemical and biochemical properties in a silty loam soil under conventional and organic management. Soil Tillage Res. 90, 162–170. doi: 10.1016/j.still.2005.08.016
Miranda, K. M., Espey, M. G., and Wink, D. A. (2001). A rapid simple spectrophotometric method for simultaneous detection of nitrate and nitrite. Nitric Oxide Biol. Chem. 5, 62–71. doi: 10.1006/niox.2000.0319
Misselbrook, T. H., Cardenas, L. M., Camp, V., Thorman, R. E., Williams, J. R., Rollett, A. J., et al. (2014). An assessment of nitrification inhibitors to reduce nitrous oxide emissions from UK agriculture. Environ. Res. Lett. 9:115006. doi: 10.1088/1748-9326/9/11/115006
Misselbrook, T. H., Nicholson, F. A., and Chambers, B. J. (2004). Predicting ammonia loss following the application of livestock manure to land. Bioresourc. Technol. 96, 159–168. doi: 10.1016/j.biortech.2004.05.004
Misselbrook, T. H., Nicholson, F. A., Chambers, B. J., and Johnson, R. A. (2005). Measuring ammonia emissions from land applied manure: an intercomparison of commonly used samplers and techniques. Environ. Pollut. 135, 389–397. doi: 10.1016/j.envpol.2004.11.012
Muck, R. E., and Steenhuis, T. S. (1982). Nitrogen losses from manure storages. Agric. Wastes 4, 41–54. doi: 10.1016/0141-4607(82)90053-1
Mulvaney, R. L. (1996). “Nitrogen - inorganic forms”, in Methods of Soil Analysis. Part 3. Chemical Methods, ed D. L. Sparks (Madison, WI: SSSA), 1123–1184.
Murphy, J., and Riley, J. P. (1962). A modified single solution method for the determination of phosphate in natural waters. Anal. Chim. Acta 27, 31–36. doi: 10.1016/S0003-2670(00)88444-5
Möller, K. (2015). Effects of anaerobic digestion on soil carbon and nitrogen turnover, N emissions, and soil biological activity. A review. Agron. Sustain. Dev. 35, 1021–1041. doi: 10.1007/s13593-015-0284-3
Möller, K., and Müller, T. (2012). Effects of anaerobic digestion on digestate nutrient availability and crop growth: a review. Eng. Life Sci. 12, 242–257. doi: 10.1002/elsc.201100085
Möller, K., Stinner, W., Deuker, A., and Leithold, G. (2008). Effects of different manuring systems with and without biogas digestion on nitrogen cycle and crop yield in mixed organic dairy farming systems. Nutr. Cycl. Agroecosys. 82, 209–232. doi: 10.1007/s10705-008-9196-9
Ni, K., Pacholski, A., Gericke, D., and Kage, H. (2012). Analysis of ammonia losses after application of biogas slurries by an empirical model. J. Plant Nutr. Soil Sci. 175, 253–264. doi: 10.1002/jpln.201000358
Nicholson, F., Bhogal, A., Cardenas, L., Chadwick, D., Misselbrook, T., Rollet, A., et al. (2017). Nitrogen losses to the environment following food-based digestate and compost applications to agricultural land. Environ. Pollut. 228, 504–516. doi: 10.1016/j.envpol.2017.05.023
Nkoa, R. (2014). Agricultural benefits and environmental risks of soil fertilization with anaerobic digestates: a review. Agron. Sustain. Dev. 34, 473–492. doi: 10.1007/s13593-013-0196-z
Odlare, M., Mell, M., and Svensson, K. (2008). Changes in soil chemical and microbiological properties during 4 years of application of various organic residues. Waste Manage. 28, 1246–1253. doi: 10.1016/j.wasman.2007.06.005
Orzi, V., Scaglia, B., Lonati, S., Riva, C., Boccasile, G., Alborali, G. L., et al. (2015). The role of biological processes in reducing both odour impact and pathogen content during mesophilic anaerobic digestion. Sci. Tot. Environ. 526, 116–126. doi: 10.1016/j.scitotenv.2015.04.038
Owusu-Twum, M. Y., Loick, N., Cardenas, L. M., Coutinho, J., Trindade, H., and Fangueiro, D. (2017). Nitrogen dynamics in soil amended with slurry treated by acid or DMPP addition. Biol. Fertil. Soils 53, 339–347. doi: 10.1007/s00374-017-1178-0
Petersen, J., and Sørensen, P. (2008). Loss of nitrogen and carbon during storage of the fibrous fraction of separated pig slurry and influence on nitrogen availability. J. Agric. Sci. 146, 403–413. doi: 10.1017/S0021859607007654
Pezzolla, D., Bol, R., Gigliotti, G., Sawamoto, T., López, A. L., Cardenas, L., et al. (2012). Greenhouse (GHG) emissions from soils amended with digestate derived from anaerobic treatment of food waste. Rapid Commun. Mass Spectrom. 26, 2422–2430. doi: 10.1002/rcm.6362
R Core Team (2016). R: A Language and Environment for Statistical Computing. Vienna. Available online at: https://www.R-project.org/, Version 3.2.2.
Riva, C., Orzi, V., Carozzi, M., Acutis, M., Boccasile, G., Lonati, S., et al. (2016). Short-term experiments in using digestate products as substitutes for mineral (N) fertilizer: agronomic performance, odours, and ammonia emission impacts. Sci. Tot. Environ. 547, 206–214. doi: 10.1016/j.scitotenv.2015.12.156
Rochette, P., Angers, D. A., and Coté, D. (2000). Soil carbon and nitrogen dynamics following application of pig slurry for the 19th consecutive year: carbon dioxide fluxes and microbial biomass carbon. Soil Sci. Soc. Am. J. 64, 1389–1395. doi: 10.2136/sssaj2000.6441396x
Siebert, S., Thelen-Jüngling, M., and Kehres, B. (2008). “Development of quality assurance and quality characteristics of composts and digestates in Germany”, in 6th International Conference ORBIT 2008-Moving Organic Waste Recycling Towards Resource Management and Biobased Economy, eds L. Rodic-Wiersma, J. Barth, W. Bidlingmaier, M. de Bertoldi, and L.F. Diaz (Wageningen, Netherlands; ORBIT 2008), 1–12.
Sommer, S. G., and Husted, S. (1995). The chemical buffer system in raw and digested animal slurry. J. Agric. Sci. 124, 45–53. doi: 10.1017/S0021859600071239
Styles, D., Dominguez, E. M., and Chadwick, D. (2016). Environmental balance of the UK biogas sector: an evaluation by consequential life cycle assessment. Sci. Tot.Environ. 560, 241–253. doi: 10.1016/j.scitotenv.2016.03.236
Subbarao, G. V., Ito, O., Sahrawat, K. L., Berry, W. L., Nakahara, K., Ishikawa, T., et al. (2006). Scope and strategies for regulation of nitrification in agricultural systems – challenges and opportunities. Crit. Rev. Plant. Sci. 25, 1–33. doi: 10.1080/07352680600794232
Tampio, E., Salo, T., and Rintala, J. (2016). Agronomic characteristics of five urban waste digestates. J. Environ. Manage. 169, 293–202. doi: 10.1016/j.jenvman.2016.01.001
Thorman, R. E. (2011). “Nitrous oxide emissions following the application of livestock manure – an integrated approach”, in Greenhouse Gases Environmental Assessment, Best Available Technology, eds B. Eurich-Menden, M. Hofmann, E. Grimm, R. Rossler, and R. Vandre (Darmstadt: KTBL), 217–228.
Tiwary, A., Williams, I. D., Pant, D. C., and Kishore, V. V. N. (2015). Assessment and mitigation of the environmental burdens to air from land applied food-based digestate. Environ. Pollut. 203, 262–270.doi: 10.1016/j.envpol.2015.02.001
Vallejo, A., García-Torres, L., Díez, J. A., Arce, A., and López-Fernández, S. (2005). Comparison of N losses (NO3, N2O, NO) from Surface applied, injected or amended (DCD) pig slurry of an irrigated soil in a Mediterranean climate. Plant Soil 272, 313–325. doi: 10.1007/s11104-004-5754-3
Walsh, J. J., Edwards-Jones, G., and Prysor Williams, A. (2012). Replacing inorganic fertilizer with anaerobic digestate may maintain agricultural productivity at less environmental cost. J. Plant Nutr. Soil Sci. 175, 840–845. doi: 10.1002/jpln.201200214
Wang, Y., Dong, H., Zhu, Z., Liu, C., and Xin, H. (2014). Comparison of air emissions from raw liquid pig manure and biogas digester effluent storages. Trans. ASABE 57, 635–645. doi: 10.13031/trans.57.10292
Webb, A. R., and Hawkes, F. R. (1985). Laboratory scale anaerobic digestion of poultry litter: gas yield-loading rate relationship. Agric. Waste 13, 31–49. doi: 10.1016/0141-4607(85)90010-1
Zhu, K., Bruun, S., Larsen, M., Glud, R. N., and Jensen, L. S. (2015). Heterogeneity of O2 dynamic in soil amended with animal manure and implications for greenhouse gas emissions. Soil Biol. Biochem. 84, 96–106. doi: 10.1016/j.soilbio.2015.02.012
Keywords: ammonia volatilization, greenhouse gas emissions, N2O, nitrification inhibitors, acidification, digestate
Citation: Sánchez-Rodríguez AR, Carswell AM, Shaw R, Hunt J, Saunders K, Cotton J, Chadwick DR, Jones DL and Misselbrook TH (2018) Advanced Processing of Food Waste Based Digestate for Mitigating Nitrogen Losses in a Winter Wheat Crop. Front. Sustain. Food Syst. 2:35. doi: 10.3389/fsufs.2018.00035
Received: 14 February 2018; Accepted: 18 June 2018;
Published: 17 July 2018.
Edited by:
Raul Moral, Universidad Miguel Hernández de Elche, SpainReviewed by:
Raul Zornoza, Universidad Politécnica de Cartagena, SpainMargarita Ros, Centro de Edafología y Biología Aplicada del Segura (CEBAS), Spain
Copyright © 2018 Sánchez-Rodríguez, Carswell, Shaw, Hunt, Saunders, Cotton, Chadwick, Jones and Misselbrook. This is an open-access article distributed under the terms of the Creative Commons Attribution License (CC BY). The use, distribution or reproduction in other forums is permitted, provided the original author(s) and the copyright owner(s) are credited and that the original publication in this journal is cited, in accordance with accepted academic practice. No use, distribution or reproduction is permitted which does not comply with these terms.
*Correspondence: Antonio R. Sánchez-Rodríguez, afs42a@bangor.ac.uk; antonio.sanchez@uco.es