 Walaa Ahmed Elsayeh
 Chelsea Cook3
- 1Centre for Behavior and Evolution, Institute of Biosciences, Newcastle University, Newcastle upon Tyne, United Kingdom
- 2Zoology Department, Faculty of Science, South Valley University, Qena, Egypt
- 3Department of Biological Sciences, Marquette University, Milwaukee, WI, United States
- 4Department of Zoology, University of Oxford, Oxford, United Kingdom
Insects require dietary sources of B-vitamins, but relatively little is known about whether they regulate B-vitamin intake in the same way they regulate other nutrients. Honey bees meet their B-vitamin requirements mainly from the pollen they collect. Employing the geometric framework for nutrition, we found that honey bees actively regulate their vitamin intake following Bertrand's rule. We fed bees with a diet of essential amino acids (EAAs) and carbohydrate (C) to identify how the addition of B-vitamins affected the regulation of these macronutrients. In our experiments, honey bees preferred vitamins in concentrations comparable to those found in honey bee food (pollen, beebread, and royal jelly). Honey bees actively regulated niacin around an optimal value. Supplementing honey bee diets with B-vitamins influenced the amount of EAAs and carbohydrate ingested differently depending on the type of the vitamin. The impact of these vitamins was observed over the course of seven days where honey bees' mortality increased on diets of low and medium folic acid concentrations. This study provides insights into honey bee food intake regulation and the feeding preferences and sets the basis for future studies considering B-vitamins in honey bees diets.
Introduction
Animals including insects actively regulate their protein and carbohydrate intake where they consume specific amounts of protein relative to carbohydrate attempting to defend a specific value of nutrients known as the intake target (IT) (Simpson and Raubenheimer, 1993; Paoli et al., 2014). They achieve this by changing their feeding behavior to acquire the correct proportion of nutrients (Simpson et al., 2004; Paoli et al., 2014). How macronutrients are regulated has been studied recently in several herbivorous insects (Behmer et al., 1999; Lee et al., 2002; Behmer, 2009), and in social insects such as ants (Dussutour and Simpson, 2012), bumble bees (Stabler et al., 2015; Vaudo et al., 2016a, 2017; Kraus et al., 2019), and honey bees (Pirk et al., 2010; Paoli et al., 2014).
Vitamins are essential micronutrients that play a critical role in maintaining internal metabolism through their role as enzyme precursors, and are considered essential for proper growth (McDowell, 2008; LeBlanc et al., 2011). Water-soluble vitamins such as B-vitamins need to be replenished daily from a dietary source. Animals obtain their B-vitamins need from dietary sources from plants (McDowell, 2008). Early studies revealed that B-vitamins and protein sources are essential for adequate growth of newly emerged bees (Haydak and Dietz, 1965) where diets deficient in thiamine or riboflavin failed to support the development of the hypopharyngeal glands (HPGs) after emergence (Herbert Jr et al., 1977; Shimanuki, 1978). Similarly, previous research showed that pantothenic acid is critical for the development of the HPGs (Pain, 1956) with its concentration abundant royal jelly (RJ) reaching a concentration of 20 times that of pollen (Haydak and Dietz, 1972). Methyl-donors nutrients such as B-vitamins and essential amino acid methionine prevent hypomethylation in honey bees (Glavinic et al., 2017). Deficiency of niacin, pyridoxine, folic acid, and cobalamin causes either DNA strands to break, oxidative lesions, or all (Ames, 2001). For vitamins concentrations in honey bee collected food (see Table 1).
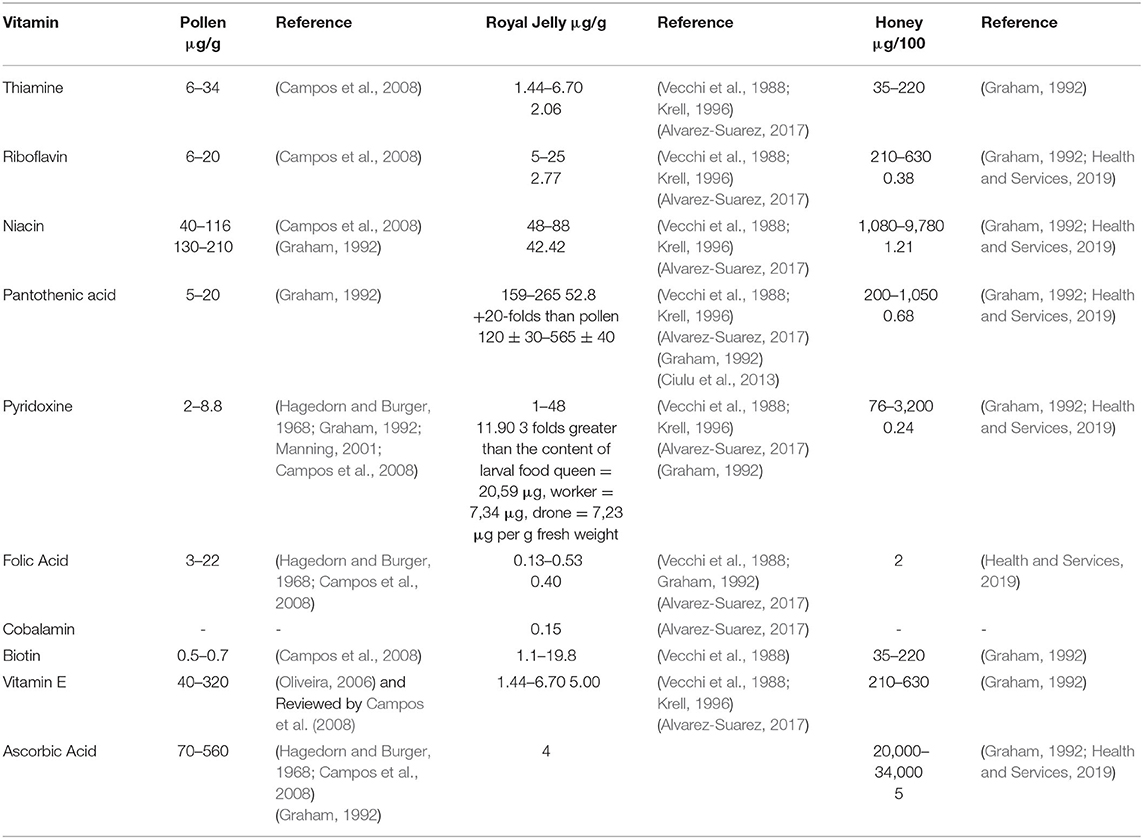
Table 1. Range of vitamins in honey bee food.
Honeybees are eusocial insects that contribute with other insects in pollinating one third of the worlds' crops (Free, 1995; Allsopp et al., 2008). Young, queenless honey bees were observed to prefer a protein-rich diet when essential amino acids (EAAs) were the protein source (Paoli et al., 2014). Young bees maximized their carbohydrate ingestion from 1:50 to 1:75 within 14 days of the experiment, whereas foragers ate even more reaching an intake target (IT) of 1:250 essential amino acids:carbohydrate (EAAs:C). Nevertheless, the high EAAs diets increased honey bees' mortality in both queenless bees and those exposed to queen mandibular pheromones. Similar regulation of macronutrients was observed in bumble bees, where they reached an IT of protein:lipid (P:L) to a ratio between 25:1 and 5:1, and survived better on a ten:1 P:L diet (Vaudo et al., 2017). Another study that confirmed lipid regulation in bumble bees showed that bumble bees preferred lipid taste in proboscis extension reflex (PER) experiments, while they rejected consumption of high lipid diets in feeding assay (Ruedenauer et al., 2020). In this study high lipid consumption was associated with poor survival and reduced reproductive ability (Ruedenauer et al., 2020).
Bertrand's rule states that consumption of a specific micronutrient at low concentration results in increased benefit until reaching an optimum level. Consumption beyond the optimum plateau would result in an adverse impact (such as obesity) at high concentrations (Bertrand, 1912; Mertz, 1981; Raubenheimer et al., 2005; Simpson and Raubenheimer, 2012). To meet the desired benefit while avoiding the negative consequences associated with a high consumption of nutrients, animals must find the right balance by following certain regulatory mechanisms to maximize their benefits. Macronutrients also follow Bertrand's rule (Raubenheimer et al., 2005). However, no one has shown that B-vitamins are actively regulated according to Betrand's rule.
Pollen is the vitamin source for honey bees. Its total vitamin content ranges from 0.02 to 0.7% with only 0.1% fat soluble vitamins such as vitamin A, vitamin D, and vitamin E, and 0.6% water soluble vitamins such as B-vitamins and vitamin C (Komosinska-Vassev et al., 2015). Therefore, pollen is known as the “vitamin bomb” (Farag and El-Rayes, 2016). Pollen is processed into beebread within the colony and fed to adult bees (Brodschneider and Crailsheim, 2010; Nicolson, 2011; Wright et al., 2018). Nurse bees are the main pollen-consumers in the hive, while other bees, such as the queen and the larvae, acquire nutrients from the milky glandular secretions produced by the hypopharyngeal glands (HPGs) in the nurse bees' head (Maurizio, 1954; Haydak, 1970; Crailsheim et al., 1992; Wright et al., 2018). Poor pollen consumption and hence low food stores could be more severe and cause cessation of brood-rearing activity and brood cannibalism (Schmickl et al., 2002; Carroll et al., 2017). In contrast, pollen diluted with cellulose had a low vitamin content which could have intensified the complexity of N. ceranae infection and increased honey bees' mortality.
Previous research on mammals shows that micronutrients such as B-vitamins play a key role in macronutrients food intake regulation, for review see Gonzalez-Soto and Mutch (2021). B-vitamins play a key role in food intake regulation by acting as feeding stimulants (Dabrowski, 1974) and through their role in metabolism and nutrient assimilation. However, to date, the mechanisms of vitamin regulation in honey bees are yet to be uncovered. Using the Geometric Framework (GF) for nutrition, in this study we hypothesized that diet supplementation with some B-vitamins influences macronutrient (EAAs and carbohydrate) regulation in young honey bees. We predicted honey bees can regulate their vitamin intake around a specific value when honey bees were allowed to select from three separate chemically defined diets using a feeding choice assay in vitro. The feeding diets were liquid solutions including a carbohydrate-only source (sucrose), a protein source—10 Essential Amino Acids (EAAs) dissolved in sucrose, and the vitamin-fortified diet dissolved with EAAs in sucrose solution. We also expected that high doses of B-vitamins decrease honey bees survival over the course of 7-day long experiments.
Materials and Methods
Experimental Bees
To collect similarly aged bees, ready to emerge brood frames of Apis mellifera carnica kept at Newcastle University were collected from two different colonies (to have a more representative sample) for unrelated queens and kept in a box under standard controlled conditions inside the incubator at 34°C and 67% relative humidity as described by Paoli et al. (2014). Young honey bee workers were collected from their frames within 72 h of emergence. Queenless worker bees were then collected and assigned randomly into rearing boxes where 25 bees were allocated per box. The rearing boxes were made of Perspex with the dimensions 11 × 6 × 20 cm. Feeding solutions were provided at fixed positions (see Figure 1) and assigned to three different feeding tubes with a fourth tube filled with water. Each feeding tube was a 2 ml microcentrifuge tube with three 2 mm holes drilled along the top of each tube away from the cap. The rearing boxes were then placed inside the incubator at 34 C° and 67% relative humidity. The experiment was conducted for 7 days, with the number of dead bees being counted and removed daily and this experiment was repeated twice per treatment. All experiments took place during between June and September 2016.
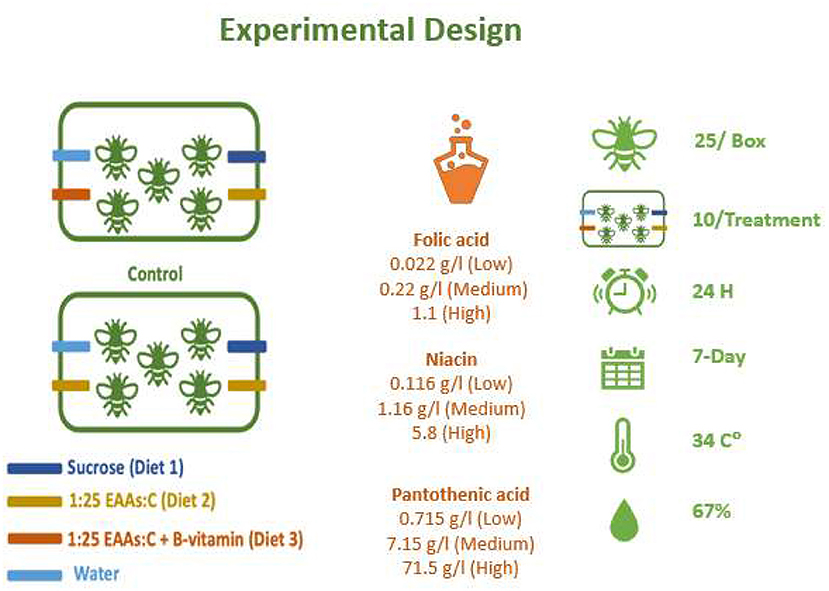
Figure 1. Experimental setup for treatment and control units used in the experiments. Different cohorts were used to test a single B-vitamin in a mixture of 1:25 EAAs:C. Vitamins tested included folic acid, niacin, and pantothenic acid. For each B-vitamin three different level (low is 1x, medium is 10x and high is 50x in case of folic acid and niacin or 100x in case of pantothenic acid) were used to prepare liquid feeding diets. Diets were added to drilled feeding tubes. Feeding diets were weighed after 24 h and replaced with fresh diets. Number of dead bees were counted and removed from the rearing boxes daily. The experiments continued for 7 days and repated for a second round. Similar rearing units without bees were used to control the evaporation inside the incubator at at 34°C and 67% RH.
Feeding Diets
To feed the bees, we used a chemically defined diets, B-vitamins, including folic acid (F8758), niacin (N0761), D-Pantothenic acid hemicalcium salt (P5155), added to a base diet composed of sucrose as a source for carbohydrate (Sigma-Aldrich, UK) and the 10 free essential amino acids EAAs (Sigma-Aldrich). These free essential amino acids were arginine, histidine, isoleucine, leucine, lysine, methionine, phenylalanine, threonine, tryptophan, and valine. The base diet contained 1:25 essential amino acids: sucrose (EAAs:C,) as illustrated by Paoli et al. (2014). Four different levels of each vitamin were dissolved in 1:25 of EAAs: C solution as the base diet. For vitamins concentrations see Figure 1. For vitamin-supplemented treatments, a concentrated stock solution (50X was prepared for folic acid or niacin, while 100x was prepared for pantothenic acid) was prepared, then diets were prepared by serial dilution from this stock liquid diet. Diets were kept frozen under−20C° for no more than 7 days. All feeding diets were slow thawed in a refrigerator overnight before feeding. Vitamin concentrations were selected based on the range of concentrations in bee food in general to test nurse bees tolerance to high levels (see Table 1 for range of vitamin concentrations in honey bee food and references). For reagents and their concentrations used to prepare each diet (see Supplementary Table 1).
Design of the Experiment
Young honey bees were allowed to freely eat from different feeding tubes (Paoli et al., 2014; Stabler et al., 2015, 2020; Vaudo et al., 2016b) containing sucrose (tube 1, Diet 1), EAAs plus sucrose (tube 2, Diet 2), EAAs plus sucrose with a specific concentration of a B-vitamin (tube 3, Diet 3), or distilled water (tube 4). The carbohydrate-only solution was also 1 M sucrose, while the EAA:C diet was 1:25 EAA:C (M/M), where the carbohydrate solution was 1 M sucrose. Ten rearing boxes were “replicates” used per treatment. Evaporation adjustment was made by setting up two boxes for each treatment without bees. This evaporation control was included per treatment every time the experiment was run in the incubator (n = 12 per treatment total). See Figure 1 for the experimental setup.
The amount of food eaten was quantified daily by recording the weight of each feeding tube before and after 24 h intervals. Each feeding tube was replenished by replacing it with a sterilized full tube daily. The evaporation loss for each treatment was measured and the average amount of solution evaporated was calculated across the 7-day experimenting period. The average evaporation value for each solution was then subtracted from the daily food consumption for each treatment to quantify the net amount of food consumed per day. Daily food consumption per bee was calculated from the sum of net diet consumption for each feeding tubes divided by the number of bees remaining alive on that day. The amount of each macro- and micronutrient eaten was calculated from the adjusted daily volume using the known concentration of each reagent in the solution. These experiments were repeated for a second round using new newly emerged bees that was included as a covariate in all the analysis unless was not significant in the model.
Statistical Analysis
Data analysis and visualization was completed using R for Macintosh, version 3.6.3, 2020, using the packages ggplot2, pysch, mass, and survival (Team, 2020). After testing for normality, average daily volume consumed (ml/bee) per liquid feeding diet was analyzed as a response univariate using two-way ANCOVA where vitamin concentration and diet were included as independent variables and round was included as a covariate. Following ANCOVA, Tukey's HSD post-hoc was used to determine which treatment group and which feeding diet were significantly different from the control and each other group. Since total carbohydrate and EAAs intake were normally distributed, they were analyzed using two-way MANCOVA where we had two independent variables; vitamin type and concentration, while the amount ingested of carbohydrate and EAAs in mg/bee was tested as a response variable. The total amount eaten of each vitamin did not follow a normal distribution, therefore it was analyzed and included as a response variable in generalized linear model with vitamin concentration set as factors, while round was included as a covariate to control for the effect of round. Repeated measures MANCOVA was employed for the average amount eaten of carbohydrate and EAAs as time and vitamin concentration were used as factors. Tukey's HSD post-hoc was used to determine which treatment group was significantly different from the control and each other group. Finally, the survival curve was fitted using Cox regression and hazard ratio was quantified per concentration. The control group was used as reference group to which all other groups were compared. In all statistical tests we used a significance level P < 0.05 to denote statistically significant results.
Results
Total Food Consumption
Generally, honey bees response to each vitamin concentration was vitamin-specific (Figure 2 and Table 2). For example, honey bees fed with folic acid did not alter their food consumption at any concentration (Figure 2A). Bees fed with niacin consumed the greatest volume of vitamin solution from the middle concentration 1.160 g/l (Figure 2B) whereas bees fed with pantothenic acid consumed less vitamin solution as the vitamin concentration increased (Figure 2C and Table 2).
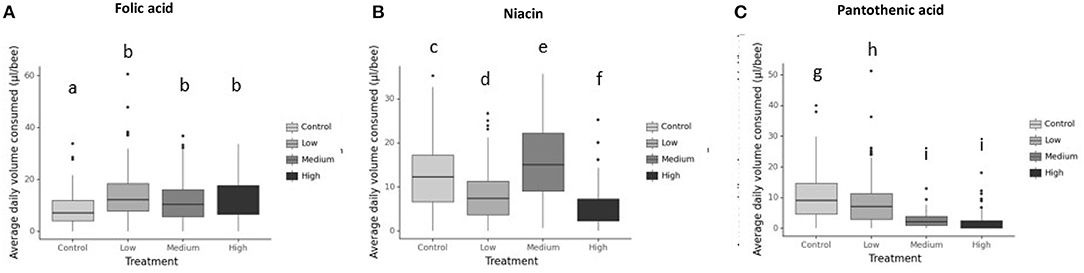
Figure 2. Average daily volume consumed (μl/bee) for 7d from the vitamin-laced feeding diet (Diet 3). Diets are 1M sucrose solution as diet 1, 1:25 EAAs:C as diet 2, and diet 3 was 1:25 EAAs:C + testing B-vitamin in varying concentrations. The control group received only 1M sucrose in tube 1 and 1M sucrose + EAAs in tube 2 and tube 3. So, they were vitamin deficient. Whereas, in the treatments a different concentration of B-vitamin was added to tube 3 in the treatment groups only (not the control) to the P:C diet (1M sucrose+EAAs+B-vitamin. A 4th tube of water was added to all groups. (A) Folic acid, (B) Niacin, and (C) Pantothenic acid. Bars with different letters indicate significant differences from their respective control using Tukey's post-hoc comparison at P < 0.05. Differences among honeybees receiving folic acid depended on its level in the diet with consumption of low folic acid (Tukey's post-hoc, P < 0.001, 95% CI = −8,−2.8), medium folic acid group (Tukey's post-hoc, P = 0.006, 95% CI=-5.9,−0.7) and High folic acid treatment (Tukey's post-hoc, P < 0.001, 95% CI = −6.7, −1.5) significantly different from that of control treatment. Similarly, bees supplemented with niacin in all treatment groups altered their intake from that of the control, for example low niacin treatment (Tukey's post-hoc, P < 0.001, 95% CI = 2.6, 6.7), medium niacin treatment (Tukey's post-hoc, P = 0.001, 95% CI = −5.1,−1), high niacin bees (Tukey's post-hoc, P < 0.001, 95% CI = 5.7, 10) Bees receiving pantothenic acid significantly altered the amounts they ate from each diet according to vitamin's concentration with consumption low pantothenic acid group (Tukey's post-hoc, P = 0.013, 95% CI = 0.34, 4), medium pantothenic acid treatment (Tukey's post-hoc, P < 0.001, 95% CI = 6.2, 10) and high pantothenic acid treatment (Tukey's post-hoc, P <0.001, 95% CI= 7.2, 10.9) different from consumption of the control treatment. N = 250/treatment.
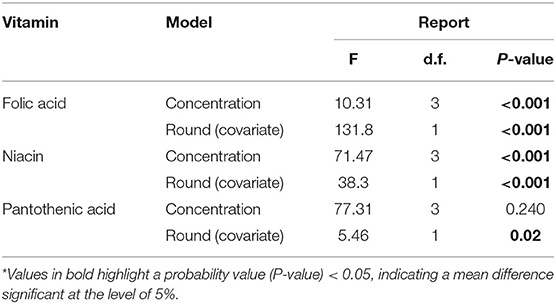
Table 2. Two-way- ANCOVA for Average daily volume consumed (μl/bee) for the vitamin-laced diet.
Regulation of Macronutrients Intake
Macronutrient intake was investigated by calculating the total amount ingested per individual nutrient per bee over a 7-day experimental period. The type of B-vitamin added to the diets significantly affected the total amount of carbohydrate consumed (Figure 3A and Table 3, MANCOVA, vitamin, carbohydrate, F2,241 = 5.48, P = 0.005). Whereas, EAAs consumption was both vitamin and concentration specific (Figure 3B and Table 3, MANCOVA, vitamin * concentration, F6,241 = 3.275, P = 0.004). Honey bees ingested more carbohydrate and less EAAs when vitamins—except folic acid— were present in one of the diets than the control bees (Figure 4 and Table 3).
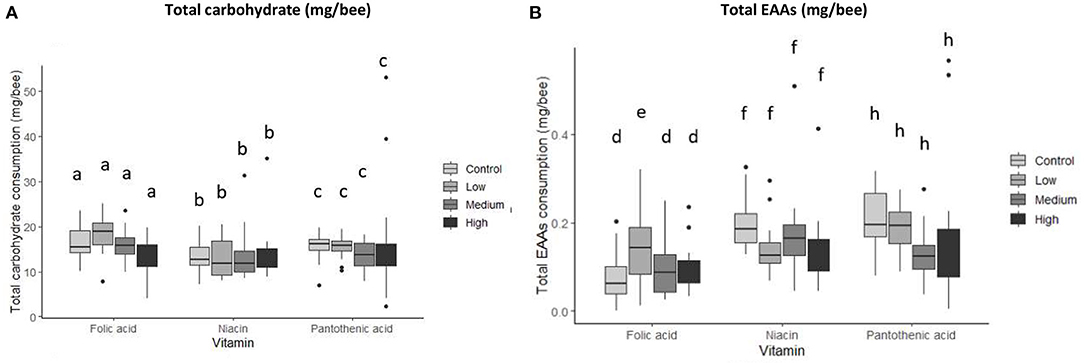
Figure 3. Total macronutrient consumption per vitamin by concentration. (A) Carbohydrate, (B) EAAs. Groups are represented by treatments; Control (no vitamin group), Low (low level of vitamin), Medium (medium concentration of vitamin), High (high level of vitamin). N = 250 bees/treatment, (MANCOVA at P < 0.05). Data presented as means ± SEM. Bars with different letters indicate significant differences from their respective control using Tukey's post-hoc comparison at P < 0.05. EAAs consumption for the low folic acid treatment was significantly higher than that of the control (Tukey's post-hoc, P = 0.001, 95% CI = −0.542,−0.104).

Table 3. MANCOVA for the total food intake (mg/bee).
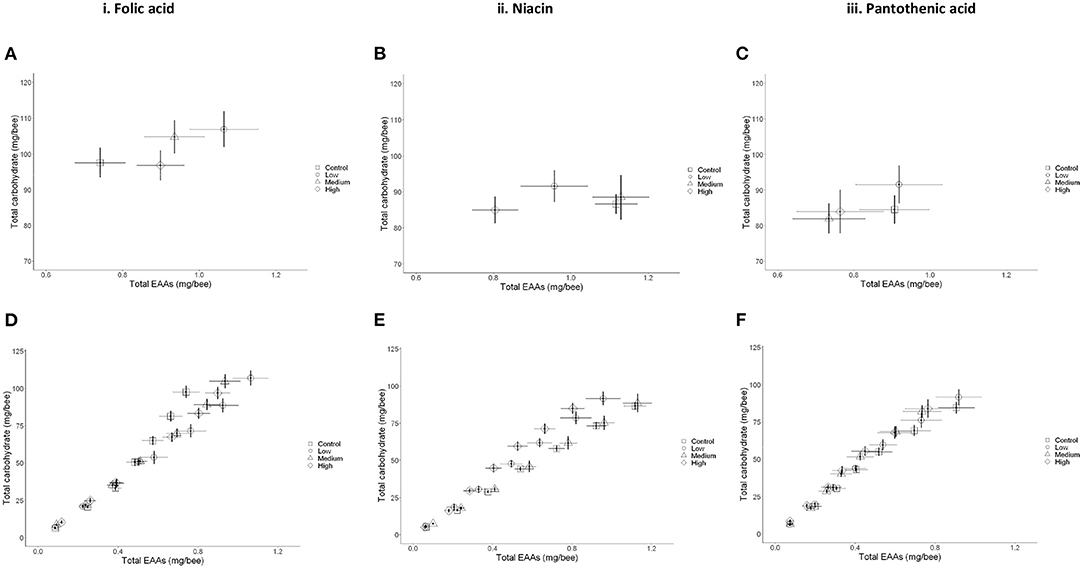
Figure 4. Macronutrient regulation in the presence of B-vitamins is concentration specific. (A,C,E) Mean ± SEM cumulative consumption of nutrients for young bees over 7 days. (A) Folic acid, (C) Niacin in vitamin, and (E) Pantothenic acid. (B,D,F) Nutritional trajectories for the cumulative daily consumption per bee of newly emerged workers. (B) Folic acid, (D) Niacin, and (F) Pantothenic acid. N = 250 bees/treatment (two-way MANCOVA, P < 0.05). Data presented as Means ± SEM.
Specifically, honey bees receiving a low level of folic acid (0.022 g/l) ate more EAAs than the bees in the medium and high vitamin concentration groups (Figures 3B, 4A,B and Table). This resulted in the bees regulating their intake of EAAs:C to the ratios 1:100, 1:112, and 1:108 in the low, medium, and high folic acid groups, respectively. In contrast, the control bees achieved a ratio of 1:132 EAAs:C. The bees in this medium niacin group ingested proportionally more EAAs than bees in the low or high niacin groups (1:78 EAAs:C). When niacin was provided at high concentration honey bees ate less EAAs resulting in increasing the ratio of EAAs:C to 1:106 (Figures 4C,D and Table 4). Similarly, honey bees in the medium (7.14 g/l) and high (71.4 g/l) level of pantothenic acid ate more carbohydrate than the control bees (1:93, 1:1000, 1:111 and 1:110 for the control, low, medium, and high pantothenic acid groups, respectively, Figures 4E,F and Table 4).
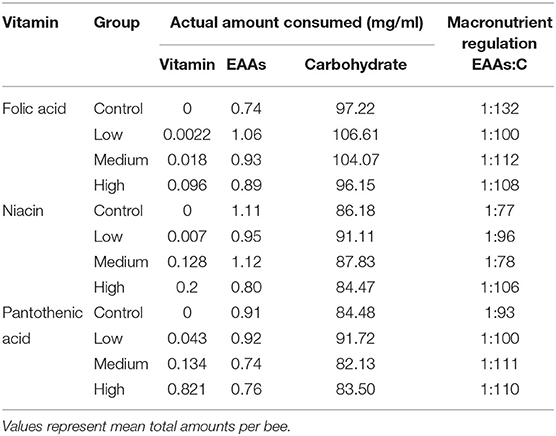
Table 4. Total nutrient consumption and macronutrients intake ratios over 7 days.
To test bees' ability to regulate their vitamin intake around a specific value, we compared the amount ingested per vitamin for each concentration. For honey bees in the folic acid experiment, they ate more of the vitamin when fed with the high concentration treatment than other treatments (Tables 4, 5, GzLM, concentration, 9.2, P < 0.001). Honey bees did not significantly alter the amount of niacin they consumed at any concentration (Tables 4, 5, GzLM, concentration 0.1.15, P < 0.001). Honey bees in the high pantothenic acid treatment ate 19 times and 6 times more pantothenic acid that bees in the low and the medium groups, respectively (Tables 4, 5, GzLM, concentration 3.31, P = 0.002).
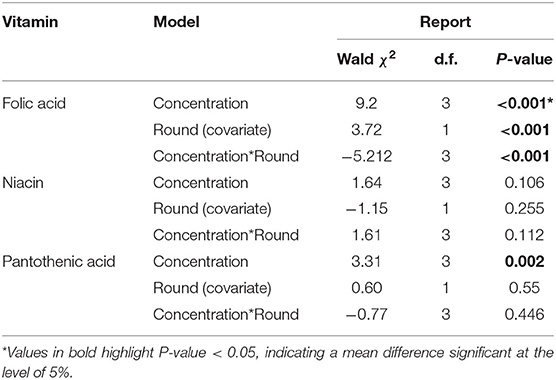
Table 5. Generalized linear model (GzLM) for amount of b-vitamins eaten per day (mg/bee).
Changes in Macronutrients Over Time
The average daily intake per nutrient in mg/bee was also calculated over seven days to find out the feeding trend of honey bees. Overall, honey bees actively changed their intake over the course of the experiment for all of the three vitamins (Supplementary Materials, Figure 1 and Table 2). More importantly, they shift their feeding behavior to maximize their carbohydrate intake while decreasing their EAAs consumption at the end of the experiment.
With folic acid supplementation, food consumption changed over time depending on time and vitamin concentration (Supplementary Figures 1A,B and Table 2, Repeated Measures Analysis, within-subject effect, day * concentration, carbohydrate, F3, 36 = 12.4, P < 0.001, EAAs, F3,36 = 6.54, P = 0.001). However, the consumption of EAAs was higher in the first few days for the lowest concentration of folic acid than any other treatment. Consumption then started to increase again, reaching a peak for all folic acid treatments (low, medium, and high) compared to the control bees. Interestingly, the consumption of EAAs started to decrease near the end of the experiment (on day 6 and 7) for all treatments, however it was still higher for bees in the low folic acid group than other treatments.
Bees fed with niacin increased their consumption of carbohydrate over time (Supplementary Figure 1C). For EAAs, bees receiving the high concentration of niacin ate less than the control bees and other treatments, while bees in the medium niacin treatment group consumed more than those in the control group (Supplementary Figures 1C,D and Table 2, Repeated Measures Analysis, within-subject effect, day, carbohydrate, F1,36=203.1, P < 0.001, EAAs, F1,36= 66, P < 0.001).
For pantothenic acid, bees did not alter their carbohydrate ingestion over the course of the experiment (Supplementary Figure 1E and Table 2, Repeated Measures Analysis, within-subject effect, day * concentration, carbohydrate, F3,36= 0.436, P = 0.728).The consumption of EAAs slightly increased over time which then started to significantly increase by the end of the experiment; on day 6 for all treatments but it decreased on day 7 for the medium pantothenic acid bees (Supplementary Figure 1F and Table 2, Repeated Measures Analysis, within-subject effect, day * concentration, EAAs, F3,36= 18, P < 0.001).
Impact on Honey Bees' Survival
The number of dead bees was counted daily to measure the impact of individual concentrations per vitamin on young honey bees' survival. Honey bee mortality increased on the low and medium folic acid treatment groups and low niacin concentration treatment. Similarly, the control treatment and the high pantothenic acid concentration increased honey bees mortality near the end of the study compared to low and medium pantothenic acid treatments (Figure 5 and Table 6, Cox-regression).
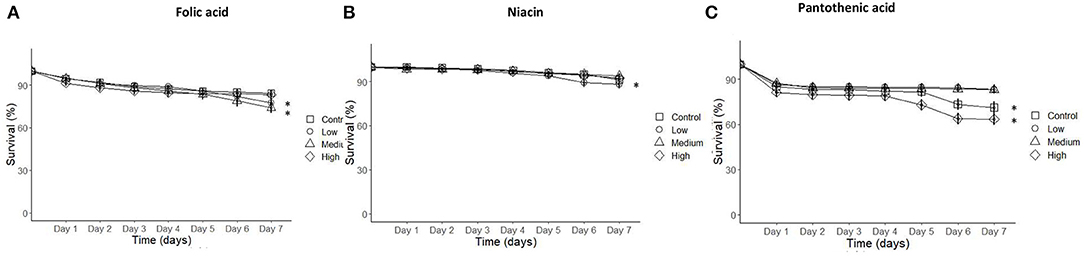
Figure 5. Cumulative survival of honeybees incubated in the rearing boxes at optimum conditions over the course of 7-days experimental interval was reduced on low, medium folic acid, low niacin, and high pantothenic acid treatments. (A) Folic acid, (B) Niacin, and (C) Pantothenic acid. N = 250 bees/treatment (Cox Regression, P < 0.05). Data presented as Means ± SEM. Asterisks indicate significance at P < 0.05.
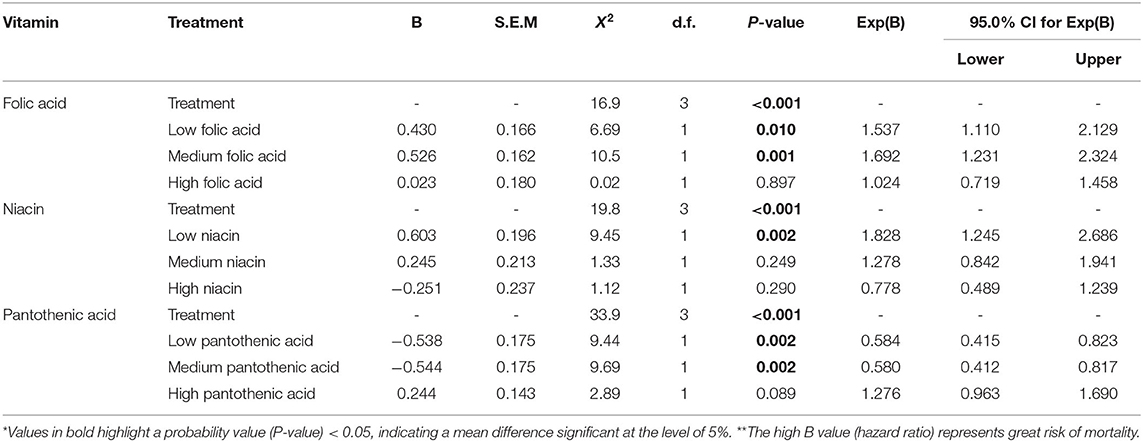
Table 6. Cox regression model of survival for honeybees over 7 days.
Discussion
This study was designed to investigate how the quantity of carbohydrates and EAAs were regulated when B-vitamins were present in food. Additionally, we tested whether the B-vitamins themselves were regulated. We demonstrate that honey bees actively regulate their intake of all EAAs in the presence of B-vitamins. Honey bees response was vitamin and concentration specific. For example, at low or intermediate values of the folic acid, the bees increased their intake of EAAs. Whereas, honey bees ingested relatively more carbohydrate when fed with niacin or pantothenic acid. At high concentrations of the B-vitamins (except for honey bees supplemented folic acid), they appeared to eat less food overall. The amount of B-vitamins consumed by the bees increased as a function of concentration in the diet. To measure the impact of the B-vitamins and their concentrations on honey bee survival, we also counted daily survival rates. High pantothenic acid concentrations reduced the rate of survival, whereas fewer bees survived on diets with less niacin or folic acid over the 7 day period of the experiment.
When honey bees were in the control group were vitamin deficient, they seem to have a low appetite and thus they ate less food than the honey bees in bees fortified with low B-vitamins except for honey bees fortified with folic acid. These results are consistent with those published for humans receiving folic acid (Hatamizadeh et al., 2007; Namdari et al., 2014; Bruso, 2019) or niacin (Bruso, 2019) as lack of B-vitamins causes loss of appetite (Hegyi et al., 2004) while B-vitamin supplementation corrects this by inducing feeding and enhancing normal metabolism via supporting metabolic enzymes production, for review see (Tardy et al., 2020). Typically, honey bees preferred vitamins at the same concentration present in their natural diet such as pollen (22–1,100 μg/g for folic acid and 1,160 μg/g for niacin) and royal jelly (120 ± 30–565 ± 40 μg/g for pantothenic acid) (Graham, 1992; Ciulu et al., 2013). Feeding honey bees on diets fortified with folic acid- resulted in increasing EAAs consumption relative to carbohydrate in treatment groups in comparison with the control bees. Honey bees given low or high niacin, low, medium or high pantothenic acid levels ate more carbohydrate relative to EAAs in comparison with the control bees. In the current study honey bees preferred to consume high levels of folic acid, however, this was variable across the two rounds of the experiment due to seasonal effect.
Honey bees in these experiments ate more carbohydrate in all treatments than honey bees in Paoli's study which regulated bees' intake to 1:50 EAAs:C (Paoli et al., 2014). Additionally, honey bees in this study decreased their EAAs intake at the end of the experiment this is because as the bees mature, they behave like older bees, requiring more carbohydrate and less EEAs similar to what was observed in Paoli's study. Honey bees in these experiments did not produce royal jelly or wax as they were queenless, broodless, and kept at the standard controlled conditions inside the incubator. Therefore, their food intake reflects the intake target for their own growth and proper somatic maintenance and functions. Young queenless honey bees become foragers early in their life cycle (after day 8) (Pankiw et al., 1998) and lose their ability to metabolize protein (Moritz and Crailsheim, 1987; Paoli et al., 2014). Therefore, the high intake of EAAs in this study is expected to significantly increase in natural hive conditions, or upon the presence of queen mandibular pheromone as documented by Paoli et al. (2014) or with the presence of young brood.
The honey bees in these experiments were broodless, therefore the findings may not extrapolate to honey bees rearing brood, as their demand for protein and possibly vitamins is likely to increase when they are producing glandular secretions (Paoli et al., 2014). Additionally, we expect that carbohydrate consumption would increase when the honey bees get older as they reach the natural foraging age (Joos et al., 1997; Paoli et al., 2014) to fuel their foraging flights. We observed this on the last day of the experiment—day 7— as bees tend to consume relatively more carbohydrate which could indicate a shift in the behavioral task of bees into foraging. As nurse honey bees are deprived from their social context (queenless and broodless), they become foragers at a younger age (Paoli et al., 2014) at 4 days old when older foragers are absent (Withers et al., 1993).
Folic acid plays a role in DNA methylation, growth, and development in Drosophila melanogaster (Burnet and Sang, 1963; Blatch et al., 2015), which is similar to its role in mammals as a single-carbon unit carrier (Blatch et al., 2015). In Drosophila melanogaster, it was noticed that they eat more niacin when essential amino acid tryptophan was present in the diet (Mosher, 1950). Niacin with amino acids act as feeding stimulant as seen in the two spotted spider mite, Tetranychus urticae Koch (Dabrowski, 1974). On the other hand, low intake of high pantothenic acid could be due to the deterrent taste of pantothenate or due to the presence of calcium ions in calcium pantothenate used as a source of pantothenic acid which was found to have a deterrent taste for honey bees (Teixeira De Sousa, xbib2019). Since honey bees in the low pantothenic acid treatment ate more from the vitamin-laced solution, while those in the high pantothenic acid treatment ate less, this means that post-ingestive regulation may cause this selective feeding response.
The survival data implies that potential toxicity of B-vitamins is acquired over time (such as pantothenic acid). Based on Bertrand's rule, nutrients present in excess can result in a fitness impact such as poor survival in extreme cases. Therefore, this can be explained by either the presence of high level of calcium ions as part of the calcium pantothenate or the high pantothenate part that may have killed the bees and caused the poor survival observed in the high pantothenic acid level group. On the other hand, the survival of honey bees receiving low and medium levels of folic acid and low level of niacin had reduced survival. This might be due to the presence of some Varroa infestation compared to other treatments that received high folic acid, medium and high niacin levels that seemed to improve honey bees health against varroa mites. These findings agree with those seen (Teixeira De Sousa, 2019) which reported survival rates of <40% of young bees on a pure calcium diet in a sucrose solution. However, the survival rate in this study is higher than that observed by Teixeira De Sousa (2019) that can be explained by the presence of either pantothenic acid, EAAs, or both in the diet, which could have reduced the negative impact of the high calcium ions. To address the impact of pantothenic acid on honey bees, more experiments using different calcium salt would be useful to confirm if high a level of pantothenate is lethal.
A pure pollen diet (that was not diluted with cellulose) significantly enhanced honey bees' survival despite their infection with Nosema ceranae (but also increased Nosema infection intensity) compared to pollen diluted with cellulose (Jack et al., 2016). This could be due to the rich vitamin content of bee-collected pollen that could have improved protein metabolism. Such a positive impact of pollen's vitamin content could be either due to supporting proteolytic enzyme activity or through maintaining the midgut proteomes that continue/carry out protein regulation, antioxidant defense and which overall improve energy release, thus helping bees to cope with N. ceranae infection.
B-vitamins seem to be an important factor in shaping honey bees' feeding behavior through affecting macronutrients intake regulation. This study also provides insights into the possible consequences of feeding honey bees randomly on high levels of B-vitamins that could be a determinant for bees. It is the first designed study that considers how honey bees regulate their protein and carbohydrate in the presence of B-vitamins using the geometric framework for nutrition. This will help researchers to understand other contributing factors to colony loss taking into consideration that B-vitamins have been understudied and ignored for long time. Future research should focus on the mechanisms of vitamin regulation, as well as the environmental conditions that may change need for specific vitamins, such as brood rearing or seasonal transitions.
Data Availability Statement
The original contributions presented in the study are included in the article/Supplementary Material, further inquiries can be directed to the corresponding author/s.
Author Contributions
WE and GW designed the study. WE performed the experiments. WE with the support of CC analyzed the data. WE, CC, and GW wrote the article with input from all authors. All authors contributed to the article and approved the submitted version.
Funding
This work was funded by a grant from the UK Council and Egyptian Government to WE and in part by a BBSRC grant (BB/P007449/1) to GW. BBSRC was not involved in the study design, collection, analysis, interpretation of data, the writing of this article or the decision to submit it for publication.
Conflict of Interest
The authors declare that the research was conducted in the absence of any commercial or financial relationships that could be construed as a potential conflict of interest.
Publisher's Note
All claims expressed in this article are solely those of the authors and do not necessarily represent those of their affiliated organizations, or those of the publisher, the editors and the reviewers. Any product that may be evaluated in this article, or claim that may be made by its manufacturer, is not guaranteed or endorsed by the publisher.
Acknowledgments
We would like to thank Mr. Malcolm Thompson for beekeeping and providing honey bee colonies, Mrs. Suzanne Bennett for editing this work.
Supplementary Material
The Supplementary Material for this article can be found online at: https://www.frontiersin.org/articles/10.3389/fsufs.2022.804002/full#supplementary-material
References
Allsopp, M. H., de Lange, W. J., and Veldtman, R. (2008). Valuing insect pollination services with cost of replacement. PLoS ONE 3, e3128. doi: 10.1371/journal.pone.0003128
Ames, B. N. (2001). DNA damage from micronutrient deficiencies is likely to be a major cause of cancer. Mutation Res. 475, 7–20. doi: 10.1016/S0027-5107(01)00070-7
Behmer, S. T. (2009). Insect herbivore nutrient regulation. Annu. Rev. Entomol. 54, 165–187. doi: 10.1146/annurev.ento.54.110807.090537
Behmer, S. T., Elias, D. O., and Bernays, E. A. (1999). Post-ingestive feedbacks and associative learning regulate the intake of unsuitable sterols in a generalist grasshopper. J. Exp. Biol. 202, 739–748. doi: 10.1242/jeb.202.6.739
Bertrand, G. (1912). On the role of trace substances in agriculture. J. Eighth Int. Congr. Appl. Chem 28, 30–40.
Blatch, S. A., Stabler, S. P., and Harrison, J. F. (2015). The effects of folate intake on DNA and single-carbon pathway metabolism in the fruit fly Drosophila melanogaster compared to mammals. Comp. Biochem. Physiol. B. Biochem. Mol. Biol. 189, 34–39. doi: 10.1016/j.cbpb.2015.07.007
Brodschneider, R., and Crailsheim, K. (2010). Nutrition and health in honey bees. Apidologie 41, 278–294. doi: 10.1051/apido/2010012
Burnet, B., and Sang, I. P. (1963). Dietary utilization of DNA and its derivatives by Drosophila melanogaster. Meig. 9, 553–562. doi: 10.1016/0022-1910(63)90001-5
Campos, M. G., Bogdanov, S., de Almeida-Muradian, L. B., Szczesna, T., Mancebo, Y., Frigerio, C., et al. (2008). “Pollen composition and standardisation of analytical methods.” 47, 154–161.
Carroll, M. J., Brown, N., Goodall, C., Downs, A. M., Sheenan, T. H., and Anderson, K. E. (2017). Honey bees preferentially consume freshly-stored pollen. PLoS ONE 12, e0175933. doi: 10.1371/journal.pone.0175933
Ciulu, M., Floris, I., Nurchi, V. M., Panzanelli, A., Pilo, M. I., Spano, N., et al. (2013). HPLC determination of pantothenic acid in royal jelly. Analyt. Methods 5, 6682–6685. doi: 10.1039/c3ay41284a
Crailsheim, K., Schneider, L., Hrassnigg, N., Bühlmann, G., Brosch, U., Gmeinbauer, R., et al. (1992). Pollen consumption and utilization in worker honeybees (Apis mellifera carnica): dependence on individual age and function. J. Insect Physiol. 38, 409–419. doi: 10.1016/0022-1910(92)90117-V
Dabrowski, Z. (1974). Studies on the relationships of Tetranychus urticae Koch and host plants. V. Gustatory effect of water-soluble vitamins. J. Polskie Pismo Entomol.
Dussutour, A., and Simpson, S. J. (2012). Ant workers die young and colonies collapse when fed a high-protein diet. Proc. Biol. Sci. 279, 2402–2408. doi: 10.1098/rspb.2012.0051
Farag, S. A., and El-Rayes, T. (2016). Research article effect of bee-pollen supplementation on performance, carcass traits and blood parameters of broiler chickens. Asian J. Anim. Vet. Adv. 11, 168–177. doi: 10.3923/ajava.2016.168.177
Glavinic, U., Stankovic, B., Draskovic, V., Stevanovic, J., Petrovic, T., Lakic, N., et al. (2017). Dietary amino acid and vitamin complex protects honey bee from immunosuppression caused by Nosema ceranae. PLoS ONE 12, e0187726. doi: 10.1371/journal.pone.0187726
Gonzalez-Soto, M., and Mutch, D. M. (2021). Diet regulation of long-chain PUFA synthesis: role of macronutrients, micronutrients, and polyphenols on Δ-5/Δ-6 desaturases and elongases 2/5. Adv. Nutr. 12, 980–994. doi: 10.1093/advances/nmaa142
Hagedorn, H., and Burger, M. (1968). “Effect of the age of pollen used in pollen supplements on their nutritive value for the honeybee. II. Effect of vitamin content of pollens.” J. Apic. Res. 7, 97–101.
Hatamizadeh, N., Eftekhar, H., Shafaghi, B., and Mohammad, K. (2007). Effects of folic acid on preschool children's appetite: randomized triple-blind clinical trial. Pediatr. Int. 49, 558–563. doi: 10.1111/j.1442-200X.2007.02421.x
Haydak, M. H. (1970). Honey bee nutrition. Annu. Rev. Entomol. 15, 143–156. doi: 10.1146/annurev.en.15.010170.001043
Haydak, M. H., and Dietz, A. (1965). Influence of the Diet on the Development and Brood Rearing of Honey Bees. Proc. XV. Beekeeping Cong. Bucharest.
Haydak, M. H., and Dietz, A. (1972). Cholesterol, pantothenic acid, pyridoxine and thiamine requirements of honeybees for brood rearing. J. Apic. Res. 11, 105–109. doi: 10.1080/00218839.1972.11099707
Health, U. D. o. and H. Services (2019). US Department of Agriculture. Dietary Guidelines for Americans, 2015–2020. 8th.
Hegyi, J., Schwartz, R. A., and Hegyi, V. (2004). Pellagra: dermatitis, dementia, and diarrhea. Int. J. Dermatol. 43, 1–5. doi: 10.1111/j.1365-4632.2004.01959.x
Herbert, E. W. Jr, Shimanuki, H., and Caron, D. (1977). Optimum protein levels required by honey bees (Hymenoptera, Apidae) to initiate and maintain brood rearing. Apidologie 8, 141–146. doi: 10.1051/apido:19770204
Jack, C. J., Uppala, S. S., Lucas, H. M., and Sagili, R. R. (2016). Effects of pollen dilution on infection of Nosema ceranae in honey bees. J. Insect. Physiol. 87, 12–19. doi: 10.1016/j.jinsphys.2016.01.004
Joos, B., Lighton, J. R., Harrison, J. F., Suarez, R. K., and Roberts, S. P. (1997). Effects of ambient oxygen tension on flight performance, metabolism, and water loss of the honeybee. Physiol. Zool. 70, 167–174. doi: 10.1086/639570
Komosinska-Vassev, K., Olczyk, P., Kazmierczak, J., Mencner, L., and Olczyk, K. (2015). Bee pollen: chemical composition and therapeutic application. Evid. Based Complement. Alternat. Med. 2015, 297425. doi: 10.1155/2015/297425
Kraus, S., Gomez-Moracho, T., Pasquaretta, C., Latil, G., Dussutour, A., and Lihoreau, M. (2019). Bumblebees adjust protein and lipid collection rules to the presence of brood. Curr. Zool. 65, 437–446. doi: 10.1093/cz/zoz026
LeBlanc, J., Laiño, J. E., del Valle, M. J., Vannini, V. V., van Sinderen, D., Taranto, M. P., et al. (2011). B-Group vitamin production by lactic acid bacteria–current knowledge and potential applications. J. Appl. Microbiol. 111, 1297–1309. doi: 10.1111/j.1365-2672.2011.05157.x
Lee, K. P., Behmer, S.T., Simpson, S. J., and Raubenheimer, D. (2002). A geometric analysis of nutrient regulation in the generalist caterpillar Spodoptera littoralis (Boisduval). J. Insect. Physiol. 48, 655–665. doi: 10.1016/s0022-1910(02)00088-4
Manning, R. J. (2001). Pollen analysis of eucalypts in Western Australia, Rural Industries Research and Development Corporation.
Maurizio, A. (1954). Pollenernährung und Lebensvorgänge bei der Honigbiene (Apis mellifica L.). Landwirtschaftliches Jahrbuch der Schweiz 68, 115–182.
Mertz, W. (1981). The essential trace elements. Science 213, 1332–1338. doi: 10.1126/science.7022654
Moritz, B., and Crailsheim, K. (1987). Physiology of protein digestion in the midgut of the honeybee (Apis mellifera L.). J. Insect Physiol. 33, 923–931. doi: 10.1016/0022-1910(87)90004-7
Mosher, W. A. (1950). The Biochemistry of B Vitamins: by Roger J. Williams, Robert E. Eakin, Ernest Beerstecher, Jr., and William Shive. New York, NY: Reinhold Publishing Co.
Namdari, M., Abadi, A., Taheri, S. M., Rezaei, M., Kalantari, N., and Omidvar, N. (2014). Effect of folic acid on appetite in children: ordinal logistic and fuzzy logistic regressions. Nutrition 30, 274–278. doi: 10.1016/j.nut.2013.08.008
Nicolson, S. W. (2011). Bee food: the chemistry and nutritional value of nectar, pollen and mixtures of the two. J Afr. Zool. 46, 197–204. doi: 10.1080/15627020.2011.11407495
Oliveira, K. C. L. d. S. (2006). Caracterização do pólen apícola e utilização de vitaminas anti-oxidantes como indicadoras do processo de desidratação, Universidade de São Paulo.
Pankiw, T., Winston, M., and Robinson, G. (1998). Queen mandibular gland pheromone influences worker honey bee (Apis mellifera L.) foraging ontogeny and juvenile hormone titers. J. Insect. Physiol. 44, 685–692. doi: 10.1016/S0022-1910(98)00040-7
Paoli, P. P., Donley, D., Stabler, D., Saseendranath, A., Nicolson, S. W., Simpson, S. J., et al. (2014). Nutritional balance of essential amino acids and carbohydrates of the adult worker honeybee depends on age. Amino Acids 46, 1449–1458. doi: 10.1007/s00726-014-1706-2
Pirk, C. W., Boodhoo, C., Human, H., and Nicolson, S. W. J. A. (2010). The importance of protein type and protein to carbohydrate ratio for survival and ovarian activation of caged honeybees (Apis mellifera scutellata). J. Apidologie 41, 62–72. doi: 10.1051/apido/2009055
Raubenheimer, D., Lee, K. P., and Simpson, S. J. (2005). Does Bertrand's rule apply to macronutrients?” Proc. Biol. Sci. 272, 2429–2434. doi: 10.1098/rspb.2005.3271
Ruedenauer, F. A., Raubenheimer, D., Kessner-Beierlein, D., Grund-Mueller, N., Noack, L., Spaethe, J., et al. (2020). Best be (e) on low fat: Linking nutrient perception, regulation and fitness. Ecol. Lett. 23, 545–554. doi: 10.1111/ele.13454
Schmickl, T., Crailsheim, K. J. B. E., and Sociobiology (2002). How honeybees (Apis mellifera L.) change their broodcare behaviour in response to non-foraging conditions and poor pollen conditions. 51, 415–425. doi: 10.1007/s00265-002-0457-3
Shimanuki, H. (1978). Effects of thiamine-or riboflavin-deficient diet fed to new emerged honey bees, Apis mellifera L. Apidologie 9, 341–348. doi: 10.1051/apido:19780406
Simpson, S. J., and Raubenheimer, D. (1993). A multi-level analysis of feeding behaviour: the geometry of nutritional decisions. Philo. Transact. R. Soc. London. Series B: Biol. Sci. 342, 381–402. doi: 10.1098/rstb.1993.0166
Simpson, S. J., and Raubenheimer, D. (2012). The Nature of Nutrition: A Unifying Framework From Animal Adaptation to Human Obesity. Princeton university press. doi: 10.1515/9781400842803
Simpson, S. J., Sibly, R. M., Lee, K. P., Behmer, S. T., and Raubenheimer, D. (2004). Optimal foraging when regulating intake of multiple nutrients. Anim. Behav. 68, 1299–1311. doi: 10.1016/j.anbehav.2004.03.003
Stabler, D., Al-Esawy, M., Chennells, J. A., Perri, G., Robinson, A., and Wright, G. A. (2020). Regulation of dietary intake of protein and lipid by nurse-age adult worker honeybees. J. Exp. Biol. 224, jeb230615. doi: 10.1242/jeb.230615
Stabler, D., Paoli, P. P., Nicolson, S. W., and Wright, G. A. (2015). Nutrient balancing of the adult worker bumblebee (Bombus terrestris) depends on the dietary source of essential amino acids. J. Exp. Biol. 218, 793–802. doi: 10.1242/jeb.114249
Tardy, A. -L., Pouteau, E., Marquez, D., Yilmaz, C., and Scholey, A. (2020). Vitamins and minerals for energy, fatigue and cognition: A narrative review of the biochemical and clinical evidence. Nutrients 12, 228. doi: 10.3390/nu12010228
Teixeira De Sousa, R. (2019). Behavioural Regulation of Mineral Salt Intake in the Adult Worker Honey Bee, Apis mellifera. Newcastle University.
Teixeira De Sousa, R. (2019). Behavioural regulation of mineral salt intake in the adult worker honey bee, Apis mellifera. Newcastle University. Available online at: https://theses.ncl.ac.uk/jspui/handle/10443/4480
Vaudo, A., Stabler, D., Patch, H., Tooker, J., Grozinger, C., and Wright, G. (2017). Correction: Bumble bees regulate their intake of essential protein and lipid pollen macronutrients. J. Exp. Biol. 220, 507–507. doi: 10.1242/jeb.155911
Vaudo, A. D. (2016a). Macronutrient ratios in pollen shape bumble bee (Bombus impatiens) foraging strategies and floral preferences. Proc. Natl. Acad. Sci. U.S.A. 113, E4035–E4042. doi: 10.1073/pnas.1606101113
Vaudo, A. D. (2016b). Bumble bees regulate their intake of the essential protein and lipid pollen macronutrients. J. Exp. Biol. 2016:140772. doi: 10.1242/jeb.140772
Vecchi, M., Sabatini, A., Grazia, L., Tini, V., and Zambonelli, C. J. A. (1988). “Il contenuto in vitamine come possibile elemento di caratterizzazione della gelatina reale.” 4:139–46.
Withers, G. S., Fahrbach, S. E., and Robinson, G. E. (1993). Selective neuroanatomical plasticity and division of labour in the honeybee. Nature 364, 238–240. doi: 10.1038/364238a0
Keywords: honey bee, Apis mellifera, B-vitamins, geometric framework, food intake regulation
Citation: Elsayeh WA, Cook C and Wright GA (2022) B-Vitamins Influence the Consumption of Macronutrients in Honey Bees. Front. Sustain. Food Syst. 6:804002. doi: 10.3389/fsufs.2022.804002
Received: 28 October 2021; Accepted: 20 March 2022;
Published: 04 May 2022.
Edited by:
Simone Tosi, University of Turin, ItalyReviewed by:
Elizabeth Nicholls, University of Sussex, United KingdomSilvio Erler, Julius Kühn-Institut - Braunschweig, Germany
Copyright © 2022 Elsayeh, Cook and Wright. This is an open-access article distributed under the terms of the Creative Commons Attribution License (CC BY). The use, distribution or reproduction in other forums is permitted, provided the original author(s) and the copyright owner(s) are credited and that the original publication in this journal is cited, in accordance with accepted academic practice. No use, distribution or reproduction is permitted which does not comply with these terms.
*Correspondence: Walaa Ahmed Elsayeh, w.elsayeh2@newcastle.ac.uk; walaa.elsayeh@outlook.com