 David Ferreira Lopes Santos
 Samara Marques Gomes
- School of Agricultural and Veterinarian Science, São Paulo State University, Jaboticabal, Brazil
The aim of this study is to assess the economic viability of a medium-sized sugarcane farm applying a diversification strategy, including the possibility of managerial flexibility in changing its portfolio over time. There is a theoretical gap in the economic evaluation of diversified production systems in farm space. We assessed one diversified structure for the sugarcane agricultural farm that included land areas dedicated to the rotational cultivation of soybean/corn, corn/peanut, and corn/green manure. We considered the managerial flexibility when replacing sugarcane culture. Primary and secondary data were used based on the agricultural context of São Paulo State, Brazil, where the modal profile of medium-sized producers in the region was defined with the support of technicians from the leading agricultural cooperative and sugarcane suppliers association. The results indicate that the diversification strategy for the investigated context generates: lower financial risk for the farm, higher potential return on investment, and higher economic value added.
Introduction
As a result of new social, environmental, political, and regulatory demands for sustainability, new forms of land use are required for food production (Regan et al., 2015; de Roest et al., 2018; Qureshi et al., 2018) which can be a challenge to develop public policies (Ferreira and Féres, 2020). Additionally, sustainable food production is one of the central themes for achieving the United Nations Sustainable Development Goals (SDGs), as it directly influences such objectives as poverty eradication, zero hunger, clean water provision, sustainable production and consumption, combating climate change, and the preservation of life on earth (United Nations, 2020).
Paralleling the development of sustainable food production environments, there is a need to increase the global food supply due to the increase in the worldwide (Mukherjee, 2021). According to the latest FAO report (2022), after the COVID-19 pandemic, the global hunger has increased and by 2030 the projections are that 670 million people will still be facing hunger, which represents 8 percent of the world population, the same as the projections when 2030 agenda was launched in 2015. The increase is a reflection of inequalities across and within countries and an unequal pattern of economic recovery.
Family farming represents 80% of the world food production and suggests the relevance for food supply (Cavalli et al., 2020). Brazil has shown steady growth in agricultural production since 1970 and has become one of the major agricultural producers in the world (Corcioli et al., 2022). Despite this scenario, small producers have an essential socio-economic role (Maia et al., 2019), since the majority of people working in agriculture are family farmers and it represents 77% of the total farmers units and generate 10.1 million jobs in agricultural establishments (Cavalli et al., 2020).
A diversified agricultural production system is one of the most ecological viable, economically feasible, and rational practices, which maintains biodiversity, can reduce the incidence of disease and pests, and allows the original regional ecosystem to retain the capacity to return to the original native state (McCord et al., 2015; Mango et al., 2018; Piedra-Bonilla et al., 2020; Ponce, 2020; Rodriguez et al., 2021; Rosenberg et al., 2022). Diversification can result in cost reductions for the resulting crop, as there is a reduction in the use of fertilizers (de Roest et al., 2018).
Although the diversification of crops is an already consolidated practice, the production systems of large-scale crops such as sugarcane, soybeans, corn, among others, occur in monoculture systems in emerging countries (Faleiros et al., 2018). The monoculture system allows the reduction of unit costs and ensures cost competitiveness. However, traditional economic techniques do not consider the environmental effects on economic risks with concentration (Farinelli et al., 2018).
Sugarcane production in Brazil has traditionally focused on monoculture-based production systems, so much so that this method is now considered paradigmatic, and Brazilian sugarcane suppliers traditionally dedicate themselves entirely to this crop (Farinelli et al., 2018). Currently, Brazil is the largest producer of sugarcane, with 37 percent of global production, a value double that of second-place India (FAO, 2018).
This is to some extent reinforced by the fact that, sugarcane has an annual harvest, from 4 to 6-year production cycle, plus price and productivity volatility and high planting costs has generally limited the sustainability of sugarcane as a crop for small and medium rural producers in Brazil (Farinelli et al., 2018).
Accordingly, crop diversification on small and medium-sized rural properties, formerly dedicated to sugarcane, may form an appropriate strategy for the sustainability of such holdings, since in addition to diversifying the income sources of the producer and reducing inherent risk, using crop rotation and succession systems can contribute to better use of land in terms of conservation of soil physicochemical properties, while helping to guarantee greater supply of more varied foods (McCord et al., 2015; Adjimoti et al., 2017; Asante et al., 2017; Boncinelli et al., 2018; de Roest et al., 2018; Mango et al., 2018; Douyon et al., 2022).
In addition, the strategy of using diversified production systems means a rural property can more closely resemble an 'investment portfolio', guaranteeing farmers access to new investment alternatives to reduce the risk of exposure inherent in a single crop. In addition, such options allow the decision-making process to include changing the composition of the production structure overtime to increase cash flow generation capacity (Farinelli et al., 2018).
In agribusiness, investment analysis techniques are compiled from corporate finance, associated with Discounted Cash Flow (Bonacim et al., 2013; Santos and Jurca, 2013) and Real Options Theory (TOR) (Santos et al., 2016).
The suitability of an investment technique is determined through the characteristics of an investment project, in addition to the level of environmental uncertainty. However, the traditional Discounted Cash Flow model is the commonly used technique (Pivoriene, 2017).
The DCF technique is based on the value of money over time. It is a technique widely taught and disseminated in the literature, in addition to being easy to implement and evaluate (Pivoriene, 2017).
However, expanding the crop portfolio is an activity that involves technical, operational and financial factors of the rural company, which becomes a complex activity, as it affects production planning in different ways, in addition to the need for more investments in fixed and specific work (Oliveira et al., 2012), effectively, an investment analysis is demanded that considers these particularities in the midst of the flexibility of the greater range of choice than planting, and it is in this context that the Real Options Theory becomes the technique more appropriate. The importance of managerial flexibility in agricultural activity under market or production risk conditions has already been explored in other studies (Lee et al., 2016; Panichvejsunti et al., 2018), since managerial flexibility adds value to an investment analysis by adapting in response to new information (Farinelli et al., 2018). In the agricultural sector, managerial flexibility is essential, mainly due to the tendency of commodity prices to fluctuate, changes in environmental conditions (Lee et al., 2016) lack of technology and mechanization, low availability of credit and lack of knowledge on agricultural techniques by producers (Panichvejsunti et al., 2018), which are a source of uncertainty.
Real Options Theory (ROT) allows project evaluation considering the managerial flexibilities added to the investment analysis model and the investor's decision-making capacity, filling the gap that exists in traditional methods (Oliveira, 2020).
However, only the study by Farinelli et al. (2018) used ROT to model market and production risk in an integrated manner. Although Farinelli et al. (2018) demonstrated the importance of managerial flexibility in the cultivation of sugarcane, the study restricted the option alternatives to soybean cultivation.
The objective of the current study is to evaluate the economic viability of a medium-sized rural sugarcane-producing farm using a diversification strategy, including the possibility of managerial flexibility in changing its portfolio over time.
In addition, in a different way to the reference studies, this work proposes to evaluate the value creation potential of diversification with corn, safrinha corn, soybeans and peanuts, which are the main oilseed crops in the Jaboticabal region. In this way, this study can also bring social and productive impact in its context and help producers and entrepreneurs toward new production systems that will be more efficient, sustainable and economically viable than the long-established monoculture paradigm of Sugar Cane production.
The results of this study can contribute to the strategic and tactical decisions of sugarcane farms in both Brazil and the 104 other countries in the world that produce sugarcane. It is also understood that this analytical methodology can be extended to other large-scale crops, thus broadening the discussion on the sustainability of diversified production systems.
Materials and methods
The strategy used to carry out the research used a representative medium-sized farm dedicated to sugarcane production in the State of São Paulo, Brazil, which is the state where more than 60 percent of the country's sugarcane production is produced occurs.
To define a representative farm for this study, data from the most recent Agricultural Census in Brazil and that for the State of São Paulo were analyzed. In these, small and medium-sized rural properties (10–100 ha) represent 39% of rural properties and occupy 18 percent of the total area-−63 million ha (IBGE—Brazilian Institute of Geography Statistics, 2019). Due to the diversity of farm forms, it was decided to use a maximum size of 100 ha to maximize production structures and avoid fixed cost apportioning. On these 100 ha properties, 75 ha was used for planting, guaranteeing a minimum of 20 ha to meet natural reserve requirements, and 5 ha to be used for improvements and access roads for the movement of machinery and equipment. Finally, it was decided to focus on the mesoregion of Jaboticabal, São Paulo State, as this is one of the main sugarcane producing regions within the state and has a fully functioning information system on rural properties documentation, from cooperatives and producer associations.
According to the latest IBGE Agricultural Census (2017), the region of Jaboticabal has a total of 67.115 ha, including crops, pastures, woods and forests, which sugarcane area represents 64 and 60% of the total area. Considering the temporary crop area, sugarcane represents more than 74% (IBGE, 2017).
To achieve study objective, the research was organized into a series of steps: (i) Analyze value of current program and those of alternatives; (ii) Analyze fiscal outlay-income relations to determine break-even-point; (iii) Evaluate production structure to minimize risks, while considering agronomic limitations; (iv) Structure a model of real options to perform rotations or successions of cultures.
The development of these research stages allows aligning the methodological design to the theoretical-empirical gap that this study seeks to contribute. The steps demonstrate the complexity of the information structure that producers need to use when diversifying their production (steps 1 and 2) and, equally, establish opportunities for flexibility in the decision process, as risks are understood and inserted into the model analysis (steps 3 and 4). Finally, by structuring the model of economic analysis in the framework of the theory of real options, opportunities for value creation can be highlighted (step 5).
Materials
Information was gathered in the second half of 2018 and analyzes were conducted in 2019 along with the gathering of primary and secondary data. Primary data were obtained from the technical team of one of the main agricultural cooperatives in the State of São Paulo dedicated to sugarcane production, but with an active focus on practical crop diversification, including the production of soy, corn and peanuts. The crops were chosen following the greatest cultures of the state of São Paulo according to the IEA (Agricultural Economics Institute). These primary data refer to technical recommendations regarding the nature of machinery and equipment required for a diversified farm, and the best practices for soil preparation, planting, crop management and harvesting. To avoid bias and ensure informational reliability, these data were compared with the literature.
To estimate monetary and productivity values, different databases were consulted to ensure that all data reflected market practices. Data were obtained from the Association of Sugarcane Suppliers of Guariba (SOCICANA), from São Paulo State Council of Sugarcane, Sugar and Ethanol Producers (Consecana), from the National Supply Company (CONAB) of the Paraná State Secretariat of Agriculture and Supply (Seab), and the Center for Advanced Studies in Applied Economics (CEPEA), from the University of São Paulo (USP).
All prices were deflated for December 2018, using the official IPCA inflation index for Brazil.
Methods
The presentation of the research methods was structured according to the steps necessary to build the results and to support the discussions. The use of statistical methods (ARIMA and Monte Carlo Simulation) was combined with financial methods (Discounted Cash Flow and Real Options Theory) to construct the results. Validation tests are presented according to the literature.
Price modelinginitially, it was necessary to identify price uncertainty and provide a price forecast model for each commodity.
To estimate the prices of the agricultural commodities of interest for the 2018/2019 harvest, and to determine volatility patterns, it was necessary to carry out an analysis of the descriptive statistics of the time series, an analysis of the price series characteristics regarding stationarity, and finally evaluation of the forecasting models to estimate prices (Hair et al., 2009).
Statistical analysis allowing construction of the information used to generate research results took place using Gretl 1.91 Software.
To analyze the descriptive statistics of the series, price variation was calculated from real prices of each commodity, using Equation 1.
Pt—Price in the period t
Pt-1—Price in the previous period
For periodicity of “t” was used months.
Following variation calculation, analysis of the measures of position, dispersion and correlation were calculated (shown in Table 1).
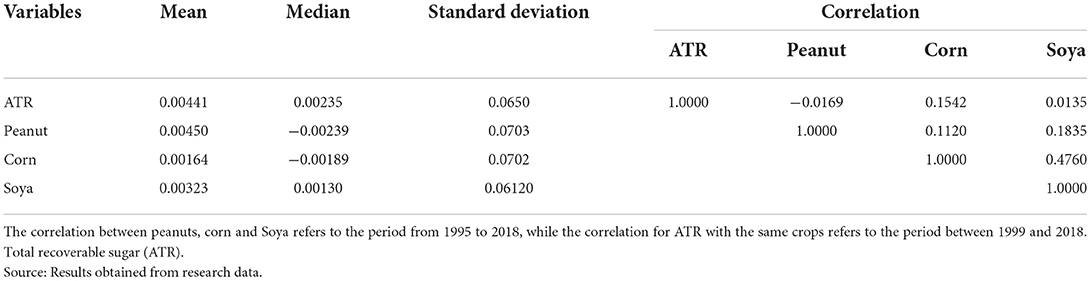
Table 1. Descriptive statistics for commodity price variations.
It can be noticed in Table 1 that soya has the highest positive correlation with corn and corn has the only negative correlation with sugarcane (represented by ATR).
A priori, possible atypical observations were verified in a univariate form, using the equation:
Atypical observations were defined as those with scores greater than 4 produced by Equation 2, since the database has 286 observations for each variable. Detected outliers were replaced by the series average from each commodity without outliers. The outliers were identified by the Mahalanobis distance technique and the decision to replace the original values with the average is due to the qualitative assessment of these values (Hair et al., 2009). It was found that the four outliers occurred due to specific institutional changes in the country that impacted the results in a specific way.
From Dickey-Fuller Test results, it was possible to test series stationarity. Results are shown in Table 2. All series are stationary, since the p-value rejects the null hypothesis of the existence of a unit root.
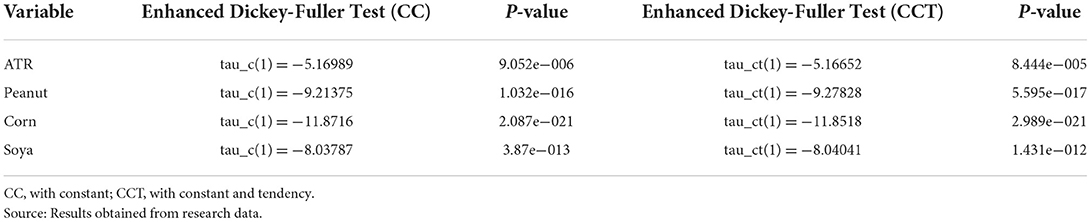
Table 2. Results of enhanced Dickey-Fuller Tests, showing the p-value for the studied variables.
Evaluation price estimation forecasting models was necessary to understand the variables used to construct the results. Price volatility was the controlled variable in the price model options analysis.
Table 3 shows the average prices, standard deviation and coefficient of variation for prices of the agricultural products under study.
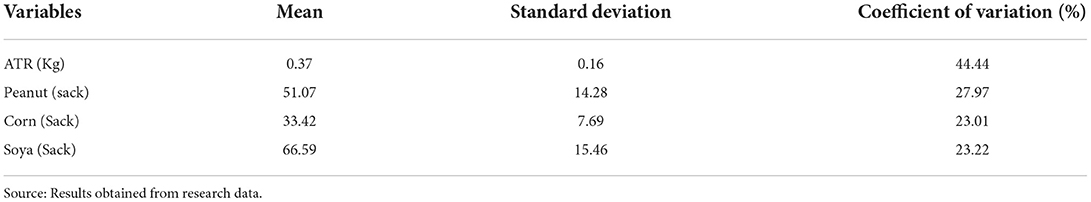
Table 3. Mean price, standard deviation and coefficient of variation for prices of studied variables.
Risk modeling
Finally, to determine risk it was necessary to determine the contribution (W) of each crop (A, B, C, and D) using the risk optimization procedure, considering the portfolio risk model defined Markowitz (1952). After defining proportional contributions, risk was defined via Equation 3:
To find the ideal proportional land allocation that would provide the highest return and the lowest risk for diversification, the optimization model was used based on the seminal concept of Markowitz for the financial assets market. Risk optimization method provides a unique solution that brings the lowest possible risk considering the correlated price variations and changes in the different characters and proportions for each asset, where proportion was the area of land allocated to each crop (Knoke et al., 2015).
Cash flow and Monte Carlo simulation
From the data obtained modeling the monoculture-based cash flow, cash flow for the diversified system could be constructed using the proportional land-use from the crop diversification model.
Due to the volatility of agricultural crop prices, evaluation of potential annual results also used a Monte Carlo Simulation to estimate diversified farm Cash Flow, as this could incorporate such inherent combined variation.
To perform the Monte Carlo Simulation, estimated 2019 prices used in the predictive models were deployed and, considering the standard deviations of each series, 10,000 price simulations were carried out for each crop across 5 years, thus varying price variation combinations, using a normal distribution.
The construction of the decision tree followed the Binominal Model of Cox et al. (1979), based on the assumption that pricing behavior is consistent with the Brownian Geometric Movement (BGM) (Farinelli et al., 2018).
The Brownian stochastic process, with tendency, is given by Equation 04:
where α—growth parameter (tendency); σ—variance; x—stochastic process for any asset; dB—continuous time.
As the financial asset assumes different values across a given time interval, it is possible to define Brownian Geometric Movement (BGM) with tendency, using Equation 05:
In a given time period Δt, the underlying asset will assume two values; an ascendant characterized by u(u>1)u and a descendent given by d (d < 1).
Following (Guo et al., 2019), the present value, based on risk-neutral probability, can be determined with Equation 6:
Where:
r_f : risk-free interest rate
f _(i,j:) price
The risk-free interest rate used for calculation was the Selic rate, which is the basic interest rate in economy.
Therefore, it is necessary to determine the values of p and q, that represents the probability of ascendant and descendent. These are defined in Equations 7 and 8 as:
Results
The results section is structured as follows: (i) analysis of the current value and risk of individual crop alternatives; (ii) analysis of cost-volume-profit ratio for each alternative; (iii) production structure involving minimizing producer risk; (iv) a real options model incorporating managerial flexibility.
Analysis of the present value and risk of individual crop alternatives
To model cash flow, it was necessary to forecast prices for the next harvest. For sugarcane it was used ATR for pricing, which represents the quality of the sugarcane and its capacity to convert into alcohol or sugar. Accordingly, autoregressive models with moving averages (ARIMA) were used to estimate pricing for each crop, to give an ATR, with the model adjusted as ARIMA (3,2,1). Thus, for peanuts it was adjusted as ARIMA (1,1,1), for corn it was adjusted as (1,1,1) and finally for soybeans the model was adjusted as ARIMA (1,1,1). This allowed forecasting of commodity prices until April 2019, and calculation of the price volatility of each crop. The results of the empirical models are in Annexes A, B, C, and D.
The period of January 2019 was defined, as it is the start period of the research and is in the period of sugarcane harvesting in the investigated region. Thus, the forecast for April/2019, as a way of representing the planning conditions of the rural producer's next harvest.
From the data obtained with the ARIMA method, it was possible to forecast estimated prices for each crop, as shown in Table 4:
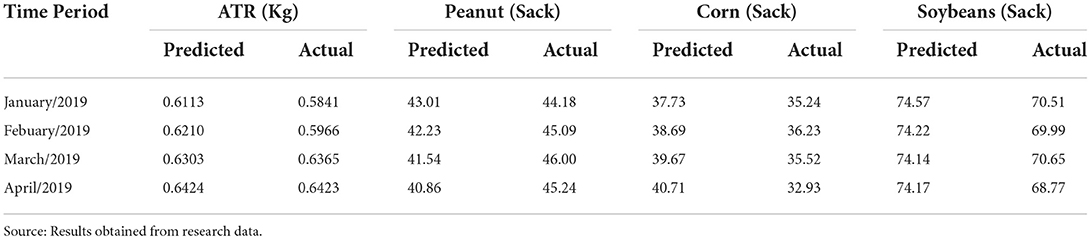
Table 4. Predicted and actual monthly values in Reais (R$) for the months January to April 2019 for the commodities studied.
From Table 4, values forecast for each crop from January to April 2019, approached the real-world value, especially the ATR for sugarcane. It should be noticed that, when the model is used to predict value for the months farthest from the end of the series, its predictive ability is reduced. However, the modeling proved to be accurate, as for the months of January and February, where the difference between the real and predicted values for all crops was less than 10%. A result of 10% or more may result in the project being inviable, this shows the importance of ROT as an investment analysis tool.
The cash flows obtained, allowed comparison of the necessary investment, the present value of the operational cash flow for each hectare, plus the return and risk for each crop under monoculture and with diversification (see Table 5).
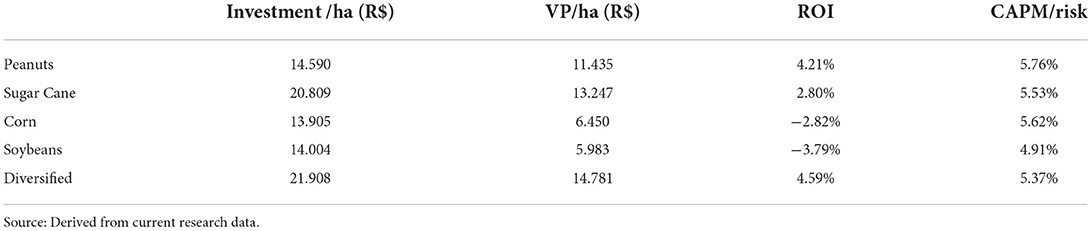
Table 5. Investment, PV/ha, ROI, and CAPM/Risk for the studied scenarios.
It should be noted that for individual analysis of monocultures, the use of rotations between annual crops (peanuts, corn and soybeans) was not considered. This meant that results would be equivalent to a single harvest of sugarcane.
Results given in Table 5 show that all production strategies have an ROI below the capital opportunity cost (CAPM), which results in “wealth destruction,” with peanuts, sugarcane and diversified farm showing positive ROI. In the case of diversified farm, differences between ROI and CAPM are the smallest among the alternatives, even though the investment is the greatest.
Analysis of the cost-volume-profit ratio of each alternative
Modeling cash flows for each crop under monoculture (see Appendix C–F), allowed equilibrium points to be established for peanuts, sugarcane, corn, off-season corn and soybeans. The Fixed and variable costs for these are in Appendix A and B, while the breakeven point for each crop can be seen in Table 6:
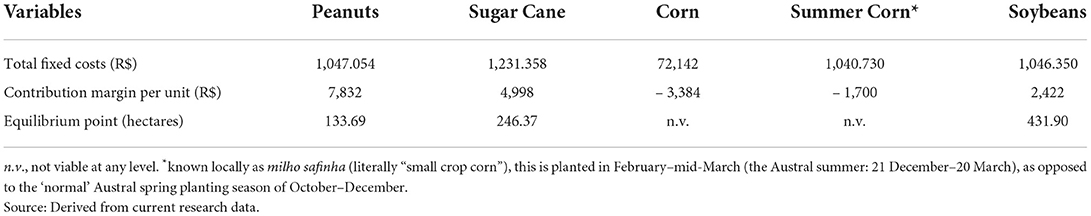
Table 6. Equilibrium points in hectares for the crops under study.
As shown in Table 6, the break-even for the crops under study are between 133 and 432 hectares, when considering the fixed cost and equilibrium margin obtained previously. It should be noticed that for corn and summer corn, production is not feasible at any level.
Production structure with risk minimization
To find the ideal ratio, one providing the highest return and the lowest risk, for diversification, an automated Markowitz-based optimization model was used, to analyze risk across a series of possible combinations. This revealed ways to reduce the risk of diversification and increase the return, as shown in Table 7:
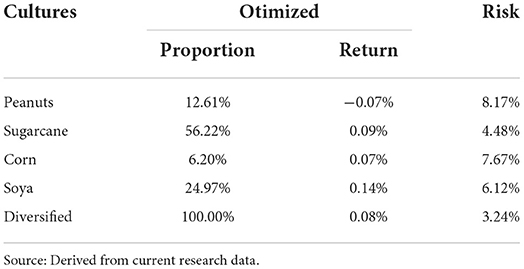
Table 7. Proportion, return and risk of diversification.
Such proportionalities allowed estimation of values for each crop when constructing the diversified cash flow.
For the 75 hectares diversified farm whose production structure is considered in the current study, the diversification and rotation opportunities used were those available in the Jaboticabal region. Accordingly, an operational model rotating peanuts with summer corn on 9 hectares, rotating soybeans with summer corn on 19 hectares, corn on 5 hectares (with green manure) and sugarcane on 42 hectares, was used, as defined by the diversification model.
It is noted that no small and medium-sized rural properties were found in the Jaboticabal region to be using the kind of diversification strategy under study. This was confirmed by the and from agricultural cooperative technicians, and the sugarcane suppliers association agroengineers. However, consultation with engineers revealed that large producers (> 500 ha) do have diversified production structures. However, the decision on what crops to plant and in what proportion are based on empirical evaluations by the producers.
It is important to emphasize the central nature of diversification as a means of reducing farm risk. The option that best minimizes risk to the farm has 74% of the production area devoted to crops that have a risk value >5.37% of the farm risk. Only soybean crop has an individual risk lower than 5.37%, and this when it occupied < 25% of the area. Accordingly, the impact of diversification on risk reduction to the farm is established, based on the weak correlations between the variables (Table 1), as is the possibility of extending the Markowtiz model to agricultural assets.
The data obtained cash flow under monoculture, allowed the construction of a diversified cash flow model using the proportions given by the crop diversification model. The results for a diversified farm are given in Table 8.
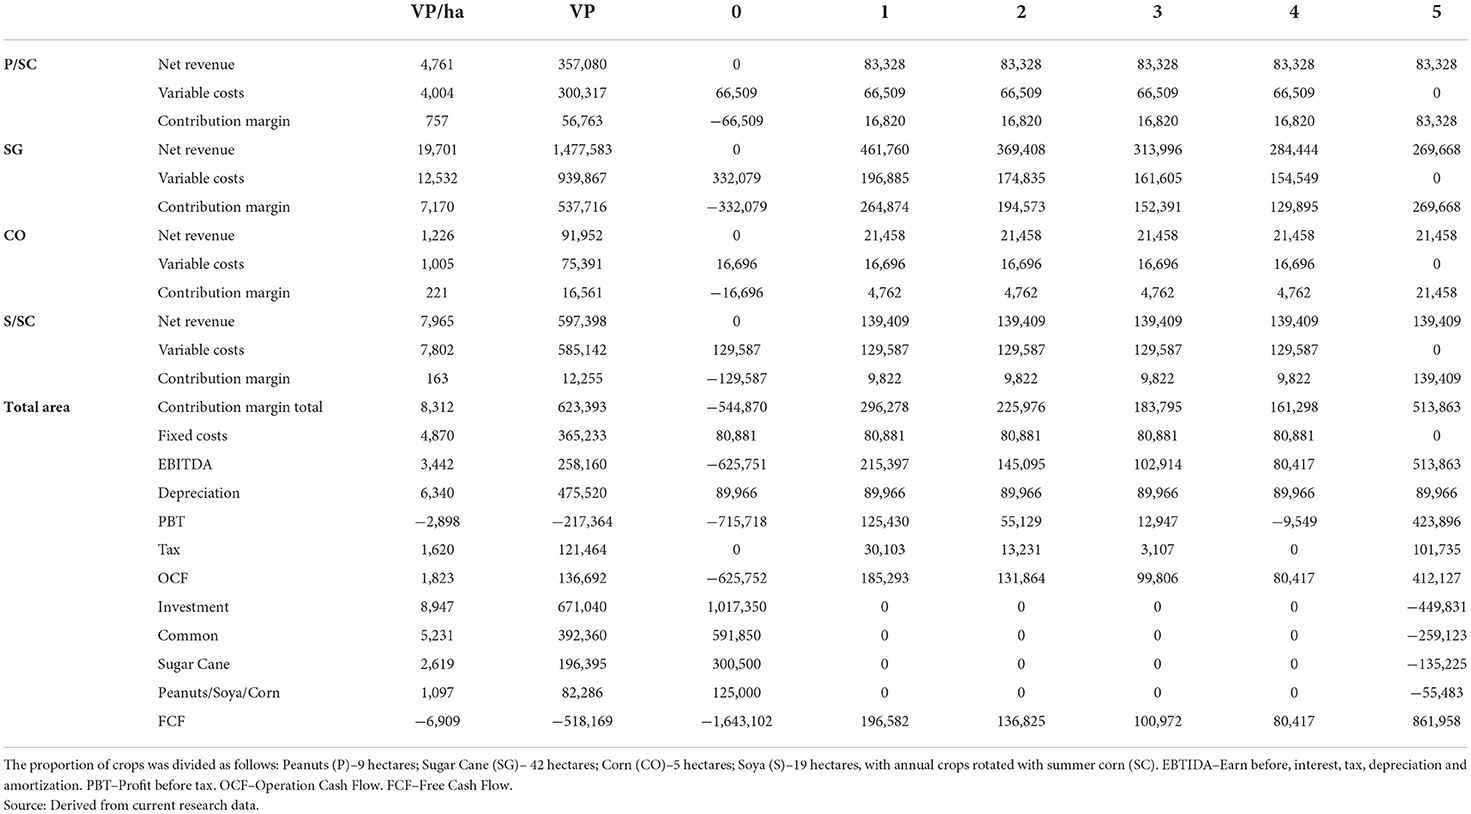
Table 8. Cash flow from modal farm per hectare, and total under crop diversification.
It is pointed out that the decline in sugarcane gross revenue is due to the drop in productivity of this agricultural crop over the course of production cycles. The other crops in rotation systems and with the adoption of recommended management techniques maintain average productivity over time (Faleiros et al., 2018; Farinelli et al., 2018).
It can be noticed that all crops have a positive contribution margin, that is, although there are differences in profitability between them, all contribute positively from the financial point-of-view of the farm to the payment of the fixed cost and the return on invested capital.
However, the economic result is negative by R$ 6,909/ha, reflecting the fact that Return on Investment (ROI) is lower than the cost of capital determined by CAPM (see Table 9).
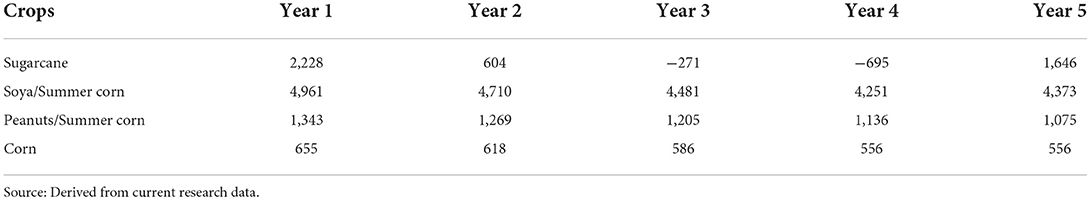
Table 9. Mean discounted contribution margin calculated in R$ per hectare.
Since the results in Table 8 represent average values of the Monte Carlo Simulation, Figure 1 shows Present Value per hectare (PV/ha) in terms of cash flows for a diversified farm, excluding the original investment.
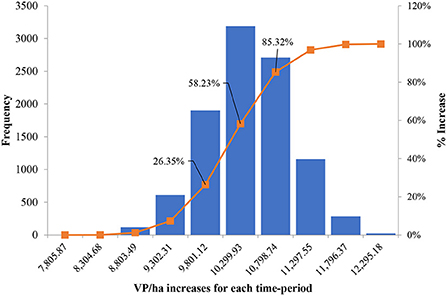
Figure 1. Derived from current research data. Crops proportionality was distributed as follows: Peanuts−9 hectares; Sugar Cane−42 hectares; Corn−5 hectares; Soya−19 hectares, with annual crops are rotated with summer corn.
For the farmer, PV/ha of the farm represents the value of the farm when opting for the given investment. The PVs in Figure 2 indicates that a diversified farm can generate positive free cash flows under any of the 10,000 possibilities evaluated, with an average value of R$ 10,175. However, this is insufficient to remunerate the investment per hectare [R$ 21,908 (Table 9)] over a period of 5 years, even considering the demobilization of capital at its residual book value in the 5th year.
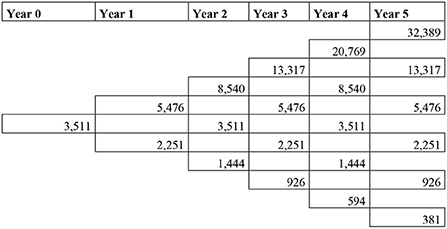
Figure 2. Derived from current research data.
The maximum VP of FCF value, without the investment, is shown to be R$ 12,295. Therefore, under the premises used, there is no expectation of investment recovery.
A real options model that incorporates managerial flexibility
From average discounted contribution margins of the crops for each year generated by the Monte Carlo Simulation (Table 9) it was possible to compare the peanut/corn crop, soybean/off-season corn crop and corn. With this the crop with the highest average discounted margin contribution would be used as a replacement, if it had a higher value at the diversified farm valuation stage with managerial flexibility than management under the sugarcane cycle.
With the aims of using managerial flexibility to add value to production, the exchange of sugarcane for another crop occurs when one of them is more profitable, when the contribution margin is higher than the current margin. In the current study, such alterations were made considering the margins per hectare. The results obtained can be seen in Table 9.
As shown in Table 9, among the options for exchange, soy in rotation with summer corn, was the option that gave the highest advantage in relation to peanuts (in rotation with summer corn) and corn.
Accordingly, in the next modeling step, soy was used as an exchange parameter for the sugarcane cycle if cane contribution margins in the decision tree were greater.
When constructing a decision tree, a comparison was made from year 5 to year 1, that is backwards, considering the rising and falling of prices for each crop. Accordingly, comparison between the contribution margins of the peanuts, sugar cane, corn and soybeans, allowed the identification of those crops with a contribution margin higher than that of sugarcane.
From the standard deviation of the underlying assets, it was possible to calculate the upward “u”, and downward “d” movements (see Table 10):

Table 10. Rising “u” and falling “d” movements for the studied commodities.
Table 11 shows rising and falling price probabilities.
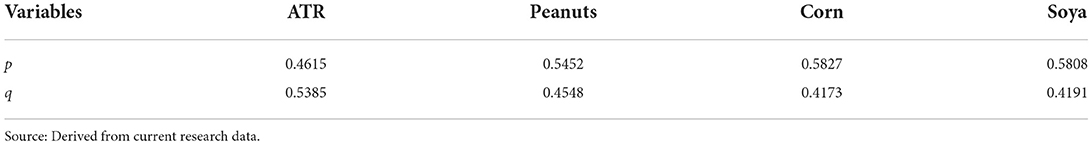
Table 11. p and q values derived for the studied commodities.
Figure 2 shows the per hectare contribution margin for the sugar cane cycle. Contribution margins per hectare of sugarcane were used for comparison with the margins of soybean/summer corn derived in the previous step. Exchange would take place if values for soybeans were higher than those for sugarcane.
It can be seen from Table 9 that soy potentiated an exchange in year 5. From a value of 2,251, in year 4, an exchange could be made from the value of 3,511, and in year 3 an exchange could be made from the value of 2,251 (see in Figure 3).
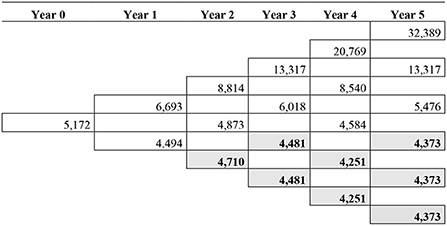
Figure 3. Derived from current research data. The gray cells with bold numbers represent the change from raising sugarcane to growing soya; the given values show the contribution margin per hectare.
Using the decision tree to compare year 1 of the sugarcane marginal contribution to the situation when the crop exchange occurred, gave a per hectare value of R$ 1,661, indicating the positive impact of diversifying and managerial flexibility, which resulted in a net value increase of R$ 124,575 for the farm.
Figure 3 shows a decision tree for crop exchange options in the sugarcane cycle, for soybean in rotation with summer corn, based on the per hectare contribution margin.
Figure 3 shows that, under crop exchange managerial flexibility, soybeans are the most viable option among the studied crop options (peanut, corn and soybean), they have a higher contribution per hectare in Year 2.
Analysis and comparison of results
The price prediction results given in Table 4 for each crop show that the model lost predictive capacity for the most distant months in the series. However, modeling demonstrated that the difference for all crops between the predicted and actual prices was < 10% for the months of January and February of 2019. In addition, the capacity of the model to scale an estimated value and the risk was notable. Using the ATR prediction, it was possible to show that the predicted price was very close to the real price. Indicating that the predicted results used in the Monte Carlo Simulation bore close approximation to the values of real prices.
The results given in Table 7 show that the model-derived proportions were 12.61% for peanuts, 56.22% for sugarcane, 6.2% for corn and 24.97% for soybean. In these proportions risk was estimated at 3.24%, with a return of 0.08%. This was the best diversification option considering price variations for each crop. In contrast, in a study by Farinelli et al. (2018), the proportions for diversification were 56% for Soya and 44% for Sugar Cane, with 127 hectares for Soya and 100 hectares for sugarcane.
In addition, the diversification study by Farinelli et al. (2018) based on soya and sugarcane, produced a discount rate of 4.54% and a return of 7.42%. The results given in Table 5 of the current study show that the proportion used for crop diversification, makes it possible to reduce the overall risk to 5.37% and a return of 4.59%. Although no greater than the risk, this gives a better result than the other monoculture options, in which the diversified culture has a lower risk value compared to the risk for individual crops, as well as a higher rate of return than individual crops, effectively demonstrating the importance of diversification for rural properties.
As shown in Figure 3, the possibility of exchanging the Sugarcane culture for soya, agrees with the study carried out by Farinelli et al. (2018), in which this replacement also proved to be feasible from the 2nd cut.
The results obtained in the current study agree with the studies of Farinelli et al. (2018), in which diversification proved to be the option that produced greater return than risk/CAPM (see Table 5), considering diversification between sugarcane and soya cultivation.
As a form of risk modeling for investment analysis that treats the risks of each crop separately, the use of beta appears highly appropriate. Even if they are not yet used in the literature focused on the agricultural market, this mechanism provides a tool that allows a systematic way the of modeling the reality of systemic risk in diversified production systems.
The use of the CAPM model allows the required return for each production system to be incorporated, so guiding the use of appropriate rates for investment analysis. This is advantageous as it does not only use rates that express the basic interest rate of the countries, so permitting a more realistic analysis.
Crop replacement provided the opportunity to create value, as seen from the fact that managerial flexibility allowed an additional R$ 1,661 per hectare, when soya replaced sugarcane from year 2, resulting in a value of R$ 124,575 for a 75 ha farm. Additionally, the obtained results extend the studies of Farinelli et al. (2018), by including an analysis of the investment required when growing Peanuts and Corn.
Furthermore, in the current study, as in the work carried out by Farinelli et al. (2018), sugarcane on a 75-hectare farm has negative PV/ha. In contrast, crop diversification generates a positive PV of R$ 1,823. This further emphasizes the importance of crop diversification for creating higher value, while lowering financial costs, as a result of capacity for reducing risks.
Other studies have shown that applying TOR when choosing or analyzing new crops options in place of traditional ones, makes it possible to improve Present Cash Flow Value, as shown by Musshoff (2012) and Farinelli et al. (2018). In addition, there are benefits related to increased productivity and the possibility of managing production price and risk (Mango et al., 2018). The consequent expansion of economic gain, and risk reduction, confirms that diversification can contribute to the expansion of sustainability of such systems.
Accordingly, the current study has extended the results obtained by Farinelli et al. (2018), introducing Peanuts and Corn crops into diversification modeling and the use of summer corn in rotation with annual crops. The result is important, since it allows for the paradigmatic agricultural practices to be altered radically, thus assisting rural producers who are limited to the cultivation of Sugar Cane and the use of succession, only in the regenerating areas of sugarcane fields, with rotation cultures in the same places.
Conclusion
Results obtained from this study indicate that crop diversification and rotation can add value to a farm, which occurs when the return obtained from the diversified portfolio is greater than the risk and the return required for the asset portfolio. Under such circumstances, return on the diversified portfolio exceeds the individual return on the crops, and the risk of the portfolio according to the proposed proportions, is lower than their individual risk.
In addition, modeling managerial flexibility of the sugarcane cycle reveals that exchange of sugarcane for soya can occur in the second year, which goes against what has been common practice in the region, but can be a beneficial alternative for rural producers.
The obtained results can be used to guide producers and entrepreneurs toward new production systems that will be more efficient, sustainable and economically viable than the long-established monoculture paradigm of Sugar Cane production, so resulting in beneficial system change. Additionally, this study made it possible to fill the existing gap in the analysis of agricultural investments using the Real Options Theory, in which the results were obtained considering the possibility of managerial flexibility in changing its portfolio over time and expanding the potential for value creation by adding corn, safrinha corn and peanuts to analysis.
Among the limitations of the current study are: (i) the structure proposed in this work considers an average farm, while results can be different from properties with different characteristics; accordingly, the expectation is that each farm will builds its own model; (ii) portfolio definitions have to respect the agronomic characteristics of the farm in relation to the soil; (iii) the price and production contracts operated under the spot system; thus, there are agricultural partnership contracts and these must be respected; (iv) financing possibilities were not considered for calculating the discount rate, as only the equity cost was used.
Accordingly, suggestions for future work include studies that: (i) evaluate the economic potential of diversification considering properties of different sizes; (ii) evaluate managerial flexibility in diversified systems that integrate crop-livestock-forest; (iii) extend diversification analysis to large scale fruit production systems (orange, lemon, banana, mango, among others); (iv) find new potential management practices and public policies for the ongoing evolution of the sector.
However, due to the sector's social and economic importance, public policies need to be able to leverage process by small farmers, since expanding crop portfolio requires technical, operational and financial factors, as it affects production planning and requires more investments in fixed and specific work. The development of small farmers can contribute both government and society by expanding its capacity to produce food in sustainable manner and help the world to achieve the goals to food and hunger insecurity.
Data availability statement
The data analyzed in this study is subject to the following licenses/restrictions: Private datasets. Requests to access these datasets should be directed to DS, david.lopes@unesp.br.
Author contributions
All authors listed have made a substantial, direct, and intellectual contribution to the work and approved it for publication.
Funding
This work was supported by FAPESP—São Paulo Research Foundation (Grant No. 2018/12175-3).
Conflict of interest
The authors declare that the research was conducted in the absence of any commercial or financial relationships that could be construed as a potential conflict of interest.
Publisher's note
All claims expressed in this article are solely those of the authors and do not necessarily represent those of their affiliated organizations, or those of the publisher, the editors and the reviewers. Any product that may be evaluated in this article, or claim that may be made by its manufacturer, is not guaranteed or endorsed by the publisher.
References
Adjimoti, G. O., Kwadzo, G. T. M., Sarpong, D. B., and Onumah, E. E. (2017). Input policies and crop diversification: evidence from the collines region in Benin. Afr. Dev. Rev. 29, 512–523. doi: 10.1111/1467-8268.12286
Asante, B. O., Villano, R. A., Patrick, I. W., and Battese, G. E. (2017). Determinants of farm diversification in integrated crop-livestock farming systems in Ghana. Renew. Agric. Food Syst. 33, 131–149. doi: 10.1017/S1742170516000545
Bonacim, C. A. G., Nardi, P. C. C., Silva, R. L. da, Cruz Junior, R., and Bonizio, R. C. (2013). Investment projects in agribusiness: cost-volume-profit analysis considering uncertainty and risk. CEP 9, 27–48.
Boncinelli, F., Bartolini, F., and Casini, L. (2018). Structural factors of labour allocation for farm diversification activities. Land Use Policy 71, 204–212. doi: 10.1016/j.landusepol.2017.11.058
Cavalli, S. B., Soares, P., Martinelli, S. S., and Schneider, S. (2020). Family farming in times of COVID-19. Rev Nutr. 33, e200180. doi: 10.1590/1678-9865202033e200180
Corcioli, G., Medina, G. da S., and Arrais, C. A. (2022). Missing the target: Brazil's agricultural policy indirectly subsidizes foreign investments to the detriment of smallholder farmers and local agribusiness. Front. Sustain. Food Syst. 5, 796845. doi: 10.3389/fsufs.2021.796845
Cox, J. C., Ross, S. A., and Rubinstein, M. (1979). Option pricing: A simplified approach. J Finance Econ. 7, 229–263. doi: 10.1016/0304-405X(79)90015-1
de Roest, K., Ferrari, P., and Knickel, K. (2018). Specialisation and economies of scale or diversification and economies of scope? Assessing different agricultural development pathways. J. Rural Stud. 59, 222–231. doi: 10.1016/j.jrurstud.2017.04.013
Douyon, A., Worou, O. N., Diama, A., Badolo, F., Denou, R. K., Touré, S., et al. (2022). Impact of crop diversification on household food and nutrition security in southern and central mali. Front. Sustain. Food Syst. 5, 1–11. doi: 10.3389/fsufs.2021.751349
Faleiros, G. D., Santos, D. F. L., and Corá, J. E. (2018). Analysis of profitability of conservation tillage for a soybean monoculture associated with corn as an off season crop. Cogent Food Agric, 1–20. doi: 10.1080/23311932.2018.1429699
FAO. (2018). The State of Food Security and Nutrition in the World 2018. Rome: FAO. Available online at: www.fao.org/publications
Farinelli, J. B. de M., Santos, D. F. L., Fernandes, C., Fernandes, M. M. H., and Silva, M. F. da (2018). Crop diversification strategy to improve economic value in Brazilian sugarcane production. Agron J 110, 1–10. doi: 10.2134/agronj2017.10.0578
Ferreira, M. D. P., and Féres, J. G. (2020). Farm size and land use efficiency in the Brazilian Amazon. Land Use Policy 99, 1–10. doi: 10.1016/j.landusepol.2020.104901
Guo, K., Zhang, L., and Wang, T. (2019). Optimal scheme in energy performance contracting under uncertainty: a real option perspective. J Clean Prod 231, 240–253. doi: 10.1016/j.jclepro.2019.05.218
Hair, J., Black, W., Babin, B. J., and Anderson, R. R. (2009). Multivariate Data Analysis. New York, NY: Prentice Hall.
IBGE—Brazilian Institute of Geography Statistics (2019). Agricultural Census: Definitive Results 2017. IBGE, Rio de Janeiro. Available online at: https://www.ibge.gov.br/estatisticas/economicas/agricultura-e-pecuaria/21814-2017-censo-agropecuario.html?=&t=resultados (Accessed August 6, 2020).
Knoke, T., Paul, C., Härtl, F., Castro, L. M., Calvas, B., and Hildebrandt, P. (2015). Optimizing agricultural land-use portfolios with scarce data—a non-stochastic model. Ecol. Econ. 120, 250–259. doi: 10.1016/j.ecolecon.2015.10.021
Lee, H., Bogner, C., Lee, S., and Koellner, T. (2016). Crop selection under price and yield fluctuation: analysis of agro-economic time series from South Korea. Agric. Syst. 148, 1–11. doi: 10.1016/j.agsy.2016.06.003
Maia, A. G., dos Santos Eusébio, G., and da Silveira, R. L. F. (2019). Can credit help small family farming? Evidence from Brazil. Agric. Financ. Rev. 80, 212–230. doi: 10.1108/AFR-10-2018-0087
Mango, N., Makate, C., Mapemba, L., and Sopo, M. (2018). The role of crop diversification in improving household food security in central Malawi. Agric. Food Secur. 7, 1–10. doi: 10.1186/s40066-018-0160-x
McCord, P. F., Cox, M., Schmitt-Harsh, M., and Evans, T. (2015). Crop diversification as a smallholder livelihood strategy within semi-arid agricultural systems near Mount Kenya. Land Use Policy 42, 738–750. doi: 10.1016/j.landusepol.2014.10.012
Mukherjee, S. (2021). Agri-environmental sustainability of indian agriculture: A state level analysis. Int. J. Rural Manag. 18, 1–22. doi: 10.1177/09730052211007606
Musshoff, O. (2012). Growing short rotation coppice on agricultural land in Germany: A real options approach. Biomass Bioenergy. 41, 73–85. doi: 10.1016/j.biombioe.2012.02.001
Oliveira, A. (2020). Uncertainty and flexibility in infrastructure investments: application of real options analysis to the Ponta Delgada airport expansion. Res. Transp. Econ. 90, 1–10. doi: 10.1016/j.retrec.2020.100845
Oliveira, A. F., Pereira, C. N., and Vieira, P. A. (2012). Análise da Rotação de Grãos na Área de Reforma de Canavial. Natal: 50° Congresso da SOBER, p. 1–13.
Panichvejsunti, T., Kuwornu, J. K. M., Shivakoti, G. P., Grünbühel, C., and Soni, P. (2018). Smallholder farmers' crop combinations under different land tenure systems in Thailand: the role of flood and government policy. Land Use Policy 72, 129–137. doi: 10.1016/j.landusepol.2017.12.046
Piedra-Bonilla, E. B., da Cunha, D. A., and Braga, M. J. (2020). Climate variability and crop diversification in Brazil: An ordered probit analysis. J. Clean. Prod. 256, 1–10. doi: 10.1016/j.jclepro.2020.120252
Pivoriene, A. (2017). Real options and discounted cash flow analysis to assess strategic investment projects. Econ. Bus. 30, 91–101. doi: 10.1515/eb-2017-0008
Ponce, C. (2020). Intra-seasonal climate variability and crop diversification strategies in the Peruvian Andes: a word of caution on the sustainability of adaptation to climate change. World Dev 127, 1–23. doi: 10.1016/j.worlddev.2019.104740
Qureshi, M. R. N., Singh, R. K., and Hasan, M. A. (2018). Decision support model to select crop pattern for sustainable agricultural practices using fuzzy MCDM. Environ. Dev. Sustain. 20, 641–659. doi: 10.1007/s10668-016-9903-7
Regan, C. M., Bryan, B. A., Connor, J. D., Meyer, W. S., Ostendorf, B., Zhu, Z., et al. (2015). Real options analysis for land use management: methods, application, and implications for policy. J. Environ. Manag. 161, 144–152. doi: 10.1016/j.jenvman.2015.07.004
Rodriguez, C., Dimitrova Mårtensson, L. M., Zachrison, M., and Carlsson, G. (2021). Sustainability of diversified organic cropping systems—challenges identified by farmer interviews and multi-criteria assessments. Front. Agron. 3, 698968. doi: 10.3389/fagro.2021.698968
Rosenberg, S., Crump, A., Brim-DeForest, W., Linquist, B., Espino, L., Al-Khatib, K., et al. (2022). Crop rotations in California rice systems: assessment of barriers and opportunities. Front. Agron. 4, 1–17. doi: 10.3389/fagro.2022.806572
Santos, D. F. L., and Jurca, F. L. (2013). Análise de investimento em confinamento bovino no centro-oeste brasileiro: um estudo de caso. Custos E Agronegocio On Line 9, 129–161.
Santos, D. F. L., Mendes, C. C., Farinelli, J. B. de M., and Farinelli, R. (2016). Viabilidade econômica e financeira na produção de cana-de-açúcar em pequenas propriedades rurais. Custos e Agronegocio 12, 222–254.
Keywords: agribusiness, investment analysis, portfolio, Real Options Theory, rotational cultivation
Citation: Santos DFL and Gomes SM (2022) Diversification of crops: Assessment of managerial flexibility and economic impact on sugarcane medium-sized farms. Front. Sustain. Food Syst. 6:987214. doi: 10.3389/fsufs.2022.987214
Received: 26 August 2022; Accepted: 04 November 2022;
Published: 21 November 2022.
Edited by:
Ademola Braimoh, World Bank Group, United StatesReviewed by:
Zipora Otieno, Food and Agriculture Organization of the United Nations, ZimbabweGiacomo Branca, University of Tuscia, Italy
Copyright © 2022 Santos and Gomes. This is an open-access article distributed under the terms of the Creative Commons Attribution License (CC BY). The use, distribution or reproduction in other forums is permitted, provided the original author(s) and the copyright owner(s) are credited and that the original publication in this journal is cited, in accordance with accepted academic practice. No use, distribution or reproduction is permitted which does not comply with these terms.
*Correspondence: David Ferreira Lopes Santos, david.lopes@unesp.br