 Carolina Carvalho Brcko1
 Jamile Andréa Rodrigues da Silva2
 Lucieta Guerreiro Martorano3Reíssa Alves Vilela1Benjamim de Souza Nahúm3
 André Guimarães Maciele Silva1Antônio Vinícius Corrêa Barbosa2
 Andréia Santana Bezerra1*José de Brito Lourenço Júnior1
- 1Institute of Veterinary Medicine, Federal University of Pará, Castanhal, Brazil
- 2Institute of Animal Health and Production, Federal Rural University of the Amazon, Belém, Brazil
- 3Embrapa Eastern Amazon, Belém, Brazil
This study employed infrared thermography to assess the thermoregulatory responses of female buffaloes reared in a hot and humid climate as a function of variations in time and the thermal environment, and to correlate rectal temperature with that of different body areas. The trial was carried out at Embrapa Eastern Amazon (01°26'S and 48°24'W) in Belém, PA, Brazil. Twenty-four female buffaloes fed exclusively on pasture and exposed to the sun throughout the day in an open area were used. The animals were taken back to the corral at 6 A.M., 9 A.M., 12 P.M., 3 P.M., 6 P.M., and 9 P.M. for measurements of rectal temperature (RT), respiratory rate (RR), and body surface temperature (BST) using infrared thermography (IRT). Data on air temperature (AT), relative air humidity (RH), wind velocity (WV), and solar radiation (SR) were also recorded. A quadratic effect of AT, RH, SR, RR, and RT (P < 0.01) was found as a function of measurement time. Between 12 P.M. and 3 P.M., AT, SR, RR, and RT values were the highest, while RH values were the lowest (P < 0.05). WV was the highest between 12 P.M. and 9 P.M. A difference was found in RR and RT among the day's times, with the highest values at 12 P.M. and 3 P.M. (P <0.05). The IRTs have a quadratic effect as a function of day's times, with the highest levels between 12 P.M. and 6 P.M. and a reduction at 9 P.M. All IRTs are correlated with the physiological variables RR and RT, except for the IRT of the side of the back, which is not correlated with RT. The IRTs of the eye and cheek are correlated with RT (P < 0.01) and with RR (P < 0.05). IRT was efficient in evaluating the thermal stress of female buffaloes in hot and humid climates, and the technique can be used to evaluate the body temperature of these animals, since the RT was positively correlated with the temperature of the eye and cheek.
Introduction
Buffaloes (Bubalus bubalis) were introduced in Brazil in 1895, in the Island of Marajó, PA (1), and the current herd is estimated at 1.4 million heads. The country's North region accounts for most of that with 922,600 heads, or 66.4% of the national herd, followed by the Southeast and Northeast regions, with 188,100 and 125,300 thousand heads, respectively. Currently, buffalo farming in this region provides meat, milk, leather, and horns and is concentrated mainly on small farms (2).
Buffaloes are known for their rusticity in adverse environments and represent an option to make use of areas in a ranch to which bovines do not adapt (3). However, the difficulty these animals have in releasing body heat under high temperature and humidity may negatively impact their productive and reproductive performances (4). Buffaloes in hot conditions have increased blood flow on their skin surfaces so as to raise its temperature and facilitate heat loss through conduction when the animals are immersed in mud or water (5).
The use of infrared thermography (IRT) poses an alternative to assess the body surface temperature (BST) since it enables obtaining the heat irradiating in the infrared spectrum without interfering on animals' behavior (6). This technique is innovative as it can be used with no direct interaction with the animal, thus being considered a non-invasive tool.
In face of that, the present research aimed to assess the thermoregulatory responses of female buffaloes reared in the hot and humid climate of the Eastern Amazon as a function of variations in time and thermal environment, besides employing thermography to map the BST of buffaloes in order to find the area that is most associated with rectal temperature (RT), hence contributing to animal biometeorology studies.
Materials and Methods
The experiment was approved by the Ethics Committee on Experimental Animal Research of the Federal University of Pará under the protocol BIO 120-13. The experimental sample consisted of 24 non-pregnant, non-lactating, clinically healthy female crossbred Murrah/Mediterranean buffaloes (Bubalus bubalis bubalis) whose initial mean age and weight were 54 ± 7 months and 503.1 ± 23 kg, respectively. The animals were selected according to their body score aiming at greater uniformity and were kept in 1-ha pens with Brachiaria brizantha (cv. Marandu) grass in a rotational system with no access to shade or ponds and with drinking water and mineral salt ad libitum.
The trial lasted for six consecutive days. The buffaloes were weighed before and after the trial. Such information was used to calculate heat storage and later to calculate the accumulated heat following the recommendations by McGovern and Bruce (7).
Heat storage calculation, in kelvin kg−1 h−1:
ΔRT—difference in RT;
Harm–stored heat (W.m−2);
A—animal's surface (m2) calculated by the equation: A=0.13.;
Mv–body mass (kg);
Hb–animal's specific heat (3,400 kJ kg−1 K−1).
About 30 min prior to collections, animals were taken to the corral about 300 m away from the pen, where they were contained at 6 A.M., 9 A.M., 12 P.M., 3 P.M., 6 P.M., and 9 P.M. for the measurement of the physiological variables of RT, respiratory rate (RR), and BST measured through IRT, with ± 1°C accuracy and a spectral range of 7.5–13.0 μm.
A clinical veterinary thermometer graded in Celsius, with decimal accuracy, was inserted 5 cm into animals' rectum for 1 min to measure the RT. RR was obtained through inspection and by counting the thoracic-abdominal movements for 1 min with the aid of a stopwatch. The animals randomly entered the holding pens.
The IRTs were obtained using a FLIR T E30 thermographic camera with automatic calibration. The measurements were determined by the average readings of two areas delimited in the image by markers. All images were acquired from the animals' right side so as to reflect the actual IRT fluctuation, thus preventing digestive processes in the rumen from impacting the increase in BST. Each thermogram was saved to a memory card and later analyzed in the software FLIR Tools, where the mean temperatures of each region were obtained considering emissivity of 0.98. Images were taken from five areas, namely, side of the back, tail insertion, eye, cheek, and hind ergot (Figure 1). Approximately 2,592 thermographic images were acquired during collection days. The ones that lacked the clarity required for the analysis in the software were excluded.
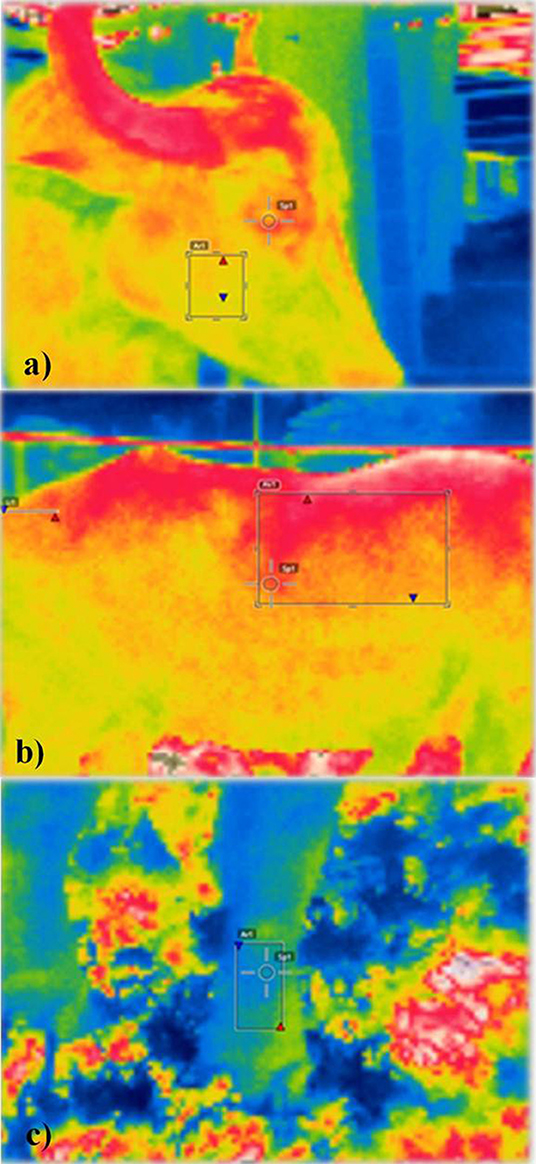
Figure 1. (a) Cheek, eye, (b) side of the back, tail insertion point, and (c) ergot of female buffaloes reared in the Eastern Amazon.
The distance used to take the photographs (distance between the camera and the evaluated area) was 30 cm for eye, cheek, and hind ergot and 1 m for side of the back and tail insertion.
The meteorological data of air temperature (AT,°C) and relative air humidity (RH, %) were recorded using a U12-012 HOBO® data logger (Onset, Brazil) installed at the experimental site. A TAD-800 portable digital thermo-anemometer (Instrutherm, São Paulo, Brazil) was used to measure wind velocity (WV, m/s). Solar radiation (SR, MJ.m−2) was obtained from INMET's (National Institute of Meteorology) station 3.5 km away from the experimental site. The environmental variables were read along the day at the same time as the physiological variables.
The statistical analysis of data was performed in the software Statistical Analysis System (SAS 9.1). The physiological responses (RT, RR, BST, and IRT) and climate variables (AT, RH, WV, and SR) were analyzed using general linear models (GLMs) with two statistical models. In the first one, for physiological variables, repeated measures are made on the same experimental unit (animal) over a period of time. The model is represented by: Yijk = μ + ai + bicp + eijk, yijk = μ + αi + bi(j) + eijk in which Yijk refers to the value of the ith animal obtained at the jth hour of the kth day; μμ is the overall mean; ai is the fixed effect of the jth hour of the day; bicp is the random effect of the ith animal belonging to the jth hour of the day; and eijk refers to the residual including the random error. The second statistical model, for climate variables, is: Yjk = μ + aj + ejk, in which Yjk refers to the value obtained at the jth hour of the kth day; μ is the overall mean; aj is the fixed effect of the jth hour of the day; and ejk refers to the residual including the random error.
To determine the linear relationship between BST [eye temperature (°C), cheek temperature (°C), side-of-back temperature (°C), tail temperature (°C), and ergot temperature (°C)] and RR and RT, Pearson correlation was calculated by the procedure PROC CORR in SAS. To perform regression in SAS between RR and time of the day and RT and time of the day, the procedure PROC REG (means adjusted by least square) was employed by a quadratic polynomial model: Y = β0 + β1X + β2X2, in which Y is the physiological variable [eye temperature (°C), cheek temperature (°C), side-of-back temperature (°C), tail temperature (°C), ergot temperature (°C), RR (mov/min), and RT (°C)] and X is the time of the day (6 A.M., 9 A.M., 12 P.M., 3 P.M., and 9 P.M.).
Results
An interaction can be seen among the meteorological variables and the day's times. The mean, maximum, and minimum values, the number of observations (N), standard deviation (SD), and coefficient of variation (CV) of climate variables and RR and RT of female buffaloes are presented in Table 1.
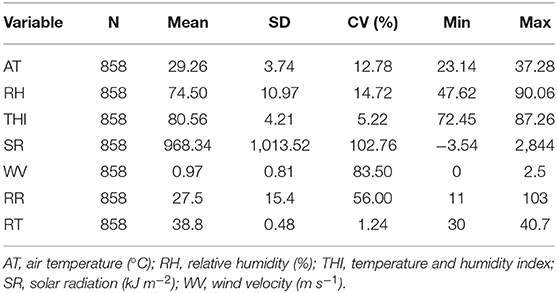
Table 1. Number of observations (N), mean, standard deviation (SD), coefficient of variation (CV), minimum (Min), and maximum (Max) values of agrometeorological variables and RR and RT of female buffaloes during the experimental period in the Eastern Amazon.
The regression analysis associated with AT as a function of measurement time showed a quadratic model (P < 0.01). By deriving the equation, the highest AT value of 32.9°C was found at 1:42 P.M. It was observed that RH's effect is the opposite of AT's, with the lowest value of 64% at 1:27 P.M. (P < 0.05).
A quadratic effect was found as a function of assessment times in the regression associated with SR (P < 0.01). The maximum radiation value, by deriving the equation, was 1,639 MJ m−2 at 1:35 P.M.
The regression analysis regarding RR showed a quadratic effect (P < 0.01) as a function of the time of day (Figure 2). By deriving the equation, the time of 1:28 P.M. was found for maximum RR, which would reach 36.08 mov min−1. A gradual increase in RR was observed up until 1 P.M., starting at 18.69 mov min−1 at 6 A.M., climbing to 27.08 mov min−1 at 9 A.M., and reaching mean values of 41.04 mov min−1 at 12 P.M.
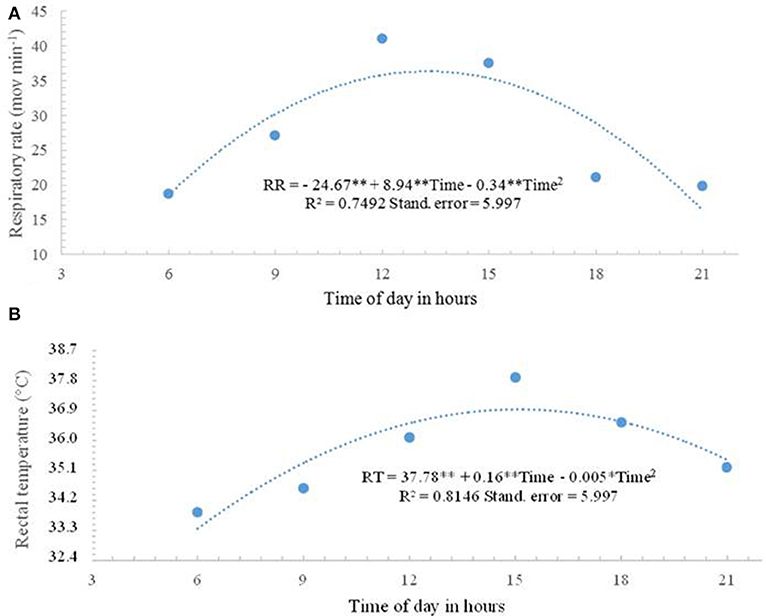
Figure 2. (A) Respiratory rate (RR) and (B) rectal temperature (RT) of female buffaloes observed at 6 A.M., 9 A.M., 12 P.M., 3 P.M., 6 P.M., and 9 P.M. during the experimental period in the Eastern Amazon. *p < 0.05 **p < 0.01.
A significant difference (P < 0.05) was found in RT along the day, with the highest value (39.01°C) at 3 P.M. The regression coefficient analysis associated with RT differed (P < 0.01) among the assessment times following a quadratic model, as seen in Figure 3. By deriving the equation, the time of 3:05 P.M. was obtained for maximum RT, which would reach 38.63°C. The thermal balance dynamics of female buffaloes observed at 6 A.M., 9 A.M., 12 P.M., 3 P.M., 6 P.M., and 9 P.M. during the experimental period in the Eastern Amazon is presented in Figure 4.
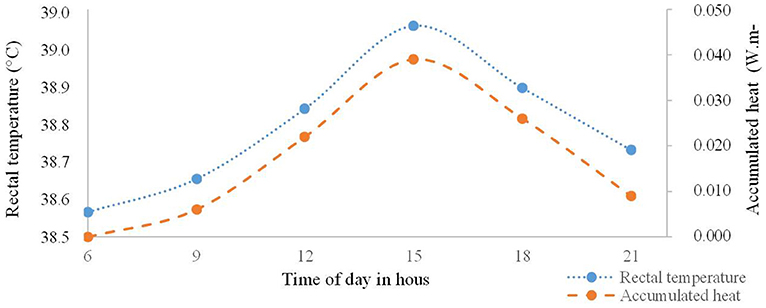
Figure 3. Thermal balance dynamics of female buffaloes observed at 6 A.M., 9 A.M., 12 P.M., 3 P.M., 6 P.M., and 9 P.M. during the experimental period in the Eastern Amazon.
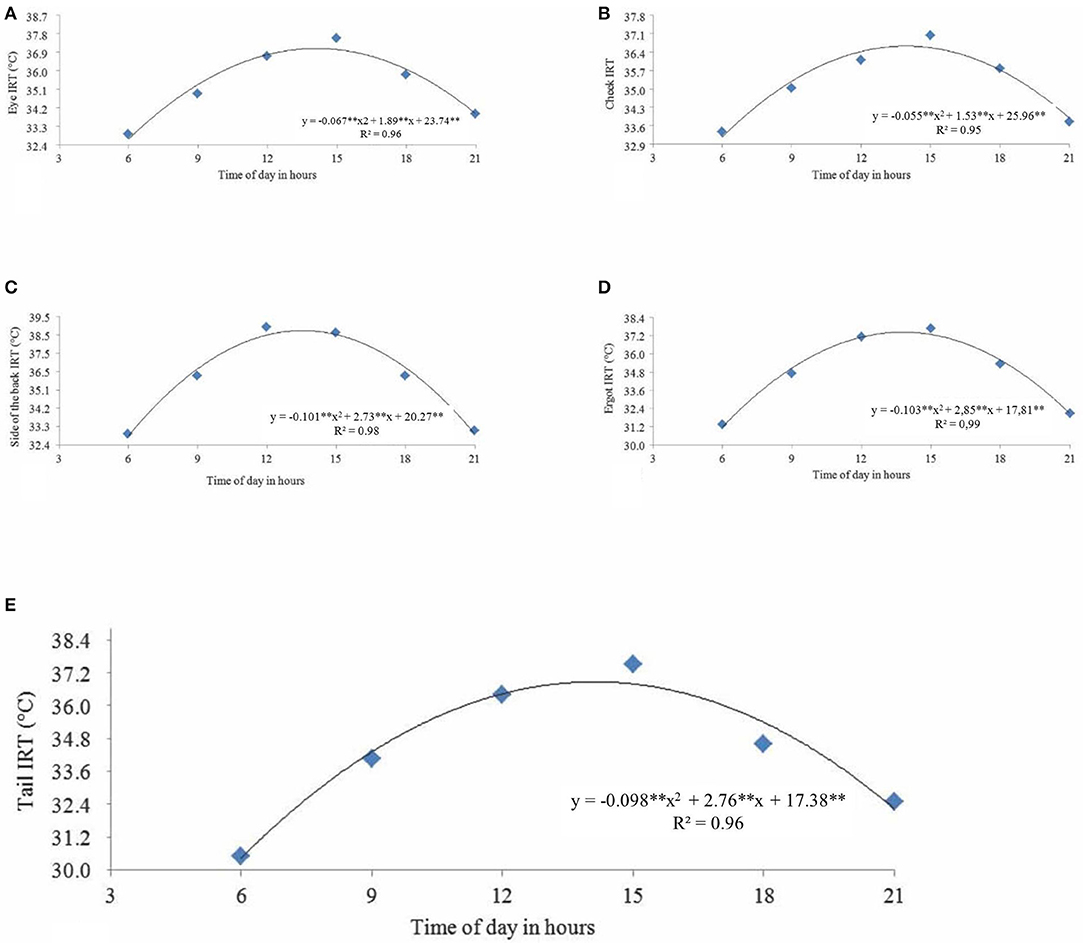
Figure 4. (A) Eye, (B) cheek, (C) side of the back, (D) ergot, and (E) tail infrared thermography (IRT) of female buffaloes observed at 6 A.M., 9 A.M., 12 P.M., 3 P.M., 6 P.M., and 9 P.M. during the experimental period in the Eastern Amazon. **p < 0.01.
The regression analysis of IRTs showed a quadratic effect as a function of the times of the day. By deriving the equations, the following times would yield maximum IRT results for different parts of the body: 1:50 P.M. for the eye at 36.49°C (Figure 4A); 1:51 P.M. for the cheek at 36.6°C (Figure 4B); 1:51 P.M. for the back at 38.71°C (Figure 4C); 2:23 P.M. for the ergot at 37.01°C (Figure 4D); and 1:54 P.M. for the tail at 33.81°C (Figure 4E).
The correlation among IRTs and physiological variables is in Table 2. All IRTs are correlated with the RR and RT, except the IRT of the side of the back, which is not correlated with RT, although it is correlated (P < 0.01) with RR. The IRTs of the eye and cheek are correlated with RT (P < 0.01) and RR (P < 0.05). Likewise, the IRTs of the tail and ergot are correlated (P < 0.05) with RR and RT.
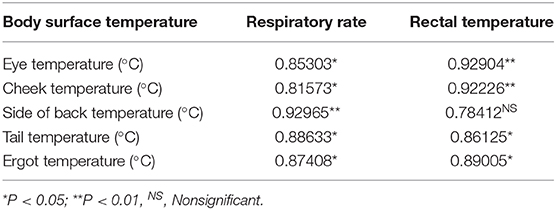
Table 2. Correlations among body surface temperatures assessed by infrared thermography and physiological variables of respiratory rate and rectal temperature of female buffaloes reared in a hot and humid climate.
Discussion
The highest AT value of 32.9°C was found at 1:42 P.M., which shows that the hotter climate at that time could be detrimental to the animals' thermal comfort. Under high AT and RH, animals dissipate heat and their physiological variable values change (8). It was observed that RH's effect is the opposite of AT's, with the lowest value of 64% at 1:27 P.M. (P < 0.05). Similar AT and RH values were reported by Silva et al. (9).
SR directly impacts the animals reared in a traditional system with no access to shade. Buffaloes are particularly susceptible to direct SR since they absorb a lot of heat because of their dark skin and sparse fur (10). The direct incidence of radiation onto the animals contributes to the increase in BST and further raises AT. Studies conducted in the Amazon region confirm that this environment is conducive to causing thermal stress in buffaloes, especially in the afternoon, and that the use of shading, as in a silvipastoral system, would facilitate body heat dissipation (11, 12).
The maximum radiation value by deriving the equation was 1,639 MJ m−2 at 1:35 P.M. Along the day, some moments are more or less favorable to animals' thermal comfort, and this process is mediated by the radiation balance, i.e., the difference between the radiation received and given back, which greatly varies along the day and the year and promotes daily and annual changes in AT (13).
The higher AT leads to a reduction in the thermal gradient between the animal and the environment, which hinders the sensible dissipation of accumulated metabolic heat (14). In this scenario, evaporative thermolysis becomes an important pathway to maintain this thermal balance. RR is an important indicator of animal thermal stress in hot environments because, in this situation, the animal's respiratory frequency increases to eliminate body heat through evaporative heat loss (15).
By deriving the equation, the time of 1:28 P.M. was found for maximum RR, which would reach 36.08 mov min−1. The higher RR values between 12 P.M. and 3 P.M. are associated with the increase in AT and SR. RR is relevant in the dissipation of endogenous heat in buffaloes.
According to Alam et al. (16), the thermal stimulation of peripheral thermoreceptors sets off evaporative thermolysis through polypnea. According to that reasoning, the animals accumulated heat along the day from SR, which led to higher RT despite them losing heat through the convection and latent pathways. After RT decreased, thermal balance was reestablished because the animals more effectively used sensible and latent thermolysis.
In the present research, a gradual increase in RR was observed up until 1 P.M., starting at 18.69 mov min−1 at 6 A.M., climbing to 27.08 mov min−1 at 9 A.M., and reaching mean values of 41.04 mov min−1 at 12 P.M. Similar values were reported by Silva et al. (17). The highest value of RT (39.01°C) was observed at 3 P.M. By deriving the equation, the time of 3:05 P.M. was obtained for maximum RT, which would reach 38.63°C.
It is seen that, even when AT was milder, RT values were beyond the normal range for buffaloes, i.e., 37.4 to 37.9°C (18). Since they have very pigmented skin and low fur density, when buffaloes are exposed to SR, the radiant energy is absorbed and transmitted following a centripetal heat flow (3). At 3 P.M., with SR of 2,443.1 MJ m−2, the animals' RT was very high (39.01°C), which suggests that the heat release mechanisms had become insufficient to maintain homeothermy. Later, as AT decreased, a change in heat flow following a centrifugal path was observed, with greater thermal inertia for heat dissipation. RT decreased between 6 P.M. and 9 P.M. to the point of reestablishing thermal balance.
Along the day, heat gain through radiation influenced the heat accumulated by the animals and, consequently, led to higher RT. The moment RT decreased, animals were able to regain thermal balance.
The following times would yield maximum IRT results for different parts of the body: 1:50 P.M. for the eye at 36.49°C; 1:51 P.M. for the cheek at 36.6°C; 1:51 P.M. for the back at 38.71°C; 2:23 P.M. for the ergot at 37.01°C; and 1:54 P.M. for the tail at 33.81°C. These results demonstrate that the hottest times of the day influence these variables.
The correlation among the IRTs and the physiological variables RR and RT may show the efficacy of these variables in indicating thermal stress. All IRTs are correlated with the RR and RT, except the IRT of the side of the back, which is not correlated with RT, although it is correlated (P < 0.01) with RR. The IRTs of the eye and cheek are correlated with RT (P < 0.01) and RR (P < 0.05). Likewise, the IRTs of the tail and ergot are correlated (P < 0.05) with RR and RT. These results show that the IRTs of the eye and cheek are the most appropriate to assess thermal stress in buffaloes since they have the best correlations with RT, which indicates thermal balance and is used to assess the adversity of the thermal environment (19).
Researches carried out on buffalo bulls (20) and dairy buffalos (21) also concluded that the IRT technique was efficient to identify the thermal stress in these animals raised in tropical climate.
Using the IRT technique, Barros et al. (20) observed, with this tool support, a correlation between the RT and the surface temperature of buffaloes in hot and humid climates. This technique has also supported the determination of semen quality through the correlation of scrotal surface temperature gradient with sperm quality parameters of buffalo bulls (22, 23).
Conclusion
The heat dissipation mechanisms in buffaloes are efficient since, even when submitted to climate conditions that set off thermal stress, the animals were able to regain homeothermy as the environmental variables became milder.
The use of IRT is a good indicator of the BST of buffaloes and its association with thermoregulation. The IRTs of the eye and cheek were the most appropriate to determine thermal stress since they are best correlated with the animals' RT.
Data Availability Statement
All datasets generated for this study are included in the article/supplementary material.
Ethics Statement
The animal study was reviewed and approved by the Ethics Committee on Experimental Animal Research of the Federal University of Pará under the protocol BIO 120-13.
Author Contributions
Experiment design: CB and JS. Experiment perform: CB, JS, LM, and RV. Data curation: CB, JS, and AS. Formal analysis: AS and AVCB. Writing-original draft: CB, JS, ASB, and JL. All authors edited and approved the final manuscript.
Funding
This study was financed in part by the Coordenação de Aperfeiçoamento de Pessoal de Nível Superior (CAPES)—Brasil (Finance Code 001) and Brazilian Agricultural Research Corporation—Embrapa Eastern Amazon. Also, this study received financial support for publication fee from Pró-Reitoria de Pesquisa e Pós-Graduação (PROPESP/UFPA). Finally, we would like to thank the Programa Pró-Amazônia: Biodiversidade e Sustentabilidade (Pró-Amazônia/CAPES).
Conflict of Interest
The authors declare that the research was conducted in the absence of any commercial or financial relationships that could be construed as a potential conflict of interest.
References
1. ABCB. Introdução dos Búfalos no Brasil. Assoc Bras Criadores Búfalos. (2020) Available online at: https://www.bufalo.com.br/home/wp-content/uploads/2016/01/historico_bufalos.pdf (accessed February 29, 2020).
2. IBGE. Pesquisa da Pecuária Municipal. Inst Bras Geogr e Estatística. (2019) Available online at: https://sidra.ibge.gov.br/tabela/3939 (accessed February 29, 2020).
3. Damasceno F, Viana J, Tinoco I, Gomes R, Schiassi L. Adaptação de bubalinos ao ambiente tropical. Rev Eletrônica Nutr. (2010) 7:1370–81.
4. Garcia A. Conforto térmico na reprodução de bubalinos criados em condições tropicais. Rev Bras Reprodução Anim. (2013) 37:121–30.
5. Oliveira J, Rangel A, Barreto M, Lima Júnior D, Urbano A, Aureliano I. Adaptabilidade de fêmeas bubalinas em sala de ordenha sob condições ambientais do agreste do rio grande do Norte, Brasil. Comun Sci. (2014) 5:148–54. doi: 10.14295/cs.v5i2.393
6. Ludwig N, Gargano M, Luzi F, Carenzi C, Verga M. Applicability of infrared thermography as non-invasive measurements of stress in rabbit. World Rabbit Sci. (2007) 15:199–206. doi: 10.4995/wrs.2007.588
7. McGovern R, Bruce J. Model of thermal balance for cattle in hot conditions. J Agric Eng. (2000) 77:81–92. doi: 10.1006/jaer.2000.0560
8. Rocha D, Salles M, Moura A, Araújo A. Índices de tolerância ao calor de vacas leiteiras no período chuvoso e seco no Ceará. Rev Acadêmica Ciência Anim. (2012) 10:335–43. doi: 10.7213/academica.7739
9. Silva J, Araújo A, Lourenço Júnior J, Santos N, Garcia A, Nahúm B. Conforto térmico de búfalas em sistema silvipastoril na Amazônia oriental. Pesqui Agropecuária Bras. (2011) 46:1364–71. doi: 10.1590/S0100-204X2011001000033
10. Marai I, Haeeb A. Buffalo's biological functions as affected by heat stress – a review. Livest Sci. (2010) 127:89–109. doi: 10.1016/j.livsci.2009.08.001
11. Pantoja MH., Silva JAR, Delgado ML, Margarido YMM, Adami COR, Garcia AR, et al. Respostas fisiológicas e adaptabilidade de bubalinos ao clima equatorial amazônico. Rev Acadêmica Ciência Anim. (2018) 16:e16002. doi: 10.7213/academica.16.2018.02
12. Almeida J, Joset W, Noronha R, Barbosa A, Lourenço J, Júnior, Silva J. Behavior of buffalo heifers reared in shaded and unshaded pastures during the dry season on Marajó Island, Pará, Brazil. Acta Sci Anim Sci. (2019) 41:e43088. doi: 10.4025/actascianimsci.v41i1.43088
13. Silva J, Alencar A, Lourenço J, Junior, Viana R, Santos N, Garcia A. Perfil hematológico de búfalas da raça murrah, criadas ao sol e à sombra, em clima tropical da Amazônia Oriental. Acta Amaz. (2011) 41:425–430. doi: 10.1590/S0044-59672011000300014
14. Patel M, Patel J, Rajput M, Bariya A. Adaptive physiological and biochemical responses of dairy animals to heat stress: a review. Int J Appl Nat Sci. (2016) 5:107–16.
15. Gaughan JB, Mader TL. Body temperature and respiratory dynamics in un-shaded beef cattle. Int J Biometeorol. (2014) 58:1443–50. doi: 10.1007/s00484-013-0746-8
16. Alam M, Gregory N, Uddin M, Jabbar M, Silva-Fletcher A, Kempson A, et al. Frequency of heat stress in cattle and water buffalo at livestock markets in Bangladesh. J Commonw Vet Assoc. (2010) 26:13–7.
17. Silva E, Souza B, Silva G, Alcântara M, Cunha M, Marques B. Avaliação da adaptabilidade de caprinos ao semiárido através de parâmetros fisiológicos e estruturas do tegumento. Rev Caatinga. (2010) 22:142–8.
18. Shafie M. Physiology responses adaptation of water buffalo. In: Yousef MK, editor. Stress Physiology in Livestock. Boca Raton, FL: CRC Press (1985). p.260−70.
19. Silanikove N. Effects of heat stress on the welfare of extensively managed domestic ruminants. Livest Prod Sci. (2000) 67:1–18. doi: 10.1016/S0301-6226(00)00162-7
20. Barros D V., Silva LKX, Kahwage PR, Lourenço Júnior JB, Sousa JS, Silva AGM, et al. Assessment of surface temperatures of buffalo bulls (Bubalus bubalis) raised under tropical conditions using infrared thermography. Arq Bras Med Veterinária e Zootec. (2016) 68:422–30. doi: 10.1590/1678-4162-8327
21. Sevegnani KB, Fernandes DPB, Silva SHM. Evaluation of thermorregulatory capacity of dairy buffaloes using infrared thermography. J Brazilian Assoc Agric Eng. (2016) 36:1–12. doi: 10.1590/1809-4430-Eng.Agric.v36n1p1-12/2016
22. Ahirwar MK, Kataktalware MA, Pushpadass HA, Jeyakumar S, Jash S, Nazar S, et al. Scrotal infrared digital thermography predicts effects of thermal stress on buffalo (bubalus bubalis) semen. J Therm Biol. (2018) 78:51–7. doi: 10.1016/j.jtherbio.2018.09.003
Keywords: buffaloes, climate, heat, images, thermoregulation
Citation: Brcko CC, Silva JAR, Martorano LG, Vilela RA, Nahúm BS, Silva AGM, Barbosa AVC, Bezerra AS and Lourenço Júnior JB (2020) Infrared Thermography to Assess Thermoregulatory Reactions of Female Buffaloes in a Humid Tropical Environment. Front. Vet. Sci. 7:180. doi: 10.3389/fvets.2020.00180
Received: 15 January 2020; Accepted: 19 March 2020;
Published: 19 May 2020.
Edited by:
Antonio Minervino, Federal University of Western Pará, BrazilReviewed by:
Rejane Santos Sousa, Federal University of South and Southeast of Pará, BrazilVeerasamy Sejian, Indian Council of Agricultural Research, India
Fabio Luzi, University of Milan, Italy
Copyright © 2020 Brcko, Silva, Martorano, Vilela, Nahúm, Silva, Barbosa, Bezerra and Lourenço Júnior. This is an open-access article distributed under the terms of the Creative Commons Attribution License (CC BY). The use, distribution or reproduction in other forums is permitted, provided the original author(s) and the copyright owner(s) are credited and that the original publication in this journal is cited, in accordance with accepted academic practice. No use, distribution or reproduction is permitted which does not comply with these terms.
*Correspondence: Andréia Santana Bezerra, YW5kcmVpYXpvb3RlY25pc3RhdWZyYUBnbWFpbC5jb20=