 Matthew F. Warren
 Thien C. Vu2
 Ondulla T. Toomer
 Juan David Fernandez
 Kimberly A. Livingston
- 1Prestage Department of Poultry Science, North Carolina State University, Raleigh, NC, United States
- 2United States Department of Agriculture, Agricultural Research Service, Raleigh, NC, United States
- 3Premex, Durham, NC, United States
- 4Elanco Animal Health, Greenfield, IN, United States
Increasing biopotency of cholecalciferol (D3) from vitamin sources is essential in the poultry industry to meet nutritional demands and counter stressors. D3 exhibits hormonal traits and is responsible for calcium (Ca) absorption. 1-α-Hydroxycholecalciferol (1α) is a synthetic form of D3 that has equal efficacy and is cheaper to synthesize than 1,25-dihydroxycholecalciferol (active form of D3), on broilers. However, 1α bypasses a critical regulatory point, the kidney, and may consequently lead to toxicity levels of Ca via Ca absorption. This study examined 1α supplementation in broiler diets with different Ca inclusion levels to determine if 1α at higher Ca levels caused Ca toxicity at starter and grower phases with Ross 708 male broiler chicks. In Experiment 1 (1–15 days of age), chicks were assigned to one of 10 treatment starter diets with five levels of Ca inclusion (0.80, 0.95, 1.10, 1.25, and 1.40%) with or without 1α supplementation (5 μg 1α/kg in feed) and eight replicate cages per treatment. In Experiment 2, chicks were fed common starter diet until 16 days of age, and then they were assigned to one of eight treatment diets with four levels of Ca inclusion (0.54, 0.76, 0.98, or 1.20%) with or without 1α supplementation (5 μg 1α/kg in feed). At the end of both experiments, blood was collected from broilers to determine blood chemistry, including concentrations of vitamin D metabolites. Intestinal tissues were also collected to examine gene expression. In Experiment 1, broilers not fed 1α exhibited a quadratic effect in ionized blood Ca (iCa) as dietary Ca inclusion levels increased; 1α-fed broilers displayed an increase in iCa as Ca inclusion levels increased (p = 0.0002). For Experiment 2, 1α-fed broilers displayed a decrease in 25-hydroxycholecalciferol plasma concentration as dietary Ca inclusion levels increased (p = 0.035); also, increasing Ca inclusion in diets increased expression of duodenal sodium phosphate cotransporter type II b (NPTIIb, p = 0.03). Our findings imply that inclusion of 1α was beneficial because 1α enhanced Ca absorption during the starter phase; however, to avoid potential Ca toxicity or antagonism while using 1α during the grower phase, there should be consideration with reducing dietary Ca levels.
Introduction
Vitamin sources with improved bioefficacy are essential in the poultry industry to accommodate nutritional demands of rapidly growing broilers. D3 is necessary for accommodating fast growth of broilers by increasing absorption of calcium (Ca) and its deposition into the bones (1, 2). The biopotency of a nutrient can be enhanced by utilizing synthetic forms of the nutrient (3), increasing bioavailability to accommodate a greater response if the nutrient's metabolic effect is dose dependent (4), or adding supplemental enzymes to increase efficacy of the nutrient of interest (5). Supplemental enzymes can be costly, and their effectiveness can vary based on nutrient load and feed processing (6). Synthetic forms of a nutrient could have unintended effects and require further testing (7, 8), but they are a viable economical solution for the poultry industry (9).
Previous studies reported inclusion of 1-α-hydroxycholecalciferol (1α), a synthetic analog of vitamin D3, improved Ca absorption in growing broiler chicks over D3 alone and showed 1α having equal efficacy to 1,25-dihydroxycholecalciferol [1,25-(OH)2-D3] (10, 11). 1α is cheaper to synthesize and supply in diets compared to 1,25-(OH)2-D3 (3, 10). 1α's structure is similar to 1,25-(OH)2-D3, but only the 1-alpha carbon is hydroxylated instead of both the 1-alpha and 25-carbon. 1α has greater biopotency over D3 because it is quickly hydroxylated in the liver to its active form, 1,25-(OH)2-D3 (12), and consequently bypasses the hydroxylation step occurring in the kidney. In contrast, D3 requires two hydroxylation steps, first in the liver to form 25-hydroxycholecalciferol (25-OH-D3), which is further hydroxylated in the kidney to 1,25-(OH)2-D3 (Figure 1). However, 1α bypasses the critical regulatory hydroxylation by 1α-hydroxylase in the kidney (10, 13), and 25-OH-D3 levels might significantly increase to result in excessive Ca absorption leading to hypercalcemia (14). Although levels of ionized blood Ca (iCa) toxicity in broilers is not established, Hurwitz et al. (15) fed fast-growing chicks diets ranging from 0.4 to 2.0% Ca with 0.7% P diets and observed a weight loss in the fast-growing chicks.
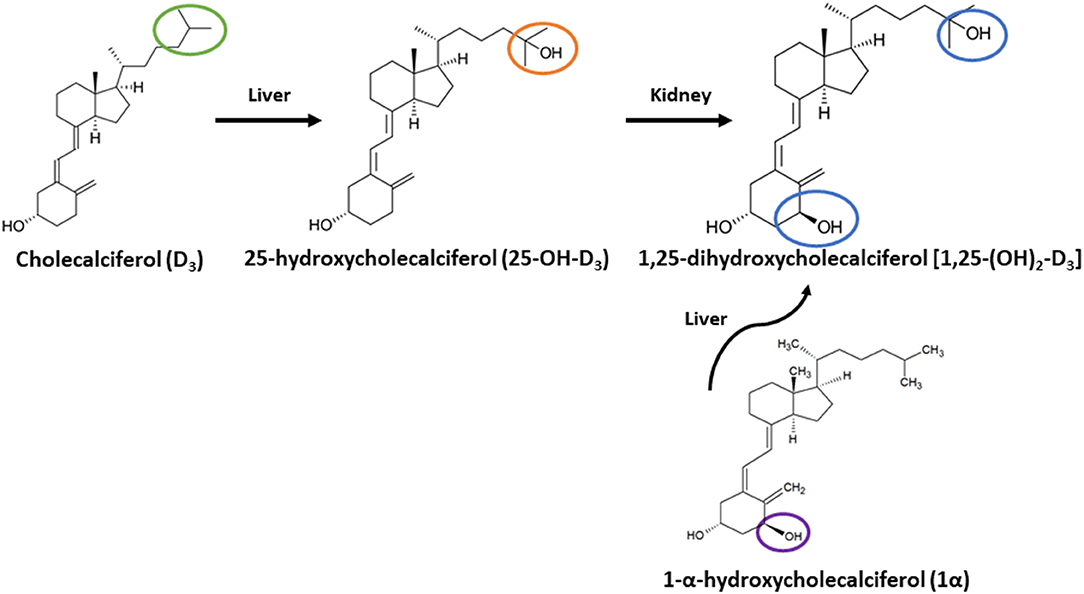
Figure 1. Metabolic pathway of cholecalciferol (vitamin D3) and 1-alpha-hydroxycholecalciferol (1α) to 1,25-dihydroxycholecalciferol (1,25-(OH)2-D3). Vitamin D3 is converted to 25-hydroxycholecalciferol (25-OH-D3) in liver, then 25-OH-D3 is converted to 1,25-(OH)2 D3 in Kidney. 1α travels to liver to be converted to 1,25-(OH)2-D3. Green circle highlights C-25 of D3; orange circle highlights C-25 with hydroxyl group for 25-OH-D3; blue circles denote C-1 and C-25 hydroxyl groups of 1,25-(OH)2-D3; purple circle highlights C-1 hydroxyl group of 1α.
Ca has an important relationship with phosphorus (P), because, together, they comprise a major part of bone structure (16). In the form of limestone or calcium carbonate, Ca is an inexpensive ingredient and is used as a carrier for many other feed ingredients including mineral premixes and drugs (17). Ca's counterpart, P, is one of the more expensive feed ingredients, which limits the amount incorporated into diets. This relationship can result in varying Ca: P ratios from 1:1 to 2.6:1 in weight (2). Studies have reported that increasing dietary Ca levels reduced incidence of tibial dyschondroplasia and therefore improved animal health, welfare, and economic value (2, 18, 19). Also, an elevated dietary Ca: P ratio of 2.6:1 does not appear to negatively affect tibial growth plate morphology at 2 weeks of age (20).
Although studies have been done on 1α and how it influences vitamin D status in broilers (3, 21), no studies to date have examined how 1α affects Ca absorption and vitamin D status when broilers are fed differing levels of dietary Ca. This study explores how 1α impacts vitamin D status in broiler chickens when they are fed diets with different levels of Ca in starter and grower phases.
Materials and Methods
Two experiments were conducted to analyze effects of 1α supplementation and increasing levels of Ca inclusion on blood chemistry of starter and grower phases of broilers. All animal protocols (# 014-113 for Experiment 1 and # 17-125-A for Experiment 2) were approved by the Institutional Animal Care and Use Committee at North Carolina State University.
Experiment 1: 1α Supplementation at Starter Phase
Birds and Housing
Four hundred and eighty 1-day-old Ross 708 chicks were hatched at North Carolina State University's Chicken Education Unit in Raleigh, NC. Chicks were housed in Petersime battery cages with six birds per cage and eight replicate cages per treatment. The experimental design was a completely randomized design with or without 1α supplementation (alpha D3, Premex, Antioquia, Colombia) at 5 μg/kg of feed [1α dose based on Snow et al. (22), because of its effectiveness] and five levels of Ca inclusion which were added on top of basal diet (Table 1) (23). For this study, broilers from dietary treatments with 1α are noted as D3 + 1α; broilers not fed 1α are noted as D3. Ca inclusion levels were 0.80, 0.95, 1.10, 1.25, and 1.40% with 0.50% available P in all diets, and birds were fed ad-libitum. The lighting program was set for 23:1 L: D hours for the first 7 days, and the last 8 days of the experiment was set to 17:7. Room temperature was set to be adjusted daily to ensure thermoneutral temperatures as birds grew. Blood was collected at 15 days from two birds per cage via brachial wing vein. At 17 days, all birds were culled. A total of 16 plasma samples per treatment, D3 and D3 + 1α, from broilers given diets at 0.95% Ca had their plasma sent (no pooling) to Heartland Assays (Ames, IA) for analysis of vitamin D metabolites by LC–MS/MS.
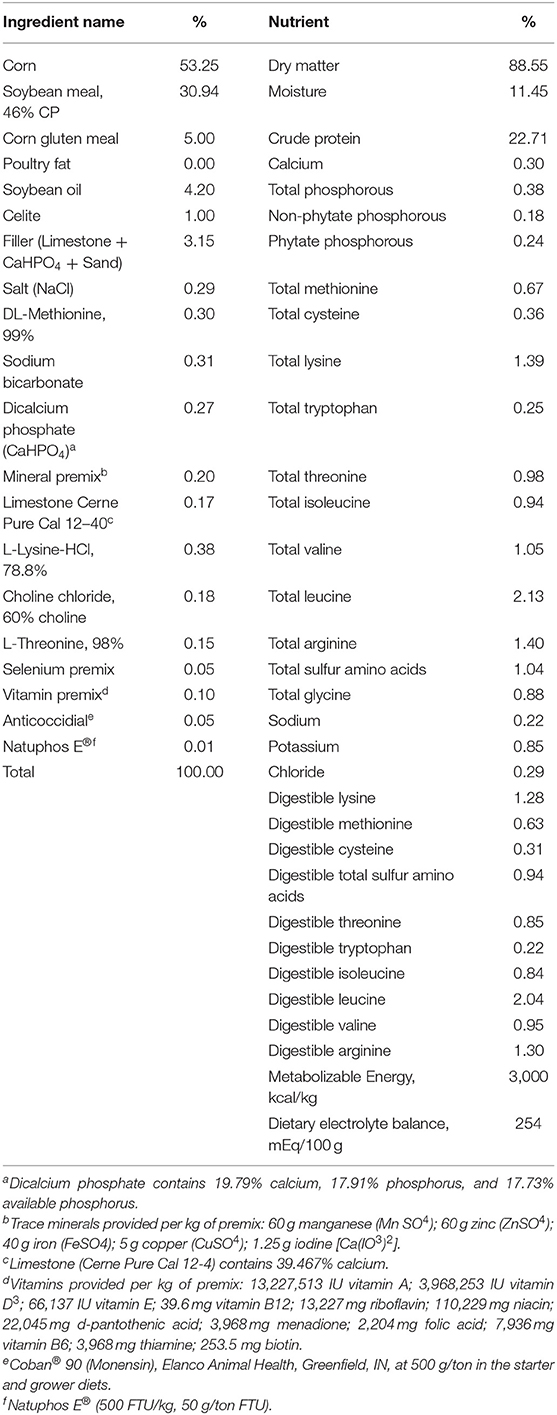
Table 1. Ingredient composition and calculated nutrient content of starter basal diet (1–17 days of age) for Ross-708 broilers [From (23)].
Experiment 2: 1α Supplementation at Grower Phase
Birds and Housing
Nine hundred and sixty Ross 708 chicks were hatched at North Carolina State University's Chicken Education Unit in Raleigh, NC. Chicks were housed in 40 floor pens with 24 birds per pen with five replicates per treatment. All chicks were fed a common starter diet (Tables 2, 3) (23) until 17 days of age. It should be noted that all starter diets for these chicks had 1α supplementation (5 μg/kg of feed). Like Experiment 1, 1α used in this experiment was alpha D3 from Premex (Antioquia, Colombia). Like the prior experiment, broilers from dietary treatments with 1α are noted as D3 + 1α; broilers not fed 1α are noted as D3. At 17 days of age, birds were switched to grower diet and assigned to one of eight treatment groups with four levels of Ca inclusion (added on top of basal diet; 0.54, 0.76, 0.98, or 1.20% of diet) and with or without 1α supplementation (5 μg/kg of feed) with five replicate pens per treatment. All diets contained 0.50% available P. At 35 days of age, blood was collected from two birds per pen and euthanized, and duodenal and jejunal tissues were collected. Duodenal tissue was washed with saline and stored in RNAlater at −20°C. Jejunal tissue was washed with saline and stored in 4% formalin for histology. Plasma from each treatment was pooled using four birds per housing row into one pooled sample, for a total of three pooled reps per treatment and sent to Heartland Assays (Ames, IA) for analysis of vitamin D metabolites.
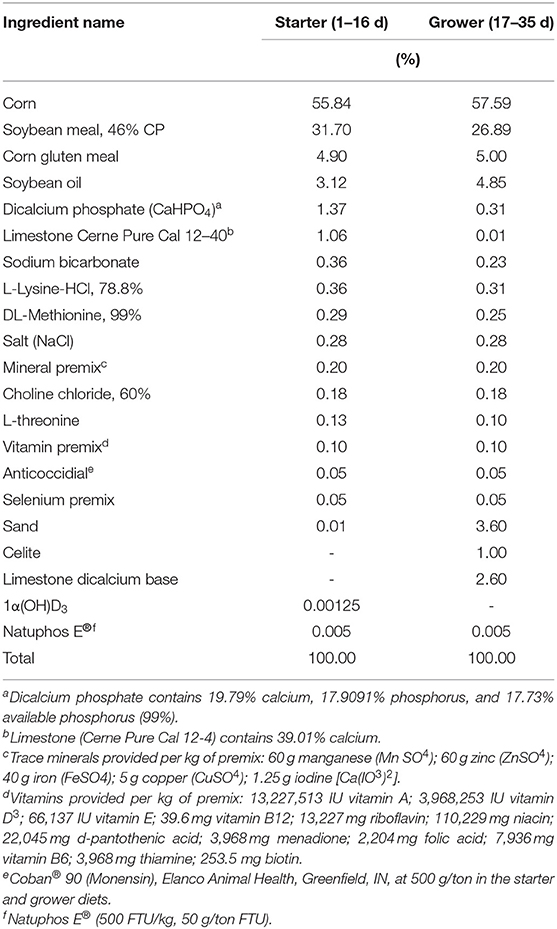
Table 2. Ingredient composition of starter diet and grower basal diets for Ross-708 male broilers [From (23)].
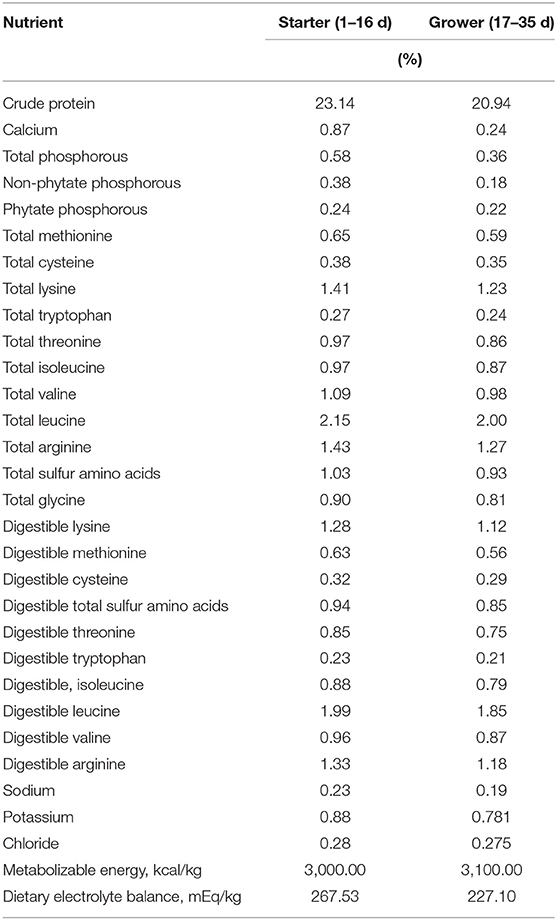
Table 3. Nutritional content of basal starter and grower diets for Ross-708 male broilers [From (23)].
Blood Collection and Blood Chemistry
Blood was collected into BD Vacutainer lithium heparin tubes (Franklin Lakes, NJ) from two birds per cage (Experiment 1) or pen (Experiment 2). Blood chemistry parameters and iCa were determined using an i-STAT™ blood analyzer (Abaxis, Union City, CA) using CG8+ cartridges (Abaxis, Union City, CA), and the remaining blood was spun down, and plasma was collected and stored at −80°C to determine vitamin D metabolite levels. All plasma samples were sent to Heartland Assays (Ames, IA) for measuring D3, 25-OH-D3, and 24,25-dihydroxycholecalciferol [24,25-(OH)2-D3, the inactive form of D3] by LC–MS/MS.
RNA Extraction and qPCR
Total mRNA was extracted from duodenal tissue using Qiagen's RNeasy Mini Kit (Germantown, MD). Extracted RNA was diluted and normalized to ~200 ng/μl and reverse transcribed to complementary DNA (cDNA) using Applied Biosystems' High-Capacity cDNA Reverse Transcription Kit (Thermo Fisher Scientific, Waltham, MA) and protocol to make a 20-μl working solution. Cycling procedure for reverse transcription started with 25°C for 10 min, 37°C for 120 min, and 85°C for 5 min and then held at 5°C indefinitely until storage or use.
Genes expressed for qPCR were vitamin D receptor (VDR) mucin 2 (MUC2), calbindin D28k (CALB), sodium phosphate cotransporter type IIb (NPTIIb), and glyceraldehyde (GAPDH) as a housekeeping gene (Table 4). qPCR was conducted using PowerUP SYBR Master Mix (Life Technologies, Grand Island, NY) using the Applied Biosystems protocol to make a 20-μl working solution and using the Applied Biosystems StepOnePlus Real-Time PCR System (Carlsbad, CA). Cycling procedure started with 95°C for 10 min and then 40 cycles of 95°C for 15 s for denaturing and 15 s at 60°C for annealing. All samples were run in triplicates.
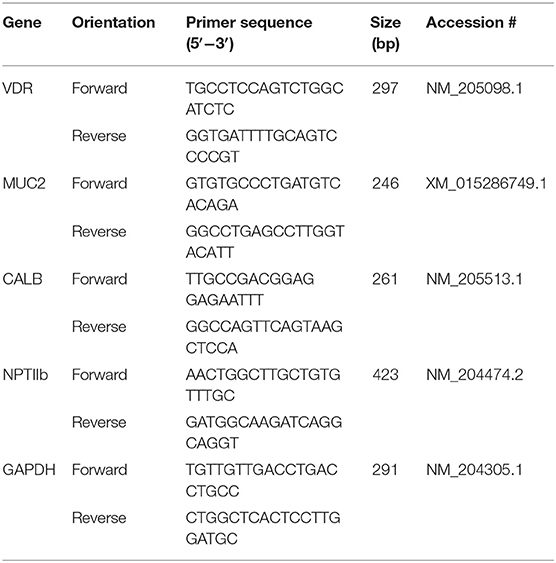
Table 4. Primer sequences for quantitative real-time PCR (qPCR).
Histology
Light microscopy (40 × magnification) was used for morphometric analysis of histological serial sections of jejuna prepared using standard hematoxylin and eosin staining to examine if dietary treatments affected gut morphology. Villus height, crypt depth, and villus width were measured using image analyzer AmScope version 3.7 (Irvine, CA). Ten measurements for villus surface area (μm2) and villus height/crypt depth were made per experimental unit (bird).
Data Analysis
All data are reported as mean ± standard error of the mean. Statistical analyses were conducted using general linear model using the following model:
where Yijk is the individual observation; μ is the experimental mean; Ca is the Ca inclusion effect of the ith level; Vit. D is the effect of 1α supplementation of the jth level; and εijk is the error. βs are the slopes for each predictor. The interaction term of Ca × Vit. D is also included in the model. This model was used to compare differences in blood chemistry concentrations, vitamin D metabolite plasma concentrations, and relative gene expression using SAS 9.4®. The Tukey–Kramer test was used for multiple comparisons for differences between and within treatment groups for blood chemistry, vitamin D metabolites, and mRNA relative expression. All mRNA relative expressions were normalized using 2−ΔΔCT (24) with GAPDH as a housekeeping gene control. Statistical significance was established at p < 0.05, and statistical trends were noted when 0.05 < p ≤ 0.10.
Results
Experiment 1: Starter Diet
1α Efficacy Dependent on Dietary Calcium Inclusion Levels With iCa Concentration
In terms of blood chemistry, only iCa exhibited any differences between 0.80% and 1.10% Ca inclusion (Figure 2). For D3 + 1α broilers, iCa increased as dietary Ca increased (1.46 mmol/L iCa at 1.40% Ca inclusion). Broilers from D3 treatments exhibited a quadratic effect with increasing iCa from 1.29 mmol/L to a peak of 1.47 mmol/L when dietary Ca increased from 0.80 to 1.10% Ca inclusion. Once dietary Ca went over 1.10%, iCa decreased (p = 0.006).
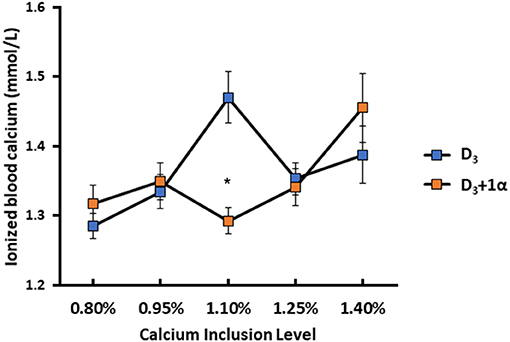
Figure 2. Ionized blood calcium of 15 d broiler chickens fed different levels of calcium with or without 1-alpha hydroxycholecalciferol supplementation (D3 + 1α; D3, respectively). Line graphs show means ± standard error means (n = 8). Interaction effect observed between calcium inclusion and 1α supplementation [General linear model (GLM), *p < 0.05].
1α Supplementation Did Not Affect Plasma Vitamin D3 Levels at 0.95% Ca Inclusion
At 0.95% Ca inclusion, 1α supplementation did not affect plasma concentrations of 24,25-(OH)2-D3 or 25-OH-D3. A statistical trend was observed with D3 + 1α broilers having a higher D3 concentration compared to D3 broilers (data not shown; p = 0.07).
Experiment 2: Grower Diet
Specific Blood Chemistry Parameters Are Affected by Ca Inclusion or 1α Supplementation
1α had no effect on 35-days broilers' iCa concentration, but when 1α was not included in the diet, iCa concentration increased as dietary Ca inclusion level increased (Ca inclusion: p = 0.003; Figure 3A). D3 + 1α broilers had higher blood bicarbonate concentration (p = 0.041), and a trend was observed with bicarbonate concentration with increasing Ca inclusion levels (p = 0.08; Figure 3B). Base excess of extracellular fluid (BEecf) is when hydrogen ions diffuse into red blood cells which causes plasma alkalinity to rise as a result as a base excess (25). The statistical model for BEecf initially exhibited a statistical trend with both vitamin D and Ca inclusion. However, the model expresses a statistical difference when only vitamin D is in the model, which is reported in this study. BEecf concentration was increased in D3 + 1α broilers (p = 0.03; Figure 3C).
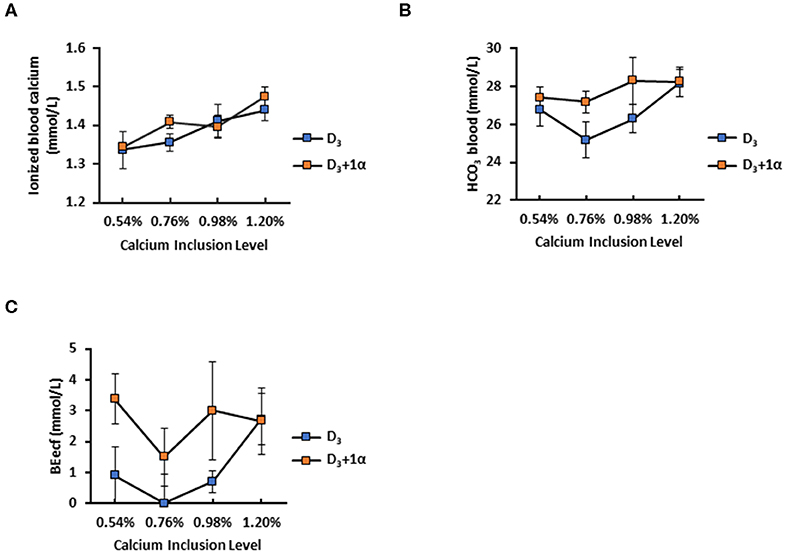
Figure 3. Selected blood chemistry of 35 d broiler chickens fed different levels of calcium with or without 1-alpha-hydroxycholecalciferol supplementation (D3 + 1α; D3, respectively). (A) Ionized blood calcium (B) Base excess of extracellular fluid (BEecf) (C) Blood bicarbonale (HCO3). Line graphs show means ± standard error means (n = 5). Calcium inclusion effect observed for ionized blood calcium; 1α supplementation effect with BEect [General linear models (GLM), p < 0.05].
Plasma Vitamin D3 Metabolite Concentration Is Affected by 1α Supplementation and Calcium Inclusion
No difference was noted among dietary treatments with 24,25-(OH)2-D3 plasma concentration (p = 0.19; Figure 4A). Broilers fed 1α supplementation had a decrease in plasma 25-OH-D3 concentration (p < 0.0001; Figure 4B). There was no dietary Ca inclusion effect on plasma 25-OH-D3 concentration. Broilers fed 1α had a linear decrease in plasma D3 as calcium inclusion levels increased, except that broilers from 0.76% Ca treatment had the highest D3 concentration (p = 0.02; Figure 4C). Relative concentrations of each measured vitamin D3 metabolite were shown to illustrate how 1α supplementation affected vitamin D3 metabolites (Figure 4D).
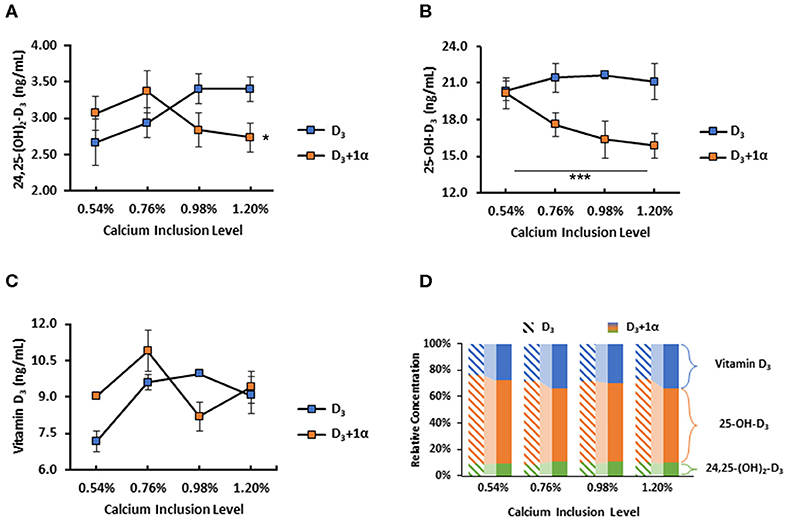
Figure 4. Vitamin D metabolite plasma concentrations of 35 d broiler chickens fed different levels of calcium with or without 1-alpha-hydroxycholecalciferol supplementation (D3 + 1α;D3, respectively). (A) 24,25-dihydroxycholecalciferol (24,25-(OH)2-D3) (B) 25-hydroxycholecalciferol (25-OH-D3) (C) Cholecalciferol (Vitamin D3) (D) Comparison of relative concentration between each vitamin D3 metabolite between D3 and D3 + 1α groups; diagonal patterned bars denote D3 and solid bars denote D3 + 1α. 1α supplementation effect with 25-OH-D3. Interaction between calcium inclusion and 1α supplementation with plasma vitamin D3. Line graphs show means ± standard error means [n = 3; General linear models (GLM), *p < 0.05; ***p ≤ 0.0001].
Higher Calcium Inclusion Levels Influenced Duodenal NPTIIb Gene Expression
No Ca inclusion effects or 1α supplementation effects were observed for CALB (p = 0.52; Figure 5A). Broilers in D3 + 1α treatments had decreased relative expression of MUC2 compared to control treatment (p = 0.002; Figure 5B). A statistical trend was denoted for VDR expression for 1α supplementation (p = 0.084) and Ca inclusion (p = 0.055) with a slight increase in expression with D3 broilers, but a larger sample size may be necessary to observe an effect (Figure 5C). D3 broilers expressed an increase in NPTIIb expression compared to D3 + 1α broilers as dietary Ca increased (p = 0.03, Figure 5D).
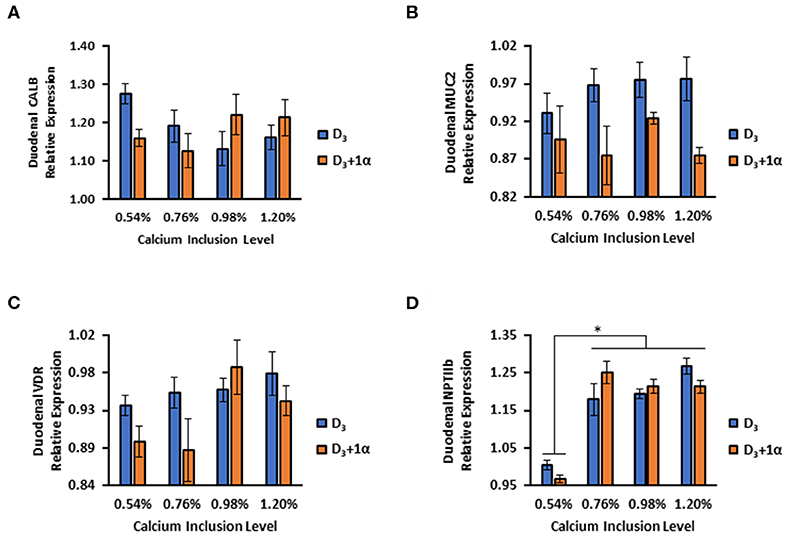
Figure 5. Relative gene expression in duodenal tissue of 35 d broiler chickens fed different levels of calcium with or without 1-alpha-hydroxycholecalciferol supplementation (D3 + 1α; D3, respectively). (A) Calbindin d28k (CALB) (B) Mucin 2 (MUC2) (C) Vitamin D receptor (VDR) (D) Sodium-phosphate cotransporter type II b (NPTIIb). Duodenal tissue was analyzed using qPCR normalized against glyceraldehyde phosphate dehydrogenase (GAPDH; housekeeping gene) expression (n = 5). [General linear models (GLM). *p < 0.05].
1α Supplementation and Calcium Inclusion Level Did Not Affect Height/Crypt Depth Ratio of Jejunal Villi
Feeding 1α to broilers had no impact on surface area or height/crypt depth ratio of villi (data not shown; p = 0.45 or p = 0.86; respectively). Similarly, Ca inclusion levels did not affect either parameter (p = 0.40 and p = 0.34 for surface area and height/crypt depth ratio, respectively).
Discussion
Our study indicated that including 1α in young broiler diets can improve their blood iCa status during the starter phase with increased Ca inclusion. 1α supplementation at the grower phase can also cause a decrease in plasma vitamin D metabolites in young broilers. 1α supplementation seems to exhibit greater efficacy during the starter phase compared to the grower phase of broiler diets in its alteration of blood iCa. However, broilers fed grower diets with 1α supplementation had a decrease in plasma 25-OH-D3 concentration as Ca inclusion increased. An interesting effect of 1α supplementation on blood chemistry was that it increased BEecf concentration during the grower phase. Increased BEecf concentration indicated broilers were metabolically exceeding their capacity to maintain acid-base balance in body, resulting in more alkali blood, an effect previously described by Mongin (26). We argue that this effect is caused by excess dietary Ca which has electrolytical potential as a cation when present in tissues (27), which has biological implications for potentially using 1α in diets with lower Ca levels for the grower phase; otherwise, these birds are under some form of duress to reduce BEecf to homeostatic balance.
Blood Ca is tightly regulated for various reasons including the need to control Ca distribution into tissues and to maintain blood pH (28). Levels of iCa in our two experiments were similar in range to those studies which reported plasma Ca concentrations from young broilers of similar ages (21, 29, 30), indicating no unusual physiological levels to denote Ca deficiency or toxicity. For broilers from the starter diet experiment, at 1.10% Ca inclusion, D3 + 1α broilers had decreased iCa compared to D3 broilers; this exhibits 1α's increased efficacy on Ca utilization because D3 + 1α broilers most likely absorbed Ca for bone metabolism compared to D3 broilers having a much higher blood iCa concentration. Han et al. (21) fed broiler chicks different levels of 1α and reported a linear effect with increasing 1α also increased plasma Ca concentration, although their broilers had a higher average concentration compared to our birds by almost 1 mmol/L with their 5 μg/kg 1α supplementation with 0.25% Ca diet. However, their plasma Ca was collected at 21 days compared to our study, which collected iCa at 15 days. Growth performance of these birds had a quadratic relationship with Ca inclusion and increased Ca digestibility with chicks fed 1α relative to Ca inclusion levels (23). Further investigation with an even lower dietary Ca inclusion level may help fit a better regression line for this relationship with 1α's efficacy on Ca absorption into bone. Examining hydroxylase expression in kidney and liver tissues could determine whether pathological issues are developing due to Ca intake. There would be greater expression of 25-hydroxylase in liver with regard to 1.40% Ca inclusion level of D3 + 1α broilers having a higher iCa concentration compared to their counterparts without 1α supplementation. If this case were to occur, then histopathological examination of kidneys and liver would verify soft-tissue calcification.
When broilers were fed at the grower phase, increasing Ca inclusion levels caused an increase in blood Ca concentration at the grower phase, regardless of 1α supplementation. Also, both Ca inclusion levels and 1α did not affect body weight of broilers fed at the grower phase (23). Our result is in agreement with that of Sebastian et al. (31) who also report how increasing Ca inclusion levels led to increased blood Ca concentration. Increased blood Ca concentration indicates that Ca requirements are met in these chickens and that Ca is most likely being excreted or stored in bone, which was observed with various strains of broilers because of how tightly regulated blood Ca is (29, 31). It should also be noted that 1α caused birds to have a consistent Ca digestibility, whereas birds not fed 1α had a negative quadratic relationship with Ca digestibility as Ca inclusion increased (23). 1α's impact on increasing blood bicarbonate concentration is probably caused by a shift in acid–base balance. We did not observe any changes in pH or CO2 blood concentration; however, we speculate bicarbonate's increase without any change to CO2 implies these broilers may be under physiological stress with alkalosis. Metabolic alkalosis can be caused by chloride depletion but can also be caused by hypercalcemia because hypercalcemia increases bicarbonate resorption (32). Therefore, it is possible that 1α, with addition of dietary vitamin D, could have caused greater Ca absorption that led to greater bicarbonate being resorbed. There is also the possibility that at the time of blood sampling, the broilers may have metabolically compensated for the partial pressure of CO2 to maintain pH in the reaction to increased bicarbonate levels (33). A caveat of our study is that we did not examine blood chloride levels, which could potentially explain the BEecf increase. Future studies should explore the mechanism with Ca inclusion in broilers on why blood bicarbonate and BEecf increased even though pH did not change.
There were no differences in vitamin D3 metabolite blood concentrations in broiler chicks fed starter diets with or without 1α supplementation at 0.95% Ca inclusion. 1α may not be affecting vitamin D pathways considering there was no difference in blood iCa concentration at this level. Based on data from the National Research Council (34), 0.95% Ca inclusion is closest to the starter phase minimum requirements for broilers. We may find a difference in vitamin D metabolite blood concentrations in broilers fed 1.10% Ca because of how drastically iCa concentration differed between D3 and D3 + α broilers.
However, 1α's effects are more pronounced when broilers are older and fed a grower diet. An inverse relationship of vitamin D3 plasma concentration implies how 1α's influence in vitamin D metabolism is dependent on dietary Ca inclusion (Figure 4C). This relationship is also connected to 25-OH-D3 because 1α is likely exerting an effect in order to reduce vitamin D3 because of 1α's efficacy. We believe D3 is being excreted in feces, but we are unable to find any poultry-related studies that report vitamin D in excreta. A human study discussed how 25-OH-D3 was intravenously administered to patients and positively correlated to increased 25-OH-D3 in urine (35). It is important to note that broilers grown to the grower phase for this study were fed common starter diets with 1α supplementation. When these broilers were sampled, broilers not fed 1α in the grower phase had a period of 18 days since they were given 1α supplementation. However, this may not impact our findings because in plasma, 1,25-(OH)2-D3 has a half-life of about 10–20 h and 25-OH-D3 is about 15 days (14). Considering broilers not fed 1α had consistent plasma levels of 25-OH-D3, it is unlikely that the 1α they were fed from the starter diet was remaining in their bodies because it would have been converted to 1,25-(OH)2-D3 and excreted or used up before blood was collected.
Excess 25-OH-D3 in chickens is converted to 24,25-(OH)2-D3 by 24-hydroxylase in kidneys (36). 24,25-(OH)2-D3 is an inactive vitamin D form that is excreted, but this form is not the end-product of this pathway; 24,25-(OH)2-D3 goes through a series of conversions and ends up becoming calcitroic acid, a water-soluble molecule that is readily excreted (37). Although no difference in 24,25-(OH)2-D3 plasma concentration was observed, we speculate that the calcitroic acid concentration would be higher in 1α-fed broilers because 1α cannot be converted to 24,25-(OH)2-D3. 1α would likely be converted to 1,25-(OH)2-D3 and then undergo multiple conversions to become calcitroic acid. We constructed a hypothetical model to compare how dietary D3 and 1α would be converted to calcitroic acid to be excreted (Figure 6). 1α-fed broilers exhibiting a linear drop in 25-OH-D3 plasma concentration are a consequence of 1α being converted to 1,25-(OH)2-D3, which will reduce the amount of vitamin D3 being converted into 25-OH-D3 due to a negative feedback loop (38). As Ca inclusion increased in 1α-fed broilers, 25-OH-D3 concentration likely dropped because of 1α's effects on Ca absorption. Purifying fecal content to measure vitamin D may provide insights to how much D3 was excreted relative to how much was fed.
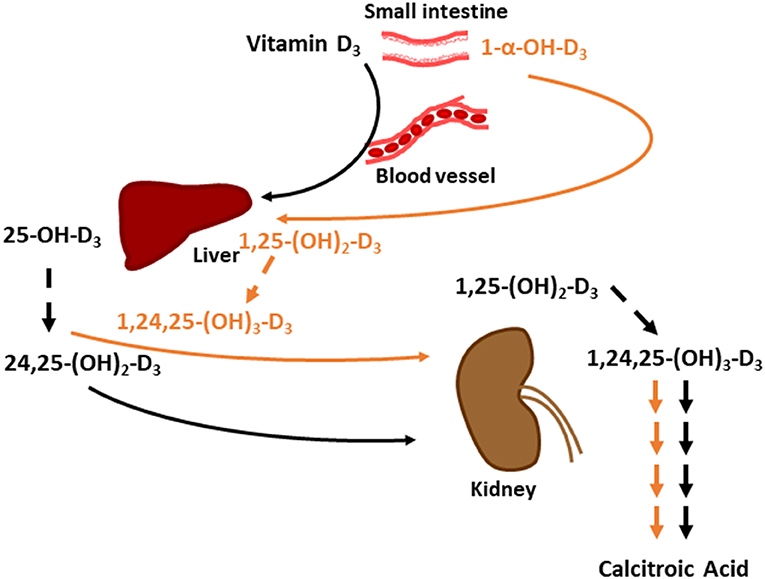
Figure 6. Hypothetical model on comparing how dietary vitamin D3 and 1-α-hydroxycholecalciferol (1α) are converted to water soluble calcitroic acid to be excreted. Black arrows denote vitamin D3's pathway to calcitroic acid and orange arrows denote 1α 's pathway. Dashed arrows signify 24-hydroxylation step. Multiple arrows between 1,24,25-(OH)3-D3and calcitroic acid denote number of conversion steps. 25-OH-D3 is 25-hydroxycholecalciferol; 24,25-(OH)3-D3 is 24,25-dihydroxycholecalciferol; 1,25-(OH)3-D3 is 1,25-dihydroxycholecalciferol; and1,24,25-(OH)3-D3 is 1,24,25-trihydroxycholecalciferol.
For broilers sampled during the grower phase, broilers fed 0.54% Ca without 1α had about 0.18 relative expression increase of CALB compared to control (D3, 0.76% Ca inclusion): this observation could signify that broilers were trying to bind dietary Ca for transport and absorption. Our results were similar to a different study by Li et al. (39) in which low Ca upregulated CALB expression. Although our results indicated MUC2 expression was statistically lower in D3 + 1α broilers, relative expression was only decreased by about 0.5 compared to D3-fed broilers, which indicates no change in MUC2 expression. This finding is indicative that these broilers can be considered healthy, an inference supported by the FITC-D data, which denoted no difference in jejunal morphology.
VDR is responsible for signal transduction of Ca absorption genes when 1,25-(OH)2-D3 binds to it (40). For VDR expression in duodenum of 35-day old broilers, even though it was not statistically different, a trending increase of VDR expression as Ca inclusion increased for broilers not fed 1α indicates dietary Ca's regulatory role with increasing VDR expression. VDR's role as a signal transducer for gene expression for proteins (TRPV6 and CALB) explains why vitamin D is important for dietary Ca absorption (41).
NPTIIb is an important cotransporter protein that requires sodium to move P in its phosphate form into cells from the intestinal lumen (42). Increasing Ca inclusion led to an increase in duodenal NPTIIb expression in 35-day D3 broilers, which was likely caused by P imbalance. Even though our study did not include citric acid, there was a study that noted how 1α, phytase, and citric acid increased phytate P utilization in broiler chicks (22). Excess dietary Ca compared to P can cause Ca to bind to P and form insoluble tricalcium phosphate (43). Our results were similar to Li et al. (39), in which increased dietary Ca levels led to increased NPTIIb expression in duodenum. Li et al. also noted how high dietary Ca could cause a decrease in available P, which triggers the increased expression of NPTIIb in the duodenum. A proposed model of the inverse relationship between CALB and NPTIIb expression relative to Ca inclusion levels is denoted for broilers not fed 1α (Figure 7). Further characterization of this relationship can elucidate the need to reevaluate nutrient interrelationships in animal production. There may be unintended impacts of using excessive nutrients as a safety net for meeting nutrient requirements because potential deficiencies can be caused by nutrient antagonism, but these consequences can be detected by examining genes related to absorption such as NPTIIb and CALB.
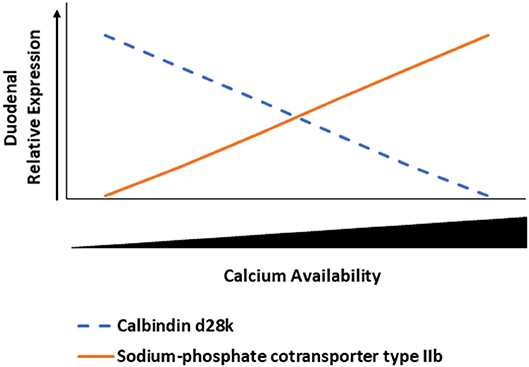
Figure 7. Inverse relationship between duodenal calbindin d28k (CALB) and sodium-phosphate cotransporter type IIb (NPTIIb) in broiler chickens relative to calcium availability. As duodenal calcium concentration increases, then CALB expression decreases and NPTIIb expression increases to potentially maximize phosphate absorption because of the potential excessive calcium binding to phosphorus to form tricalcium phosphate and making phosphorus unavailable.
Our work highlights that 1α supplementation with certain levels of Ca inclusion can impact blood Ca concentration and affect vitamin D metabolite concentration. Our findings exhibit that 1α can improve Ca utilization in young broilers with an implication for reducing dietary Ca in their diets. We suggest 1α should be supplemented in broiler diets for the starter phase and either removed for the grower phase or provided with reduced dietary Ca levels. 1α's potential to reduce dietary Ca without any negative impacts on growth performance signifies the importance of synthetic nutrients for improving animal production while reducing potential environmental impacts from excreted excess nutrients. Future research should explore how much 1α supplementation will cause vitamin D toxicity in growing animals to characterize an animal's regulatory limits of removing vitamin D with consideration of 1α's bypassing of negative feedback regulation.
Data Availability Statement
The raw data supporting the conclusions of this article will be made available by the authors, without undue reservation, to any qualified researcher.
Ethics Statement
The animal study was reviewed and approved by Institutional Animal Care and Use Committee, North Carolina State University.
Author Contributions
MW, JF, and KL contributed to the conception and design of the study. MW and KL contributed to the acquisition, analysis, interpretation of data, wrote the first draft of the manuscript, and were responsible for the final editing of the manuscript. MW, TV, OT, and KL contributed to the manuscript. All authors read and approved the final manuscript.
Conflict of Interest
The authors declare that this study received funding from Premex. The funder had the following involvement with the study: conception and design of the study.
Acknowledgments
The authors would like to thank KL and Edens lab group members, Marilyn Mayer, and Catherine Lopez who gave feedback for the manuscript drafts. The authors would also like to thank Viviana San Martin Diaz for sharing the diet tables used in this study.
References
1. Bar A, Shinder D, Yosefi S, Vax E, Plavnik I. Metabolism and requirements for calcium and phosphorus in the fast-growing chicken as affected by age. Br J Nutr. (2003) 89:51–60. doi: 10.1079/BJN2002757
2. Waldenstedt L. Nutritional factors of importance for optimal leg health in broilers: a review. Anim Feed Sci Technol. (2006) 126:291–307. doi: 10.1016/j.anifeedsci.2005.08.008
3. Edwards H, Shirley R, Escoe W, Pesti G. Quantitative evaluation of 1-alpha-hydroxycholecalciferol as a cholecalciferol substitute for broilers. Poultry Sci. (2002) 81:664–9. doi: 10.1093/ps/81.5.664
4. Sandström B. Micronutrient interactions: effects on absorption and bioavailability. Br J Nutr. (2001) 85:S181–5. doi: 10.1079/BJN2000312
5. Onderci M, Sahin N, Sahin K, Cikim G, Aydín A, Ozercan I, et al. Efficacy of supplementation of α-amylase-producing bacterial culture on the performance, nutrient use, and gut morphology of broiler chickens fed a corn-based diet1. Poultry Sci. (2006) 85:505–10. doi: 10.1093/ps/85.3.505
6. Amerah AM, Gilbert C, Simmins PH, Ravindran V. Influence of feed processing on the efficacy of exogenous enzymes in broiler diets. World Poultry Sci J. (2011) 67:29–46. doi: 10.1017/S0043933911000031
7. Fallon MB, Boyer JL. Hepatic toxicity of Vitamin A and synthetic retinoids. J Gastroenterol Hepatol. (1990) 5:334–42. doi: 10.1111/j.1440-1746.1990.tb01635.x
8. Mortensen JT, Brinck P, Binderup L. Toxicity of vitamin D analogues in rats fed diets with standard or low calcium contents. Pharmacol Toxicol. (1993) 72:124–7. doi: 10.1111/j.1600-0773.1993.tb00302.x
9. Moritz J, Parsons A, Buchanan N, Baker N, Jaczynski J, Gekara O, et al. Synthetic methionine and feed restriction effects on performance and meat quality of organically reared broiler chickens. J Appl Poultry Res. (2005) 14:521–35. doi: 10.1093/japr/14.3.521
10. Haussler MR, Zerwekh JE, Hesse RH, Rizzardo E, Pechet MM. Biological activity of 1α-hydroxycholecalciferol, a synthetic analog of the hormonal form of vitamin D3. Proc Natl Acad Sci USA. (1973) 70:2248–52. doi: 10.1073/pnas.70.8.2248
11. Biehl RR, Baker DH, Deluca HF. 1 alpha-Hydroxylated cholecalciferol compounds act additively with microbial phytase to improve phosphorus, zinc and manganese utilization in chicks fed soy-based diets. J Nutr. (1995) 125:2407–16. doi: 10.1093/jn/125.9.2407
12. Edelstein S, Noff D, Freeman D, Sheves M, Mazur Y. Synthesis of 1 α-hydroxy [7-3H] cholecalciferol and its metabolism in the chick. Biochem J. (1978) 176:111–7. doi: 10.1042/bj1760111
13. Miller WL, Portale AA. Vitamin D 1α-Hydroxylase. Trends Endocrinol Metab. (2000) 11:315–9. doi: 10.1016/S1043-2760(00)00287-3
14. Jones G. Pharmacokinetics of vitamin D toxicity. Am J Clin Nutr. (2008) 88:582S−6S. doi: 10.1093/ajcn/88.2.582S
15. Hurwitz S, Plavnik I, Shapiro A, Wax E, Talpaz H, Bar A. Calcium metabolism and requirements of chickens are affected by growth. J Nutr. (1995) 125:2679–86.
16. Holick MF. Vitamin D and bone health. J Nutr. (1996) 126:1159S−64S. doi: 10.1093/jn/126.suppl_4.1159S
17. Wang J, Chen J-S, Zong J-Y, Zhao D, Li F, Zhuo R-X, et al. Calcium carbonate/carboxymethyl chitosan hybrid microspheres and nanospheres for drug delivery. J Phys Chem C. (2010) 114:18940–5. doi: 10.1021/jp105906p
18. Leach R Jr, Nesheim M. Nutritional, genetic and morphological studies of an abnormal cartilage formation in young chicks. J Nutr. (1965) 86:236–44. doi: 10.1093/jn/86.3.236
19. Edwards HM Jr, Veltmann JR Jr. The role of calcium and phosphorus in the etiology of tibial dyschondroplasia in young chicks. J Nutr. (1983) 113:1568–75. doi: 10.1093/jn/113.8.1568
20. Williams B, Solomon S, Waddington D, Thorp B, Farquharson C. Skeletal development in the meat-type chicken. Br Poultry Sci. (2000) 41:141–9. doi: 10.1080/713654918
21. Han J, Wang J, Chen G, Zhang J, Zhang N, Qu H, et al. 1α-Hydroxycholecalciferol improves the growth performance and up-regulates the mRNA expression of vitamin D receptor in the small intestine and kidney of broiler chickens. Poultry Sci. (2018) 97:1263–70. doi: 10.3382/ps/pex423
22. Snow J, Baker D, Parsons C. Phytase, citric acid, and 1α-hydroxycholecalciferol improve phytate phosphorus utilization in chicks fed a corn-soybean meal diet. Poultry Sci. (2004) 83:1187–92. doi: 10.1093/ps/83.7.1187
23. San Martin Diaz VE. Effects of 1-alpha-hydroxycholecaciferol and other Vitamin D analogs on live performance, bone development, meat yield and quality, and mineral digestibility on broilers. (MS Thesis). (2018).
24. Livak KJ, Schmittgen TD. Analysis of relative gene expression data using real-time quantitative PCR and the 2– ΔΔCT method. Methods. (2001) 25:402–8. doi: 10.1006/meth.2001.1262
25. Siggaard-Andersen O, Fogh-Andersen N. Base excess or buffer base (strong ion difference) as measure of a non-respiratory acid-base disturbance. Acta Anaesthesiol Scandinavica. (1995) 39:123–8. doi: 10.1111/j.1399-6576.1995.tb04346.x
26. Mongin P. Recent advances in dietary anion-cation balance: applications in poultry. J Proc Nutr Soc. (1981) 40:285–94. doi: 10.1079/PNS19810045
27. Borges S, Da Silva AF, Maiorka A. Acid-base balance in broilers. World Poultry Sci J. (2007) 63:73–81. doi: 10.1017/S0043933907001286
28. Moore EW. Ionized calcium in normal serum, ultrafiltrates, and whole blood determined by ion-exchange electrodes. J Clin Investig. (1970) 49:318–34. doi: 10.1172/JCI106241
29. Shafey T, Mcdonald M, Pym R. Effects of dietary calcium, available phosphorus and vitamin D on growth rate, food utilisation, plasma and bone constituents and calcium and phosphorus retention of commercial broiler strains. Br Poultry Sci. (1990) 31:587–602. doi: 10.1080/00071669008417290
30. Broz J, Oldale P, Perrin-Voltz AH, Rychen G, Schulze J, Nunes CS. Effects of supplemental phytase on performance and phosphorus utilisation in broiler chickens fed a low phosphorus diet without addition of inorganic phosphates. Br Poultry Sci. (1994) 35:273–80. doi: 10.1080/00071669408417691
31. Sebastian S, Touchburn S, Chavez E, Lague P. Efficacy of supplemental microbial phytase at different dietary calcium levels on growth performance and mineral utilization of broiler chickens. Poultry Sci. (1996) 75:1516–23. doi: 10.3382/ps.0751516
33. Foy D, De Morais HA. Metabolic alkalosis: a quick reference. Vet Clin North Am. (2008) 38:435–8. doi: 10.1016/j.cvsm.2008.01.023
34. National Research Council Nutrient Requirements of Poultry. Washington, DC: National Academies Press. (1994).
35. Krawitt E, Grundman M, Mawer EB. Absorption, hydroxylation, and excretion of vitamin D3 in primary biliary cirrhosis. Lancet. (1977) 310:1246–9. doi: 10.1016/S0140-6736(77)92660-5
36. Shanmugasundaram R, Selvaraj R. Vitamin D-1α-hydroxylase and vitamin D-24-hydroxylase mRNA studies in chickens. Poultry Sci. (2012) 91:1819–24. doi: 10.3382/ps.2011-02129
37. Reddy GS, Tserng KY. Calcitroic acid, end product of renal metabolism of 1, 25-dihydroxyvitamin D3 through the C-24 oxidation pathway. Biochemistry. (1989) 28:1763–9. doi: 10.1021/bi00430a051
38. Tanaka Y, Lorenc RS, Deluca HF. The role of 1,25-dihydroxyvitamin D3 and parathyroid hormone in the regulation of chick renal 25-hydroxyvitamin D3-24-hydroxylase. Archiv Biochem Biophys. (1975) 171:521–6. doi: 10.1016/0003-9861(75)90061-2
39. Li J, Yuan J, Guo Y, Sun Q, Hu X. The influence of dietary calcium and phosphorus imbalance on intestinal NaPi-IIb and calbindin mRNA expression and tibia parameters of broilers. Asian-Australasian J Animal Sci. (2012) 25:552. doi: 10.5713/ajas.2011.11266
40. Van Cromphaut SJ, Dewerchin M, Hoenderop JG, Stockmans I, Van Herck E, Kato S, et al. Duodenal calcium absorption in vitamin D receptor-knockout mice: functional and molecular aspects. Proc Natl Acad Sci USA. (2001) 98:13324–9. doi: 10.1073/pnas.231474698
41. Cui M, Li Q, Johnson R, Fleet JC. Villin promoter-mediated transgenic expression of transient receptor potential cation channel, subfamily V, member 6 (TRPV6) increases intestinal calcium absorption in wild-type and vitamin D receptor knockout mice. J Bone Mineral Res. (2012) 27:2097–107. doi: 10.1002/jbmr.1662
42. Hilfiker H, Hattenhauer O, Traebert M, Forster I, Murer H, Biber J. Characterization of a murine type II sodium-phosphate cotransporter expressed in mammalian small intestine. Proc Natl Acad Sci USA. (1998) 95:14564–9. doi: 10.1073/pnas.95.24.14564
Keywords: 1-α-hydroxycholecalciferol, vitamin D3, calcium, broiler, blood chemistry, sodium phosphate cotransporter type IIb, calbindin d28k, 25-hydroxycholecalciferol
Citation: Warren MF, Vu TC, Toomer OT, Fernandez JD and Livingston KA (2020) Efficacy of 1-α-Hydroxycholecalciferol Supplementation in Young Broiler Feed Suggests Reducing Calcium Levels at Grower Phase. Front. Vet. Sci. 7:245. doi: 10.3389/fvets.2020.00245
Received: 09 January 2020; Accepted: 14 April 2020;
Published: 10 June 2020.
Edited by:
Kyung-Woo Lee, Konkuk University, South KoreaReviewed by:
Guang-Hai Qi, Feed Research Institute (CAAS), ChinaSamiru Sudharaka Wickramasuriya, Chungnam National University, South Korea
Copyright © 2020 Warren, Vu, Toomer, Fernandez and Livingston. This is an open-access article distributed under the terms of the Creative Commons Attribution License (CC BY). The use, distribution or reproduction in other forums is permitted, provided the original author(s) and the copyright owner(s) are credited and that the original publication in this journal is cited, in accordance with accepted academic practice. No use, distribution or reproduction is permitted which does not comply with these terms.
*Correspondence: Matthew F. Warren, bWZ3YXJyZW5AbmNzdS5lZHU=