 Heather C. Kittrell1
 Jonathan P. Mochel2
 Justin T. Brown1
 Anna Marie K. Forseth3
 Kristen P. Hayman1
 Suzanne M. Rajewski4
 Johann F. Coetzee5
 Benjamin K. Schneider2Brette Ratliffe1
 Kristin J. Skoland1
 Locke A. Karriker1*
- 1Swine Medicine Education Center, College of Veterinary Medicine, Iowa State University, Ames, IA, United States
- 2SMART Pharmacology, Department of Biomedical Sciences, College of Veterinary Medicine, Iowa State University, Ames, IA, United States
- 3Animal Health Division, Montana Department of Livestock, Helena, MT, United States
- 4Analytical Chemistry Services, College of Veterinary Medicine, Iowa State University, Ames, IA, United States
- 5Department of Anatomy and Physiology, College of Veterinary Medicine, Kansas State University, Manhattan, KS, United States
Castration and tail-docking of pre-wean piglets are common procedures that are known to induce pain and would benefit from pain mitigation. Flunixin meglumine (FM) is a non-steroidal anti-inflammatory drug currently approved in the United States for pyrexia in swine and lameness pain in cattle. The objective of this study was to establish the pharmacokinetic (PK) parameters resulting from intravenous (IV), intramuscular (IM), oral (PO) and transdermal (TD) administration of FM in pre-wean piglets. FM was administered to thirty-nine pre-wean piglets at a target dose of 2.2 mg/kg for IV and IM and 3.3 mg/kg for PO and TD route. Plasma was collected at twenty-seven time points from 0 to 9 days after FM administration and concentrations were determined using ultra-high performance liquid chromatography coupled with mass spectrometry (UPLC-MS). Pharmacokinetic data were analyzed using noncompartmental analysis (NCA) methods and nonlinear mixed-effects (NLME). Initial plasma concentration for IV (C0) 11,653 μg/L and mean peak plasma concentrations (Cmax) 6,543 μg/L (IM), 4,883 μg/L (PO), and 31.5 μg/L (TD) were measured. The time points of peak FM concentrations (tmax) were estimated 30 min, 1 h, and 24 h for IM, PO, and TD, respectively. The bioavailability (F) of PO and IM FM was estimated at >99%, while the bioavailability of TD FM was estimated to be 7.8%. The reported Cmax of FM after IM and PO administration is consistent with therapeutic concentration ranges that mitigate pain in other species and adult pigs. However, the low estimated concentration of FM after TD dosing is not expected to mitigate pain in pre-wean piglets. The low F of TD FM suggests that expanding the surface area of application is unlikely to be sufficient to establish an effective TD dose for pain, while the high bioavailability for PO FM should allow for an effective dose regimen to be established.
Introduction
Consumers in the United States (US) view animal welfare as the most important characteristic of an “ideal pig/pork farm” (1). Respondents of a survey indicated that physical and emotional comfort is a primary aspect of animal welfare and desired that “piglets wouldn't be castrated or teeth clipped without some form of pain killer” (1). Castration and tail-docking are considered painful procedures and are routinely performed on pre-wean piglets throughout the US (2). Flunixin meglumine (FM) is a non-steroidal anti-inflammatory drug (NSAID) with non-selective cyclooxygenase (COX) inhibitory action (3). Inhibition of COX-2 reduces prostaglandin production responsible for inflammation, pyrexia, and pain. FM is approved for the control of pyrexia associated with swine respiratory disease in swine, and pyrexia and inflammation in cattle in the US. In 2017, a transdermal (TD) application of FM was approved for foot rot pain in cattle and pyrexia associated with bovine respiratory disease (4). Although FM is not approved for pain control in pigs, Animal Medicinal Drug Use Clarification Act (AMDUCA) algorithms suggest that the product should be considered when treating pain in food animal species (5). Administration routes that do not require individual piglet injection would be preferable for on-farm use due to worker safety, infection control, and piglet welfare. With the TD formulation now commercially available, there is potential for on-farm application during pre-weaning processing in swine; however, we must confirm that FM achieves effective plasma concentrations and provide data to develop a dose regimen that is safe for the pre-wean piglets.
The objectives of this study were to establish the pharmacokinetics (PK) of IV, IM, PO, and TD administration of FM in pre-wean piglets, and evaluate the ability of TD FM to reach therapeutic levels.
Materials and Methods
Animals and Housing
Healthy, cross-bred, mixed-sex piglets, 9 days of age, with no previous FM treatment and an initial mean weight of 3.40 ± 0.58 kg were utilized in two phases of study. The piglets had received routine, on-farm processing at 3 days of age that included iron dextran injection and tail docking of all piglets, and castration of male piglets. Phase I consisted of a parallel design in which twenty-three piglets were assigned to either IM, PO, or TD administration groups for PK evaluation. Phase II consisted of sixteen piglets in a two-way crossover study of intravenous (IV) and TD administration of FM. Piglets were individually housed in a climate-controlled room and each pen had a heat lamp that provided supplemental heat to maintain a microenvironment temperature of 32–35°C. Room temperature was gradually decreased and supplemental heat was removed as size and age of pigs increased. An orogastric feeding tube (Sovereign™, CardinalHealth, Dublin, OH, USA) was used to provide nutrition (Esbilac® Pet-Ag, Inc, Hampshire, IL, USA) three times daily with ad libitum water (6). Phase I pigs were maintained on the Esbilac® diet for the entirety of the study. Phase II pigs were gradually weaned onto a dry starter ration by day 10 that met or exceeded recommended NRC guidelines (7). Feeding schedules were modified slightly to allow for blood collection time points. This study was approved by the Institutional Animal Care and Use Committee (IACUC # 18-057, # 18-169) at Iowa State University.
Study Design-Phase I-PK of Oral, Transdermal, and Intramuscular Flunixin Meglumine
Piglets were randomly allotted to one of three treatment groups differing by route of administration: intramuscular (IM, n = 7), oral (PO, n = 8), and transdermal (TD, n = 8). A randomized block design ensured that an even number of males and females were assigned to each group. After group allocation, a pre-trial blood collection was performed on each piglet. One mortality resulted due to jugular vein hematoma, and therefore the intramuscular group consisted of 7 piglets. Flunixin meglumine was administered at a target dose of 2.2 mg/kg for IM (Banamine®-S, Merck Animal Health, Madison, NJ, USA) administration and a target dose of 3.3 mg/kg for PO and TD (Banamine®-S and Banamine® Transdermal, Merck Animal Health, Madison, NJ, USA). Piglets were weighed the day prior to drug administration to calculate drug dose for each pig. A single-use needle and syringe was used to administer FM in the musculature of the lateral neck, behind the ear. A new feeding tube was used for orogastric intubation and PO administration of FM, followed by a volume of water equal to the volume of the tube to ensure administration of the full dose. TD application consisted of a single-use syringe to apply FM to the dorsal midline skin between the shoulder blades.
Study Design-Phase II- Bioavailability of Transdermal Flunixin Meglumine
A randomized block design was used to allocate pigs to one of two initial routes of administration: IV (n = 8) and TD (n = 8). IV administration was accomplished via jugular venipuncture. TD application was achieved as stated previously. Following treatments and blood collections, the groups were allowed a 9-day washout period, the routes of administration were switched for the groups, and sample collections were repeated.
Blood Collection
Blood samples (1.0 mL/sample) were collected prior to treatment administration (0 min) and at 15, 30, 45, 60, 90 min and 2, 3, 6, 12, 24, 36, 48, 60, 72 h post treatment for all routes of administration in Phase I. Phase II blood collections occurred at 0, 5, 15, 30, 45, 60, 90 min and 2, 3, 6, 12, 24, 36, 48, 60 h post administration for the IV route and 0, 15, 30, 45, 60, 90 min and 2, 3, 6, 12, 24, 36, 48, 60, 72, 84, 96, 108, 120, 132, 144, 156, 168, 180, 192, 204, and 216 h for the TD route. The blood collection time points and washout period for TD application in this study were acquired from PK research conducted in cattle (8). All blood collections occurred via jugular venipuncture with a single use needle and syringe. Samples were immediately transferred to a sodium heparin blood collection tube (BD Vacutainer, Franklin Lakes, NJ, USA) and stored on ice before processing. Blood samples remained on ice for no longer than 2 h prior to centrifugation for 10 min at 1,500g. Collected plasma was placed in cryovials and frozen at −70°C until drug concentration analysis.
UPLC-MS Analysis of Flunixin Meglumine Concentrations
Plasma concentrations of FM were determined using ultrahigh performance liquid chromatography (Q Exactive Focus Orbitrap, Thermo Scientific, San Jose, CA, USA) coupled with mass spectrometry (Dionex Ultimate 3000, Thermo Scientific, San Jose, CA, USA), as previously described (8). The standard curve for FM was prepared in blank porcine serum and ranged from 2 to 5,000 ng/mL with a correlation coefficient greater 0.995 for all analyses. Quality control (QC) samples were prepared at concentrations 30, 300, and 3,000 ng/mL. For concentrations above 3,000 ng/ml, dilution using blank swine serum was validated as a precise method for quantifying concentration. All dilutions in this study were <0.1. The QCs were ±15% of the nominal value. The lower limit of quantification (LLOQ) and lower limit of detection (LLOD) were 2 and 0.3 ng/mL, respectively. For Phase I, the accuracy and precision for the QC samples were 109 and 3.0% for the 30 ng/mL QC; 102 and 4.7% for the 300 ng/mL QC; and 105 and 4.2% for the 3,000 ng/mL QC. For Phase II, the accuracy and precision for the QC samples were 103 and 5.5% for the 30 ng/mL; 100 and 3.3% for the 300 ng/mL; and 104 and 4.8% for the 3,000 ng/mL samples.
Noncompartmental Parameter Estimates
For completeness and to derive initial (i.e., starting) PK parameter values for the NLME model, we computed a complementary set of PK parameters via non-compartmental analysis (NCA). NCA was performed using PKanalix (Monolix Suite 2019R2, Lixoft, France). Where applicable, the following population summary as well as dosing group summary parameters were calculated area under plasma concentration-time curve/dose (AUC/Dose), (AUCINF), apparent clearance (Cl/F), clearance (Cl), maximum concentration (Cmax), terminal half-life (t1/2), terminal phase elimination rate constant (λz), mean residence time (MRT), time of maximum concentration (tmax), apparent volume of distribution at steady state (Vss/F), and volume of distribution at steady state (Vss).
NLME Model Building and Evaluation
No outliers were identified during initial data exploration in Monolix datxplore (2019R2, Lixoft, France), allowing us to pool all data for model building. Flunixin meglumine plasma concentration time-courses from IV, IM, PO, and TD were analyzed simultaneously using the stochastic approximation expectation maximization algorithm (SAEM) as implemented in Monolix 2019R2 (Lixoft, France). Individual model parameters were obtained using the full posterior of the conditional distribution (9, 10). NLME models were written as previously described (9, 11–13).
Equation 1:
yij is the observed FM concentration value for individual i at time j. F(φi, βi, tij) is the model predicted value for the ith individual at time tij, with vector of individual parameters φi and vector of individual covariates βi.
G(φi, tij) · εij is the residual error model—a combination of both unexplained variability and measurement error. The function G(φi, tij) is the scale of predicted error at time tij, given the vector of individual parameters φi. The values in vector εij are distributed normally with mean 0 and variance σ2.
Individual parameters φi were modeled as a function, h(μ, ηi, βi), of the mean individual parameter values, μ, individual variability ηi, and individual covariates, βi. ηi are distributed normally with mean 0, variance-covariance matrix Ω, and variance ω2. j is the index given to individual-level observations, taking values from 1 to ni. i is the index given to individuals, taking values from 1 to N.
Typically, individual parameters are modeled such that individual parameters φi are distributed log-normally,
Equation 2:
However, TD and PO bioavailability were modeled such that values of bioavailability, Fi, fall strictly between 0 and 1. This is achieved using the logit function as a link-function (i.e., Fi are distributed logit-normally). ξ is the vector of mean population bioavailability.
Equation 3:
Handling of Data Below Limit of Quantification (BLQ)
Data below the lower limit of quantification (LLOQ) were modeled by adding a term to the likelihood function representing the probability that the true observation lies between zero and the LLOQ (10, 14, 15). For the calculation of the likelihood, this is equivalent to the M3 method implemented in NONMEM.
Random Effects Correlation Estimates
Visual inspection of the scatterplot of random effects as well as Pearson correlation tests between random effects (threshold p < 0.05) were used to evaluate statistical correlations between model parameters. In agreement with previous literature (16), several samples of the posterior distribution obtained during the last iteration of the SAEM algorithm, rather than the empirical Bayes estimate (EBE), were used when producing the scatterplot to better assess correlation between model parameters.
Inclusion of Covariate Relationships
Sex and bodyweight were tested for inclusion in the model using ANOVA and Pearson correlation test, respectively (threshold p < 0.05). Additionally, during the initial exploration of the individual time-course of FM PK, we noticed there appeared to be two distinct sub-populations of piglets. The first set of individuals appeared to be metabolizing FM relatively quickly and the second relatively slowly. After categorizing each individual as either a fast (MET = 0) or slow (MET = 1) metabolizer, we tested the classification for inclusion using the ANOVA method (threshold p < 0.05) as implemented in Monolix 2019R2.
Model Evaluation
Convergence of the SAEM algorithm was assessed by inspection of the search stability of both the fixed and random effects parameter searches, as well as the stability of the log-likelihood estimate during parameter search. Standard goodness-of-fit plots, including individual predictions vs. observations, the distributions of weighted residuals (IWRES), and scatter plot of the residuals, were used to assess the performance of candidate models. Prediction distributions constructed from 500 Monte Carlo simulations were used to evaluate the ability of the final model to reproduce the variability in the observed PK data. Residual error estimates from the mathematical models were used as supportive information for evaluation of goodness-of-fit.
Normality and independence of residuals were assessed using histograms, quantile-quantile plots, and autocorrelation of conditional weighted residuals. For stable models with satisfactory goodness-of-fit diagnostics, final model selection was based on the Bayesian Information Criteria (BIC) as well as the relative standard error (RSE) of parameter estimates (a measure of the precision of the model parameter estimates). The BIC was selected over the Akaike Information Criterion as it tends to select simpler and more parsimonious models (17).
Estimating a Therapeutic Topical Dose via Monte Carlo Simulations
After model selection and fit, we used Monte Carlo simulations to estimate the potential FM TD dosages at which FM would reach therapeutic plasma concentrations. To do this, we simulated the average plasma time-course of FM using the fit model (with inter-individual variability, but without error) at 1, 2, 4, 8, 14, and 20 mg/kg dosage. To derive the average plasma time-course at each dosage, we simulated 500 individuals for each dosage and computed the mean time-course from the simulated population.
Our metric of efficacy was the amount of time average FM plasma concentrations remained above one of 4 target pharmacodynamic targets (IC50 against COX-1: 21.46 ug/L, IC50 against COX-2: 63.34 ug/L, IC80 against COX-1: 390.52 ug/L, IC80 against COX-2: 894.63 ug/L) (18).
Monte Carlo simulations were performed in R 3.6.1 (The R Foundation for Statistical Computing) using the mlxR package (maintained by Lixoft, France).
Results
Animals
No noticeable signs of discomfort were observed after administration of FM. One pig regurgitated during administration of PO FM in Phase I, leading to an inability to determine the correct input dose and was therefore excluded from data modeling. During administration of FM in Phase II, we were unable to verify IV administration in two pigs and data points were removed that were inconsistent with expected IV plasma concentration-time curve (11 data points).
Noncompartmental Parameter Estimates
Default settings in PKanalix were used, as modification was not necessary to achieve a high quality NCA. The full set of NCA PK parameters are reported in Table 1. The mean t½ were estimated at 7.06, 9.12, 11.38, and 38.89 h for IV, IM, PO, and TD, respectively—suggesting flip-flop PK for the TD route (Figure 1, Supplemental Image 1). The mean AUCINF/Dose were estimated at 3.4, 3.79, 3.09, and 0.20 h/L for IV, IM, PO, and TD, respectively. Evaluation of the extrapolated AUC (AUCt−∞) for phase I revealed up to 60% AUCt−∞.
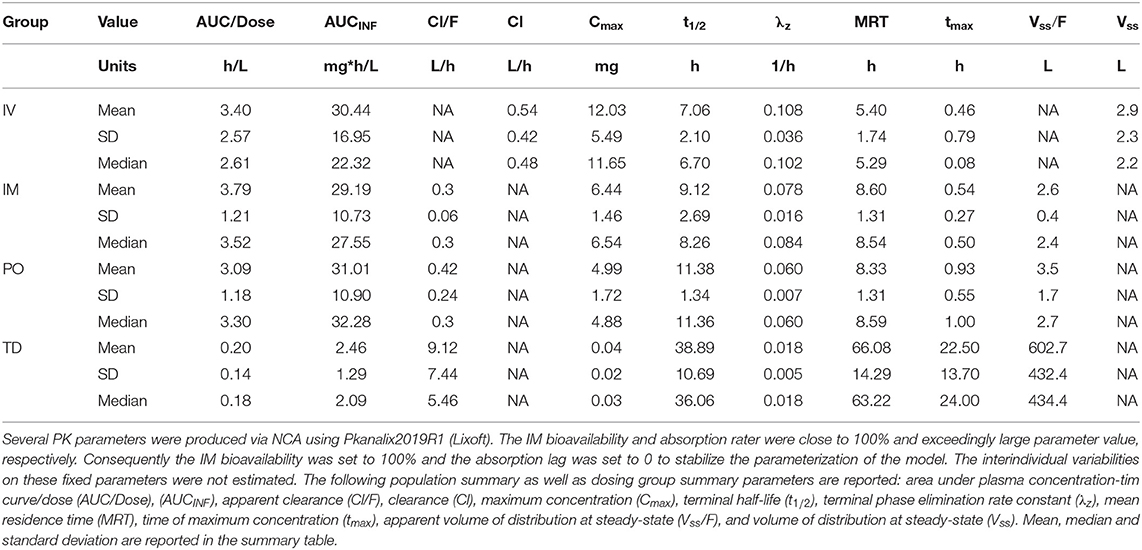
Table 1. Noncompartmental analysis parameter table.
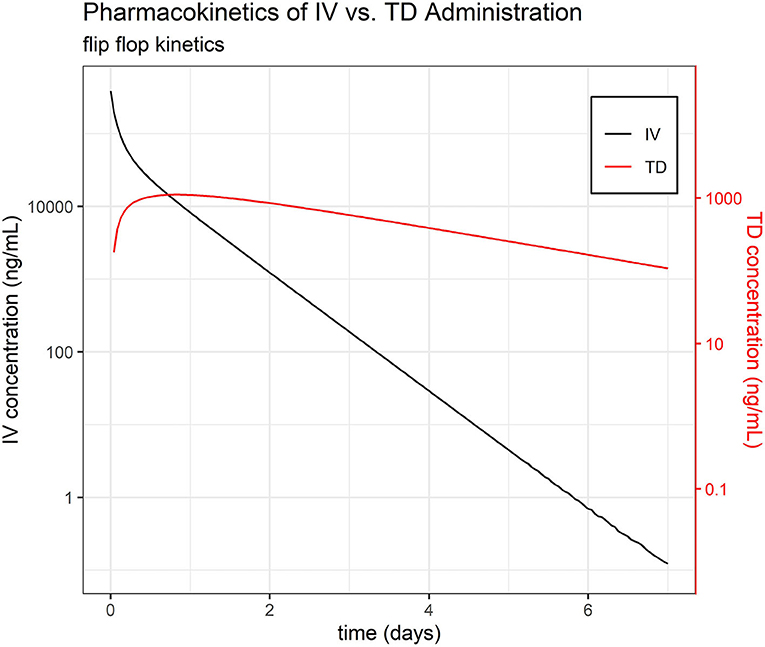
Figure 1. Pharmacokinetics of IV vs. TD FM administration. Average time course of FM separated by administration group, IV and TD.
On an important note, all NCA PK parameters agree well with their NLME counterparts, further supporting the quality of the NLME model fit.
Pharmacokinetic Model
A total of 992 plasma concentration samples of FM from IV, IM, TD, and PO dosing groups were pooled together and simultaneously modeled using NLME. Approximately 16% (156/992) of data were found to be below the LLOQ (BLQ) of the UPLC-MS validated method.
A two-compartment PK mamillary model with first order elimination was found to best describe the PK of FM in piglets. One transition compartment was used to model the PO absorption and a second parallel transition compartment was used to model the topical absorption of FM in the central compartment. The residual error was modeled as a proportional term in the mathematical model.
Sex and bodyweight did not meet the threshold for model inclusion. The metabolism rate classifier (MET) had a significant effect (p < 0.05) on clearance and was included in the final PK model. Correlations between clearance, intercompartmental clearance, peripheral volume, and topical bioavailability met the threshold for statistical significance and were included in the model. Of note, the MET was independent of the route of FM administration.
Overall, 9 piglets were classified as fast metabolizer (MET = 0) and 29 piglets were classified as slow metabolizer (MET = 1).
NLME Parameter Estimates
Final parameter estimates, RSEs, and coefficients of variation can be found in Table 2. The precision of the PK parameter estimates from the final NLME model was high (RSE ≤ 25%, median RSE = 11.65%), reflecting an accurate and stable parameterization of the model. In summary, the fast metabolizer group had a clearance of 11.5 L/min, while the slow metabolizer group had a lower clearance, 4.7 L/min. The estimated volume of distribution was 1.35 L and 1.18 L for the volume of the central and the peripheral compartment, respectively.
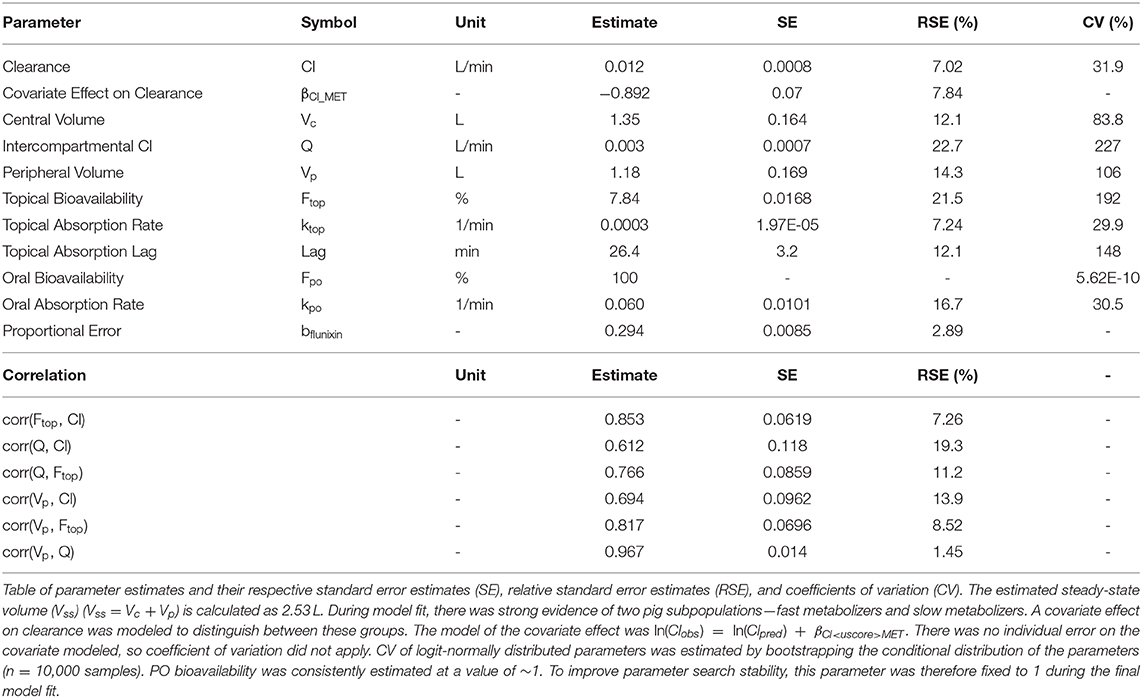
Table 2. Model parameter table.
The absolute bioavailability of PO FM (Fpo) was consistently estimated at >99% with very little inter-individual variability (IIV). Therefore, Fpo was set to 1 and IIVFpo was set to 0.01 in the final model fit. Similarly, Fim was consistently estimated with little variation and a high percentage (individual Fim >> 99%). Therefore, it was not necessary to include Fim as a parameter in the final model—equivalent to Fim = 100% and IIVFim = 0. In contrast, the relative bioavailability of TD FM was estimated to be low (7.86%).
Overall, standard goodness-of-fit diagnostic plots—observations vs. predictions, individual fits, and prediction distribution—indicate the model reproduced the observed individual and population dynamics with high accuracy (Figures 2–4, Supplemental Images 2–9).
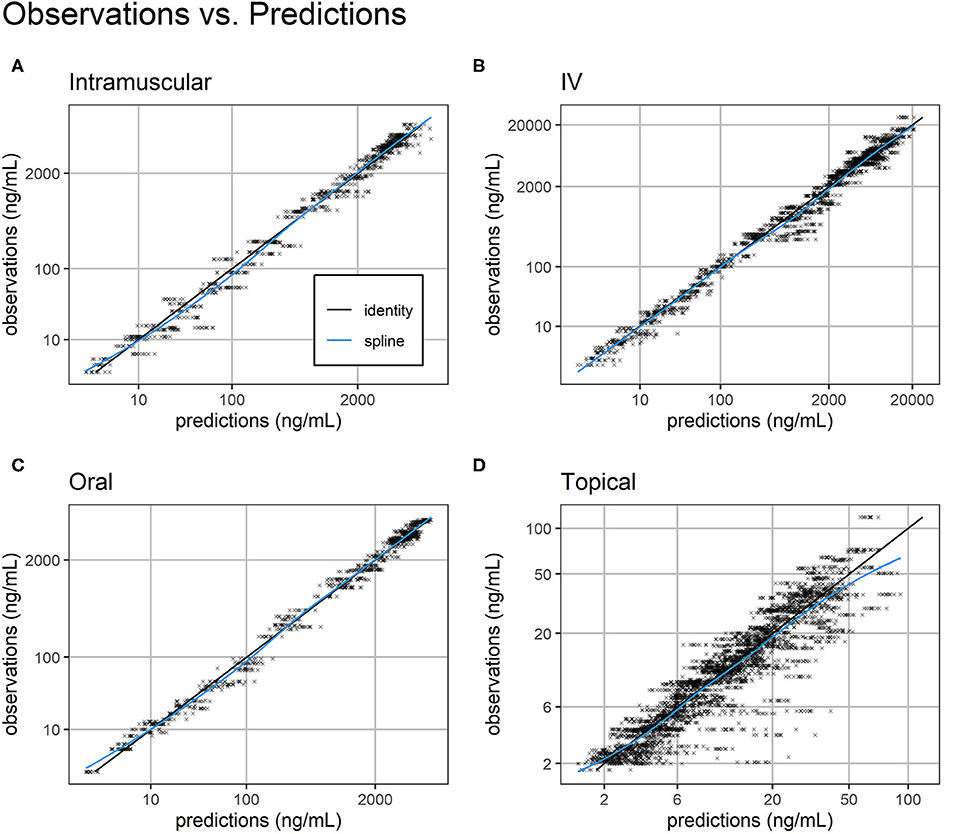
Figure 2. Observations vs. predictions. Observations vs. model predictions of FM concentration (black crosses) for intramuscular (A), intravenous (B), oral (C), and topical (D) routes of administration. As suggested in (16), simulated individual predictions drawn from the full conditional distribution of individual predictions were used to reduce shrinkage. Plasma concentration axes were scaled by ln (“plasma concentration” + 1) to improve resolution of plasma concentrations close to zero (19). Points are semi-transparent to reduce over-plotting. The identity line (black line) and spline of the observations vs. predictions (blue line) are added to help diagnose structural misspecification.
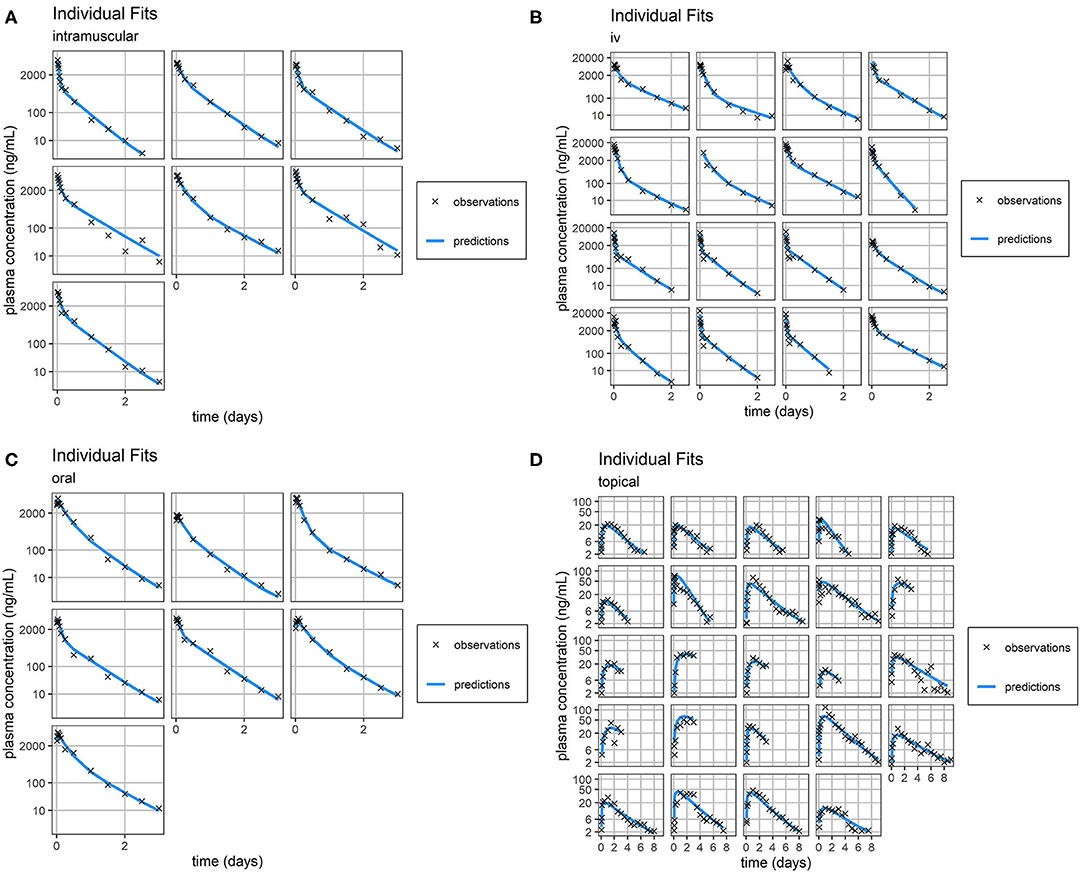
Figure 3. Individual Fit. Individual predictions of FM concentration time-course (blue line) vs. individual observations of FM concentration time-course (black crosses) for intramuscular (A), intravenous (B), oral (C), and topical (D) routes of administration. Concentrations of FM after topical administration are relatively small. Consequently, the scale of error relative to measurement is large. Plasma concentration axes were scaled by ln (“plasma concentration” + 1) to improve resolution of plasma concentrations close to zero, as previously described (19).
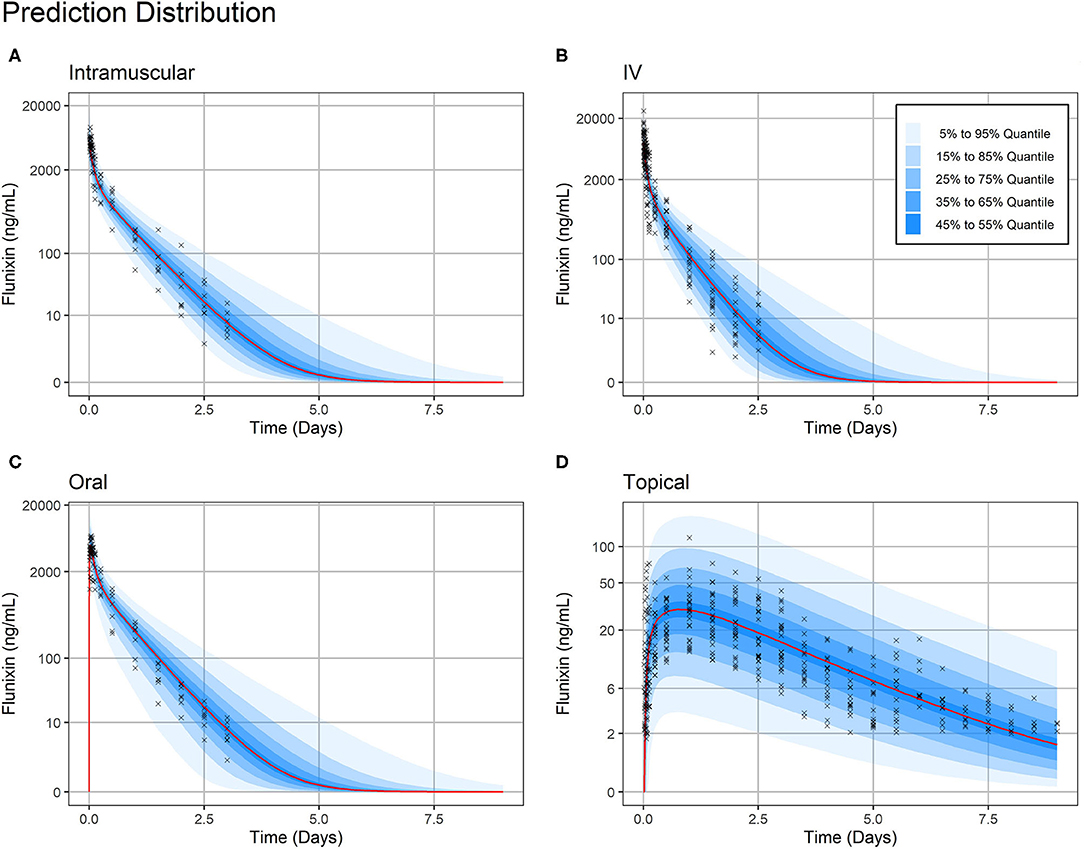
Figure 4. Prediction Distribution. Distribution of model predictions plotted alongside observations for intravenous (A), intramuscular (B), oral (C), and topical (D) routes of administration. The prediction distribution (blue areas) was generated by Monte Carlo simulations, in this case by simulating the experiment 500 times. Then, the set of quantiles from 5% to 95% in steps of 10% {5%, 15%,…, 95} were calculated at each predicted timepoint—the average distance between predicted timepoints was 50 min (Monolix2019R1 defaults). Observations are indicated by black crosses and median prediction is indicated by a red line. Observations fall mostly within the 95% prediction interval. Plasma concentration axes were scaled by ln (“plasma concentration” + 1) to improve resolution of plasma concentrations close to zero, as previously described (19). Points are semi-transparent to reduce over-plotting.
Of note, distribution of FM systemic clearance estimates from the final NLME model showed a homogeneous repartition of fast and slow metabolizers between TD- vs. IV/IM/PO-treated piglets (Figure 5).
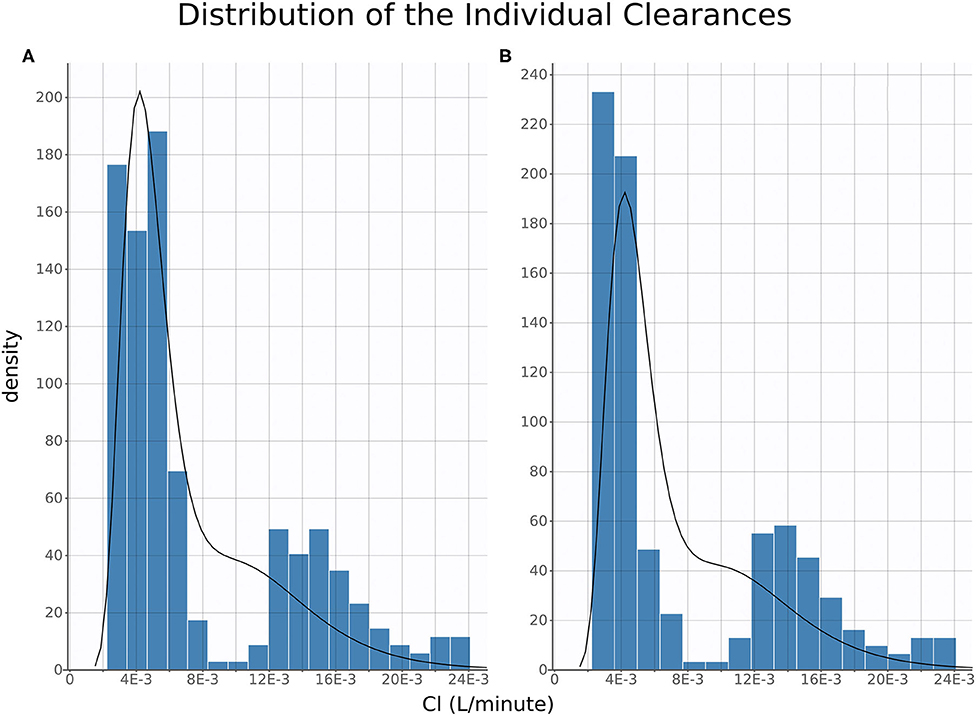
Figure 5. Clearance Distribution. Histograms of distribution of estimated individual clearances plotted for oral, intravenous, and intramuscular (A) and topical (B). The histograms are produced from the full posterior distribution of individual clearances.
NLME Model Predictions
A sub-model of bodyweight was built for simulating individual treatments because dosages were administered in units of mg/kg. To establish this model, we pooled all sample bodyweights together and fit a Box Cox model of bodyweight via analysis of variance (ANOVA) in R 3.6.1 (The R Foundation for Statistical Computing) (20). The model (Equation 4) predicts a Box Cox transformation of bodyweight for each individual, i, using one parameter for population bodyweight (BWpop= 1.31), one parameter for inter-phase population weight variability (IPV = 0.89), and one residual value for each individual (.
Equation 4:
The optimal λ (λ = 0.14) was selected by trying values from−2 to 2 in steps 0.1, and determining which λ minimized sum of squared error (i.e., ) in a spline interpolation curve between points.
After building a sub-model of bodyweight, we were able to simulate the total time above target concentrations at 1, 2, 4, 8, 14, and 20 mg/kg dosage (Figure 6). We found that for COX-1 IC50 and COX-2 IC50, there are several viable TD dosages which produced therapeutic concentrations for >24 h with very little variability in time above target.
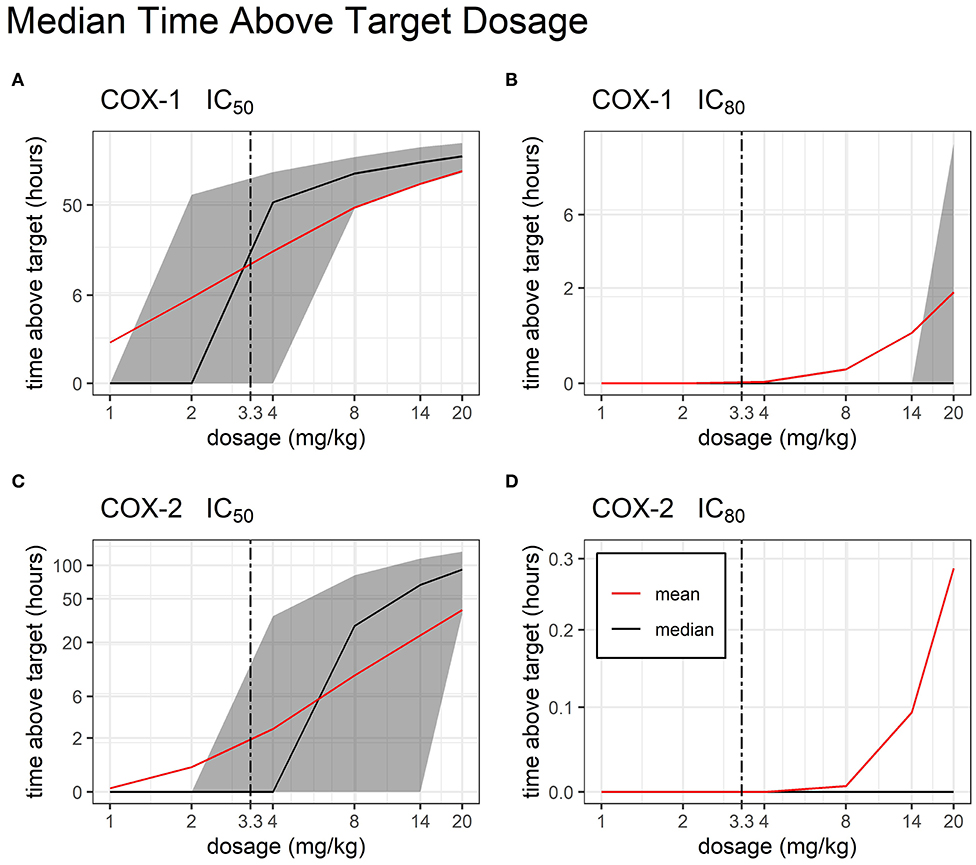
Figure 6. Time Above Target by Dosage. Median and mean (black and red line, respectively) time duration (hours) for which FM plasma concentrations stay above target COX inhibition following single administration of a TD dose of FM (from 1 to 20 mg/kg). COX-1 IC50 (A), COX-1 IC80 (B), COX-2 IC50 (C), and COX-2 IC80 (D) are represented. Interindividual variability in target attainment is represented via the filled areas surrounding each median. The areas span the 50% interquartile range between the 25th and 75th percentile. The time above target axis was scaled by ln(“time above target” + 1) to improve resolution of time values close to or equal to zero, as previously described (19). The axis for time was scaled by log2.
Discussion
Previous researchers have evaluated the PK of FM after IV, IM, and PO in mature swine (21, 22), while FM PK in piglets has been evaluated for the IV and IM route of administration (23–26). Additional research for TD in mature swine has also been reported since the completion of this study (27). Although the PK of IV FM has been reported in piglets (24), the IV route was studied here to establish the absolute bioavailability of FM for extravascular routes of administration. To the best of the authors' knowledge, the PK evaluation of IM, PO, and TD routes of administration of FM in pre-wean piglets has not been reported. The objective of this study was to establish the PK of IV, IM, PO, and TD administration of FM and evaluate the ability of TD FM to reach therapeutic levels in pre-wean piglets.
Nonlinear mixed-effects (NLME) modeling is routinely used in human pharmaceutical research (28), and veterinary scientists are increasingly applying NLME techniques to address animal health related issues (13). Individual animal characteristics (covariates), such as age, sex, and GI absorption can influence drug disposition kinetics. Additionally, NLME modeling allows individual animal covariates to be analyzed to identify population characteristics that impact drug PK (13). The use of NLME modeling in this study quantified individual variability by accounting for the following covariates: age, sex, and drug metabolism. NLME also provided a means for pooling IV, IM, PO, and TD administration data to provide an analytical framework for the simultaneous modeling of 992 concentrations time points. In addition to NLME modeling, this study also provided drug exposure after administration (AUC) and PK parameters using noncompartmental analysis (NCA). The use of NCA combined with NLME provides verification of the models used and the results provided. Our calculated Vss using the NLME approach was 2.53L (Table 2) and compares favorably to the estimated median of Vss from the NCA approach in Table 1 (2.3 L). The fact that our calculated Vss is slightly larger than the reported median Vss is consistent with previous literature (29). Additionally, our estimated Vss is consistent with previously reported values in swine (23). The heritability of the pigs was not within the scope of this project, however, a previous study has shown that heritability can have an effect on FM PK parameters, which may explain the two drug metabolism groups (30). Additionally, the stress that can be induced by repeated blood collections, individual housing, and early weaning could contribute to differences in drug metabolism (31).
The target dose of 2.2 mg/kg for IM administration is according to the label and the same target dose was used for administration of IV dose (32). The Cmax for PO administration in this study is higher than previous studies in which PO PK parameters were evaluated for mature swine (22). The high Cmax for PO administration in this study is comparable to peak concentrations after IM administration. The tmax for PO administration in this study is consistent with tmax achieved in mature swine (22). The target dose of 3.3 mg/kg for TD route followed the label of the commercial product for administration in cattle (33). The blood collection time points and washout period for TD application in this study were acquired from PK research conducted in cattle (8). Transdermal FM produced systemic drug levels consistent with concentrations in sows (27). However, there appears to be no additional research on TD administration of FM in piglets for comparison. The tmax for TD administration achieved in this study is longer than previous research in sows (27). Absolute bioavailability quantifies the fraction of a drug that is absorbed and available to produce its systemic effect (34). Estimated absolute bioavailability of >99% for the PO route of administration is higher than previously reported in mature swine. Although the bioavailability for the TD route was higher than an earlier description in mature swine (27), there is insufficient evidence to conclude that the TD route could provide pain mitigation. One explanation for the higher PO bioavailability in this study may be the formulation and administration technique. An orogastric tube was used to orally administer the injectable formulation of FM to ensure that the full dose was administered to the stomach, while a previous study used a powdered formulation mixed with cookie dough (27). Although orogastric administration would not be considered for on-farm use, the method is optimal for precise dose administration and initial PK analysis. The low estimated F for the TD route could be attributed to the anatomy of the skin—with drug accumulation in intracellular spaces and overall poor diffusion to the systemic circulation through the various skin layers (35). The low estimated concentration of FM after TD dosing, concurrent with poor absolute bioavailability, is not expected to mitigate pain in pre-wean piglets in the conditions of this study, which included individual housing of the piglets. Flunixin meglumine is described as a weak acid with approximately 99% plasma protein binding (Banamine®-S, Merck Animal Health, Madison, NJ, USA). The high degree of plasma binding along with the low pKa (5.82) can contribute to the low volume of distribution, which also suggests minimal tissue binding. FM has a low extraction ratio, which will allow the free drug concentration to be unchanged independent of the unbound drug, which could account for the high clearance (36, 37).
The phenomenon of flip-flop PK in extravascular dosing routes occurs when absorption (instead of elimination) becomes the rate limiting step in drug PK. Comparison of the estimated slope of the terminal phase (and their associated elimination half-life, t½) between intravascular and extravascular dosing can indicate the presence of flip-flop PK. While the average t½ of FM after IV, IM, and PO dosing was consistently estimated at 0.28, 0.34, and 0.47 days, respectively, the average elimination half-life of FM after TD dosing was much longer at 1.50 days, which is highly suggestive of flip-flop PK (35).
Research on NSAIDs has shown that the ability to achieve a therapeutic effect is dependent upon the ability to achieve at least 80% inhibition (IC80) of COX-2. As a non-selective COX inhibitor, FM also inhibits COX-1, which is associated with unwanted gastrointestinal toxicities such as intestinal erosions and ulceration (18, 38–40). The authors conducted a literature search and are not aware of research that has established swine IC50 and IC80 values for the COX isoforms. Although the use of values from another species is a study limitation, it is well documented that NSAIDs cause GI toxicity due to their action on the arachidonic acid pathway; therefore, data from equine research was used in this study to extrapolate swine IC50 and IC80 to determine anti-COX activity (18). A core objective of this study was to estimate a therapeutic and safe dose for TD FM in piglets. Our Monte Carlo simulations show that increasing the FM TD dose up to 20 mg/kg provides FM concentrations above the IC80 target for COX-2 for <1 h. Incidentally, this very high dose would cause increased COX-1 inhibition for >2 h. Overall, these results suggest that this increased formulation of TD FM is unable to provide systemic anti-inflammatory concentration that are consistent with pain relief in pre-wean piglets.
Piglet stress induced by early weaning, individual housing, and repeated venipuncture for blood collections is a limitation of this study. Pre-weaning processing that necessitates FM would typically occur prior to weaning and there is a need for FM PK parameters in young pigs. Although the pigs were weaned early, the pigs did have adequate nutrition throughout the trial. While there is no previous research in swine, research in cattle has shown that grooming activities can lead to variable PK parameters (41). As an initial PK trial, the authors provided individual housing to decrease PK variability that may be associated with grooming activities after TD administration. A jugular catheter could reduce incidence of venous hematomas and stress associated with venipuncture, however the authors are not aware of a successful catheterization technique in pre-wean piglets. Although the TD piglets in phase II were subjected to more blood collections than TD piglets in Phase I, our initial data evaluation in phase I showed that AUCt−∞ was up to 60%. Additional blood collections in phase II reduced the AUCt−∞. Additionally, the research and blood collection parameters were approved by the Iowa State University Institutional Animal Care and Use Committee (IACUC #18-057, #18-169).
In conclusion, our study provides the very first comprehensive characterization of FM PK in pre-wean piglets. The use of NLME modeling allowed for the evaluation of all available routes of FM for a robust interpretation of the data. Future applications of NLME consist of pooling larger study populations of swine FM data for a more robust characterization of the impact of individual covariates on FM PK (ongoing work for follow-up publication). Overall, the TD route has very poor bioavailability and should not be considered an option for therapeutic use in piglets. The authors of this study are not aware of any ongoing investigation of the effects of PO or IM FM administration in pre-wean piglets. Given the high bioavailability of these administration routes, we believe this to be a worthwhile area for further research during castration and tail-docking in the US swine industry.
Data Availability Statement
Phase II time-concentration dataset is provided as Supplemental Tables 1, 2. Additional raw data supporting the conclusions of this manuscript will be made available by the authors, without undue reservation, to any qualified researcher.
Ethics Statement
The animal study was reviewed and approved by Institutional Animal Care and Use Committee, Iowa State University.
Author Contributions
HK contributed to study design, sample collection and analysis, and manuscript preparation and submission. JM and BS performed the pharmacological modeling, contributed to study design, and manuscript preparation. JC contributed to the study design and the manuscript preparation. JB, AF, KH, BR, and KS contributed to study design and sample collection. SR conducted drug concentration analysis of plasma samples. LK led grant submission and contributed to study design, sample collection and analysis, and manuscript preparation. All authors have read and approved the final manuscript.
Funding
This work was supported by National Pork Board Project # 17-082.
Conflict of Interest
The authors declare that the research was conducted in the absence of any commercial or financial relationships that could be construed as a potential conflict of interest.
Supplementary Material
The Supplementary Material for this article can be found online at: https://www.frontiersin.org/articles/10.3389/fvets.2020.00586/full#supplementary-material
Supplemental Table 1. Individual time-concentration dataset for Phase II.
Supplemental Table 2. Individual time-concentration dataset for Phase II.
Supplemental Image 1. Pharmacokinetics of IV vs. TD FM administration (0–24 h). Average time course of FM (0–25 h) separated by administration group, IV and TD.
Supplemental Image 2. Prediction Distribution (0–24 h). Distribution of model predictions plotted alongside observations for intramuscular route of administration.
Supplemental Image 3. Prediction Distribution (0–24 h). Distribution of model predictions plotted alongside observations for intravenous route of administration.
Supplemental Image 4. Prediction Distribution (0–24 h). Distribution of model predictions plotted alongside observations for oral route of administration.
Supplemental Image 5. Prediction Distribution (0–24 h). Distribution of model predictions plotted alongside observations for topical route of administration.
Supplemental Image 6. Individual Fit (0–24 h). Individual predictions of FM concentration time-course (blue line) vs. individual observations of FM concentration time-course (black crosses) for intramuscular from 0 to 24 h.
Supplemental Image 7. Individual Fit (0–24 h). Individual predictions of FM concentration time-course (blue line) vs. individual observations of FM concentration time-course (black crosses) for intravenous from 0 to 24 h.
Supplemental Image 8. Individual Fit (0–24 h). Individual predictions of FM concentration time-course (blue line) vs. individual observations of FM concentration time-course (black crosses) for oral from 0 to 24 h.
Supplemental Image 9. Individual Fit (0–24 h). Individual predictions of FM concentration time-course (blue line) vs. individual observations of FM concentration time-course (black crosses) for topical from 0 to 24 h.
References
1. Sato P, Hötzel JM, Von Keyserlingk AM. American citizens' views of an ideal pig farm. Animals. (2017) 7:64. doi: 10.3390/ani7080064
2. White RG, DeShazer JA, Tressler CJ, Borcher GM, Davey S, Waninge A, Clemens ET. Vocalization and physiological response of pigs during castration with or without a local anesthetic. J Anim Sci. (1995) 73:381–6. doi: 10.2527/1995.732381x
3. Ziegler A, Fogle C, Blikslager A. Update on the use of cyclooxygenase-2-selective nonsteroidal anti-inflammatory drugs in horses. J Am Vet Med Assoc. (2017) 250:1271–4. doi: 10.2460/javma.250.11.1271
4. US Food Drug Administration. Freedom of Information Summary Original New Animal Drug Application Banamine Transdermal. (2017). Retrieved from https://animaldrugsatfda.fda.gov/adafda/app/search/public/document/downloadFoi/1944 (accessed 13 June, 2019).
5. Extralabel Drug Use in Animals, ELDU, 21, CFR 530. (1996). Retrieved from https://www.ecfr.gov/cgi-bin/text-idx?SID=054808d261de27898e02fb175b7c9ff9node=21,6.0.1.1.16rgn=div5 (accessed 13 June, 2019).
6. Coalson JA, Maxwell CV, Hiller JC, Nelson EC, Anderson IL, Corley LD. Techniques for rearing cesarean section derived colostrum free piglets. J Anim Sci. (1973) 36:259–63. doi: 10.2527/jas1973.362259x
7. National Research Council, Subcommittee on Swine Nutrition, Committee on Animal Nutrition. Nutrient Requirements of Swine. Washington, DC: The National Academic Press (2012).
8. Kleinhenz MD, Van Engen NK, Gorden PJ, KuKanich B, Rajewski SM, Walsh P, et al. The pharmacokinetics of transdermal flunixin meglumine in Holstein calves. J Vet Pharmacol Ther. (2016) 39:612–5. doi: 10.1111/jvp.12314
9. Pellig L, Soubret A, King JN, Elliott J, Mochel JP. Modeling of large pharmacokinetic data using nonlinear mixed-effects: a paradigm shift in veterinary pharmacology. CPT Pharmacometrics Syst Pharmacol. (2016) 5:625–35. doi: 10.1002/psp4.12141
10. Wang J, Schneider BK, Xue J, Sun P, Qiu J, Mochel JP, et al. Pharmacokinetic modeling of ceftiofur sodium using non-linear mixed-effects in healthy beagle dogs. Front Vet Sci. (2019) 6:363. doi: 10.3389/fvets.2019.00363
11. Sheiner LB, Ludden TM. Population pharmacokinetics/dynamics. Annu Rev Pharmacol Toxicol. (1992) 32:185–209. doi: 10.1146/annurev.pa.32.040192.001153
12. Mochel JP, Fink M, Peyrou M, Soubret A, Giraudel JM, Danhof M. Pharmacokinetic/pharmacodynamic modeling of renin-angiotensin aldosterone biomarkers following angiotensin-converting enzyme (ACE) inhibition therapy with benazepril in dogs. Pharm Res. (2015) 32:1931–46. doi: 10.1007/s11095-014-1587-9
13. Bon C, Toutain PL, Concordet D, Gehring R, Martin-Jimenez T, Smith J, et al. Mathematical modeling and simulation in animal health. J Vet Pharmacol Ther. (2018) 41:171–83. doi: 10.1111/jvp.12473
14. Musser ML, Mahaffey AL, Fath MA, Buettner GR, Wagner BA, Schneider BK, et al. In vitro cytotoxicity and pharmacokinetic evaluation of pharmacological ascorbate in dogs. Front Vet Sci. (2019) 6:385. doi: 10.3389/fvets.2019.00385
15. Wang J, Schneider BK, Sun P, Qiu J, Mochel JP, Cao X. Nonlinear mixed-effects pharmacokinetic modeling of the novel COX-2 selective inhibitor vitacoxib in dogs. J Vet Pharmacol Ther. (2019) 42:530–40. doi: 10.1111/jvp.12802
16. Lavielle M, Ribba B. Enhanced method for diagnosing pharmacometric models: random sampling from conditional distributions. Pharm Res. (2016) 33:2979–88. doi: 10.1007/s11095-016-2020-3
17. Mould DR, Upton RN. Basic concepts in population modeling, simulation, and model-based drug development. CPT Pharmacometrics Syst Pharmacol. (2012) 1:e6. doi: 10.1038/psp.2012.4
18. Beretta C, Garavaglia G, Cavalli M. COX-1 and COX-2 inhibition in horse blood by phenylbutazone, flunixin, carprofen and meloxicam: an in vitro analysis. Pharmacol Res. (2005) 52:302–6. doi: 10.1016/j.phrs.2005.04.004
19. Nguyen TH, Mouksassi MS, Holford N, Al-Huniti N, Freedman I, Hooker AC. Model evaluation group of the international society of pharmacometrics (ISoP) best practice committee. Pharmacometrics Syst Pharmacol. (2017) 6:87–109. doi: 10.1002/psp4.12161
20. Venables WN, Ripley BD. Modern Applied Statistics with S. Fourth Edition New York, NY: Springer. (2002). doi: 10.1007/978-0-387-21706-2
21. Buur JL, Baynes RE, Smith G, Riviere JE. Pharmacokinetics of flunixin meglumine in swine after intravenous dosing. J Vet Pharmacol Ther. (2006) 29:437–40. doi: 10.1111/j.1365-2885.2006.00788.x
22. Pairis-Garcia MD, Karriker LA, Johnson AK, Kukanich B, Wulf L, Sander S, Coetzee JF. Pharmacokinetics of flunixin meglumine in mature swine after intravenous, intramuscular and oral administration. BMC Vet Res. (2013) 9:165. doi: 10.1186/1746-6148-9-165
23. Howard JT, Baynes RE, Brooks JD, Yeatts JL, Bellis B, Ashwell MS, et al. The effect of breed and sex on sulfamethazine, enrofloxacin, fenbendazole and flunixin meglumine pharmacokinetic parameters in swine. J Vet Pharmacol Ther. (2014) 37:531–41. doi: 10.1111/jvp.12128
24. Levionnois OL, Fosse TK, Ranheim B. PK/PD modeling of flunixin meglumine in a kaolin-induced inflammation model in piglets. J Vet Pharmacol Ther. (2018) 41:314–23. doi: 10.1111/jvp.12468
25. Yu ZG, Jiang CM, Guo YG, Hu YY, Chen DJ. Pharmacokinetics of flunixin meglumine after intravenous and intramuscular administration in pigs. Agric Sci China. (2007) 6:1396–401. doi: 10.1016/S1671-2927(07)60189-8
26. Yu ZG, Luo XQ, Guo FX, Zhang ZR, Peng L. Determination of flunixin in swine plasma, urine and feces by UPLC-MS/MS and its application in the real samples. Curr Pharm Anal. (2019) 15:51–60. doi: 10.2174/1573412913666170918163625
27. Cramer MC, Pairis-Garcia MD, Bowman AS, Moeller SJ, Zhang Y, Sidhu PK. Pharmacokinetics of transdermal flunixin in sows. J Vet Pharmacol Ther. (2019) 42:492–5. doi: 10.1111/jvp.12772
28. Tornoe CW, Agerso H, Jonsson EN, Madsen H, Nielsen HA. Non-linear mixed-effects pharmacokinetic/pharmacodynamic modelling in NLME using differential equations. Comput Methods Programs Biomed. (2004) 76:31–40. doi: 10.1016/j.cmpb.2004.01.001
29. Toutain PL, Bousquet-Mélou A. Volumes of distribution. J Vet Pharmacol Ther. (2004) 27:441–53. doi: 10.1111/j.1365-2885.2004.00602.x
30. Howard JT, Ashwell MS, Baynes RE, Brooks JD, Yeatts JL, Maltecca C. Genetic parameter estimates for metabolizing two common pharmaceuticals in swine. Front Genet. (2018) 9:40. doi: 10.3389/fgene.2018.00040
31. Konsti M. Psychophysiological stress: a significant parameter in drug pharmacokinetics. Expert Opin Drug Metab Toxicol. (2013) 9:1317–34. doi: 10.1517/17425255.2013.816283
32. Merck Animal Health Banamine®. S Label. (2019). Retrieved from https://merckusa.cvpservice.com/product/basic/view/1047251 (accessed 13 June, 2019).
33. Merck Animal Health Banamine®. Transdermal Label. (2019). Retrieved from https://merckusa.cvpservice.com/product/basic/view/1047536 (accessed 13 June, 2019).
34. Toutain PL, Bousquet-Melou A. Bioavailability and its assessment. J Vet Pharmacol Ther. (2004) 27:455–66. doi: 10.1111/j.1365-2885.2004.00604.x
35. Yanez JA, Remsberg CM, Sayre CL, Forrest ML, Davies NM. Flip-flop pharmacokinetics–delivering a reversal of disposition: challenges and opportunities during drug development. Ther Deliv. (2011) 2:643–72. doi: 10.4155/tde.11.19
36. Toutain PL, Bousquet-Melou A. Free drug fraction vs. free drug concentration: a matter of frequent confusion. J Vet Pharmacol Ther. (2002) 25:460–3. doi: 10.1046/j.1365-2885.2002.00442.x
37. Toutain PL, Bousquet-Melou A. Plasma clearance. J Vet Pharmacol Ther. (2004) 27:415–25. doi: 10.1111/j.1365-2885.2004.00605.x
38. Radi ZA, Khan NK. Effects of cyclooxygenase inhibition on the gastrointestinal tract. Exp Toxicol Pathol. (2006) 58:163–73. doi: 10.1016/j.etp.2006.06.004
39. Raskin JB. Gastrointestinal effects of nonsteroidal anti-inflammatory therapy. Am J Med. (1999) 106:3s−12s. doi: 10.1016/S0002-9343(99)00112-6
40. Warner TD, Giuliano F, Vojnovic I, Bukasa A, Mitchell JA, Vane JR. Nonsteroid drug selectivities for cyclo-oxygenase-1 rather than cyclo-oxygenase-2 are associated with human gastrointestinal toxicity: a full in vitro analysis. Proc Natl Acad Sci USA. (1999) 96:7563–8. doi: 10.1073/pnas.96.13.7563
Keywords: swine, non-steroidal anti-inflammatory, flunixin meglumine, pain, topical, NLME
Citation: Kittrell HC, Mochel JP, Brown JT, Forseth AMK, Hayman KP, Rajewski SM, Coetzee JF, Schneider BK, Ratliffe B, Skoland KJ and Karriker LA (2020) Pharmacokinetics of Intravenous, Intramuscular, Oral, and Transdermal Administration of Flunixin Meglumine in Pre-wean Piglets. Front. Vet. Sci. 7:586. doi: 10.3389/fvets.2020.00586
Received: 30 April 2020; Accepted: 21 July 2020;
Published: 28 August 2020.
Edited by:
Deirdre P. Campion, University College Dublin, IrelandReviewed by:
Fan Yang, Henan University of Science and Technology, ChinaDongping Zeng, South China Agricultural University, China
Jérôme R. E. del Castillo, Université de Montréal, Canada
Copyright © 2020 Kittrell, Mochel, Brown, Forseth, Hayman, Rajewski, Coetzee, Schneider, Ratliffe, Skoland and Karriker. This is an open-access article distributed under the terms of the Creative Commons Attribution License (CC BY). The use, distribution or reproduction in other forums is permitted, provided the original author(s) and the copyright owner(s) are credited and that the original publication in this journal is cited, in accordance with accepted academic practice. No use, distribution or reproduction is permitted which does not comply with these terms.
*Correspondence: Locke A. Karriker, a2FycmlrZXJAaWFzdGF0ZS5lZHU=