 Hee J. Kim
 Gabriel L. Hamer
 Sarah A. Hamer
 Job E. Lopez
 Pete D. Teel
- 1Department of Entomology, Texas A&M AgriLife Research, College Station, TX, United States
- 2Department of Veterinary Integrative Biosciences, College of Veterinary Medicine and Biomedical Sciences, Texas A&M University, College Station, TX, United States
- 3Department of Pediatrics, Center for Tropical Medicine, Baylor College of Medicine, Houston, TX, United States
The ecology and host feeding patterns of many soft ticks (Ixodida: Argasidae) remain poorly understood. To address soft tick–host feeding associations, we fed Ornithodoros turicata Dugès on multiple host species and evaluated quantitative PCR (qPCR) and stable isotope analyses to identify the vertebrate species used for the bloodmeal. The results showed that a qPCR with host-specific probes for the cytochrome b gene successfully identified bloodmeals from chicken (Gallus gallus L.), goat (Capra aegagrus hircus L), and swine (Sus scrofa domesticus) beyond 330 days post-feeding and through multiple molting. Also, qPCR-based bloodmeal analyses could detect multiple host species within individual ticks that fed upon more than one species. The stable isotope bloodmeal analyses were based on variation in the natural abundance of carbon (13C/12C) and nitrogen (15N/14N) isotopes in ticks fed on different hosts. When compared to reference isotope signatures, this method discerned unique δ13C and δ15N signatures in the ticks fed on each host taxa yet could not discern multiple host species from O. turicata that fed on more than one host species. Given the significance of soft tick-borne zoonoses and animal diseases, elucidating host feeding patterns from field-collected ticks using these methods may provide insight for an ecological basis to disease management.
Introduction
The identification of host bloodmeal sources in arthropod vectors provides vital information in vector-borne disease ecology, which enables vector-specific control and a proactive vector–host–pathogen risk assessment (1–7). Numerous bloodmeal analyses have evolved over time. Serological methods, such as the precipitin test, which rely on antibody reaction to host blood date back to the 1940s (8, 9), and the advent of polymerase chain reactions (PCRs) and quantitative PCR (qPCR) have enabled a suite of DNA-based arthropod bloodmeal analysis techniques to be developed (10). DNA-based techniques for the bloodmeal analysis have been used successfully for a wide variety of arthropod vectors, including mosquitoes, kissing bugs, and black flies (10). However, some arthropod vectors with a prolonged generation time, starvation periods, and molting between life stages pose challenges to the DNA-based bloodmeal analyses.
The primary challenge of conducting bloodmeal analyses in arthropod vectors enduring starvation periods lasting months to years, such as in ticks, is that the DNA obtained from previous life stage bloodmeals is degraded during molting (11, 12). To overcome this challenge, techniques such as reverse line-blot hybridization have shown potential due to its improved sensitivity to low quantities of DNA and the ability to use a large panel of host-specific probes (13, 14). However, this approach to bloodmeal analysis may be limited by availability of existing host blood probe data and optimization procedures (10, 13, 14).
The application of stable isotopes (SIs) to tick bloodmeal analyses offers the advantage of not needing to rely on host blood DNA detection. SI analyses determine the relative ratios of heavy to lighter elements within the organism that are influenced by its diet (3, 15–18). Proof-of-concept studies indicate that SI ratios of carbon and nitrogen from host bloodmeals are detectable in hard ticks after feeding on known hosts and molting (19), with the ability to discern among host taxa for up to 34 weeks post-molt in Amblyomma americanum (L.) (7). However, differentiation between ticks fed on ecologically similar hosts (Peromyscus leucopus mice vs. Tamias striatus chipmunks) was not possible, suggesting that SI analyses for bloodmeal host detection may be useful in sorting ticks to the level of the feeding guild, but not to the host species (20). Further, SI analyses require different vertebrate hosts' unique SI profiles to interpret the results from arthropods (15, 18, 21).
Bloodmeal analysis studies for argasid ticks are relatively rare (22–27) compared to those conducted for ixodid species. Some argasid ticks, such as Ornithodoros turicata Dugès (Ixodida: Argasidae), are known to survive for years without a bloodmeal (28, 29). The medical–veterinary importance of O. turicata and the ease with which it can be reared and maintained in the laboratory make it a good model for evaluating DNA- and SI-based tools for host bloodmeal identification.
O. turicata is a well-established vector and reservoir of Borrelia turicatae, one of the spirochetes that can cause tick-borne relapsing fever (TBRF) (30–36) and a potential vector of the African swine fever virus (37, 38). Collection records indicate that the distribution of O. turicata ranges from southern Mexico to the southwestern United States, as well as the state of Florida (39–41). Despite its early description in 1876 and subsequent studies linking its vector potential to TBRF as early as the 1930s, the vector ecology and host preferences of O. turicata remain relatively unstudied. This knowledge gap may be a result of biological and behavioral attributes of O. turicata that pose challenges to conducting surveillance in its native environment. For example, O. turicata is generally considered a nocturnal organism with an affinity toward microhabitats found in caves, burrows, nests, and cavities with host activity and is seldom found in relatively accessible open environments (39, 42–44). It is a generalist with a broad host range including taxa of mammals, birds, and reptiles; has up to seven nymphal instars; and may require one or more bloodmeals at each life stage before molting to the next (40, 43). With each host feeding event lasting just a few minutes (45), O. turicata is rarely found attached to its host. Therefore, current survey methods for O. turicata and other argasid ticks are limited to labor-intensive and time-consuming techniques such as the CO2 baiting, debris-filtering methods (40, 46), and animal burrow vacuuming techniques (47).
The objective of this study is to compare DNA- and SI-based bloodmeal analyses on colonized O. turicata with known bloodmeals on vertebrates at different days post-feeding. The development of reliable techniques to identify host bloodmeals would provide valuable methods and applications to ecological studies and surveillance programs.
Materials and Methods
Tick (O. turicata) Colony
Adults and late-instar nymphs of O. turicata used in this study were obtained from a colony maintained at the Tick Research Laboratory, Texas A&M AgriLife Research, College Station, TX, United States. The colony originated from specimens collected in a natural cavern in Travis County, TX, United States in 1992. The O. turicata colony has been maintained under a 14:10 (light: dark) photoperiod, 25.0 ± 3.0°C, and 80–85% relative humidity and fed approximately once a year using young cockerels (Gallus gallus L.) as bloodmeal hosts according to procedures approved by the Institutional Animal Care and Use Committee of Texas A&M University (AUP no. 2014-255).
Cohort Preparation
Timelines and protocol overview are outlined in Table 1. Four O. turicata cohorts, each consisting of approximately 600 larvae, were prepared by transferring 30 larvae from the progeny of each of 20 female ticks using a camel-hair brush. The cohorts were reared to the fourth-instar nymph stage using different combinations of chicken (G. gallus L.), goat (Capra aegagrus hircus L.), and swine (Sus scrofa domesticus) blood. The first group was labeled “EC,” short for “Exclusively fed on Chicken,” and was reared exclusively on live chickens for four bloodmeals. The second group was labeled “CG,” short for fed on “Chicken and Goat,” and was reared on live chickens for three bloodmeals and a final bloodmeal on commercially acquired, mechanically defibrinated goat blood (Rockland Immunochemicals Inc., Limerick, PA, United States) via an artificial membrane protocol developed by Kim et al. (48). The third group was labeled “CS,” short for fed on “Chicken and Swine,” and was reared on live chickens for three bloodmeals and final bloodmeal on commercially acquired, mechanically defibrinated swine blood (Rockland Immunochemicals Inc., Limerick, PA, United States) via an artificial membrane. The fourth group was labeled “ES,” short for “Exclusively fed on Swine,” and was reared solely on commercially acquired, mechanically defibrinated swine blood via an artificial membrane. At 30-day intervals after their final bloodmeal (up to 9 months), a group of 10 ticks was harvested from each cohort, with five ticks serving as replicates for DNA-based analysis and five ticks serving as replicates for SI-based bloodmeal analysis shown in Table 1.
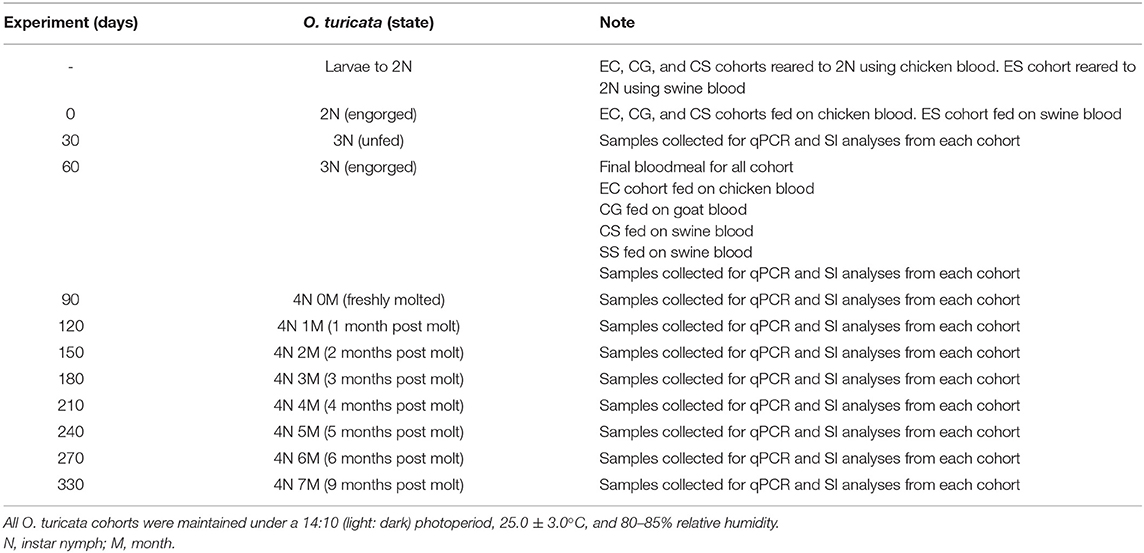
Table 1. Timeline for the development and sampling scheme of four experimental Ornithodoros turicata cohorts fed on different kinds of host blood.
DNA Extraction and qPCR Analysis
Ticks from each sample group (n = 5) outlined in Table 1 were used for DNA extraction and qPCR analysis. In summary, five ticks from each cohort (EC, CG, CS, and ES) were collected immediately after their last bloodmeal, after a molt (~30 days post last bloodmeal), for six consecutive months (~4-week interval), and at 9 months post-molt. Surface contaminants on each tick were removed by briefly placing the tick in a 50% bleach solution for 30 s and then washing with water as outlined by Graham et al. (49). The whole-body DNA extraction was performed per the manufacturer's instructions using the E.Z.N.A.® Tissue DNA Kit (Omega Bio-Tek, Norcross, GA, Unite States) with overnight lysis. DNA was extracted from each O. turicata by cutting it into two equal segments in a sterile centrifuge tube, exposing its midgut content to a lysis buffer solution with a final elution volume of 50 μl. DNA from aliquots of each host blood (15 μl per each host blood) used to feed O. turicata treatment groups for this study was also extracted to serve as positive controls for their respective treatment groups. Both water-template and no-template wells served as negative controls.
The qPCR analysis was performed to detect the cytochrome b (cytb) gene in the extracted DNAs using host blood-specific primers and probes, as previously described by Cupp et al. (50). The cytb gene was selected as the appropriate molecular marker for the bloodmeal analyses because the primers are vertebrate-specific and would not amplify O. turicata DNA (50). Primer and probe sequences used for qPCR are listed in Table 2. Moreover, each probe was tagged with a unique reporter dye to aid in differentiating between vertebrate hosts. The unmodified cytb primers and probes for chicken and goat were used as described by Woods et al. (51). The primer and probe for the swine blood designed in this study used the Beacon Designer 8.0 software (Premier Biosoft, Palo Alto, CA, United States) based on Sus scrofa mitochondrion genome (GenBank accession #AF034253.1).
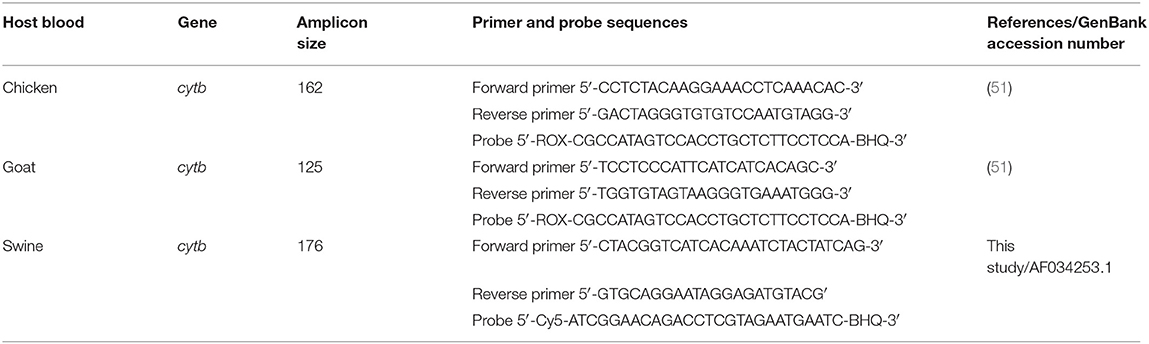
Table 2. Primer and probe sequences for host-specific cytb gene used as a molecular marker in qPCR assays to identify host blood source in colony-reared Ornithodoros turicata.
The LightCycler® 96 system (Roche Diagnostics Corporation., Indianapolis, IN, United States) was used for all qPCR analyses with the following conditions: initial denaturation at 95°C for 10 min, followed by 40 cycles at 95°C for 30 s and 60°C for 1 min. Subsequently, nuclease-free water and whole-blood DNA extracts were used as the qPCR negative and positive controls, respectively. Each qPCR assay used a 25-μl total reaction volume that had 400 nM of forward and reverse primers each, 200 nM of probe, and 4.5 μl of DNA template (concentration unknown) using the Bio-Rad iTaq Universal Master Mix (Bio-Rad, Hercules, CA, United States). A total of 750 qPCR assays were conducted on DNA extracts. DNA extracted from host blood (chicken: 211.7 ng/μl, swine: 9.26 ng/μl, or goat: 17.4 ng/μl) was used as positive controls in the assays. Among the 750 assays, 365 qPCR assays were labeled as “unmatched samples,” which denoted DNA extracts from O. turicata sample groups tested using host-specific primer and probes of blood that was not used to rear them. This was done to further assess any cross-reactivity across host blood. The remaining 385 qPCR assays were labeled as “matched samples,” denoting DNA extracts from O. turicata sample groups tested using host-specific primers and probes of blood used by the corresponding cohort. The matched samples included the ticks reared on two host species when the primer–probe set was specific to one of the hosts. The qPCR results were interpreted as positive when a DNA sample cycle threshold (Ct) value was <35. This threshold value was determined conservatively based on preliminary trials that showed that late and non-specific amplification of negative controls occurred at or above 36 cycles.
SI Analysis
SI analysis was conducted using O. turicata from each tick sample group (n = 5) collected concurrently as those gathered for qPCR. Elemental analysis isotope ratio mass spectrometry (EA-IRMS) at the Stable Isotope Geosciences Facility at Texas A&M University, College Station, TX, United States, was used to analyze individual ticks for carbon (13C/12C) and nitrogen (15N/14N) isotopic values as described by Hamer et al. (7). The EA combusted the tick and blood samples at 1,200°C, separating CO2 and N2 gases, and analyzed on the EA-IRMS. The standard delta (δ) notation δX = [(Rsample/Rstandard) – 1] × 1,000, where R was the ratio of the heavy to light SI in the sample and standard, was used to represent the results. Next, results were referenced according to the Vienna Pee Dee Belemnite (VPDB) carbonate standard for δ13C and relative to air for δ15N. Finally, the range of δ13C and δ15N values of samples for a 2-point calibration and internal laboratory standards every ~12 unknowns was used to measure analytical precision as described by Hamer et al. (7). Samples from each host blood type used to feed corresponding cohorts were used to generate reference isotope signatures in the SI analysis.
Statistical Data Analysis
The statistical program JMP® Pro 12 (SAS Co., Cary, NC, United States) was used for all statistical analyses. The exact Cochran–Armitage trend test was conducted to assess any difference in qPCR assay results of each O. turicata sample group (n = 5) based on the experiment days (length of starvation). A chi-square test was conducted to determine the associations between each tick's host feeding history (EC, CG, CS, and ES) and the qPCR results (positive or negative for each assay). Pillai's trace multivariate analysis of variance (MANOVA) was used to compare δ13C and δ15N values of host blood, all unfed third-instar nymphs, all engorged third-instar nymphs, sample groups from each cohort, and combined sample group values for all cohorts. When MANOVA indicated a significant difference, a post-hoc test using Tukey's honestly significant differences was conducted to assess pairwise differences in both δ13C and δ15N based on an alpha level of 0.05.
Results
qPCR Analysis
All 365 “unmatched samples” tested negative in the qPCR, which denotes no significant cross-reactions (P < 0.0001, CI = 0, 0.01) among host cytb genes and non-corresponding host primers and probes. The chicken cytb gene was detected in at least one replicate within each five-tick sample group fed on chicken blood in all EC, CG, and CS cohorts across the entire experiment period (Table 3). The O. turicata samples from the EC cohort had the highest overall qPCR-positive prevalence of 98%, followed by the samples from the CG cohort with 76% and the samples from the CS group with 60%. There were no significant differences in qPCR results of O. turicata samples based on the experiment day (length of starvation) in the EC cohort (P = 0.10, Cochran–Armitage trend test) and CG cohort (P = 0.35, Cochran–Armitage trend test). However, a significant difference was observed in the qPCR array results in tick samples from the CS cohort based on experiment days (P < 0.01, Cochran–Armitage trend test) (Table 3), indicating that the starvation period had affected the qPCR outcome.
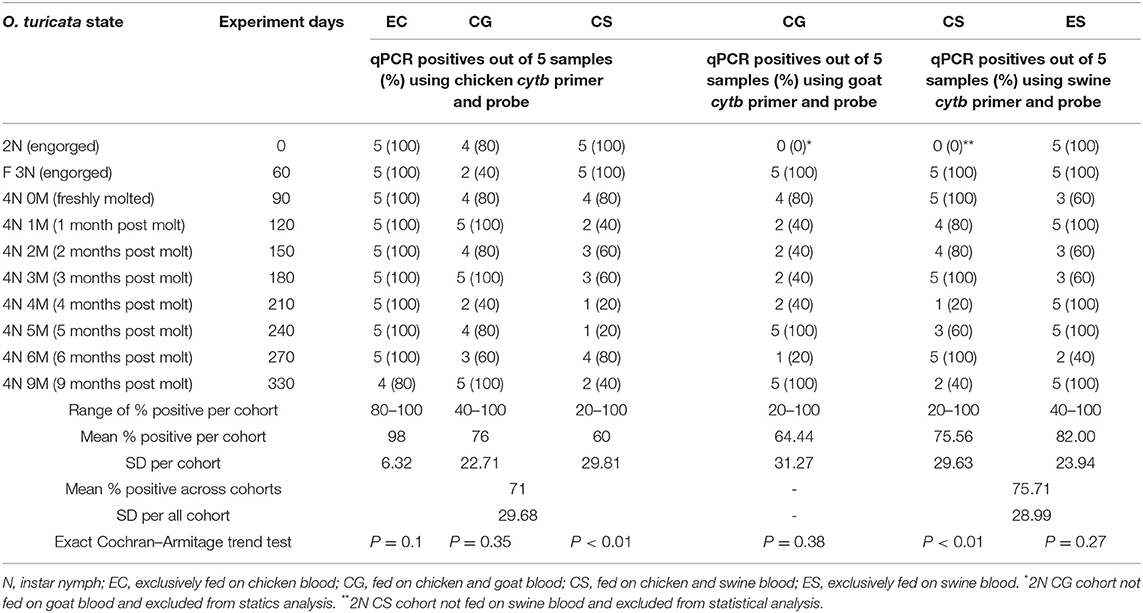
Table 3. Summary of qPCR assays (Ct value < 35) based on experiment days per Ornithodoros turicata tick sample group (n = 5) fed on chicken (Gallus gallus), goat (Capra aegagrus hircus), and swine (Sus scrofa domesticus) blood.
The goat cytb gene was detected in at least one replicate within each five-tick sample group fed on goat blood in the CG cohort during the entire experiment period (Table 3). The overall average qPCR-positive prevalence for goat DNA in O. turicata samples from the CG cohort was 64.4%. There were no significant differences in the qPCR assay results of O. turicata samples based on the length of starvation in the CG cohort (P = 0.38, Cochran–Armitage trend test) (Table 3). The swine cytb gene was detected in at least one replicate within each five-tick sample group fed on swine blood in both CS and ES cohorts during the entire experiment period (Table 3). The O. turicata samples from the ES cohort had a higher overall average qPCR-positive prevalence of 82.0%, followed by the samples from the CS cohort with 75.6%. There were no significant differences in the qPCR assay results of O. turicata samples based on the length of starvation in the ES cohort (P = 0.27, Cochran–Armitage trend test). However, a significant difference was observed in the tick samples from the CS cohort (P < 0.01, Cochran–Armitage trend test) (Table 3). Finally, there were no differences between the qPCR results of the tick samples based on the host blood (X2 = 2.33, df = 2, P = 0.31) (Table 4), indicating that the host blood did not affect the qPCR outcome.
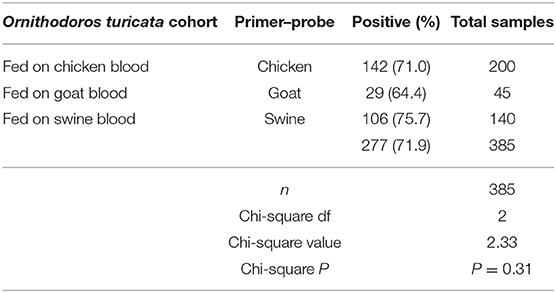
Table 4. Summary of qPCR assay results based on host blood-specific primers and probes.
SI Analysis
SI analysis results of δ13C and δ15N for each host blood were significantly different (F = 57.20; df = 4, 24; P < 0.01) (Figure 1). The post-hoc tests showed significant differences in δ13C for all pairwise combinations (P < 0.01 each), in which swine had the highest δ13C and goat had the lowest δ13C. The post-hoc test showed δ15N in swine blood was significantly higher than that in goat and chicken (P < 0.01 each).
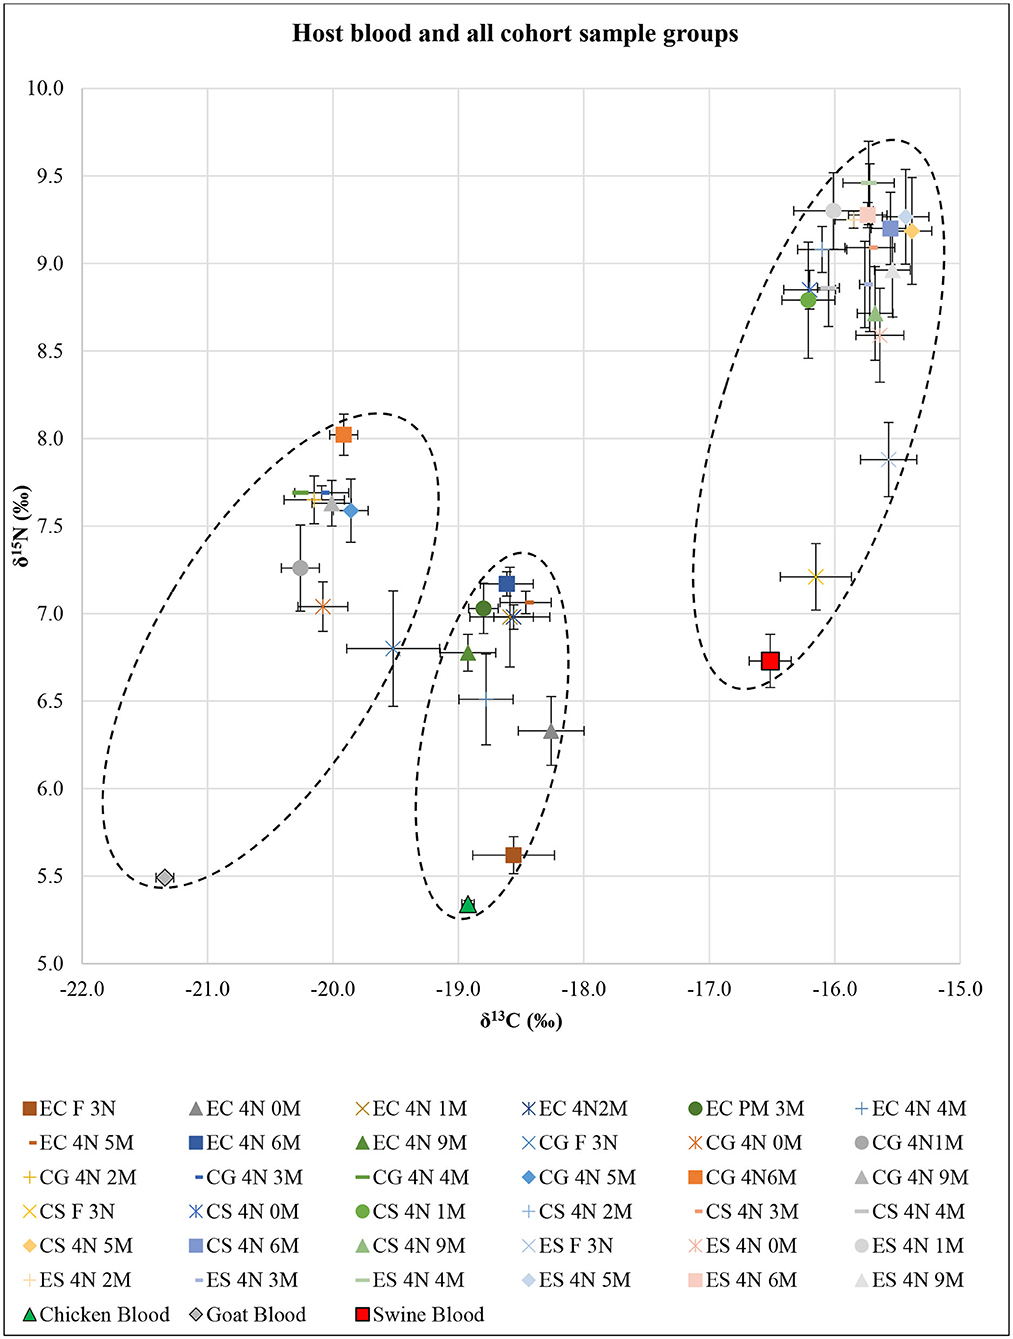
Figure 1. Isotopic results of all Ornithodoros turicata cohort sample groups based on post-molt time (n = 5 each) represented as δ13C and δ15N superimposed over the host blood results. X- and Y-axis error bars represent SEs around means. Dotted oval shapes encircle δ13C and δ15N values for each of the EC, CG, and CS+ES cohorts. EC, exclusively fed on chicken blood; CG, fed on chicken and goat blood; CS, fed on chicken and swine blood; ES, exclusively fed on swine blood; F 3N, third-instar nymph immediately after feeding; 4N 0M, fourth-instar nymph immediately after a molt; 4N 1M−4N 9M, fourth-instar nymph 1 month post-molt to fourth-instar nymph 9 months post-molt.
SI analysis results of δ13C and δ15N for unfed third-instar O. turicata nymph samples from each cohort showed significant differences (F = 4.65; df = 6, 32; P < 0.01) (Figure 1). The post-hoc tests showed no significant differences in either δ13C or δ15N between EC, CG, and CS cohorts. On the other hand, the post-hoc tests for δ13C and δ15N showed that the ES cohort was significantly different from the EC, CG, and CS cohorts (P < 0.01 each). Similarly, in engorged third-instar O. turicata nymph samples, there were significant differences among the cohorts in δ13C and δ15N (F = 29.46; df = 6, 32; P < 0.01) (Figure 1). The post-hoc tests for δ13C and δ15N showed significant differences (P < 0.01 each), except between ES and CS cohorts (P = 0.55).
SI analysis results of δ13C and δ15N for EC, CG, CS, and ES fourth-instar O. turicata nymph samples based on the time since starvation showed significant differences among sample groups [(F = 3.04; df = 16, 72; P < 0.01) for EC, (F = 3.10; df = 16, 72; P < 0.01) for CG, (F = 3.91; df = 16, 72; P < 0.01) for CS, and (F = 3.22; df = 16, 72; P < 0.01) for ES] (Figure 1). The post-hoc test for δ13C showed no significant differences between all cohort samples. However, the post-hoc test for δ15N generally indicated significant differences between engorged third-instar nymphs and all post-molt fourth-instar nymphs. There were significant differences between engorged third-instar nymphs and all post-molt fourth-instar nymphs (P < 0.01 each) in EC and CS, between engorged third-instar nymphs and 3, 4, and 6 months post-molt fourth-instar nymphs (P < 0.01 each) in CG, and between engorged third-instar nymphs and 1–6 and 9 months post-molt fourth-instar nymphs (P < 0.01 each) in ES.
The combined δ13C and δ15N SI values comparing all fourth-instar O. turicata nymph cohorts regardless of their post-feeding time (average SI value, n = 45 per cohort) showed significant differences among the cohorts (F = 117.46; df = 6, 352; P < 0.01) (Figure 1). The post-hoc tests for both δ13C and δ15N showed significant differences between cohorts (P < 0.01 each) except between CS and ES cohorts. There were three clusters of δ13C and δ15N values observed (shown by dotted oval shapes) that represented EC, CG, and CS+ES cohorts (Figure 1). An isotopic shift of increasing δ13C and δ15N with tick age was observed for all treatment groups.
Discussion
This study reports the first in-depth bloodmeal analysis of an experimentally fed argasid tick, O. turicata, using DNA- and SI-based techniques. The DNA-based bloodmeal analysis in this study accurately differentiated host blood in O. turicata cohorts including those receiving bloodmeals from different vertebrate species. Unexpectedly, the host-specific cytb gene was detectable in at least some replicates of each study group across the entire experiment period of 330 days using the DNA-based technique. Similarly, the SI-based bloodmeal analysis technique was proven capable of discerning the difference among O. turicata cohorts which fed on different single vertebrate host blood taxa (chicken, goat, or swine). However, the SI-based bloodmeal analysis failed to discern the difference between cohorts that fed only on blood from a single host taxon (e.g., swine only) from cohorts that fed on blood from two host taxa when the latter included the same vertebrate host blood as the single-host-blood cohorts (e.g., chicken then swine vs. swine only).
The SI analysis generated distinctive δ13C and δ15N values for each host blood as well as for the O. turicata cohorts that fed on different kinds of host blood. While the SI values of the host blood did not overlap directly with O. turicata that fed on the same host blood, a previous study has shown that the isotopic discrimination (i.e., the tick-blood spacing) was invariable, and an increase in nitrogen composition in the tick is expected relative to the composition of the blood on which the tick fed, given the increase in the level of the food chain (19). Furthermore, we observed an isotopic shift (increasing δ13C and δ15N) with tick age, which has also been observed in prior studies (7, 19) and which complicates the utility of this approach for tick bloodmeal analysis. SI analyses may be limiting when a large number of vertebrate species are expected as bloodmeal hosts. However, SI bloodmeal analysis could be viable if, during field or laboratory experiments, the vertebrate host community has restricted species richness and if the time post-feeding (e.g., >1 year) exceeds the ability of DNA-based approaches. However, sample cost is a consideration. The inclusion of an additional SI, sulfur (34S), is now available given that many laboratories have the 13C, 15N, and 34S combined analysis that can be used on the sample. However, the cost for the dual 13C-and-15N analysis is $8.50 per sample at the UC-Davis Stable Isotope Facility, while the cost of the 13C, 15N, and 34S triplex is $73.00 (https://stableisotopefacility.ucdavis.edu/index.html).
Prolonged detectability of vertebrate host DNA within O. turicata suggests that the processing and storing of host blood in O. turicata may be considerably different between argasid and ixodid species. Hamer et al. (7) conducted host-specific qPCR-based bloodmeal analysis on A. americanum and reported that the assay began to fail to detect host-specific cytb as early as 42 days post-feeding in adult sample groups and rarely detected the host beyond 40 weeks post-feeding. There are no clear explanations for differences in cytb integrity observed between these studies. Nonetheless, exploring the bloodmeal digestion process between A. americanum and O. turicata may elucidate a plausible explanation.
Bloodmeal processing in both ixodid and argasid species is composed of three phases. Hemolysis takes place during the first phase, which occurs immediately upon feeding and lasts 2 to 15 days. The second phase, also called the “rapid” digestion, takes place in the midgut of ticks and can last from several weeks to 3 months. Finally, the third phase, also called the “slow” digestion, occurs mainly in the apical branches of the diverticula and can last for years (52). The difference between ixodid and argasid tick digestion is the third digestion phase. Bloodmeal digestion in ixodid ticks occurs uniformly, and the ingested bloodmeal is evenly stored and consumed at a steady rate in the midgut as well as in the diverticula (52). On the other hand, bloodmeal digestion in the third phase of argasid ticks occurs at a variable rate because a substantial amount of bloodmeal is stored in the peripheral regions of the midgut diverticula with no digestive activity (52). This slow and uneven digestion of the bloodmeal allows argasid ticks to endure starvation that could last for years, as observed in O. turicata (45). In this study, O. turicata samples from CG and CS cohorts were able to maintain a detectable level of chicken cytb gene throughout two molts and starvation periods exceeding 9 months (Table 3). Indeed, the rate of biochemical processes (i.e., no digestive activity) in the peripheral regions of the midgut diverticula can slow down the digestion of the bloodmeal, thus prolonging the overall bloodmeal consumption (52). Nevertheless, the physical capacity of the peripheral regions of the midgut diverticula that store a previous bloodmeal may also force subsequent and newly acquired bloodmeal to be kept in the medial regions of the midgut where active digestion occurs (52). This “blocking” of storage space by the previous bloodmeal may allow residual bloodmeal from earlier feedings to remain for the entire tick life span of O. turicata, enabling qPCR analysis to detect multiple host cytb genes. In contrast, the qPCR analysis was useful in simultaneously detecting two host-specific cytb genes correctly across all O. turicata fed on multiple kinds of host blood. However, this documentation was based on the detection of a chicken bloodmeal which was taken prior to the goat or swine bloodmeal in the mixed-species sample groups. We did not attempt the reverse order by feeding the ticks on goat or swine and then chicken bloodmeals, which is important to note given that the bird blood likely had more DNA than the mammal blood.
The detectability of multiple host bloodmeals within O. turicata that experimentally fed on two species varied depending on the bloodmeal analysis techniques employed. The SI technique could not be used to discern the difference between single-host and multihost blood-fed O. turicata cohorts. For example, there were no differences between the overall δ13C and δ15N values of the CS and ES cohorts (Figure 1). Moreover, engorged third-instar nymphs from CS and ES cohorts showed no significant difference in their δ13C and δ15N values (Figure 1), despite each cohort being fed different kinds of host blood previously. This further strengthens the argument that the last bloodmeal O. turicata acquired determines the outcome of the SI analysis. In contrast, the qPCR analysis was useful in simultaneously detecting two host-specific cytb genes correctly across all O. turicata cohorts fed on multiple host blood. However, the detection of DNA in the different O. turicata cohorts ranged between one of five ticks to five of five ticks, indicating variation in either the retention of the DNA in the ticks or variation in the methodology (DNA extraction or qPCR). For example, we used 4.5 μl of template DNA from all samples and did not adjust based on the quantity of DNA, which was likely variable. Additionally, quantifying sample DNA and running these qPCR reactions in replicates would likely have strengthened the results and should be considered in future studies.
The duration of starvation could influence the outcomes of each type of bloodmeal analysis technique. For example, qPCR results for the CS cohort using swine-specific primers and probes seem to be influenced by the duration of starvation (Table 3). There was no logical explanation for this since the qPCR results of other groups, such as the ES cohort, which were also reared using swine blood were not affected by the duration of starvation. Since there were only five tick replicates per group, increasing the number of replicates per sample group may reduce the inconsistency observed in qPCR results for future studies. However, no sample tick group failed to retain detectable DNA at any time during the entire experiment period. Thus, it is uncertain how much improvement in the reproducibility of qPCR results can be made by increasing the number of ticks per sample group.
Different amounts of DNA that exist in different kinds of host blood provide another plausible explanation for the apparent influence of the starvation period on the outcomes of each type of bloodmeal analysis technique. Chicken blood, which consists of both immature and mature nucleated erythrocytes (53), presumably had higher overall DNA concentration in ticks. In contrast, goat and swine blood (and other mammals) are known to have immature nucleated erythrocytes that become anucleated once matured, attributing to relatively low DNA extract yield (54). While this study did not examine the proportion of cytb gene within the total DNA extract of host blood, an inference can be made based on the ubiquitous presence of the cytb genes in vertebrate hosts as part of their mitochondria, in that the relative proportions of cytb gene in the chicken, goat, and swine blood would be similar to that of total DNA extract (50, 55–57). Therefore, the O. turicata CS cohort, which fed on swine blood once, may not have had the chance to acquire and maintain the adequate amount of swine cytb gene throughout the entire experiment period compared to the O. turicata ES cohort, which had four opportunities to feed on swine blood. Moreover, the fact that the host blood type had no effect on the overall qPCR results of any tick sample groups (Table 4) further denigrates the significance of different qPCR results seen in the CS cohort. Therefore, an argument can be made that the inconsistency observed in qPCR results based on the length of starvation seen in CS cohort may not be attributed to a single reason but due to combinations of low sample number, lower DNA extract yield in swine blood, and variable rate of bloodmeal digestion of O. turicata.
Starvation duration influenced the outcomes of SI analysis differently than that of qPCR analysis. First, patterns of increased δ13C and δ15N values in engorged third-instar nymphs in each cohort compared to their corresponding host blood were observed. This observation could be due to SI (e.g., nitrogen) being enriched (15, 17, 58). The increase of δ13C and δ15N values in engorged A. americanum was also previously observed (7). However, the SI analysis failed to provide conclusive evidence for the SI fractionation, which occurs due to nutrient stress such as starvation. Such physiological stresses cause nitrogen fractionation via changes in the rate of amino acid consumptions, uric acid formations, and secretions (17, 21). Indeed, Hamer et al. (7) also reported changes in δ13C over time in A. americanum fed on chicken; however, data from this study were inconclusive to make such inference. This may be due to the inconsistent digestion rate in O. turicata mentioned above.
The applicability and limitation of the bloodmeal analysis techniques used in this study must be carefully considered in the contexts of O. turicata biology and ecology. For example, the qPCR analysis will require a catalog of specific host genes, primers, and probes. In contrast, SI analysis will require blood SI signatures of the animals circulating in the O. turicata habitat in order to conduct bloodmeal analyses accurately. Furthermore, the longevity of O. turicata ticks may pose unique considerations for understanding the vertebrate hosts that are important for feeding ticks. The longevity of A. americanum is typically <3 years, and overlapping generations found in their population structure may rarely consist of more than two generations (59). In this case, tick host feeding patterns observed in the population may closely resemble the actual host utilization as the host population dynamic may not change drastically within the typical generation time. On the other hand, the longevity of O. turicata may be measured in decades (28, 45). Thus, ticks may outlive their hosts or live through the drastic changes in host population composition. For example, progressive feral swine invasion (60) has increased tick host diversity and abundance (61), impacting exposure to and interactions with O. turicata (62, 63). Consequently, overlapping O. turicata generations may occur. In this case, bloodmeal analysis may not accurately depict host utilization of older generation ticks that may have had exclusive access to hosts that are no longer available or diminished to younger-generation ticks.
In summary, the bloodmeal analysis techniques evaluated in this study demonstrated promising tools for determining host utilization of O. turicata. The DNA-based bloodmeal analysis underscored the feasibility to discern multiple-host utilization by O. turicata and confirmed the applicability of the cytb gene as a host-specific molecular marker. The SI-based bloodmeal analysis was able to distinguish host blood, O. turicata cohorts fed on different kinds of host blood, and nitrogen enrichment in O. turicata post-bloodmeal consumption, although the utility of this approach in the future may be limited to unique circumstances. Our future work is applying the DNA-based bloodmeal analysis to O. turicata collected in the field [(64) in review]. A comprehensive understanding of vector ecology, including host utilization, is important for studying the natural history of soft ticks, their associated tick-borne pathogens, and applications of techniques for surveillance and intervention strategies.
Data Availability Statement
The raw data supporting the conclusions of this article will be made available by the authors, without undue reservation.
Ethics Statement
The animal study was reviewed and approved by Institutional IACUC committee reviewed and approved the protocol.
Author's Note
The content of this manuscript has been published in part, as a chapter in the 2017 dissertation of Hee J. Kim (65).
Author Contributions
All authors made substantial intellectual contributions to the project including experimental design, protocol execution, assessment of results, and preparation of the manuscript.
Funding
This study was supported in part by the USDA Formula Animal Health program project no. TEX09534 and by Texas A&M AgriLife Research Project TEX08911.
Conflict of Interest
The authors declare that the research was conducted in the absence of any commercial or financial relationships that could be construed as a potential conflict of interest.
Acknowledgments
We thank Lisa Auckland for laboratory assistance, the Stable Isotope Geosciences Facility at Texas A&M University for conducting the stable isotope analysis, and Dr. Mark Olson for critically reviewing the manuscript.
References
1. Boakye DA, Tang J, Truc P, Merriweather A, Unnasch TR. Identification of bloodmeals in haematophagous diptera by cytochrome B heteroduplex analysis. Med Vet Entomol. (1999) 13:282–7. doi: 10.1046/j.1365-2915.1999.00193.x
2. Apperson CS, Hassan HK, Harrison BA, Savage HM, Aspen SE, Farajollahi A, et al. Host feeding patterns of established and potential mosquito vectors of West Nile virus in the eastern United States. Vector Borne Zoonotic Dis. (2004) 4:71–82. doi: 10.1089/153036604773083013
3. Rasgon JL. Stable isotope analysis can potentially identify completely-digested bloodmeals in mosquitoes. PLoS ONE. (2008) 3:1–3. doi: 10.1371/journal.pone.0002198
4. Keesing F, Belden LK, Daszak P, Dobson A, Harvell CD, Holt RD, et al. Impacts of biodiversity on the emergence and transmission of infectious diseases. Nature. (2010) 468:647–52. doi: 10.1038/nature09575
5. Reisen WK. Landscape epidemiology of vector-borne diseases. Annu Rev Entomol. (2010) 55:461–83. doi: 10.1146/annurev-ento-112408-085419
6. Bolzoni L, Rosà R, Cagnacci F, Rizzoli A. Effect of deer density on tick infestation of rodents and the hazard of tick-borne encephalitis. II: population and infection models. Int J Parasitol. (2012) 42:373–81. doi: 10.1016/j.ijpara.2012.02.006
7. Hamer SA, Weghorst AC, Auckland LD, Roark EB, Strey OF, Teel PD, et al. Comparison of DNA and carbon and nitrogen stable Isotoie-based techniques for identification of prior vertebrate hosts of ticks. J Med Entomol. (2015) 52:1–7. doi: 10.1093/jme/tjv063
8. Arnold EH, Simmons SW, Fawcett DG. Precipitin technique for determining mosquito blood meals. Public Heal Rep. (1946) 61:1244–9. doi: 10.2307/4585804
9. Tempelis CH. Review article: host-feeding patterns of mosquitoes, with a review of advances in analysis of blood meals by serology. J Med Entomol. (1975) 11:635–53. doi: 10.1093/jmedent/11.6.635
10. Kent RJ. Molecular methods for arthropod bloodmeal identification and applications to ecological and vector-borne disease studies. Mol Ecol Res. (2009) 9:4–18. doi: 10.1111/j.1755-0998.2008.02469.x
11. Pichon B, Rogers M, Egan D, Gray J. Blood-meal analysis for the identification of reservoir hosts of tick-borne pathogens in Ireland. Vector Borne Zoonotic Dis. (2005) 5:172–80. doi: 10.1089/vbz.2005.5.172
12. Léger E, Liu X, Masseglia S, Noël V, Vourch G, Bonnet S, et al. Reliability of molecular host-identification methods for ticks: an experimental in vitro study with Ixodes ricinus. Parasit Vectors. (2015) 8:433. doi: 10.1186/s13071-015-1043-7
13. Humair P-F, Douet V, Cadenas FM, Schouls LM, Van De Pol I, et al. Molecular identification of bloodmeal source in Ixodes ricinus ticks using 12S rDNA as a genetic marker. J Med Entomol. (2007) 44:869–80. doi: 10.1603/0022-2585(2007)44(869:MIOBSI)2.0.CO
14. Scott MC, Harmon JR, Tsao JI, Jones CJ, Hickling GJ. Reverse line blot probe design and polymerase chain reaction optimization for bloodmeal analysis of ticks from the eastern United States. J Med Entomol. (2012) 49:697–709. doi: 10.1603/ME11162
15. DeNiro MJ, Epstein S. Influence of diet on the distribution of nitrogen isotopes in animals. Geochim Cosmochim Acta. (1981) 45:341–51. doi: 10.1016/0016-7037(81)90244-1
16. Kloft WJ. Radioisotopes in vector research. In: Kerry FH, editor. Adv. Dis. Vector Res. New York, NY: Springer (1992). p. 41–66. doi: 10.1007/978-1-4612-2910-0_2
17. Vanderklift MA, Ponsard S. Sources of variation in consumer-diet δ15N enrichment: a meta-analysis. Oecologia. (2003) 136:169–82. doi: 10.1007/s00442-003-1270-z
18. Hood-Nowotny R, Knols BGJ. Stable isotope methods in biological and ecological studies of arthropods. Entomol Exp Appl. (2007) 124:3–16. doi: 10.1111/j.1570-7458.2007.00572.x
19. Schmidt O, Dautel H, Newton J, Gray JS. Natural isotope signatures of host blood are replicated in moulted ticks. Ticks Tick Borne Dis. (2011) 2:225–7. doi: 10.1016/j.ttbdis.2011.09.006
20. LoGiudice K, Kurchena K, Christopher K, Scott N. Exploration of stable isotope analysis for tick host identification. Ticks Tick Borne Dis. (2018) 9:151–4. doi: 10.1016/j.ttbdis.2017.08.010
21. Hobson KA, Clark RG. Assessing avian diets using stable isotopes II: factors influencing diet-tissue fractionation. Condor. (1992) 189–197. doi: 10.2307/1368808
22. Palma M, I., Lopes de Carvalho, Osório H, Zé-Zé L, Cutler SJ, Núncio MS. Portuguese Hosts for Ornithodoros erraticus Ticks. Vector-Borne Zoonotic Dis. (2013) 13:775–7. doi: 10.1089/vbz.2012.1070
23. Boctor FN. Biochemical and physiological studies of certain ticks (Ixodoidea). Free amino acids in female Argas (Persicargas) Arboreus Kaiser, Hoogstraal & Kohls (Argasidae) analyzed by gas-liquid chromatography. J Med Entomol. (1972) 9:201–4. doi: 10.1093/jmedent/9.3.201
24. Minoura H, Chinzei Y, Kitamura S. Ornithodoros moubata: host immunoglobulin G in tick hemolymph. Exp Parasitol. (1985) 60:355–63. doi: 10.1016/0014-4894(85)90042-6
25. Chinzei Y, Minoura H. Host immunoglobulin G titre and antibody activity in haemolymph of the tick, Ornithodoros moubata. Med Vet Entomol. (1987) 1:409–16. doi: 10.1111/j.1365-2915.1987.tb00371.x
26. Gill JS, Rowley WA, Bush PJ, Viner JP, Gilchrist MJR. Detection of human blood in the bat tick carios (Ornithodoros) kelleyi (Acari: Argasidae) in Iowa. J Med Entomol. (2004) 41:1179–81. doi: 10.1603/0022-2585-41.6.1179
27. McCoy BN, Raffel SJ, Lopez JE, Schwan TG. Bloodmeal size and spirochete acquisition of Ornithodoros hermsi (Acari: Argasidae) during feeding. J Med Entomol. (2010) 47:1164–72. doi: 10.1603/ME10175
28. Francis E. Longevity of the tick Ornithodoros turicata and of Spirochaeta recurrentis with this tick. Public Heal Rep. (1938) 53:2220–41. doi: 10.2307/4582740
29. Adeyeye OA, Butler JF. Population structure and seasonal intra-burrow movement of Ornithodoros turicata (Acari: Argasidae) in gopher tortoise burrows. J Med Entomol. (1989) 26:279–83. doi: 10.1093/jmedent/26.4.279
30. Fihn S, Larson EB. Tick-borne relapsing fever in the Pacific Northwest: an underdiagnosed illness? West J Med. (1980) 133:203.
31. Thompson RS, Burgdorfer W, Russell R, Francis BJ. Outbreak of tick-borne relapsing fever in Spokane County, Washington. JAMA. (1969) 210:1045–50. doi: 10.1001/jama.210.6.1045
33. Dworkin MS, Schwan TG, Anderson DE. Tick-borne relapsing fever in North America. Med Clin North Am. (2002) 86:417–33. doi: 10.1016/S0025-7125(03)00095-6
34. Trevejo RT, Schriefer ME, Gage KL, Safranek TJ, Orloski KA, Pape WJ, et al. An interstate outbreak of tick-borne relapsing fever among vacationers at a Rocky Mountain cabin. Am J Trop Med Hyg. (1998) 58:743–7. doi: 10.4269/ajtmh.1998.58.743
35. Cutler SJ. Relapsing fever–a forgotten disease revealed. J Appl Microbiol. (2010) 108:1115–22. doi: 10.1111/j.1365-2672.2009.04598.x
36. Davis GE. Ornithodoros turicata: the possible vector of relapsing fever in southwestern Kansas. Public Heal Rep. (1936) 51:1719. doi: 10.2307/4582025
37. Butler JF, Gibbs EPJ. Distribution of potential soft tick vectors of African swine fever in the Caribbean region (Acari: Argasidae). Prev Vet Med. (1984) 2:63–70. doi: 10.1016/0167-5877(84)90049-7
38. Hess WR, Endris RG, Haslett TM, Monahan MJ, McCoy JP. Potential arthropod vectors of African swine fever virus in North America and the Caribbean basin. Vet Parasitol. (1987) 26:145–55. doi: 10.1016/0304-4017(87)90084-7
39. Cooley RA, Kohls GM. The Argasidae of North America, Central America and Cuba. Notre Dame, IN: The University Press (1944).
40. Donaldson TG, Pèrez de León AA, Li AI, Castro-Arellano I, Wozniak E, Boyle WK, et al. (2016). Assessment of the geographic distribution of Ornithodoros turicata (Argasidae): climate variation and host diversity. PLoS Negl Trop Dis. 10:e0004383. doi: 10.1371/journal.pntd.0004383
41. Guzman-Cornejo C, Herrera-Mares A, Robbins RG, Rebollo-Hernandez A. The soft ticks (Parasitiformes: Ixodida: Argasidae) of Mexico: species, hosts, geographical distribution. Zootaxa. (2019) 4623:485–525. doi: 10.11646/zootaxa.4623.3.3
42. Rawlings JA. An overview of tick-borne relapsing fever with emphasis on outbreaks in Texas. Tex Med. (1995) 91:56–9.
43. Beck AF, Holscher KH, Butler JF. Life cycle of Ornithodoros turicata americanus (Acari: Argasidae) in the laboratory. J Med Entomol. (1986) 23:313–9. doi: 10.1093/jmedent/23.3.313
44. Milstrey EG. Bionomics and ecology of Ornithodoros (P.) turicata americanus (Marx) (Ixodoidea: Argasidae) and other commensal invertebrates present in the burrows of the Gopher Tortoise, Gopherus polyphemus Daudin. Ph.dissertation D. Gainesville, FL: University of Florida (1987). p. 260.
45. Davis GE. Ornithodoros turicata: the male; feeding and copulation habits, fertility, span of life, and the transmission of relapsing fever spirochetes. Public Heal Rep. (1941) 56:1799–802. doi: 10.2307/4583854
46. Niebuhr CN, Breeden JB, Lambert BD, Eyres AI, Haefele HJ, Kattes DH. Off-host collection methods of the Otobius megnini (Acari: Argasidae). J Med Entomol. (2013) 50:994–8. doi: 10.1603/ME13020
47. Butler JF, Holscher KH, Adeyeye O, Gibbs EPJ. Sampling techniques for burrow dwelling ticks in reference to potential African swine fever virus vectors. In: Griffiths DA, Bowman CE, editors. Acarol. VI. Chichester: Ellis Horwood Ltd (1984). p. 1065–74.
48. Kim HJ, Filatov S, Lopez JE, Peréz de León AA, Teel PD. Blood feeding of Ornithodoros turicata larvae using an artificial membrane system. Med Vet Entomol. (2017) 31:230–3. doi: 10.1111/mve.12223
49. Graham CB, Black Iv WC, Boegler KA, Montenieri JA, Holmes JL, Gage KL, et al. Combining real-time polymerase chain reaction using SYBR Green I detection and sequencing to identify vertebrate bloodmeals in fleas. J Med Entomol. (2012) 49:1442–52. doi: 10.1603/ME12071
50. Cupp EW, Zhang D, Yue X, Cupp MS, Guyer C, Sprenger TR, et al. Identification of reptilian and amphibian blood meals from mosquitoes in an Eastern Equine Encephalomyelitis Virus focus in central Alabama. Am J Trop Med Hyg. (2004) 71:272–6. doi: 10.4269/ajtmh.2004.71.272
51. Woods ME, Montenieri JA, Eisen RJ, Zeidner NS, Borchert JN, Laudisoit A, et al. Identification of flea blood meals using multiplexed real-time polymerase chain reaction targeting mitochondrial gene fragments. Am J Trop Med Hyg. (2009) 80:998–1003. doi: 10.4269/ajtmh.2009.80.998
52. Sonenshine DE, Anderson JM. Mouthparts digestive system. In: Sonenshine DE, Roe RM, editors. Biol. Ticks. New York, NY: Oxford University Press (2014). p. 122–62.
54. Lazarides E. From genes to structural morphogenesis: the genesis and epigenesis of a red blood cell. Cell. (1987) 51:345–56. doi: 10.1016/0092-8674(87)90631-3
55. Borst P, Kroon AM. Mitochondrial DNA: physicochemical properties, replication, genetic function. Int Rev Cytol. (1969) 26:107–90. doi: 10.1016/S0074-7696(08)61635-6
56. Kocher TD, Thomas WK, Meyer A, Edwards S, Pääbo S, Villablanca FX, et al. Dynamics of mitochondrial DNA evolution in animals: amplification and sequencing with conserved primers. Proc Natl Acad Sci USA. (1989) 86:6196–200. doi: 10.1073/pnas.86.16.6196
57. Chiu RWK, Chan LYS, Lam NYL, Tsui NBY, Ng EKO, Rainer TH, et al. Quantitative analysis of circulating mitochondrial DNA in plasma. Clin Chem. (2003) 49:719–26. doi: 10.1373/49.5.719
58. Minagawa M, Wada E. Stepwise enrichment of 15 N along food chains: further evidence and the relation between δ 15 N and animal age. Geochim Cosmochim Acta. (1984) 48:1135–40. doi: 10.1016/0016-7037(84)90204-7
59. Apanaskevich DA, Oliver HJ Jr. Life cycles natural history of ticks. In: Sonenshine DE, Roe RM, editors. Biol. Ticks. New York, NY: Oxford University Press (2014). p. 59–73.
60. Lewis JS, Corn JL, Mayer JJ, Jordan TR, Farnsworth ML, Burdett CL, et al. Historical, current, and potential population size estimates of invasive wild pigs (Sus scrofa) in the United States. Biol Invasions. (2019) 21:2373–84. doi: 10.1007/s10530-019-01983-1
61. Sanders DM, Schuster AL, McCardle P, Strey OF, Blankenship TL, Teel PD. Ixodid ticks associated with feral swine in Texas. J Vector Ecol. (2013) 38:361–73. doi: 10.1111/j.1948-7134.2013.12052.x
62. Golnar AJ, Martin E, Wormington JD, Kading RC, Teel PD, Hamer SA, et al. Reviewing the potential vectors and hosts of African Swine Fever Virus transmission in the United States. Vector-Borne Zoonotic Dis. (2019) 19:512–24. doi: 10.1089/vbz.2018.2387
63. Kim HJ, Krishnavajhala A, Armstrong BA, Pérez De León AA, Filatov S, Teel PD, et al. Humoral immune response of pigs, Sus scrofa domesticus, upon repeated exposure to blood-feeding by Ornithodoros turicata Duges (Ixodida: Argasidae). Parasit Vectors. (2020). 13:8. doi: 10.1186/s13071-020-3931-8
64. Busselman RE, Olson MF, Martinez V, Davila E, Briggs C, Eldridge DS, et al. Host bloodmeal identification in cave-dwelling Ornithodoros turicata Dugés (Ixodida: Argasidae), Texas, USA. Front Vet Sci. (2021) 8:639400. doi: 10.3389/fvets.2021.639400
Keywords: Ornithodoros turicata, bloodmeal analysis, stable isotope, soft tick, DNA-based technique
Citation: Kim HJ, Hamer GL, Hamer SA, Lopez JE and Teel PD (2021) Identification of Host Bloodmeal Source in Ornithodoros turicata Dugès (Ixodida: Argasidae) Using DNA-Based and Stable Isotope-Based Techniques. Front. Vet. Sci. 8:620441. doi: 10.3389/fvets.2021.620441
Received: 22 October 2020; Accepted: 11 January 2021;
Published: 17 February 2021.
Edited by:
Sebastián Muñoz-Leal, University of Concepcion, ChileReviewed by:
Karen Denise McCoy, Centre National de la Recherche Scientifique (CNRS), FranceAttila D. Sándor, University of Agricultural Sciences and Veterinary Medicine of Cluj-Napoca, Romania
Copyright © 2021 Kim, Hamer, Hamer, Lopez and Teel. This is an open-access article distributed under the terms of the Creative Commons Attribution License (CC BY). The use, distribution or reproduction in other forums is permitted, provided the original author(s) and the copyright owner(s) are credited and that the original publication in this journal is cited, in accordance with accepted academic practice. No use, distribution or reproduction is permitted which does not comply with these terms.
*Correspondence: Pete D. Teel, cHRlZWxAdGFtdS5lZHU=