 Tanawat Chaiphongpachara
 Thekhawet Weluwanarak2
 Tanasak Changbunjong
- 1Department of Public Health and Health Promotion, College of Allied Health Sciences, Suan Sunandha Rajabhat University, Bangkok, Thailand
- 2The Monitoring and Surveillance Center for Zoonotic Diseases in Wildlife and Exotic Animals, Faculty of Veterinary Science, Mahidol University, Nakhon Pathom, Thailand
- 3Department of Pre-clinic and Applied Animal Science, Faculty of Veterinary Science, Mahidol University, Nakhon Pathom, Thailand
Tabanus rubidus (Wiedemann, 1821) (Diptera: Tabanidae) is a hematophagous insect of veterinary and medical importance and is the predominant Tabanus spp. in Thailand. It is a potential mechanical vector of Trypanosoma evansi, which causes surra in domestic and wild animals. Wing geometric morphometrics is widely used as morphological markers for species identification and to assess the insect population structure. Herein, we investigated the intraspecific variation in wing geometry among T. rubidus populations in Thailand using landmark-based geometric morphometric analysis. Tabanus rubidus females were collected from five populations in four geographical regions in Thailand. The left wings of 240 specimens were removed and digitized using 22 landmarks for analysis. While wing size variations were found between some populations, wing shape variations were detected in all. These intraspecific variations in T. rubidus populations indicate an adaptive response to the local environmental conditions.
Introduction
Hematophagous dipterans or blood-sucking insects are major causes of veterinary and medical diseases worldwide, as they carry and transmit several pathogens to animals and humans (1). Horse flies (Tabanus spp.), an important blood-sucking insect species, are members of the family Tabanidae, with approximately 4,400 known species (2), of which 1,300 are in the genus Tabanus (3). As adult female horse flies require blood meals for egg production and development, they cause severe irritation, stress, blood loss, reduced feed intake, decreased weight, and decreased milk production in livestock, leading to economic losses (2, 4). They are major mechanical vectors of pathogens including viruses, bacteria, protozoa, and helminths in livestock, pets, and wildlife (2, 4), and can also sometimes transmit these to humans (5). Adult male horse flies cannot transmit diseases (non-vector) as they are not hematophagous and only feed on flower nectar or natural sugar sources (2). It is crucial to understand the biology of horse flies in the natural environment in order to control their population in the target areas.
Thailand is a tropical country where diverse species of horse flies are abundantly found (45 reported species) (6) with Tabanus rubidus (Wiedemann, 1821) being most predominant (6, 7). This species was confirmed to be mechanical vectors of pathogens like Clostridium chauvoei (causing gas gangrene) and Bacillus anthracis (causing anthrax) (2). Additionally, it is also suspected to transmit Trypanosoma evansi, which causes trypanosomosis (surra) in horses, cattle, and buffaloes (5, 8). Recently, Changbunjong et al. (6) surveyed Tabanus species in different habitats in Thailand and reported that Tabanus striatus (25.45%), followed by Tabanus megalops (21.36%), T. rubidus (14.82%), Tabanus tamthaiorum (7.90%), and Tabanus oxybeles (6.38%), are the five most abundant species. Moreover, they also revealed that the abundance of horse flies depends on the geographical areas, consistent with other studies showing relationship between environmental and geographical conditions and the number of horse flies (9), and that some morphological features may be linked to environmental adaptation (10).
It is imperative to understand how different areas affect insect vectors to control and monitor their natural populations as some have disease transmission-related behaviors between areas. For example, Wamaket et al. (11) surveyed the behavior of Anopheles mosquitoes as malaria vectors in many areas of southern Thailand, and found that each species has different bite times in different areas. Furthermore, many vector species also display phenotypic trait variations within species (intraspecific variation) (12).
Intraspecific variation arising from genetic and phenotypic diversity within and among populations is essential for adaptation in response to different environmental conditions (13). For instance, morphological characteristics, such as the forewing and hindwing sizes of grasshoppers (Trilophidia annulata), varied among populations depending on ecological, climatic, and geographical factors (14). Wing geometry, including size and shape, is a good indicator to investigate phenotypic adaptations to specific environments (15). The insect size varies highly based on environmental conditions (16). A larger wing size in insects is associated with longer life spans, allowing them to spread pathogens for a long period of time in nature (17). As for wing shape of insects, it is a recognized, species-specific characteristic associated with genetic background (18). Moreover, Morales Vargas et al. (19) demonstrated that variations in wing shape indicate geographic differences.
Wing geometric morphometrics is an effective tool used to examine variability in wing size and shape of insects (20, 21). This technique was used to study the intraspecific variation for insect vectors such as mosquitoes [Anopheles (Cellia) epiroticus] (22, 23), sand flies (Phlebotomus stantoni and Sergentomyia hodgsoni) (24), stable flies (Stomoxys calcitrans) (25), tsetse flies (Glossina palpalis) (26), and horse flies (Tabanus bromius) (27). However, the microgeographic wing variation of T. rubidus remains unknown, although it is the dominant species in several countries including Thailand.
Herein, we used landmark-based geometric morphometrics to examine intraspecific variation in wing size and shape among five populations of T. rubidus in Thailand. Our results on wing variations can elucidate population morphological dynamics and microevolution patterns of this vector to develop effective control measures.
Materials and methods
Ethical considerations
This study was reviewed and approved by the Animal Care and Use Committee, Faculty of Veterinary Science, Mahidol University, Thailand (Ethics Approval Number: MUVS-2020-01-01).
Specimen collection and species identification
A total of five populations of T. rubidus, representing four different geographical regions in Thailand—Chiang Mai (Northern region), Nakhon Ratchasima (Northeastern region), Uthai Thani (Central region), Singburi (Central region), and Chumphon (Southern region)—were selected based on a report by Changbunjong et al. (28) (Figure 1A and Table 1). Adult female horse flies were collected using five Nzi Traps (29) (Figure 1B) per population for two consecutive days from 06:00 to 18:00 h between February and November 2020. Flies were collected at 2 or 3 h intervals to prevent specimen damage. They were euthanized by freezing at −10°C, placed individually in 1.5 ml microcentrifuge tubes, labeled by their population, and brought back to the Vector-Borne Diseases Research Unit, Faculty of Veterinary Science, Mahidol University, Nakhon Pathom, Thailand. Furthermore, T. rubidus specimens (Figure 1C) were identified based on morphological characters using the taxonomic key by Burton (30) under a stereomicroscope (Nikon AZ 100, Nikon Corp, Tokyo, Japan) and stored at −20°C for further specimen preparation.
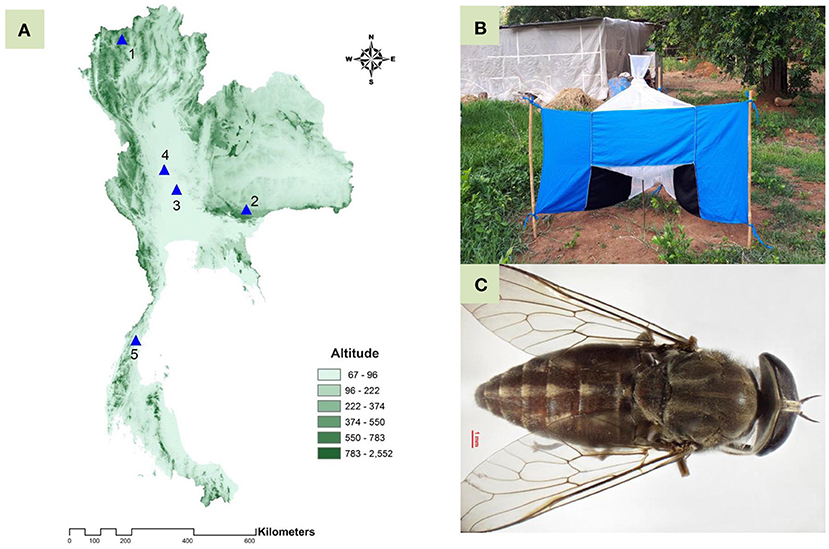
Figure 1. Topographic map of Thailand showing five populations of Tabanus rubidus: 1, Chiang Mai; 2, Nakhon Ratchasima; 3, Uthai Thani; 4, Singburi; and 5, Chumphon (A); Nzi Trap used for collecting specimens from genus Tabanus (B); and adult T. rubidus female specimen (C).
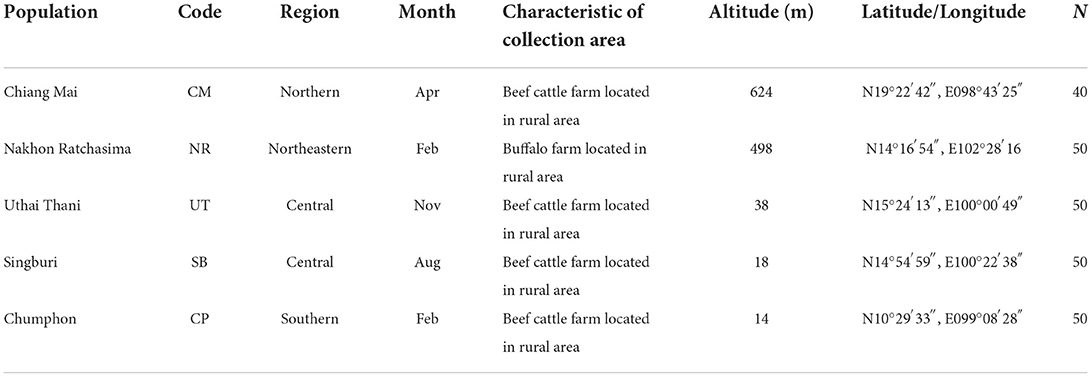
Table 1. Details of population, month, and number (n) of female Tabanus rubidus specimens used for the landmark-based geometric morphometric analysis.
Specimen preparation and data collection
Each left wing from an adult female T. rubidus was detached from the thorax using a sterilized blade and mounted on a microscope slide using Hoyer's mounting medium. Further, each wing slide was photographed with a digital camera connected to a stereomicroscope (Nikon AZ 100, Nikon Corp, Tokyo, Japan) and a 1-mm scale unit was added to each wing image. All left wing images were digitized based on coordinates of 22 landmarks covering all intersections of wing veins (31) (Figure 2). Landmark digitization, geometric morphometric analyses, and graphical outputs were performed using XYOM online tool (32) (https://xyom.io/me).
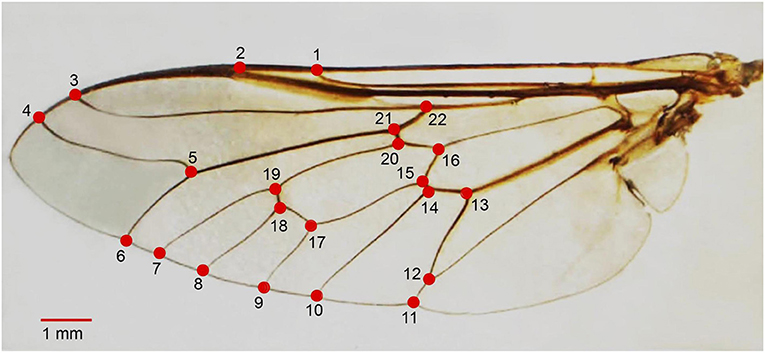
Figure 2. Position of the 22 landmarks on the left wing of adult female Tabanus rubidus used for geometric morphometric analysis.
Repeatability and allometry
To precisely digitize the coordinate landmarks, 20 T. rubidus wings were randomly selected and digitized twice by the same person (repeatability test). The measurement error of landmark digitization was estimated by the repeatability index, which computed based on the Procrustes analysis of variance (ANOVA) method, as described by Arnqvist and Mårtensson (33). To assess the effect of wing size related wing shape variation (allometry), we used linear regression based on discriminant factor (DF) (shape variable) and centroid size (CS) (size variable) and evaluated using the determination coefficient (r2).
Wing size analyses
Overall wing size (also called global size) of T. rubidus was estimated by the CS as described by Bookstein (34). The wing CS variation among T. rubidus populations were illustrated using box plots. The average wing CS differences between populations were performed using one-way ANOVA followed by Bonferroni post-hoc test. The statistical significance was estimated using a non-parametric permutation test (1,000 permutations) at p-value < 0.05.
Wing shape analyses
To extract wing shape variables, each landmark dataset was superimposed using Generalized Procrustes Analysis. The principal components of wing shape variables were used as final variables. Visual comparison of shape changes across populations was obtained by superposing average wing of each population. The final wing shape variables were used as input for discriminant analysis (DA), represented by the factor map. Moreover, Mahalanobis distances were calculated to estimate the metric distance between T. rubidus populations. The non-parametric permutation test (1,000 permutations) was used to calculate the statistical significance in Mahalanobis distance differences among populations (p-value < 0.05).
Relationships of wing shape among populations
The UPGMA (Unweighted Pair Group Method with Arithmetic Mean) tree based on the Euclidean distances was used to illustrate the pattern of relationship between wing shapes among populations. To determine branch reliability, each branch support was estimated, based on 1,000 bootstrap replicates.
Validated classification
Cross-validated classification (leave-one-out cross-validation) was used to determine the percentage of specimens correctly classified within their populations. Each specimen was sequentially removed from the total specimens and assigned to the most likely (size) or closest (shape) group, based on the maximum likelihood approach and Mahalanobis distance, respectively.
Results
Repeatability and allometry
The high repeatability score for wing shape (94%) indicated that our coordinate plotting in the image set was highly accurate. The measurement error for the comparison of landmark digitization in the wing image set was relatively low (6%). The allometric effect of T. rubidus specimens was very low (r2 = 1%, Figure 3) and not statistically significant (p > 0.05). Thus, the wing size changes of T. rubidus were not affected by wing shape changes.
Figure 3. Linear regression prediction (orange dots line) between wing centroid size (horizontal axis) and discriminant factor (DF) (vertical axis) of Tabanus rubidus specimens.
Wing size variation
The T. rubidus wing CS variation among populations is shown in Figure 4. Mean wing CS of adult T. rubidus populations ranged from 12.67 to 13.23 mm (Table 2), with the highest mean wing CS seen in T. rubidus from Chumphon (13.23 mm), while the lowest mean wing CS was seen in T. rubidus in Chiang Mai (12.67 mm). The remaining T. rubidus populations had the following mean wing CS: 12.81 mm (Nakhon Ratchasima), 13.19 mm (Uthai Thani), and 13.20 mm (Singburi). The statistical significances in difference in mean wing CS of T. rubidus among populations are shown in Table 3.
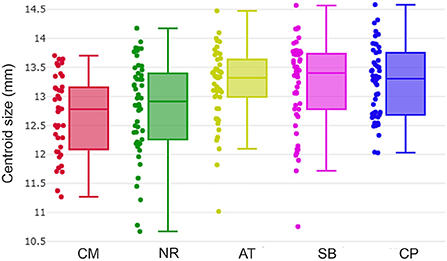
Figure 4. Wing centroid size variation of Tabanus rubidus among populations (CM, Chiang Mai; NR, Nakhon Ratchasima; AT, Uthai Thani; SB, Singburi; CP, Chumphon). Each box plot displays the median with the 25th and 75th quartiles. Dots along the sides of each box represent the individual sizes.
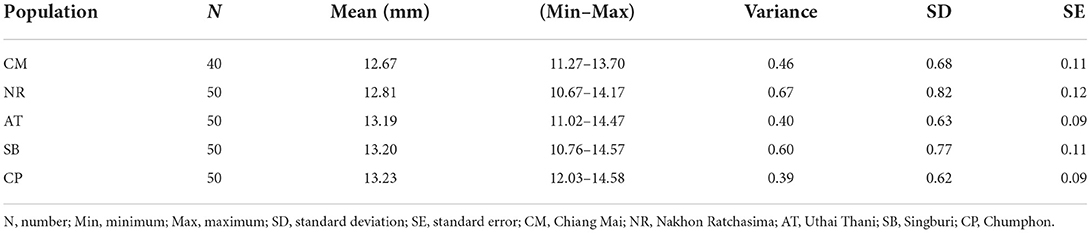
Table 2. Mean wing centroid size of Tabanus rubidus populations.
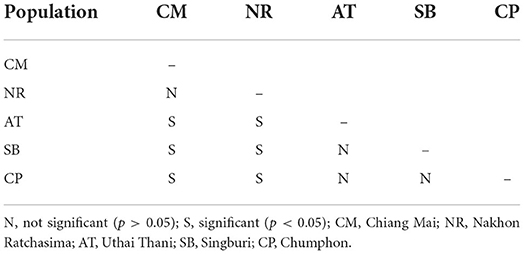
Table 3. Pairwise significant differences among the wing centroid size of Tabanus rubidus populations.
Wing shape variation
After the Generalized Procrustes Analysis, graphic superimposition of the mean landmark configuration was constructed to provide shape line differences in the average wing of each population. Graphic superimposition of landmark coordinates revealed significant displacement at 1, 2, 3, 4, 17, 18, and 19 landmark positions when comparing among populations (Figure 5). The factor map, based on DA, is shown in Figure 6, and indicated that all populations of T. rubidus were markedly overlapped. This map was defined by the first two DF axes, which accounted for 75.4% of the total shape variation for T. rubidus (DF1 = 43.2% and DF2 = 32.2%). The pairwise Mahalanobis distances were significantly different among the populations (p < 0.05, Table 4).
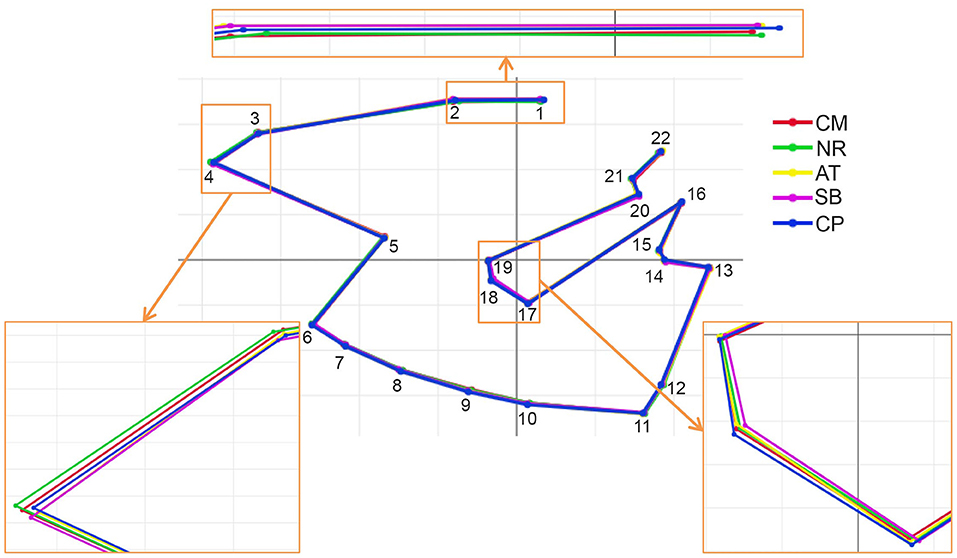
Figure 5. Superposition of the mean shape landmark configurations of Tabanus rubidus among populations (CM, Chiang Mai; NR, Nakhon Ratchasima; AT, Uthai Thani; SB, Singburi; CP, Chumphon). Small frames show enlarged images of wing shape with variations.
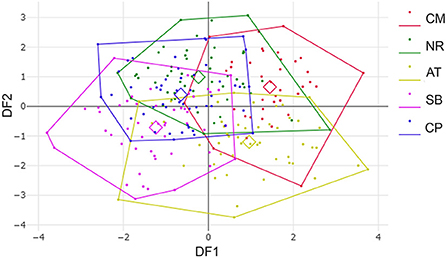
Figure 6. Factor map based on discriminant analysis showing wing shape divergence of Tabanus rubidus among populations (CM, Chiang Mai; NR, Nakhon Ratchasima; AT, Uthai Thani; SB, Singburi; CP, Chumphon). Each point in each population polygon represents an individual specimen with the small squares representing a mean group. The horizontal axis was the first discriminant factor (DF1), while the vertical axis was the second discriminant factor (DF2).
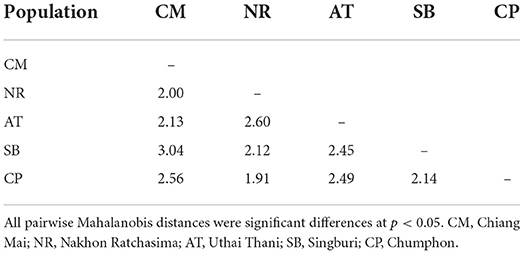
Table 4. Mahalanobis distances among the wing shape of Tabanus rubidus populations.
Wing shape relationships and validated classification
The UPGMA tree based on the Euclidean distances of T. rubidus among populations showed the proximity of wing shape between five T. rubidus populations supported by high bootstrap values (Figure 7). The T. rubidus wing shape of the Uthai Thani population was more similar to Singburi population than Chumphon population, while the Chiang Mai population was similar to Nakhon Ratchasima population, and was separated from other populations. Validated scores of the classification of T. rubidus among populations revealed total performance of 24.58% for wing size (ranged from 2 to 58%) and 65.42% for wing shape (ranged from 58 to 70%) (Table 5).
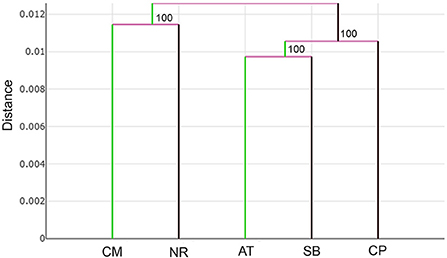
Figure 7. UPGMA tree of Tabanus rubidus wing shape among populations (CM, Chiang Mai; NR, Nakhon Ratchasima; AT, Uthai Thani; SB, Singburi; CP, Chumphon) based on the Euclidean distances with 1,000 bootstrap replicates.
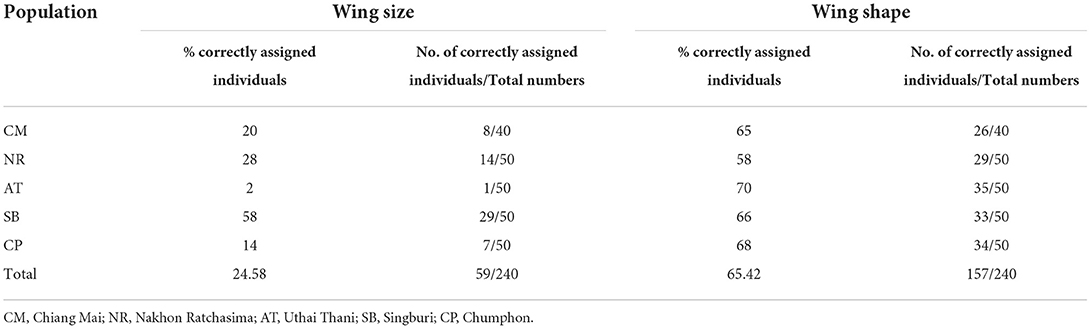
Table 5. Scores of validated classification based on the maximum likelihood for wing size and Mahalanobis distance for wing shape among Tabanus rubidus populations.
Discussion
To our knowledge, this study is the first to report the intraspecific variation in wing geometry among T. rubidus populations based on geometric morphometrics. The results showed that wing size variations were observed between some populations, while wing shape variations were detected among populations, indicating that wing geometry differs according to geographical environment.
Linear regression analysis based on CS on shape variables, conducted to show the statistical relationship between size and shape (allometry), revealed that there was no significant relationship between the wing size and shape of T. rubidus specimens. Therefore, the differences in wing size were not affected by wing shape variation. Although correlations between wing size and shape have been found in many insects like blow flies (35), stable flies (36), mosquitoes (37), Haematobosca aberrans (38), and other Tabanus spp. (31), a few did not display this relationship due to variations caused by evolutionary divergence (20). Some studies have explored the influence of allometry on the geometric morphometric analysis as it is possible that an allometric residue remained in the shape variables (39). However, the results of our study showed that the specimens were not influenced by allometric effect. Hence, we did not remove this effect while analyzing wing shape variation.
The intraspecific variation in the wing size of T. rubidus populations in Thailand confirmed that Chumphon population had the largest size, while Chiang Mai population had the smallest. Environmental conditions, such as temperature, larval density, food quality, and food quantity, influence the wing size of insects during the immature stages (40). Recently, Baleba et al. (36) studied the changes in S. calcitrans wings and found that lowest larval density and good substrate quality resulted in the largest wing size in adult flies. Furthermore, large wing size can be linked to abundance of favorable environmental conditions. Accordingly, it is highly probable that the environmental conditions especially temperature and larval diet in Chumphon, Southern Thailand, are suitable for the development of immature T. rubidus, while those of Chiang Mai, Northern Thailand, might be comparatively less suitable. However, the wing size was more sensitive to environmental changes than wing shape (15). In this study, as we collected specimens for each population at different periods between February and November 2020, the wing size might possibly be influenced by the seasonality. Thereby, wing shape, which highly stable to climatic factors (19), is more appropriate for examining intraspecific variation among populations than wing size.
Although the factor maps based on DA did not show clear segregation among the five populations, wing shape variation was detected in T. rubidus in these populations by comparing pairwise Mahalanobis distances. Mahalanobis distance is an effective statistical technique to measure the metric distance between a point and a distribution, and is widely used for estimating differences of intra- and interpopulation variations in wing shape of insect vectors (15, 39, 41). Intraspecific variation in insect wing shape is caused by many different factors, such as genetic background (42), conditions of larval habitats (36), and altitudes (27).
The differences in T. rubidus wing shapes among populations can be attributed to their adaptation to local environmental conditions. Wing shape changes affect their flight performance, which is linked to the host-seeking behavior of vectors (15, 43). The UPGMA tree, which shows T. rubidus wing shape relationships among populations, revealed that Chiang Mai and Nakhon Ratchasima populations were similar and separated from the remaining populations. The Uthai Thani population was more similar to Singburi than to the Chumphon population. This pattern of the topology clearly indicates that T. rubidus wing shape is related to altitude. The T. rubidus populations in high altitude areas, including Chiang Mai (624 m) and Nakhon Ratchasima (498 m), are distinctly separated from the low altitude areas including Uthai Thani (38 m), Singburi (18 m), and Chumphon (14 m). This result is consistent with the T. bromius populations studied by Altunsoy et al. (27). They found that altitude difference affects wing shape of this Tabanus species. Similarly, a previous study by Kuclu et al. (44) showed that altitude influenced the wing shapes of Aedes vexans in northeastern Turkey. Altitudinal gradients can act as biological models to study the impact of increase in environmental factors, such as temperature, atmospheric pressure, levels of sunlight, vegetation cover, and relative humidity, on biodiversity (45). Several studies investigated the effect of altitude and landscape structure on horse flies and revealed that altitude influenced species richness and abundance (46–48). Differences of ecosystems in each altitude level might be the main factor causing changes in T. rubidus wing shape reflecting environmental adaptation patterns.
The results of validated classification revealed that the wing shapes were more specific to the geographical populations (65.42% total performance score) than wing size (24.58%). This indicated that spatial differences affect the altered wing shape of female T. rubidus. A previous study on phenetic structure of Aedes albopictus populations demonstrated that wing shape was an important variable to indicate heritable intraspecific and geographic differences (19). Although intraspecific variation depends largely on environmental factors, it can also result from genetic factors (20). However, a study on genetic differences based on cytochrome c oxidase subunit I in T. rubidus populations from six locations of Thailand—Chiang Mai, Nakhon Ratchasima, Uthai Thani, Chumphon, Kanchanaburi, and Chainat Provinces—showed low intraspecific divergence, ranging from 0 to 1.9% (mean = 0.9%) (28). Therefore, these results indicated that intraspecific variation of wing geometry of the T. rubidus population seen in this study might be less related to genetic variation of this species. A better understanding of population structure of T. rubidus is essential for developing effective population control. For example, an insecticide application could be sequential in case of separation between populations because these populations may respond differently to use of a same insecticide. However, the relationship between intraspecific morphological variation and insecticide resistance should be considered in further studies.
Conclusions
In the present study, geometric morphometrics was used to investigate the intraspecific variation of wing geometry among T. rubidus populations in Thailand. Our results revealed wing size variations between some populations of T. rubidus, while wing shape variations were detected in all. Wing size variation did not have significant effect on wing shape variation. These results indicated that the wing shape of T. rubidus populations is an adaptive response to local environmental pressures in the studied geographical areas. Altitude was implicated as an important factor for this variation. Our results might enable better understanding of the population structure of T. rubidus in Thailand for developing effective population control.
Data availability statement
The original contributions presented in the study are included in the article/supplementary material, further inquiries can be directed to the corresponding author/s.
Ethics statement
The animal study was reviewed and approved by the Animal Care and Use Committee, Faculty of Veterinary Science, Mahidol University, Thailand (Ethical Approval Number: MUVS-2020-01-01).
Author contributions
TChai and TChan: conceptualization, methodology, data curation, and writing-original draft preparation. TChai, TChan, and TW: validation, investigation, and writing-review and editing. TChan: resources, project administration, and funding acquisition. All authors have read and agreed to the published version of the manuscript.
Funding
This study was financially supported by the Faculty of Veterinary Science, Mahidol University.
Acknowledgments
We would like to thank the authorities of the Monitoring and Surveillance Center for Zoonotic Diseases in Wildlife and Exotic Animals (MoZWE) for their kind cooperation and assistance in the study.
Conflict of interest
The authors declare that the research was conducted in the absence of any commercial or financial relationships that could be construed as a potential conflict of interest.
Publisher's note
All claims expressed in this article are solely those of the authors and do not necessarily represent those of their affiliated organizations, or those of the publisher, the editors and the reviewers. Any product that may be evaluated in this article, or claim that may be made by its manufacturer, is not guaranteed or endorsed by the publisher.
References
1. Laroche M, Bérenger JM, Delaunay P, Charrel R, Pradines B, Berger F, et al. Medical entomology: a reemerging field of research to better understand vector-borne infectious diseases. Clin Infect Dis. (2017) 65:S30–8. doi: 10.1093/cid/cix463
2. Baldacchino F, Desquesnes M, Mihok S, Foil LD, Duvallet G, Jittapalapong S. Tabanids: neglected subjects of research, but important vectors of disease agents! Infect Genet Evol. (2014) 28:596–615. doi: 10.1016/j.meegid.2014.03.029
3. Morita SI, Bayless KM, Yeates DK, Wiegmann BM. Molecular phylogeny of the horse flies: a framework for renewing Tabanid taxonomy. Syst Entomol. (2016) 41:56–72. doi: 10.1111/syen.12145
4. Foil LD, Hogsette JA. Biology and control of Tabanids, stable flies and horn flies. Rev Sci Tech. (1994) 13:1125–58. doi: 10.20506/rst.13.4.821
5. Desquesnes M, Holzmuller P, Lai DH, Dargantes A, Lun ZR, Jittaplapong S. Trypanosoma evansi and surra: a review and perspectives on origin, history, distribution, taxonomy, morphology, hosts, and pathogenic effects. Biomed Res Int. (2013) 2013:194176. doi: 10.1155/2013/194176
6. Changbunjong T, Sedwisi P, Weluwanarak T, Nitiyamatawat E, Sariwongchan R, Chareonviriyaphap T. Species diversity and abundance of Tabanus spp. (Diptera: Tabanidae) in different habitats of Thailand. J Asia Pac Entomol. (2018) 21:134–9. doi: 10.1016/j.aspen.2017.11.013
7. Phasuk J, Tharawoot T, Beaver RA, Jittapalapong S. Seasonal abundance of Tabanidae (Diptera) on dairy farms in Saraburi Province, Thailand. Thai J Agric Sci. (2011) 44:175–81.
8. Desquesnes M, Wongthangsiri D, Jittapalapong S, Chareonviriyaphap T. Guidelines for user-friendly iconographic description of hematophagous flies' external morphology; application to the identification of Tabanus rubidus (Wiedemann, 1821) (Diptera: Tabanidae). J Asia Pac Entomol. (2018) 21:807–22. doi: 10.1016/j.aspen.2018.06.005
9. Lucas M, Krolow TK, Riet-Correa F, Barros ATM, Krüger RF, Saravia A, et al. Diversity and seasonality of horse flies (Diptera: Tabanidae) in Uruguay. Sci Rep. (2020) 10:401. doi: 10.1038/s41598-019-57356-0
10. Schutz SJ, Gaugler RR, Vrijenhoek RC. Genetic and morphometric discrimination of coastal and inland Tabanus lineola (Diptera: Tabanidae). Ann Entomol Soc Am. (1989) 82:220–4. doi: 10.1093/aesa/82.2.220
11. Wamaket N, Khamprapa O, Chainarin S, Thamsawet P, Ninsaeng U, Thongsalee S, et al. Anopheles bionomics in a malaria endemic area of southern Thailand. Parasit Vectors. (2021) 14:378. doi: 10.1186/s13071-021-04870-8
12. Cator LJ, Johnson LR, Mordecai EA, El Moustaid F, Smallwood TRC, LaDeau SL, et al. The role of vector trait variation in vector-borne disease dynamics. Front Ecol Evol. (2020) 8:189. doi: 10.3389/fevo.2020.00189
13. Fusco G, Minelli A. Phenotypic plasticity in development and evolution: facts and concepts. Introduction. Philos Trans R Soc Lond B Biol Sci. (2010) 365:547–56. doi: 10.1098/rstb.2009.0267
14. Bai Y, Dong JJ, Guan DL, Xie JY, Xu SQ. Geographic variation in wing size and shape of the grasshopper Trilophidia annulata (Orthoptera: Oedipodidae): morphological trait variations follow an ecogeographical rule. Sci Rep. (2016) 6:32680. doi: 10.1038/srep32680
15. Lorenz C, Almeida F, Almeida-Lopes F, Louise C, Pereira SN, Petersen V, et al. Geometric morphometrics in mosquitoes: what has been measured? Infect Genet Evol. (2017) 54:205–15. doi: 10.1016/j.meegid.2017.06.029
16. Changbunjong T, Sumruayphol S, Weluwanarak T, Ruangsittichai J. Landmark and outline-based geometric morphometrics analysis of three Stomoxys flies (Diptera: Muscidae). Folia Parasitol (Praha). (2016) 63:2016.037. doi: 10.14411/fp.2016.037
17. Barreaux AMG, Stone CM, Barreaux P, Koella JC. The relationship between size and longevity of the malaria vector Anopheles gambiae (s.s.) depends on the larval environment. Parasit Vectors. (2018) 11:485. doi: 10.1186/s13071-018-3058-3
18. Suesdek L. Microevolution of medically important mosquitoes – a review. Acta Trop. (2019) 191:162–71. doi: 10.1016/j.actatropica.2018.12.013
19. Morales Vargas RE, Phumala-Morales N, Tsunoda T, Apiwathnasorn C, Dujardin JP. The phenetic structure of Aedes albopictus. Infect Genet Evol. (2013) 13:242–51. doi: 10.1016/j.meegid.2012.08.008
20. Dujardin JP. Morphometrics applied to medical entomology. Infect Genet Evol. (2008) 8:875–90. doi: 10.1016/j.meegid.2008.07.011
21. Sauer FG, Jaworski L, Erdbeer L, Heitmann A, Schmidt-Chanasit J, Kiel E, et al. Geometric morphometric wing analysis represents a robust tool to identify female mosquitoes (Diptera: Culicidae) in Germany. Sci Rep. (2020) 10:17613. doi: 10.1038/s41598-020-72873-z
22. Chaiphongpachara T, Laojun S. Variation over time in wing size and shape of the coastal malaria vector Anopheles (Cellia) epiroticus Linton and Harbach (Diptera: Culicidae) in Samut Songkhram, Thailand. J Adv Vet Anim Res. (2019) 6:208–14. doi: 10.5455/javar.2019.f334
23. Chaiphongpachara T, Laojun S. Wing morphometric variability of the malaria vector Anopheles (Cellia) epiroticus Linton et Harbach (Diptera: Culicidae) for the duration of the rainy season in coastal areas of Samut Songkhram, Thailand. Folia Parasitol (Praha). (2020) 67:2020.007. doi: 10.14411/fp.2020.007
24. Sumruayphol S, Chittsamart B, Polseela R, Sriwichai P, Samung Y, Apiwathnasorn C, et al. Wing geometry of Phlebotomus stantoni and Sergentomyia hodgsoni from different geographical locations in Thailand. C R Biol. (2017) 340:37–46. doi: 10.1016/j.crvi.2016.10.002
25. Chaiphongpachara T, Duvallet G, Changbunjong T. Wing phenotypic variation among Stomoxys calcitrans (Diptera: Muscidae) populations in Thailand. Insects. (2022) 13:405. doi: 10.3390/insects13050405
26. Ebhodaghe F, Billah MK, Adabie-Gomez D, Yahaya A. Morphometric diagnosis of Glossina palpalis (Diptera: Glossinidae) population structure in Ghana. BMC Res Notes. (2017) 10:778. doi: 10.1186/s13104-017-3113-8
27. Altunsoy F, Ercan I, Ocakoglu G. Analysis of morphometric characteristics of different populations of Tabanus bromius Linne 1758 (Diptera: Tabanidae). Pak J Zool. (2017) 49:1013–8. doi: 10.17582/journal.pjz/2017.49.3.1013.1018
28. Changbunjong T, Bhusri B, Sedwisai P, Weluwanarak T, Nitiyamatawat E, Chareonviriyaphap T, et al. Species identification of horse flies (Diptera: Tabanidae) in Thailand using DNA barcoding. Vet Parasitol. (2018) 259:35–43. doi: 10.1016/j.vetpar.2018.07.002
29. Mihok S. The development of a multipurpose trap (the Nzi) for tsetse and other biting flies. Bull Entomol Res. (2002) 92:385–403. doi: 10.1079/BER2002186
30. Burton JJS. Tabanini of Thailand above the Isthmus of Kra (Diptera: Tabanidae). Los Angeles, CA: Entomological Reprint Specialists. (1978) p. 165.
31. Changbunjong T, Prakaikowit N, Maneephan P, Kaewwiset T, Weluwanarak T, Chaiphongpachara T, et al. Landmark data to distinguish and identify morphologically close Tabanus spp. (diptera: Tabanidae). Insects. (2021) 12:974. doi: 10.3390/insects12110974
32. Dujardin S, Dujardin JP. Geometric morphometrics in the cloud. Infect Genet Evol. (2019) 70:189–96. doi: 10.1016/j.meegid.2019.02.018
33. Arnqvist G, Mårtensson T. Measurement error in geometric morphometrics: empirical strategies to assess and reduce its impact on measures of shape. Acta Zool Acad Sci Hungaricae. (1998) 44:73–96.
34. Bookstein FL. Biometrics, biomathematics and the morphometric synthesis. Bull Math Biol. (1996) 58:313–65. doi: 10.1007/BF02458311
35. Sontigun N, Sukontason KL, Zajac BK, Zehner R, Sukontason K, Wannasan A, et al. Wing morphometrics as a tool in species identification of forensically important blow flies of Thailand. Parasit Vectors. (2017) 10:229. doi: 10.1186/s13071-017-2163-z
36. Baleba SBS, Masiga D, Torto B, Weldon CW, Getahun MN. Effect of larval density and substrate quality on the wing geometry of Stomoxys calcitrans L. (Diptera: Muscidae). Parasit Vectors. (2019) 12: 222. doi: 10.1186/s13071-019-3483-y
37. Chaiphongpachara T, Sriwichai P, Samung Y, Ruangsittichai J. Geometric morphometrics approach towards discrimination of three member species of Maculatus group in Thailand. Acta Trop. (2019) 192:66–74. doi: 10.1016/j.actatropica.2019.01.024
38. Changbunjong T, Ruangsittichai J, Duvallet G, Pont AC. Molecular identification and geometric morphometric analysis of Haematobosca aberrans (Diptera: Muscidae). Insects. (2020) 11:451. doi: 10.3390/insects11070451
39. Kaba D, Berté D, Ta BTD, Tellería J, Solano P, Dujardin J. The wing venation patterns to identify single tsetse flies. Infect Genet Evol. (2017) 47:132–9. doi: 10.1016/j.meegid.2016.10.008
40. Phanitchat T, Apiwathnasorn C, Sungvornyothin S, Samung Y, Dujardin S, Dujardin JP, et al. Geometric morphometric analysis of the effect of temperature on wing size and shape in Aedes albopictus. Med Vet Entomol. (2019) 33:476–84. doi: 10.1111/mve.12385
41. Carvajal TM, Amalin DM, Watanabe K. Wing geometry and genetic analyses reveal contrasting spatial structures between male and female Aedes aegypti (L.) (Diptera: Culicidae) populations in metropolitan Manila, Philippines. Infect Genet Evol. (2021) 87:104676. doi: 10.1016/j.meegid.2020.104676
42. Carreira VP, Soto IM, Mensch J, Fanara JJ. Genetic basis of wing morphogenesis in Drosophila: sexual dimorphism and non-allometric effects of shape variation. BMC Dev Biol. (2011) 11:32. doi: 10.1186/1471-213X-11-32
43. Johansson F, Söderquist M, Bokma F. Insect wing shape evolution: independent effects of migratory and mate guarding flight on dragonfly wings. Biol J Linn Soc. (2009) 97:362–72. doi: 10.1111/j.1095-8312.2009.01211.x
44. Kuclu O, Aldemir A, Demirci B. Altitudinal variation in the morphometric characteristics of Aedes vexans Meigen from northeastern Turkey. J Vector Ecol. (2011) 36:30–41. doi: 10.1111/j.1948-7134.2011.00138.x
45. de Groot M, Vrezec A. Contrasting effects of altitude on species groups with different traits in a non-fragmented montane temperate forest. Nat Conserv. (2019) 37:99–121. doi: 10.3897/natureconservation.37.37145
46. Baldacchino F, Porciani A, Bernard C, Jay-Robert P. Spatial and temporal distribution of Tabanidae in the Pyrenees Mountains: the influence of altitude and landscape structure. Bull Entomol Res. (2014) 104:1–11. doi: 10.1017/S0007485313000254
47. Baldacchino F, Krčmar S, Bernard C, Manon S, Jay-Robert P. The impact of land use and climate on Tabanid assemblages in Europe. Agric Ecosyst Environ. (2017) 239:112–8. doi: 10.1016/j.agee.2017.01.003
Keywords: geometric morphometrics, horse flies, landmark, Tabanidae, Tabanus rubidus
Citation: Chaiphongpachara T, Weluwanarak T and Changbunjong T (2022) Intraspecific variation in wing geometry among Tabanus rubidus (Diptera: Tabanidae) populations in Thailand. Front. Vet. Sci. 9:920755. doi: 10.3389/fvets.2022.920755
Received: 15 April 2022; Accepted: 16 August 2022;
Published: 02 September 2022.
Edited by:
Carlos Eduardo Almeida, Federal University of Bahia, BrazilReviewed by:
Stjepan Krcmar, Josip Juraj Strossmayer University of Osijek, CroatiaRanju Manoj, Cornell University, United States
Copyright © 2022 Chaiphongpachara, Weluwanarak and Changbunjong. This is an open-access article distributed under the terms of the Creative Commons Attribution License (CC BY). The use, distribution or reproduction in other forums is permitted, provided the original author(s) and the copyright owner(s) are credited and that the original publication in this journal is cited, in accordance with accepted academic practice. No use, distribution or reproduction is permitted which does not comply with these terms.
*Correspondence: Tanasak Changbunjong, dGFuYXNhay5jaGFAbWFoaWRvbC5lZHU=