 Yun Young Go1
 Nicole W. Hazard2
 Udeni B. R. Balasuriya2
 Anna M. Chapman3Nanette S. Fitton4
 Ákos Kenéz1
 Frank M. Andrews3*
- 1Department of Infectious Diseases and Public Health, Jockey Club College of Veterinary Medicine and Life Sciences, City University of Hong Kong, Kowloon, Hong Kong SAR, China
- 2Louisiana Animal Disease Diagnostic Laboratory and Department of Pathobiological Sciences, School of Veterinary Medicine, Louisiana State University, Baton Rouge, LA, United States
- 3Equine Health Studies Program, Department of Veterinary Clinical Sciences, School of Veterinary Medicine, Louisiana State University, Baton Rouge, LA, United States
- 4Siemens Healthcare Diagnostics Inc., Tarrytown, NY, United States
Introduction: Accurate quantitative analysis of equine insulin in blood samples is critical for assessing hyperinsulinemia in horses. Although there are various laboratory methods for evaluating equine serum insulin, different immunoassays show significant discrepancies between the determined insulin concentrations and are often not comparable. The aim of this study was to evaluate the Immulite® 1000 chemiluminescent immunoassay (CLIA) to establish independent laboratory and assay-specific cut values to provide an accurate diagnosis of hyperinsulinemia in horses. Thus, the analytical and clinical performance of Immulite® 1000 CLIA in terms of precision (intra- and inter-assay coefficient of variance, CV) and recovery upon dilution were evaluated and compared with radioimmunoassay (RIA), which has been previously validated for use in horses.
Material and methods: Archived serum samples (n = 106) from six Quarter horse mares enrolled in the glucose phase of a Frequently Sampled Insulin and Glucose Test (FSIGT) study were used to measure blood insulin.
Results: The Immulite® 1000 CLIA had good precision with acceptable intra- and inter-assay CVs, adequate recovery on dilution, and a strong correlation with the RIA (r = 0.974, P < 0.0001), with constant bias resulting in consistently lower values.
Discussion: On this basis, the Immulite® 1000 Insulin Assay is valid for measuring equine serum insulin for diagnostic and monitoring purposes when cut values are appropriately adjusted.
1. Introduction
Equine metabolic syndrome (EMS) has increasingly become a common problem in modern equine clinical practice (1–4). EMS is a complex disorder recognized in horses and ponies, which includes increased regional or general adiposity, insulin dysregulation, and predisposition to laminitis (5–8). Laboratory diagnosis of EMS is based on the quantitative analysis of insulin levels in blood samples, which is critical to assessing dysregulation of glucose and insulin homeostasis in horses (9, 10). Most horses with insulin dysregulation have tissue insulin resistance with compensatory hyperinsulinemia and a broad range of serum insulin concentrations (11–14). Thus, an ideal diagnostic test should be able to determine accurate results encompassing a broad range of values. However, the lack of equine-specific standards or access to a gold-standard assay makes assessing accurate EMS-related changes in insulin regulation difficult. Various laboratory methods are employed for quantitative analysis of insulin in equine serum or plasma, including enzyme-linked immunosorbent assay (ELISA), radioimmunoassay (RIA), and chemiluminescent immunoassay (CLIA). Among these assays, human-specific insulin RIA validated for use in horses was the most commonly used in clinical practice and experimental studies. Consequently, the reference intervals currently used for the diagnosis of insulin dysregulation were established from studies using RIA; however, these assays have limited commercial availability. More importantly, studies indicated that different immunoassays are not comparable and showed significant differences between the determined insulin concentrations, making result interpretation and EMS-related insulin diagnosis difficult (15, 16). Therefore, establishing an independent laboratory and assay-specific reference intervals or cutoff values is critical to providing an accurate diagnosis and for the monitoring of insulin dysregulation in EMS patients (17).
The CLIA is a convenient and commonly used method for quantitative analysis of insulin in commercial laboratories; however, comprehensive validation in horses has not been done. In this study, the validation of the Immulite® 1000 Insulin Assay (Siemens, USA) to measure insulin concentrations in equine serum samples was performed thoroughly. To do this, we evaluated the analytical and clinical performance of Immulite® 1000 CLIA in terms of precision (intra- and inter-assay coefficient of variance, CV), recovery upon dilution, and its comparison with RIA that was previously validated for measurement of insulin concentration in horses.
2. Materials and methods
2.1. Animals and blood samples
Archived serum samples from six Quarter horse mares from the Louisiana State University AgCenter Teaching and Research Herd, previously diagnosed with EMS, were used to measure serum insulin. Samples were collected from horses enrolled in a Frequently Sampled Insulin and Glucose Test (FSIGT) study conducted in June 2019. Briefly, horses were administered dextrose solution (50%, IV; 300 mg/kg body weight) in that study. After 20 min of dextrose administration, horses were given insulin (Novolin® 0.015 IU/kg body weight, IV). Jugular blood samples used for validation were collected at 0, 1, 2, 3, 4, 5, 6, 7, 8, 9, 10, 11, 12, 13, 14, 16, 18, and 20 min before and during dextrose administration and prior to insulin administration. Samples were allowed to clot at room temperature, and collected serum was stored at −80°C for 11 months until assayed (18).
2.2. Immunoassays (CLIA and RIA)
A human insulin-specific radioimmunoassay (Human Insulin Specific RIA kit, Millipore Corporation), previously validated for use with horse serum, was used to measure insulin concentrations as described previously (19). The RIA was performed with reagent volumes and incubation times described in the manufacturer's protocol. The low insulin (mean 10.6 ± 1.78 μIU/ml, CV 16.8%) and high insulin (mean 56.1 ± 5.36 μIU/ml, CV 9.4%) standards were run at the beginning and end of each assay.
For the preparation of insulin standards, the Immulite® Systems Insulin Calibration Verification Material (CVM; Siemens, Germany), traceable to the World Health Organization (WHO) NIBSC 1st International Reference Preparation (IRP) 66/304, was used following the manufacturer's instructions. Briefly, four levels of lyophilized insulin standards in an equine serum-based matrix were reconstituted in deionized water to reach expected target values as indicated by the manufacturer's instructions. Quantitative analysis of insulin was performed on the Immulite® 1000 insulin solid-phase chemiluminescent assay, Immulite® 1000 system (Siemens Healthineers, Germany), following the manufacturer's instructions.
2.3. Evaluation of Immulite® 1000 CLIA (linearity, precision, and recovery)
The linearity of the assay was assessed using equine serum-based insulin control solutions at four expected concentrations (0, 5.4, 24.8, and 309 μIU/ml). The intra-assay CV of the immunoassay was evaluated with 10 replicates of two nonhuman serum-based insulin control solutions, one at low (target mean 9.2 μIU/ml) and one at medium (target mean 47 μIU/ml) concentrations. The two insulin control solutions were also assayed in duplicates on 34 different assay runs to calculate the inter-assay CV. The precision (μIU/ml) for the manufacturers of the Immulite® 1000 showing acceptable coefficient of variation percent (CV%) of <10% at each measurement level within run and total (Table 1). Insulin concentrations for each solution were measured, then means and standard deviations of the replicate values were calculated. In addition, precision was determined using three insulin concentrations [low, medium, and a mix of the two (target mean 28.1 μIU/ml)] prepared in 10 aliquots initially, then each was thawed once and used as the same samples over five runs.
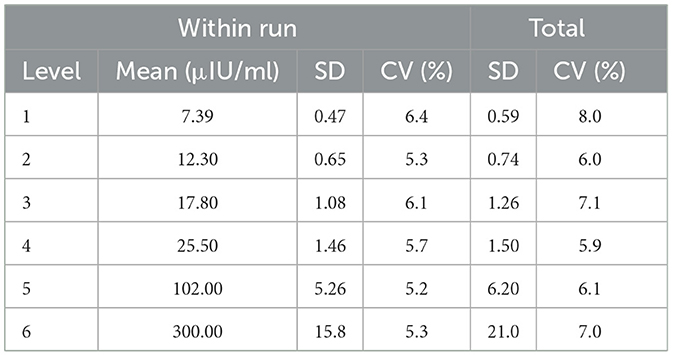
Table 1. Precision (μIU/ml) for the manufacturers of the Immulite® 1000 showing acceptable coefficient of variation percent (CV%) of <10% at each measurement level within run and total.
The recovery upon dilution (RUD) and the linearity of dilution were calculated to evaluate accuracy. A high concentration of insulin control solution (309 μIU/ml) was serially diluted two-fold from neat to 1:256 with Immulite® 1000 insulin diluent buffer to achieve the expected concentration range of 1.2–309 μIU/ml. Observed total error (TEO; %) was obtained by |bias (%)| + 2 CV (%) as described elsewhere (20). Samples were run in triplicate. Percentage recovery was calculated as the observed concentration/expected concentration × 100.
2.4. Comparison of Immulite® 1000 CLIA to RIA
A total of 106 equine serum samples representing a wide range of insulin concentrations were assayed simultaneously by the Immulite® 1000 CLIA and the RIA. The maximum reportable concentrations for the Immulite® 1000 CLIA and RIA were 300 and 200 μIU/ml, respectively; thus, any samples with insulin concentration >200 μIU/ml with RIA were excluded from statistical analysis.
2.5. Statistical analysis
Data analysis was performed using GraphPad Prism software v.9.2.0. Linearity was assessed by linear regression to determine the slope and intercept of the line in comparison with 1 and 0, respectively. The coefficient of variation (%) was calculated as the ratio of the standard deviation to the mean multiplied by 100. A CV ≤ 10% was considered acceptable (21). The least-square linear regression was performed to evaluate the relationship between the RIA and CLIA. A Pearson correlation coefficient was calculated for the 106 samples analyzed by both methods. Bland–Altman analysis was performed to calculate method-dependent bias and limits of agreement between Immulite® 1000 CLIA and RIA (22). Sensitivity and specificity of the CLIA-based values were calculated with reference to the RIA-based diagnostic outcome. Sensitivity was calculated as [number of true positives/(number of true positives + number of false negatives)] × 100 and specificity was calculated as [number of true negatives/(number of true negatives + number of false positives)] × 100. The positive predictive value (PPV) was calculated using the equation: [number of true positives/(number of true positives + number of false positives)] × 100 and negative and the negative predictive value (NPV) was calculated as follows: [number of true negatives/(number of false negatives + number of true negatives)] × 100 (23).
3. Results
3.1. Validation of Immulite® 1000 CLIA
The linearity using equine serum-based control solutions was excellent, showing a strong relationship between the expected and measured concentrations of the diluted samples. Linear regression at analyzed concentrations indicated the best fit line as y = 0.975 x – 0.585 (r = 0.999, P < 0.0001). The analytical range of the Immulite® 1000 CLIA was 0–300 μIU/ml (Figure 1). The intra-assay CV was within acceptable limits, with 4.6% for samples at low mean insulin concentrations of 8.2 ± 0.37 μIU/ml and 5.5% for samples at medium serum-based insulin concentrations of 42.2 ± 2.34 μIU/ml. The inter-assay CV from two control samples were 7.4% for the low concentration control (mean 9.1 ± 0.68 μIU/ml) and 7.7% for the medium concentration control (mean 47.7 ± 3.69 μIU/ml). The mean % CV for three Immulite® 1000 control samples subjected to a freeze-thaw cycle was 6.9% for the low control (mean 8.0 ± 0.56 μIU/ml), 3.3% for the medium control (mean 41.2 ± 1.38 μIU/ml), and 1.8% for the mixture of low and medium controls (mean 25.6 ± 0.46 μIU/ml).
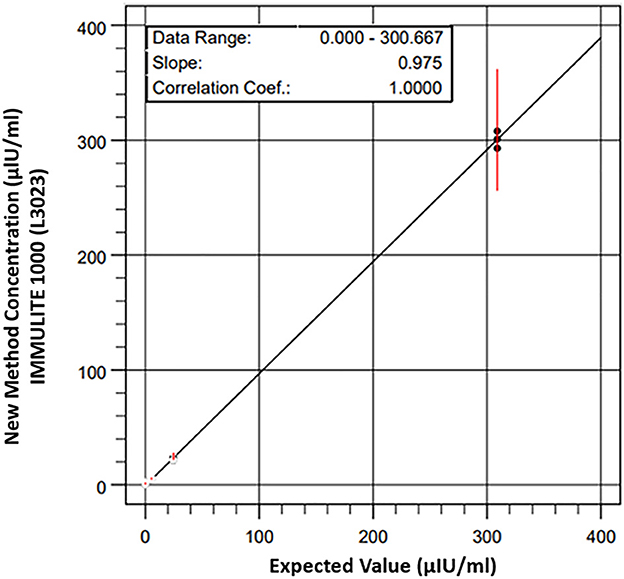
Figure 1. Linearity of standard reference reagents for equine serum based-insulin solutions measured by Immulite® 1000 CLIA using equine serum-based control solutions was excellent, showing a strong relationship between the expected and measured concentrations of the diluted samples. Linear regression at analyzed concentrations indicated the best fit line as y = 0.975 x – 0.585 (r = 0.999, P < 0.0001). The analytical range of the Immulite® 1000 CLIA was 0 to 300 μIU/ml.
Lastly, the mean percentage recovery from the initial high concentration (309 μIU/ml) of nonhuman serum-based insulin control diluted with commercially available sample buffer was calculated at different dilution factors (Table 2). The percentage recovery increased as the dilution factor increased, with the corresponding range of recovery stretching from 94.1 to 206.8%. When samples were subdivided into concentration range groups of high-medium (38.6–309 μIU/ml) and low (1.2–19.3 μIU/ml) concentrations, the overall mean percentage recovery was 98.6% ± 3.5 and 147.4% ± 37.7, respectively. The linearity upon dilution was excellent (r2 = 0.9981; p < 0.0001), showing a strong relationship between the calculated and measured concentrations of the diluted samples (Figure 2).

Table 2. Concentrations of serially diluted insulin (μIU/ml) determined by Immulite® 1000 CLIA showing dilution, replicate, observed concentration, mean, expected concentration, total observed error percent (TEo%, from Table 4) and observed/expected percent.
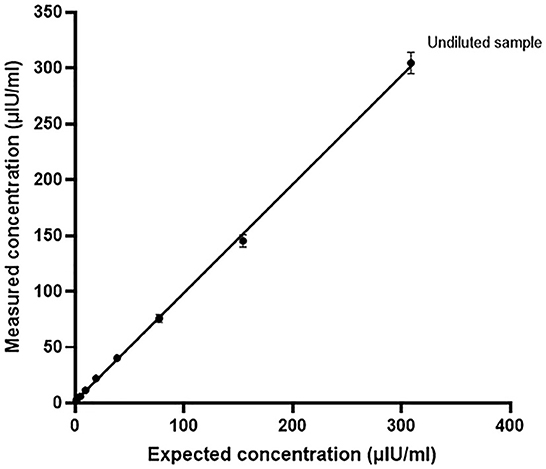
Figure 2. Recovery upon dilution (RUD) of nonhuman serum-based insulin control solutions with Immulite® 1000 CLIA. The RUD was calculated as a percentage of recovery of the insulin concentration in the two-fold serially diluted samples with the corresponding expected concentrations. Samples were diluted with commercially available insulin diluent buffer.
3.2. Comparison between Immulite® 1000 CLIA and RIA
Next, the equine serum insulin concentrations measured with Immulite® 1000 CLIA were compared to those of the RIA. Scatter plots of CLIA concentrations against RIA concentrations with a line of best fit derived by the least-squares regression analysis are shown in Figure 3. There was a strong positive correlation between Immulite® 1000 CLIA and RIA (r = 0.974, P < 0.0001). The gradient (95% CI) of the best fit line was 0.713 (CI, 0.68–0.75), and the intercept was −0.721. The results from the regression analysis and the difference plots indicated that the CLIA results were in good agreement with RIA. A Bland–Altman plot of all samples showed a constant bias with Immulite® 1000 concentrations, a mean of −15.01 ± 20.99 μIU/ml lower than RIA concentrations, and with 95% limits of agreement (LOA) of −56.1 to 26.1 μIU/ml (Figure 4A). A small proportional error was detected with the difference plot between the CLIA and RIA samples with high insulin concentrations. When only samples with RIA <100 μIU/ml were analyzed, a constant bias was present with Immulite® 1000 concentrations, a mean of −10.3 ± 5.79 μIU/ml lower than RIA concentrations, with 95% LOA of −21.6 to 1.0 μIU/ml (Figure 4B). The sensitivity and specificity of the Immulite® 1000 CLIA insulin concentrations were higher when the diagnostic cutoff was lowered from 20 to 10 μIU/ml (Table 3).
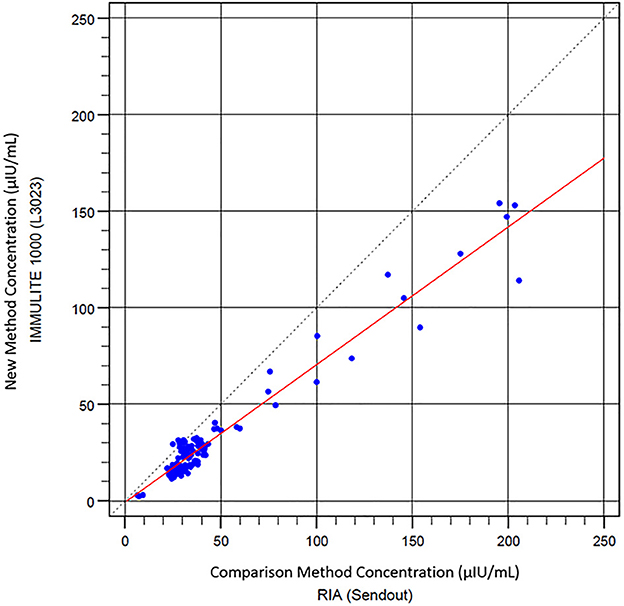
Figure 3. Scatter plot of Immulite® 1000 CLIA compared with RIA results. Least square regression analysis indicates a best-fit line (red) y = 0.713 x – 0.721.
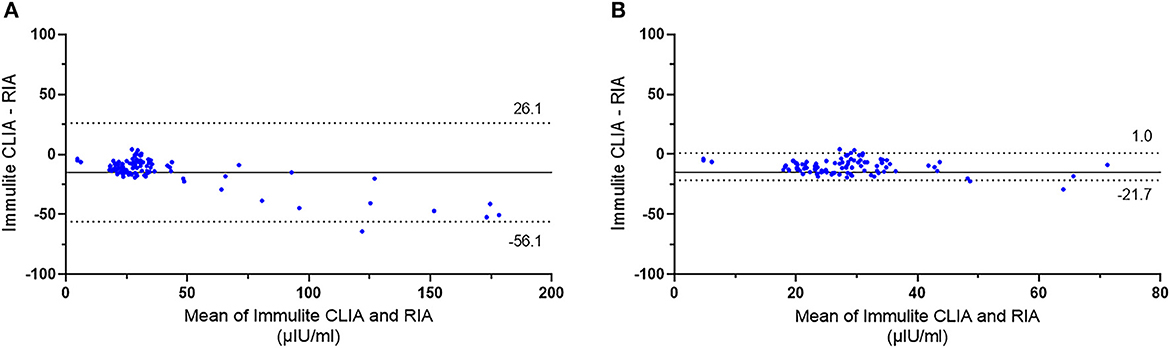
Figure 4. Bland–Altman plot showing agreement between insulin concentrations (μIU/ml) in equine serum samples measured with Immulite® 1000 CLIA and RIA. (A) All samples (n = 106) and (B) samples with RIA <100 μIU/ml (n = 95). The solid line indicates the bias, and the dotted lines indicate the 95% limits of agreement.
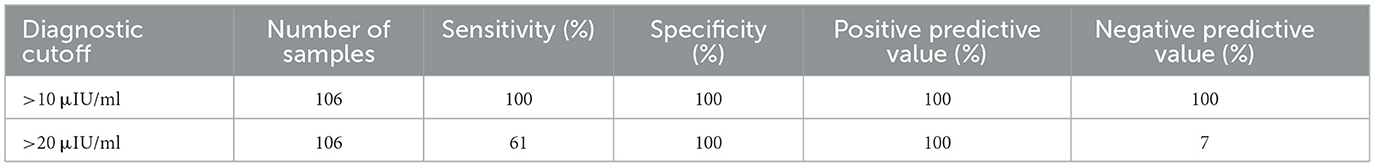
Table 3. Sensitivity, specificity, and positive and negative predictive values for Immulite® 1000 CLIA insulin concentrations compared to RIA using two diagnostic cutoffs.
4. Discussion
In this study, analytical and clinical evaluations of the Immulite® 1000 CLIA had acceptable precision based on manufacturers claims, both within and between runs and at a wide range of clinically relevant insulin concentrations. The intra-assay and inter-assay CVs of Immulite® 1000 CLIA determined in our study were comparable to the reported precision of other immunoassays, including those of RIAs that ranged from 4.4 to 10.7% (15). In addition, CLIA offered an analytical range of 2–300 μIU/ml that allowed coverage of a broader range of insulin concentrations compared to the RIA (0–200 μIU/ml). The RUD results showed that the Immulite® 1000 CLIA allows valid measurements of samples with a mean recovery rate of 101.8% ± 6.9 within a range of 19.3–309 μIU/ml insulin concentrations. However, the mean recovery rate was too high in the low concentration (1.2–19.3 μIU/ml) samples, as the assay consistently overestimated the insulin values in samples <20 μIU/ml. Furthermore, CLIA accuracy was assessed by comparison with the RIA. The RIA has been the most commonly used method in experimental studies and has been shown to be the most appropriate among other immunoassays for routine evaluation (15). As a result, serum insulin concentrations measured with the Immulite® 1000 CLIA showed a strong and positive correlation in comparison with the RIA that has been previously validated for use in horses. When method-dependent bias and limits of agreement were assessed, there were small constant biases, where Immulite® 1000 CLIA measured insulin concentrations were generally underestimated compared to those of the RIA. Calculating the biases at the different levels in the recovery study Table 4, at expected 9.7 have positive bias of 17.5%, at 19.3, positive bias of 14.5%, at 38.6, positive bias of 8.9%, at 77.3, negative bias of 2.1%, at 154.5, negative bias of 6.0% and at 309, negative bias of 1.4%. This matches up with the Bland–Altman plot suggesting that results of ~40 μIU/ml have little bias. There was a positive bias at the lower levels of 14.5 to 17.5% (Table 4). Using the regression equation and 20 μIU/ml cut off threshold, the bias was 32%, at 65 μIU/ml threshold, bias was 30% and at 100 μIU/ml threshold, bias is 30%. However, the variations were with acceptable range when values were >40 μIU/ml.
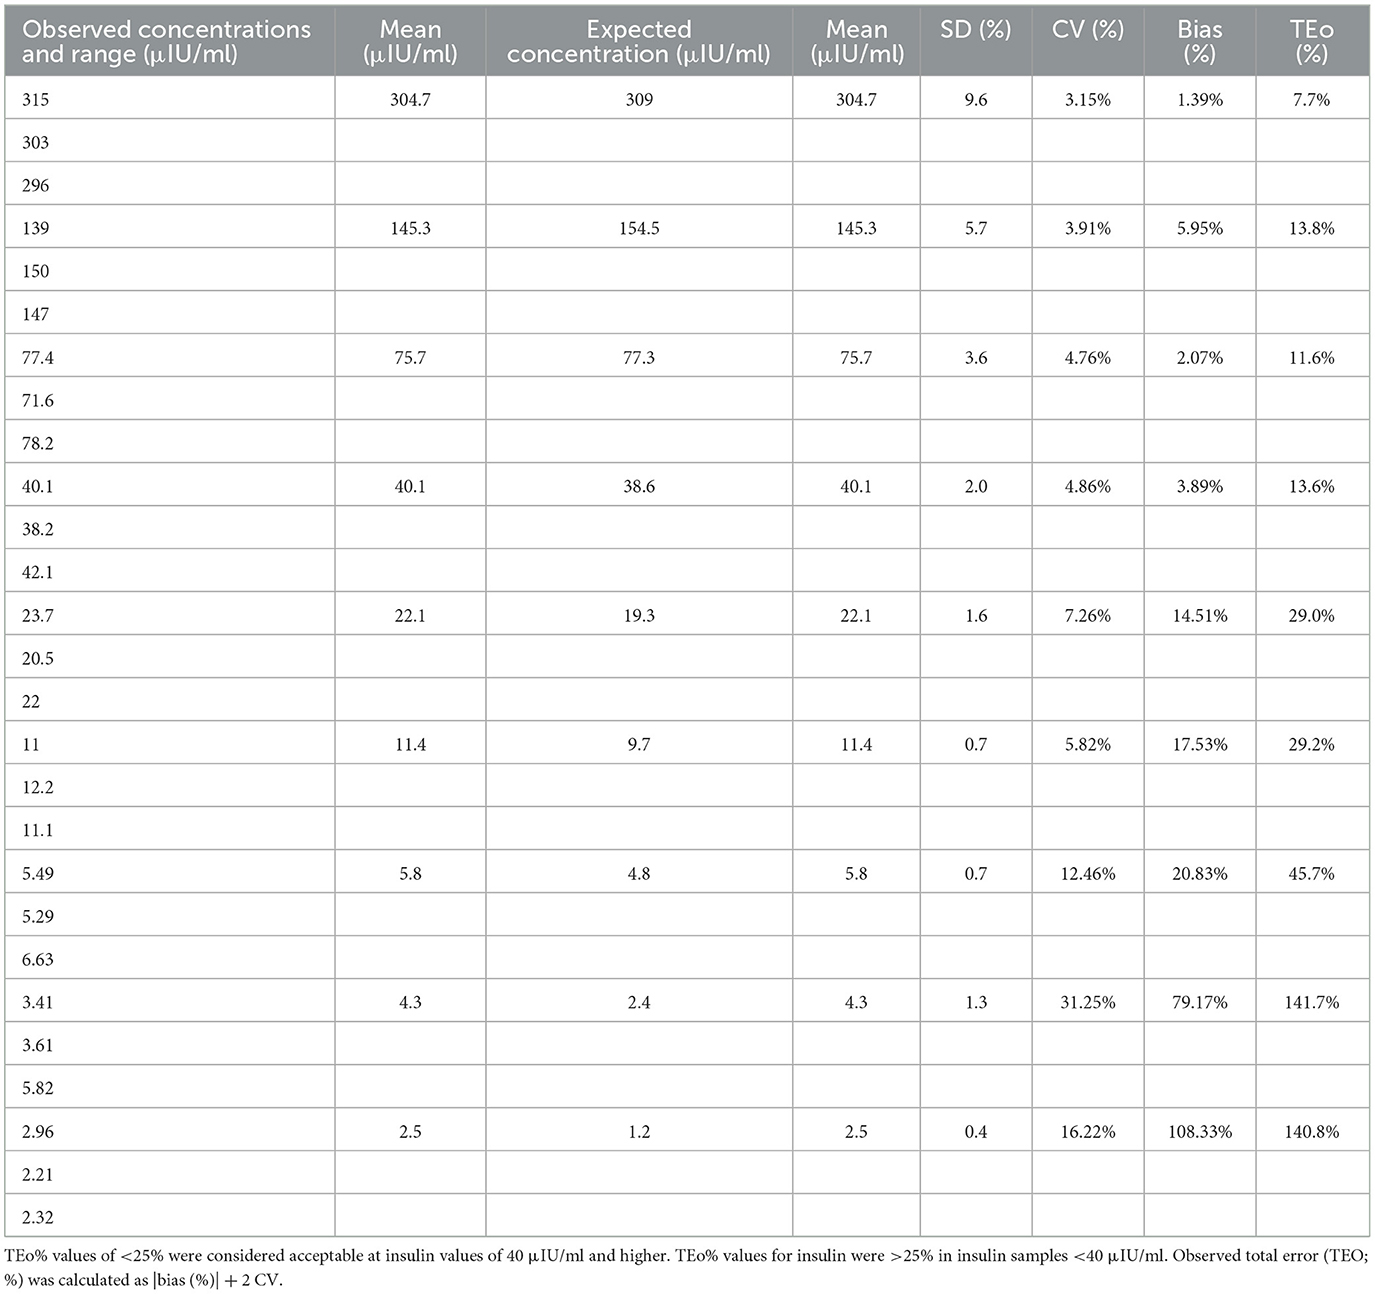
Table 4. Insulin values (μIU/ml) in triplicate at each level showing individual values, mean values, range, standard deviation (SD), CV% (coefficient of variation percent), percent bias (bias%), and total observed error (TEo%).
Thus, to be confident based on the constant bias and TEo at the various cutoff points described in the consensus statement, at the 20 μIU/ml cutoff, a result above 26 μIU/ml, at the 40 μIU/ml, a result above 48 μIU/ml, should be used. The slight differences observed from lower concentration samples between the two immunoassays were also reflected in the gradients and intercepts seen from the regression analysis line of best fit. In contrast, the range of variation decreased significantly when only samples with insulin concentrations at the range most commonly used for diagnostic purposes (0–100 μIU/ml) were included in the analysis. The total error associated with the various cutoffs recommended by the equine endocrine group and the measurement uncertainty (2 × CV) was acceptable. At the cutoff of 20 μIU/ml, the Total observed error (TEo) was 29%, at the cutoff of 40 μIU/ml was 13.6%, and at the cutoff 75 μIU/ml the TEo was 11.6%. Therefore, there was agreement in the clinical application of the diagnostic cutoffs purposed for insulin, which would be considered acceptable at an TEo of 20%−30%. However, when samples were in the “grey zone” of TEo was close to the cutoff value of 30%. This was an expected finding as values in horses between 20–50 μIU/ml warrant further dynamic testing to confirm a diagnosis of insulin resistance.
Many of the reference intervals commonly used in clinical practice and experimental studies to diagnose equine hyperinsulinemia are based on studies using the RIA (24–26). In this study, a comparative analysis between Immulite® 1000 CLIA and RIA showed that the CLIA results were consistently lower than the results provided by the RIA. It is also reflected in the lower sensitivity and negative predictive values of the Immulite® 1000 CLIA determined by using the 20 μIU/ml cutoff value (Table 3), which is stated in the consensus statements of the American College of Veterinary Internal Medicine for diagnosis of fasted hyperinsulinemia in horses (1). In contrast, CLIA showed 100% agreement with the RIA results regarding sensitivity and specificity when a 10 μIU/ml cutoff value was used, suggesting that the independent laboratory and assay-specific cutoff values should be applied in agreement with previously reported adjustments of chemiluminescent-based diagnostics (17). The tendency for CLIA to provide lower measurements of insulin concentrations compared to the RIA, in particular for samples with concentrations under 100 μIU/ml, was also described in previous studies (27, 28). Similar to our results, differences in insulin concentrations between the human-specific RIA and the commercially available CLIA, which is often used for the measurement of equine insulin, was previously described by Banse et al. (16). They observed poor agreement between both assays for measuring equine insulin, which could be attributed to decreased antibody binding to equine insulin compared to human insulin (16). There are two amino acid differences in equine insulin molecules compared to human insulin (29, 30). It is plausible that these slight differences in the amino acid sequence result in conformational changes of the antibody binding site causing reduced binding affinity and negatively impacting the sensitivity of insulin immunoassays. Unfortunately, there are no immunoassays currently available that use antibodies that have been specifically raised against equine insulin or equine insulin standards.
In conclusion, the Immulite® 1000 CLIA showed imprecision within manufacturer's claims and that constant negative bias was apparent in the CLIA assay compared to the RIA. There was an increasing negative proportional bias that became most apparent above 75 μIU/mL with the CLIA assay but is unlikely to be of clinical significance since 75 is well above the cutoff of 65 recommended by the Equine Endocrinology Group for dynamic testing. The diagnostic thresholds of 20 and 50 or 75 recommended for identification of patients needing further dynamic testing had some associated variation, but this only was significant if the results were close to the cutoff and “grey zones” associated with total error or analytical variation (measurement uncertainty). Therefore, it might be possible to use the RIA developed cutoffs for CLIA Assay with the Immulite 1000®, however, in contrast, CLIA showed 100% agreement with the RIA results regarding sensitivity and specificity when a 10 μIU/ml cutoff value was used, suggesting that independent laboratory and assay-specific cutoff values should be applied in agreement with previously reported adjustments of chemiluminescent-based diagnostics.
Data availability statement
The original contributions presented in the study are included in the article/supplementary material, further inquiries can be directed to the corresponding author.
Ethics statement
The animal study was reviewed and approved by Louisiana State University Institute of Animal Care and Use Committee (LSU IACUC).
Author contributions
NH, AC, and NF contributed to the study design, execution, and data analysis. FA, UB, YG, and ÁK contributed to the study design, data analysis and interpretation and manuscript preparation. All authors had full access to all data in the study, took responsibility for the integrity of the data and the accuracy of data analysis, and gave their final approval of the manuscript.
Funding
Funding for the study was provided by the LSU Equine Health & Sports Performance (EHSP), Summer Scholars Program, and the LSU Foundation Equine Funds. YG was supported by City University of Hong Kong Intramural funding (APRC Project number 9610530). The study was also supported by self-generated LSU research funds, PG008671, from UB.
Acknowledgments
The authors thank the manager of the LSU Animal Science horse herd, Mr. Randy Wright and Dr. Erin Oberhaus, Assistant Professor of Animal Science and EHSP professional and undergraduate student workers, Dr. Nicole Arana-Valencia, Christian Arias, Lea Rice, and Jenny Windham. The authors would also thank Dr. Chin-Chi “Kitty” Liu for her technical expertise generating (Tables 3, 4).
Conflict of interest
NF was employed by Siemens Healthcare Diagnostics Inc.
The remaining authors declare that the research was conducted in the absence of any commercial or financial relationships that could be construed as a potential conflict of interest.
Publisher's note
All claims expressed in this article are solely those of the authors and do not necessarily represent those of their affiliated organizations, or those of the publisher, the editors and the reviewers. Any product that may be evaluated in this article, or claim that may be made by its manufacturer, is not guaranteed or endorsed by the publisher.
References
1. Frank N, Geor RJ, Bailey SR, Durham AE, Johnson PJ, American American College of Veterinary Internal Medicine. Equine metabolic syndrome. J Vet Intern Med. (2010) 24:467–75. doi: 10.1111/j.1939-1676.2010.0503.x
2. Johnson PJ. The equine metabolic syndrome peripheral Cushing's syndrome. Vet Clin North Am Equine Pract. (2002) 18:271–93. doi: 10.1016/S0749-0739(02)00006-8
3. Treiber KH, Kronfeld DS, Geor RJ. Insulin resistance in equids: possible role in laminitis. J Nutr. (2006) 136:2094S–8S. doi: 10.1093/jn/136.7.2094S
4. Treiber KH, Kronfeld DS, Hess TM, Byrd BM, Splan RK, Staniar WB. Evaluation of genetic and metabolic predispositions and nutritional risk factors for pasture-associated laminitis in ponies. J Am Vet Med Assoc. (2006) 228:1538–45. doi: 10.2460/javma.228.10.1538
5. Durham AE, Frank N, McGowan CM, Menzies-Gow NJ, Roelfsema E, Vervuert I, et al. ECEIM consensus statement on equine metabolic syndrome. J Vet Intern Med. (2019) 33:335–49. doi: 10.1111/jvim.15423
6. de Laat MA, Reiche DB, Sillence MN, McGree JM. Incidence and risk factors for recurrence of endocrinopathic laminitis in horses. J Vet Intern Med. (2019) 33:1473–82. doi: 10.1111/jvim.15497
7. de Laat MA, Sillence MN, Reiche DB. Phenotypic, hormonal, and clinical characteristics of equine endocrinopathic laminitis. J Vet Intern Med. (2019) 33:1456–63. doi: 10.1111/jvim.15419
8. Fitzgerald DM, Anderson ST, Sillence MN, de Laat MA. The cresty neck score is an independent predictor of insulin dysregulation in ponies. PLoS ONE. (2019) 14:e0220203. doi: 10.1371/journal.pone.0220203
9. Bertin FR, de Laat MA. The diagnosis of equine insulin dysregulation. Equine Vet J. (2017) 49:570–6. doi: 10.1111/evj.12703
10. de Laat MA, van Haeften JJ, Sillence MN. The effect of oral and intravenous dextrose on C-peptide secretion in ponies. J Anim Sci. (2016) 94:574–80. doi: 10.2527/jas.2015-9817
11. Bailey SR, Habershon-Butcher JL, Ransom KJ, Elliott J, Menzies-Gow NJ. Hypertension and insulin resistance in a mixed-breed population of ponies predisposed to laminitis. Am J Vet Res. (2008) 69:122–9. doi: 10.2460/ajvr.69.1.122
12. Toth F, Frank N, Martin-Jimenez T, Elliott SB, Geor RJ, Boston RC. Measurement of C-peptide concentrations and responses to somatostatin, glucose infusion, and insulin resistance in horses. Equine Vet J. (2010) 42:149–55. doi: 10.2746/042516409X478497
13. de Laat MA, McGree JM, Sillence MN. Equine hyperinsulinemia: investigation of the enteroinsular axis during insulin dysregulation. Am J Physiol-Endoc M. (2016) 310:E61–72. doi: 10.1152/ajpendo.00362.2015
14. Leung YH, Kenez A, Grob AJ, Feige K, Warnken T. Associations of plasma sphingolipid profiles with insulin response during oral glucose testing in Icelandic horses. J Vet Intern Med. (2021) 35:2009–18. doi: 10.1111/jvim.16200
15. Tinworth KD, Wynn PC, Boston RC, Harris PA, Sillence MN, Thevis M, et al. Evaluation of commercially available assays for the measurement of equine insulin. Domest Anim Endocrinol. (2011) 41:81–90. doi: 10.1016/j.domaniend.2011.05.001
16. Banse HE, McCann J, Yang F, Wagg C, McFarlane D. Comparison of two methods for measurement of equine insulin. J Vet Diagn Invest. (2014) 26:527–30. doi: 10.1177/1040638714536560
17. Olley RB, Carslake HB, Ireland JL, McGowan CM. Comparison of fasted basal insulin with the combined glucose-insulin test in horses and ponies with suspected insulin dysregulation. Vet J. (2019) 252:105351. doi: 10.1016/j.tvjl.2019.105351
18. Öberg J, Bröjer J, Wattle O, Lilliehöök I. Evaluation of an equine-optimized enzyme-linked immunosorbent assay for serum insulin measurement and stability study of equine serum insulin. Comp Clin Path. (2012) 21:1291–300. doi: 10.1007/s00580-011-1284-6
19. Berryhill EH, Magdesian KG, Tadros EM, Edman JE. Effects of age on serum glucose and insulin concentrations and glucose/insulin ratios in neonatal foals and their dams during the first 2 weeks postpartum. Vet J. (2019) 246:1–6. doi: 10.1016/j.tvjl.2019.01.013
20. Korchia J, Freeman KP. Total observed error, total allowable error, and QC rules for canine serum and urine cortisol achievable with the Immulite 2000 Xpi cortisol immunoassay. J Vet Diagn Invest. (2022) 34:246–57. doi: 10.1177/10406387221076129
21. Deshpande SS. Enzyme Immunoassays: From Concept to Product Development. New York, NY: Chapman & Hall. (1996). doi: 10.1007/978-1-4613-1169-0
22. Bland JM, Altman DG. Statistical methods for assessing agreement between two methods of clinical measurement. Lancet. (1986) 1:307–10. doi: 10.1016/S0140-6736(86)90837-8
23. Trevethan R. Sensitivity, specificity, and predictive values: foundations, pliabilities, and pitfalls in research and practice. Front Public Health. (2017) 5:307. doi: 10.3389/fpubh.2017.00307
24. Schuver A, Frank N, Chameroy KA, Elliott SB. Assessment of insulin and glucose dynamics by using an oral sugar test in horses. J Equine Vet Sci. (2014) 34:465–70. doi: 10.1016/j.jevs.2013.09.006
25. Smith S, Harris PA, Menzies-Gow NJ. Comparison of the in-feed glucose test and the oral sugar test. Equine Vet J. (2016) 48:224–7. doi: 10.1111/evj.12413
26. Knowles EJ, Harris PA, Elliott J, Menzies-Gow NJ. Use of the oral sugar test in ponies when performed with or without prior fasting. Equine Vet J. (2017) 49:519–24. doi: 10.1111/evj.12607
27. Warnken T, Huber K, Feige K. Comparison of three different methods for the quantification of equine insulin. BMC Vet Res. (2016) 12:196. doi: 10.1186/s12917-016-0828-z
28. Carslake HB, Pinchbeck GL, McGowan CM. Evaluation of a chemiluminescent immunoassay for measurement of equine insulin. J Vet Intern Med. (2017) 31:568–74. doi: 10.1111/jvim.14657
29. Ho EN, Wan TS, Wong AS, Lam KK, Stewart BD. Doping control analysis of insulin and its analogues in equine plasma by liquid chromatography-tandem mass spectrometry. J Chromatogr A. (2008) 1201:183–90. doi: 10.1016/j.chroma.2008.04.060
30. Kuuranne T, Thomas A, Leinonen A, Delahaut P, Bosseloir A, Schanzer W, et al. Insulins in equine urine: qualitative analysis by immunoaffinity purification and liquid chromatography/tandem mass spectrometry for doping control purposes in horse-racing. Rapid Commun Mass Spectrom. (2008) 22:355–62. doi: 10.1002/rcm.3360
Keywords: insulin dysregulation, equine metabolic syndrome, quantitative measurement, validation, equine serum insulin, horse
Citation: Go YY, Hazard NW, Balasuriya UBR, Chapman AM, Fitton NS, Kenéz Á and Andrews FM (2023) Clinical evaluation of the Immulite® 1000 chemiluminescent immunoassay for measurement of equine serum insulin. Front. Vet. Sci. 10:1018230. doi: 10.3389/fvets.2023.1018230
Received: 05 September 2022; Accepted: 06 March 2023;
Published: 27 March 2023.
Edited by:
Zhanhui Wang, China Agricultural University, ChinaReviewed by:
Kathleen Peterson Freeman, SYNLAB, United KingdomJean-Claude DESFONTIS, Ecole Nationale Vétérinaire Agroalimentaire et de l'Alimentation, France
Copyright © 2023 Go, Hazard, Balasuriya, Chapman, Fitton, Kenéz and Andrews. This is an open-access article distributed under the terms of the Creative Commons Attribution License (CC BY). The use, distribution or reproduction in other forums is permitted, provided the original author(s) and the copyright owner(s) are credited and that the original publication in this journal is cited, in accordance with accepted academic practice. No use, distribution or reproduction is permitted which does not comply with these terms.
*Correspondence: Frank M. Andrews, ZmFuZHJld3NAbHN1LmVkdQ==