1
Department of Neurobiology, Stanford University School of Medicine, Stanford, CA, USA
2
Division of Biology, California Institute of Technology, Pasadena, CA, USA
3
Division of Biology, Howard Hughes Medical Institute, California Institute of Technology, Pasadena, CA, USA
Dendritic spines are one-half (the postsynaptic half) of most excitatory synapses. Ever since the direct observation over a decade ago that spines can continually change size and shape, spine dynamics has been of great research interest, especially as a mechanism for structural synaptic plasticity. In concert with this ongoing spine dynamics, the stability of the synapse is also needed to allow continued, reliable synaptic communication. Various cell-adhesion molecules help to structurally stabilize a synapse and its proteins. Here, we review the effects of disrupting N-cadherin, a prominent trans-synaptic adhesion molecule, on spine dynamics, as reported in Mysore et al. (2007)
. We highlight the novel method adopted therein to reliably detect even subtle changes in fast and slow spine dynamics. We summarize the structural, functional, and molecular consequences of acute N-cadherin disruption, and tie them in, in a working model, with longer-term effects on spines and synapses reported in the literature.
Dendritic spines are tiny, mushroom-like protrusions (<1 õm in diameter) found in large numbers in the brain (roughly 1013 in humans, Nimchinsky et al., 2002
), with a given neuron, for instance a hippocampal pyramidal neuron, possessing thousands. Individual spines vary greatly in morphology (reviewed in Hering and Sheng, 2001
; Sorra and Harris, 2000
), can be highly motile (first shown by Dailey and Smith, 1996
; reviewed in Bonhoeffer and Yuste, 2002
; Halpain, 2000
; Harms and Dunaevsky, 2007
; McKinney, 2005
; Segal, 2005
; Tada and Sheng, 2006
), and even nearby spines can exhibit very different dynamics (Figure 1
A). These changes can occur rapidly over seconds, or in the longer-term over days and months. When examining spine dynamics
it is therefore important to take into account the intrinsic variability in the motile behavior of spines, the timescale
over which these changes occur, and their sheer number. In our research paper (Mysore et al., 2007
), we presented a novel approach to carefully and systematically analyze spine morphological dynamics from images obtained with confocal microscopy. This method characterizes in detail, instantaneous spine size, position, and shape, and the dynamics in these attributes, while addressing three important, but largely unexplored issues: (a) the ability to detect even subtle changes in spine morphological attributes at two timescales – fast
(over minutes) and slow
(over hours) (b) the ability to draw conclusions on average spine behavior in spite of the widely varying individual behaviors, and (c) the ability to distinguish subtle, but real, changes from noise (experimental, imaging, and measurement). Below, we summarize the key aspects of this method as applied to images obtained by confocal imaging of EGFP-expressing hippocampal neurons in primary culture.
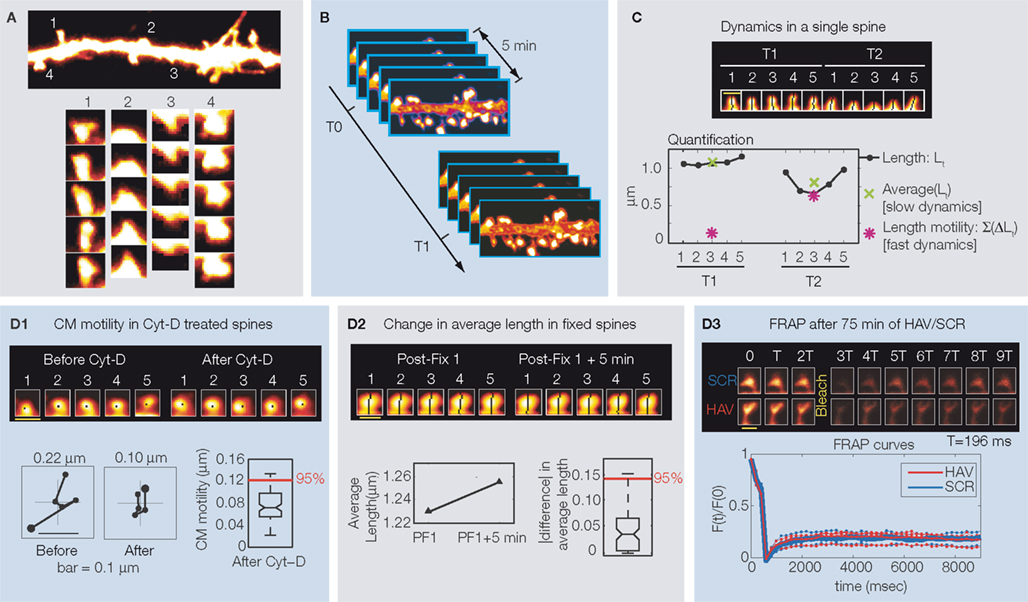
Figure 1. (A) Example dendritic segment with spines. Time-lapse images (every 2 min) of nearby spines showing different kinds of motility – (1) change in position and shape (2) increase in length, (3) decrease in length, and (4) change in position. (B) Image acquisition protocol to study dynamics at two timescales. Each timepoint consists of five stacks, each separated from the next by 1 min. Timepoints themselves are T0, T1…, separated by hours. (C) Time-lapse images of example spine showing instantaneous length (Lt), average length (slow dynamics), and length motility (fast dynamics) measured at two timepoints. (D) Estimating the contribution of various sources of treatment-independent noise to the measurement of center-of-mass motility (CM motility, D1), change in average length (D2), and the contribution of treatment-dependent noise (D3). FRAP is fluorescence recovery after photobleaching. T0 (baseline) = −10 min, T1 = 75 min, and T2 = 180 min. The pseudo-coloring of dendrites and spines in all panels indicates the intensity of over-expressed EGFP, with white being the highest pixel intensity and black the lowest. All panels modified from Mysore et al. (2007)
.
First, spine morphology was characterized via the automated calculation of instantaneous spine length, area, perimeter, head diameter, center-of-mass (position of spine), and shape factor (Dailey and Smith, 1996
; Dunaevsky et al., 1999
; Fischer et al., 1998
, 2000
; Harris et al., 1992
; Koh et al., 2002
; Maletic-Savatic et al., 1999
; Peters and Kaiserman-Abramof, 1970
; Rusakov and Stewart, 1995
; Sala et al., 2001
) from individual spine images. Individual spines were manually identified (see Cheng et al., 2007
; Koh et al., 2002
) for automated spine detection techniques) and their images extracted [after deblurring with 3D deconvolution (Dougherty, 2005
), see Mysore et al., 2007
for more details] from 3D, large field-of-view (70 õm × 70 õm × 35 õm), high resolution (0.07 × 0.07 × 0.37 õm3), confocal stacks that capture the states of hundreds of spines (see Mysore et al., 2007
for further details). Simultaneously imaging large numbers of spines allowed for the conclusions that are subsequently drawn, to be generalized to the whole population.
Next, to study spine morphological dynamics, experiments were designed to characterize dynamics at two timescales: hours (slow) and minutes (fast). For this, individual timepoints were separated by hours, and at each timepoint, five image stacks were obtained once every minute (Figure 1
B). The actual timepoints, in this case, were T0 (baseline) = −10 min, T1 = 75 min, and T2 = 180 min. For each spine attribute, for instance length, the fast time scale analysis involved summing the total change in length over each 5-min period (i.e., each timepoint, Figure 1
C), and comparing this measure (called length motility) across timepoints. The slow timescale analysis involved computing the average length over each 5-min period (Figure 1
C), and comparing this measure (called average length) across timepoints. These measures can faithfully capture the behavior of spines at two timescales – for instance, while the average length of a spine might not change over time (no changes in the slow timescale), its motility level can change (fast timescale). With such measurements, it was possible to test whether the regulation of spine dynamics can occur independently at different timescales, and this was studied with respect to each spine morphological attribute.
In order to be able to make statistically significant statements about the evolution of spine dynamics over time, we kept track of the probabilities of different kinds of behavior in an attribute, rather than the mean ± SEM. For instance, instead of following the mean value of length motility at different timepoints, the population of imaged spines was split up into N sub-populations. At each timepoint, the fractions (i.e., the probabilities) of spines that showed either an increase, no change or decrease with respect to T0 was measured. These probabilities were compared between conditions to determine treatment effects in spine attributes at both timescales. This method is sensitive and can detect subtle effects even when comparing mean ± SEM does not. Integral to this analysis is the ability to tell apart biologically relevant changes from noise. This issue was dealt with in the following manner.
To distinguish subtle changes in these tiny structures from spurious changes caused by the attendant sources of noise, we estimated the contribution of the various noise sources to measurements of spine morphology and dynamics, and correct for them. Experimental errors in the measurements of position and morphology can be induced by the movement of the dish containing the cells, differences in positioning the dish on the microscope at each timepoint, large-scale movements of the dendrites, vibrations in the room, etc. These were corrected for by aligning subsequent stacks to the first one using automated registration routines that appropriately rotate and translate the images without introducing distortions (NIH IMAGEJ). Next, estimates of noise in the measurement of different motility (i.e., fast timescale) attributes at any timepoint were obtained by measuring the apparent motility of spines that were treated with Cytochalasin-D (Figure 1D1
), a drug known to block actin polymerization and hence spine dynamics (Fischer et al., 1998
). Any motility measured under these conditions is due to factors like diffusion of EGFP, photobleaching, etc. The 95-percentile value of the motility obtained from all such dynamics-blocked spines was defined as the measurement threshold (Figure 1D1
). Only those values of motility that exceeded this threshold were considered to represent biologically relevant dynamics, and values that were smaller than this threshold were considered to be unresolvable (Gelles et al., 1998
; Pawley, 1995
). As for the variability in the measurement of average spine attributes (i.e., slow timescale measures, example average length), the process of averaging inherent in the calculation of these values automatically accounts for it. Next, quantification of the changes in either the motility or the average measures (fast or slow timescales, respectively) is also confounded by spurious changes. Estimates of the magnitude of spurious change were obtained by measuring at the different timepoints, attributes (at both slow and fast scales) from spines that were fixed with paraformaldehyde (Figure 1D2
). Any change in a spine attribute (such as average length) measured under these conditions is due solely to noise sources such as photobleaching and random fluctuations in the detection of photons. As before, the 95-percentile value of the distribution of sign-independent changes obtained from all the fixed spines was defined as the threshold (Figure 1D2
). When comparing a spine attribute (say average length) at any two timepoints, it was considered to have not changed if the absolute value of the difference was smaller than this threshold. If not, the attribute was considered to have either increased or decreased in value based on the direction of change. The noise sources discussed above are all treatment-independent; but there can be treatment-dependent sources as well. An important one in this context is a treatment-induced change in the rate of EGFP diffusion into and out of spines. Since our measurements of spine dynamics are all directly dependent on the distribution of EGFP in spines, a treatment-induced change in the diffusion of EGFP into and out of spines could lead to a change in the EGFP distribution, and thereby lead us to incorrectly conclude a change in motility. To check this, we performed fluorescence recovery after photobleaching in spines at timepoints T1 and T2 following HAV treatment (Figure 1D3
). We found that recovery rates, and hence EGFP diffusion rates, were unaltered by HAV treatment, thereby establishing that any observed changes in motility were not just a result of altered fluorophore diffusion. Thus, our method is well suited to analyze spine morphological dynamics at multiple timescales in a manner that is robust to noise.
N-cadherin
is a key transmembrane, cell-adhesion molecule with demonstrated roles in synapse assembly, synaptic plasticity and memory formation (reviewed in Bruses, 2006
; Takeichi, 2007
). Two key aspects of N-cadherin function are extracellular adhesion, which promotes structural stability and facilitates recognition of extracellular partners, and intracellular signaling via interaction with cytoplasmic proteins. N-cadherin is known to interact with intracellular actin filaments, which form the structural backbone of the spine, and which when they undergo assembly and disassembly produce spine dynamics. Indeed, N-cadherin has been shown to play a role in activity-dependent spine remodeling, likely via interactions with the cytoskeleton (Okamura et al., 2004
). Also, manipulation of some of the components of the so-called N-cadherin complex (defined as N-cadherin and its cytoplasmic partners like β-, α-, δ-, and p120-catenins) has been shown to affect spine dynamics (reviewed in Takeichi and Abe, 2005
). However, the effect of N-cadherin itself on spine dynamics was only demonstrated recently in our research article (Mysore et al., 2007
). Here, we will highlight these results.
Surface N-cadherin disruption in cultured hippocampal neurons was achieved by a 10 min, bath application of the peptide AHAVD (referred to as HAV
); peptides containing the HAV sequence are known to inhibit N-cadherin function by blocking its homophilic interactions (Schrick et al., 2007
; Tang et al., 1998
). A scrambled version of the peptide, namely AADHV and referred to as SCR, was used for control purposes. Peptide application and washout occurred at T = 0, immediately after the acquisition of baseline (T = −5) image stacks. The cells were placed in a 37°C environment between timepoints T1 (75 min) and T2 (180 min).
We found that at T1 (but not T2), more HAV-treated spines than in control showed an increase in center-of-mass motility
(fast timescale dynamics, Figure 2
A), thereby indicating that soon after acute N-cadherin disruption, spines are more likely to show fast twitching. In addition, more HAV-treated spines showed a decrease in average length (slow timescale dynamics, Figure 2
B) at T1 (but not T2), indicating that spines are more likely to shrink in length soon after functional disruption of N-cadherin. HAV treatment also induced greater spine loss than in control at T2 (Figure 2
C). Interestingly, the early changes in center-of-mass motility and average length were correlated with the later elimination of spines, i.e., spines that showed either an increase in center-of-mass motility or a decrease in average length at T1 were more likely to be lost later at T2 (Figure 2
D). These results indicated a progressive loss of structural stability at synapses following N-cadherin disruption. Along with these structural changes, whole-cell, patch clamp recordings showed a drastic reduction in miniature excitatory postsynaptic current frequency early on (T = 30 min, Figure 2
E). These results show that N-cadherin disruption results in the impairment of synaptic function, which is followed by structural instability (increased motility and reduced length), and then the elimination of spines.
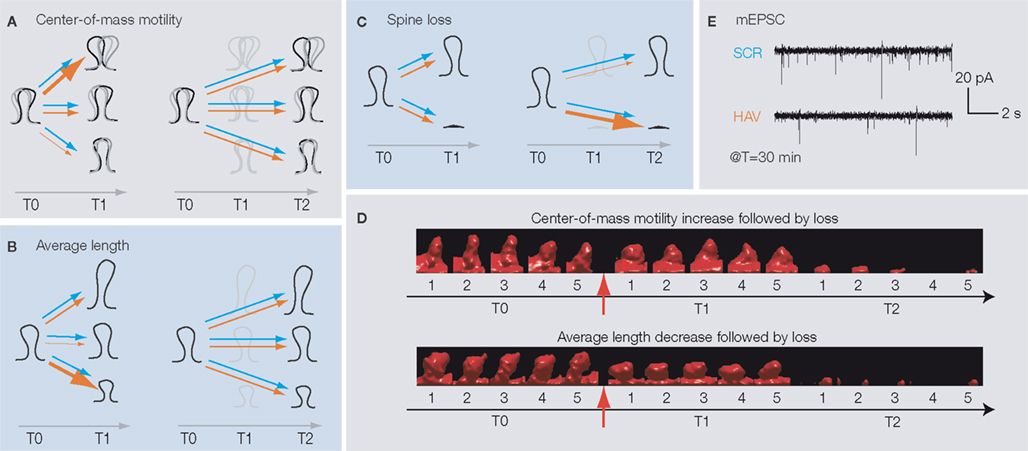
Figure 2. (A) HAV-treated spines are more likely than control spines to show an increase in center-of-mass motility (fast timescale, positional dynamics) at T1, but not at T2. Thicker arrows indicate a greater likelihood of the behavior. Blue and red arrows indicate control and HAV treatments, respectively. T0 (baseline) = −10 min, T1 = 75 min, and T2 = 180 min. (B) HAV-treated spines are more likely than control spines to show a decrease in average length (slow timescale, length dynamics) at T1, but not at T2. (C) Greater loss of HAV-treated spines at T2. (D) After HAV treatment, spines that show an increase in motility or a decrease in length at T1 are more preferentially lost at T2. (E) At T = 30 min after treatment, there are far fewer miniature excitatory postsynaptic currents (mEPSCs) than in control. All panels derived from Mysore et al. (2007)
.
Experiments probing the molecular mechanisms associated with these changes (previously unpublished data) showed the following post and presynaptic signatures. β-catenin, a protein that links N-cadherin to the actin cytoskeleton (Bienz, 2005
; Gates and Peifer, 2005
; Sekino et al., 2007
), is known to stabilize N-cadherin function (Huber et al., 2001
), to improve the overall stability of spines and synaptic transmission via increased association with N-cadherin (Murase et al., 2002
; see Kwiatkowski et al., 2007
; Tai et al., 2007
, 2008
for recent reviews), and also to stabilize active presynaptic terminals (Bamji et al., 2003
). Live imaging of neurons over-expressing a β-catenin-EGFP construct (at T0 (baseline) = 0 min, T1 = 30 min, T2 = 70 min, T3 = 110 min, and T4 = 150 min) showed that acute N-cadherin disruption causes a biphasic response of spine β-catenin (Figure 3
A). When compared to control, more HAV-treated spines showed an increase in β-catenin at initial timepoints (T2 and T3) with respect to T0. At later timepoints (T3 and T4), this increase in β-catenin was abolished (probabilities of change with respect to T0 were indistinguishable between control and HAV-treated spines), implying that at timepoints T3 and T4, there was actually a decrease in spine β-catenin with respect to T1 and T2. This biphasic response of over-expressed β-catenin was corroborated by a similar response of endogenous β-catenin, observed by immunostaining with an antibody to β-catenin (Figure 3
B). These results suggest an initial compensatory attempt by the cell toward stabilizing cadherin via an increase in spine β-catenin. This idea was supported by an initial increase in binding between β-catenin and several of its partners like α-catenin and δ-catenin, measured by immunoprecipitation of β-catenin followed by a probing for various binding partners at T = 30 min (Figure 3
C).
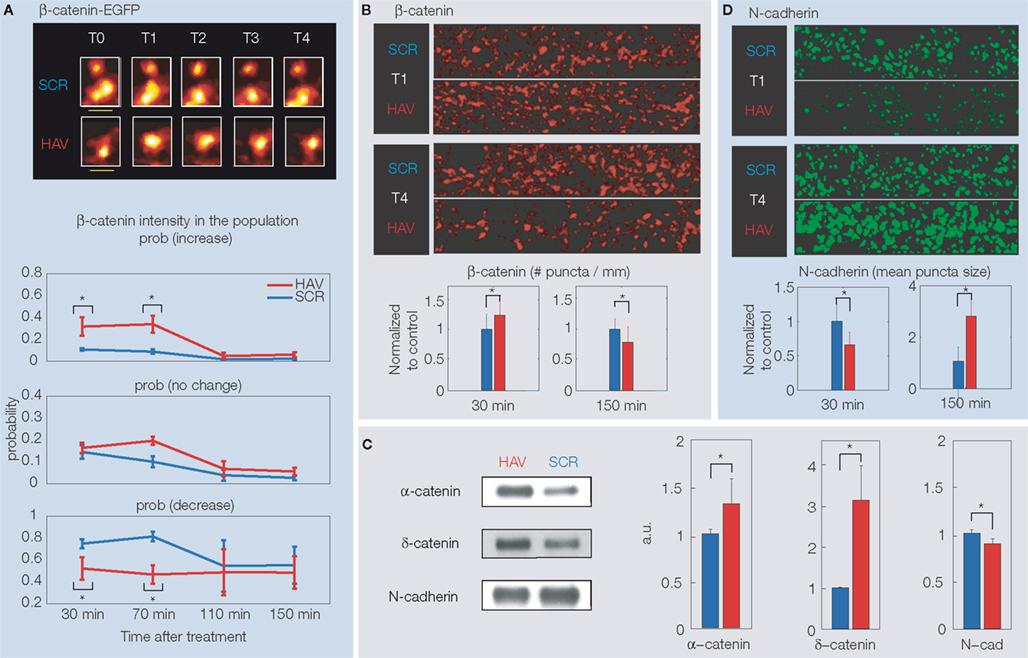
Figure 3. (A) Top panel: Example spine images showing the intensity of over-expressed β-catenin-EGFP after HAV or control treatment (at T = 0 min). T0 (baseline) = −10 min, T1 = 30 min, T2 = 70 min, T3 = 110 min, T4 = 150 min. The pseudocolor maps maximum intensity to white and minimum to black. Bottom panel: Summary data showing the probability at each timepoint of increase, decrease or no change in spine β-catenin with respect to the level at T0 = −5 min. (B) Example images of dendrites stained for endogenous β-catenin at T1 and T2, and summary data, showing a treatment-induced increase at T1 and a decrease at T2 in # β-catenin puncta per micrometer. A fluorescent secondary is used against a primary antibody to β-catenin, and the images are analyzed in 3D to determine puncta properties (Tai et al., 2007). (C) Results of immunoprecipitation of β-catenin at T1 (30 min) followed by probing for α-catenin, δ-catenin, and N-cadherin. Examples and summary data show an increase in binding of β-catenin to α-catenin and δ-catenin, but a decrease in binding to N-cadherin. (D) Example images of dendrites stained for endogenous surface N-catenin at T1 and T2, and summary data, showing a treatment-induced decrease at T1 and increase at T2 in the size/intensity of surface N-cadherin puncta. All panels present previously unpublished data.
This attempt at compensation is unsuccessful, however, as indicated by the functional impairment and the later loss of spines. Can this inability of β-catenin to stabilize spines be due to HAV-disruption of N-cadherin–β-catenin association? Indeed, immunoprecipitation experiments showed that HAV treatment significantly reduces the ability of N-cadherin to bind to β-catenin (Figure 3
C). Thus, HAV treatment interferes specifically with the ability of N-cadherin to bind to the excess β-catenin in spines, and may be the reason for the observed drop in spine β-catenin at later timepoints. A similar biphasic response was observed for bassoon, a presynaptic structural protein known to be a marker for active synapses, suggesting an overall structural disruption by the HAV treatment (data not shown). Further, immunostaining for surface N-cadherin also revealed a biphasic response: surface levels following treatment are initially very low, and are followed by a later, large increase (Figure 3
D). This result is consistent with an initial removal of the disrupted (non-functional) surface N-cadherin, followed by a replacement, presumably, with functional N-cadherin. Consistent with the overall trend of destabilization observed here, other studies (Schrick et al., 2007
) have shown that HAV peptide application in live animals immediately following contextual fear conditioning disrupts learning-induced N-cadherin dimerization and activation of cytoskeletally associated Erk-1/2, and a redistribution of IQGAP1, a protein known to stabilize surface N-cadherin molecules. In addition, this treatment blocks the acquisition of long-term contextual fear memory.
How do these results relating N-cadherin and spines fit with other results in the literature and with longer-term responses? Previous studies (Togashi et al., 2002
) involving the disruption of N-cadherin (in developing and mature synapses) have shown that the over-expression of a dominant-negative form for 3 days result in significant changes in synaptic protein organization and spine morphology (Togashi et al., 2002
). The authors observed a disruption in the distribution of synapsin (a presnaptic marker) and GAD, a reduction in synaptic vesicle recycling, and a decrease in the punctate nature of PSD-95 (a postsynaptic scaffolding protein) distribution. Structurally, the authors report a greater incidence of elongated (filopodia-like) dendritic protrusions, though there is no change in the overall spine density when compared to control. The presynaptic effects were less pronounced at mature synapses, than in developing synapses and led the authors to conclude that N-cadherin’s role in synaptic vesicle organization is greater during development and less prominent after maturity. Other studies (Okamura et al., 2004
) have shown that over-expression of dominant-negative forms of N-cadherin interfere with activity-dependent spine head enlargement. In terms of spine dynamics and the-cadherin complex, it has been shown that αN-catenin knockout mutations lead to greater incidence of fast motility of spines (Abe et al., 2004
).
Our findings on spine dynamics and synaptic function are consistent with a general role of N-cadherins for synapse stability. However, the severe effects of acute N-cadherin disruption we observe show that in contrast to the results in Togashi et al. (2002)
, N-cadherin is indeed a dominant player in regulating synaptic transmission in mature synapses, consistent with the recently reported effects of in vivo application of HAV peptide in mice (Schrick et al., 2007
). An unexpected finding in our work was the extent of large-scale structural and functional degradation following N-cadherin disruption. Our results show that the lack of change in spine density reported in Togashi et al. (2002)
, cannot be a reflection of spine density being held constant following N-cadherin disruption (as concluded there). Instead, it is likely the result of the initial disassembly of the existing synaptic apparatus followed by the eventual formation of new spines, and a rewiring of the circuit via new synapses. Since filopodia are thought to be precursors of spines (Dailey and Smith, 1996
), the greater occurrence of filopodia (Togashi et al., 2002
) may represent synapse formation in progress, consistent with this rewiring hypothesis.
The above results, taken together, suggest the following working model for the effects of N-cadherin disruption on structural changes and synaptic function at hippocampal synapses (Figure 4
). There is an early loss of synaptic function, followed by an increase in the fast timescale dynamics of some spines (consistent with a compensatory response involving search for presynaptic partners) and a reduction in the length of others (representing spines in different stages of instability). This instability is followed by a preferred loss of these unstable spines, the emergence of filopodia, and their eventual conversion to functional synapses. In parallel, at the molecular level, there is first an attempt at a compensatory response, then a disruption of synaptic vesicle organization and postsynaptic protein distributions, eventually followed by the formation of presynaptic terminals in association with the new synapses.
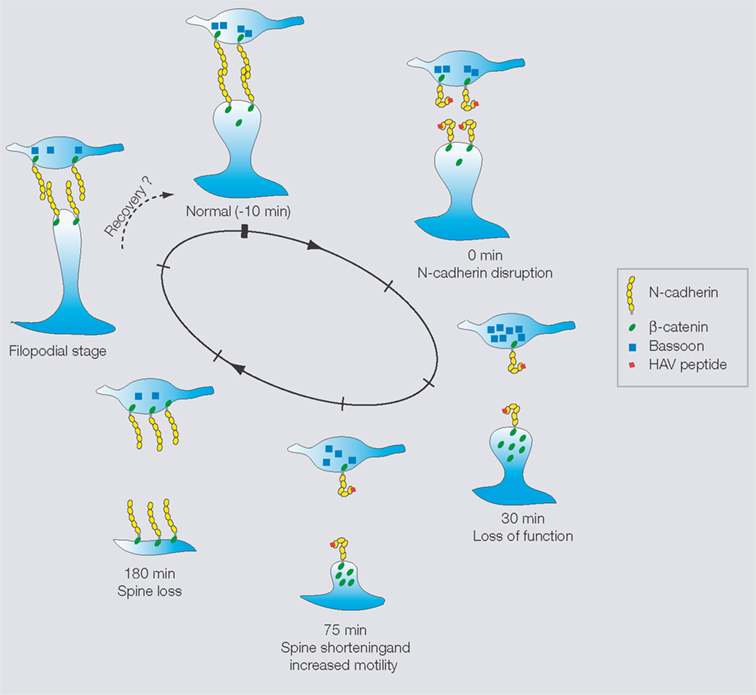
Figure 4. Working model of effects of N-cadherin disruption showing in each case, a presynaptic terminaland a postsynaptic spine.
Given the observed loss of spines at 3 h after acute N-cadherin disruption (ref), and no change in spine/filopodial density after 3 days of dominant-negative over-expression (ref), the formation of new filopodia and spine density recovery sometime after 3 h needs to be investigated via longer-term time-lapse experiments. This will reveal the time taken for structural recovery after N-cadherin disruption. Similarly, the eventual functional recovery hypothesized here needs to be experimentally tested via electrophysiological recordings and other measurements over a longer period. If synaptic function recovers, its time scale will be interesting to understand the extent to which a brief, but strong disruption affects the normal functioning of a cell. Correlative structure–function experiments in GFP-expressing neurons with presynaptic indicators such as FM dyes will convincingly reveal both kinds of changes in parallel. Investigations are also required to determine the contributions of pre- and postsynaptic factors to the observed reduction, and eventual recovery (presumably), of synaptic function after the disruption of N-cadherin signaling. Immunofluorescence experiments that track the distribution of key proteins like GluR1 (Silverman et al., 2007
), GluR2 (Saglietti et al., 2007
) (both AMPA receptor subunits), and NR1 (NMDA receptor subunit; Husi et al., 2000
), along with presynaptic activity measurements (for instance with FM dyes), will help in this effort. The molecular mechanisms underlying these changes need to be further investigated. Immunoprecipitation experiments at different timepoints with respect to β-catenin, and to N-cadherin, will help reveal the trajectory of key protein interactions. It is important to verify the hypothesis that the inability of β-catenin to bind to N-cadherin after HAV treatment plays a key role in subsequent structural effects. Given the role of the Rho family of small GTPases in regulating spine dynamics (Sekino et al., 2007
; Tashiro and Yuste, 2004
; Tashiro et al., 2000
) and their links to the N-cadherin adhesion complex (Anastasiadis and Reynolds, 2001
; Fukata and Kaibuchi, 2001
; Magie et al., 2002
; Okabe et al., 2003
), investigating their recruitment will be an important step. The above investigations (especially in brain slices) will be critical to achieve a fuller understanding of the role of N-cadherin in regulating structural and function stability at synapses.
The authors declare that the research was conducted in the absence of any commercial or financial relationships that could be construed as a potential conflict of interest.
This work was supported by HHMI and NIH R21MH076910-02.
Timescale of spine dynamics: Refers to the rate at which changes in spine morphology occur. Changes can occur at different timescales â on a second-by-second (e.g., membrane ruffling), minute-by-minute (e.g., spine twitching), hour-by-hour (e.g., changes in size) and day-by-day basis (e.g., appearance and disappearance of spines).