


- 1 Department of Neurobiology, Weizmann Institute of Science, Rehovot, Israel.
- 2 Department of Neurobiology, Silberman Institute of Life Sciences, and The Interdisciplinary Center for Neural Computation, Safra Campus, Givat Ram, Hebrew University, Jerusalem, Israel.
We propose a model of the primary auditory cortex (A1), in which each iso-frequency column is represented by a recurrent neural network with short-term synaptic depression. Such networks can emit Population Spikes, in which most of the neurons fire synchronously for a short time period. Different columns are interconnected in a way that reflects the tonotopic map in A1, and population spikes can propagate along the map from one column to the next, in a temporally precise manner that depends on the specific input presented to the network. The network, therefore, processes incoming sounds by precise sequences of population spikes that are embedded in a continuous asynchronous activity, with both of these response components carrying information about the inputs and interacting with each other. With these basic characteristics, the model can account for a wide range of experimental findings. We reproduce neuronal frequency tuning curves, whose width depends on the strength of the intracortical inhibitory and excitatory connections. Non-simultaneous two-tone stimuli show forward masking depending on their temporal separation, as well as on the duration of the first stimulus. The model also exhibits non-linear suppressive interactions between sub-threshold tones and broad-band noise inputs, similar to the hypersensitive locking suppression recently demonstrated in auditory cortex. We derive several predictions from the model. In particular, we predict that spontaneous activity in primary auditory cortex gates the temporally locked responses of A1 neurons to auditory stimuli. Spontaneous activity could, therefore, be a mechanism for rapid and reversible modulation of cortical processing.
Introduction
Neurons in the primary auditory cortex (A1) exhibit pronounced non-linearities in their responses to both simple and complex stimuli. For example, A1 neurons display strong phasic components in responses to many sounds, both in anesthetized (Calford and Semple, 1995 ; DeWeese et al., 2003 ; Phillips and Sark, 1991 ) and in awake (Bendor and Wang, 2005 ; Chimoto et al., 2002 ; DeWeese and Zador, 2005 ) animals; locking to the amplitude envelope of slowly fluctuating noise can be suppressed by sub-threshold pure tones (hypersensitive locking suppression, Las et al., 2005 ; Nelken et al., 1999 ); and spectrotemporal receptive fields of A1 neurons poorly predict their responses to natural stimuli (Bar-Yosef et al., 2002 ; Machens et al., 2004 ). Machens et al. (2004) have demonstrated that simple non-linear neural mechanisms, such as adaptation to mean sound intensity, rectification, or saturation, are not sufficient to explain their findings. Furthermore, Wehr and Zador (2005) have found that synaptic inhibition, which only lasts for up to 100 ms, is insufficient to fully explain the suppression of responsiveness of A1 neurons that can persist for hundreds of milliseconds following the presentation of a sound (Brosch and Schreiner, 1997 ; Creutzfeldt et al., 1980 ; Eggermont, 1999 ). They conclude that other intracortical mechanisms, such as short–term synaptic depression (Thomson and Deuchars, 1994 ), must be involved (see also Elhilali et al., 2004 ; Fishbach et al., 2003 ; Las et al., 2005 ).
Existing models of the auditory cortex that consider synaptic depression are feed-forward, focusing on the contribution of the depression of the thalamo-cortical synaptic connections to the output of single A1 neurons (Denham, 2001 ; Elhilali et al., 2004 ; Schiff and Reyes, 2005 ). These models, therefore, cannot account for the contribution of the intracortical circuitry to the responses of A1 neurons. In fact, A1 neurons are organized in synaptically interconnected ensembles (Atzori et al., 2001 ), and the connections between pyramidal neurons exhibit short-term synaptic depression (Atzori et al., 2001 ; Berger and Markram, unpublished data).
We recently studied the effects of synaptic depression on the dynamics of a recurrent neural network model of a cortical column (Loebel and Tsodyks, 2002 ; Tsodyks et al., 2000 ). We found that the network can generate sharp transient synchronization of its neurons’ activity, which we termed Population Spike (PS; note that we use the term PS for synchronous firing of large neuronal populations, and not transient field-potential responses that originate from such firing, as commonly used in the hippocampus literature (Andersen et al., 1971 )). The synchronous firing results from the recruitment of the network via the excitatory recurrent connections, which rapidly terminates due to the synaptic depression. When the recurrent connections are strong, the network exhibits a rhythmic activity characterized by a periodic train of spontaneous PSs. With weaker connections, we found that PSs can be induced by external inputs, with response features that resemble the responses of A1 neurons to similar auditory stimuli. For example, the network's response to a sustained excitatory input combines a single onset PS, if the input is stronger than a threshold, with a subsequent increase in the asynchronous activity of the network. Above threshold, the input amplitude is encoded by the latency of the PS response, with shorter latencies at higher input amplitudes (Heil, 1997 ; Loebel and Tsodyks, 2002 ). This temporal pattern matches the responses of A1 neurons to tonic stimulation, characterized by a temporally locked onset response followed by a sustained increase in the firing rate (Nelken et al., 1999 ; Ulanovsky et al., 2003 ). In addition, the ability of the network to follow a periodic input with a PS response decreases as the input frequency increases, in agreement with experimental observations (Kilgard and Merzenich, 1999 ; Lu et al., 2001 ).
These findings led us to hypothesize that the temporally locked spiking activity of A1 neurons in response to auditory stimuli reflects the near coincident activity of ensembles of neurons with similar best frequency (BF); and that this temporal coherence emerges from intrinsic properties of the intracortical circuitry, i.e. the expression of short-term depression at recurrent excitatory connections. Hence, the observed similarity in the response features of A1 neurons from the same cortical column (Chen and Jen, 2000 ; Dear et al., 1993 ; Kilgard and Merzenich, 1999 ; Shamma et al., 1993 ; Wallace et al., 2005 ) is predicted to follow from their participation within the same ensemble. We further hypothesize that PSs activity is an essential component of the neural processing in A1 (see e.g. Eggermont and Smith, 1996 ). Specifically, we propose that in response to auditory stimuli, PSs propagate via lateral connections along A1, mediating reliable signal transmission between distinct cortical sites with high speed and temporal precision. Recent experimental observations support the presence of PSs in the auditory cortex. In particular, intracellular recordings show that A1 neurons receive brief, highly synchronized synaptic inputs, which could be the correlate of PSs (Bendor and Wang, 2005 ; DeWeese and Zador, 2006 ; Las et al., 2005 ).
In order to explore our hypothesis, we constructed a model of A1 in which our network with short-term synaptic depression is considered as an iso-frequency column, and several such columns are connected along the axis representing the tonotopic gradient in A1 (Merzenich et al., 1975 ; Zhang et al., 2003 ). The resulting model supports the propagation of PSs along the tonotopic gradient and reproduces a wide range of experimental results. The model makes specific predictions concerning dynamic changes in response thresholds as a function of frequency, on the role of spontaneous activity in auditory cortex, and on the pattern of the thalamo-cortical connections into A1.
Materials and Methods
Modeling a Single Column
A functional iso-frequency column was simulated by a fully connected recurrent network of NE excitatory and NI inhibitory neurons. Their dynamics was based on the rate model of Wilson and Cowan (1972) , in which a neuron is represented by a firing rate variable, as described by the following equations:
The Ei (li) are the excitatory (inhibitory) rate variables, where i (l ) is a running index from 1 to NE (NI); τE (τI) is the corresponding time constant; and  determine the neurons’ refractory period. The total synaptic input received by a neuron was a sum of contributions from local excitatory and inhibitory neurons (with synaptic efficacies
  for excitatory to excitatory connections, and correspondingly for other connections, see Figure 1
A), from background synaptic inputs,
for excitatory to excitatory connections, and correspondingly for other connections, see Figure 1
A), from background synaptic inputs,  , representing the effects of projections from other brain areas, and from sensory inputs arriving from the medial geniculate body to excitatory neurons, si (its detailed description is presented in the following section). For simplicity, sensory inputs were not introduced to inhibitory neurons. We checked that the addition of such inputs did not alter the behaviour of the model. Intracortical connections targeting the excitatory population exhibited activity-dependent synaptic depression, which was described by factors x and y that were computed from Equation (2) below. The values of the background inputs were drawn from a uniform distribution, and neurons were labelled such that higher labels corresponded to higher inputs (i.e.
  and so forth). For simplicity, we chose threshold-linear form of the neuronal gain function,
  . With this choice of the gain, the units of e and si(t) were in Hz, and synaptic efficacies (, etc.) were without units.
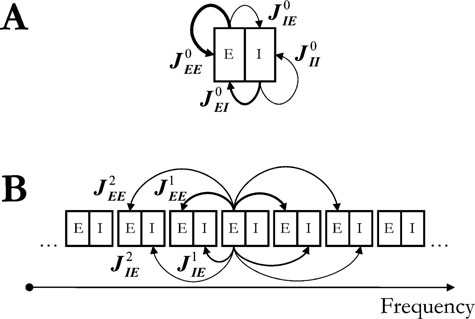
Figure 1. A schematic illustration of the model architecture. (A) Each column of the network is composed of interconnected excitatory and inhibitory pools of neurons. The width of the arrows represents the relative strength of a connection. (B) The cortical tonotopic axis. Inter-columnar connections originate from neurons of the excitatory pool of a column and target the neurons of its two nearest neighbour columns.
The dynamics of the factors that governed the activity-dependent synaptic depression was described by the following equations (Abbott et al., 1997 ; Tsodyks and Markram, 1997 ):

In short, the model assumes that a given synaptic connection has a finite amount of resources for synaptic transmission. At any time, a fraction x (y) of the maximal amount of resources is available, of which only a portion, determined by the parameter U, is utilized in response to an action potential, reducing the fraction of available resources by Ux (Uy). The utilized resources recovered with a single time constant, τrec. We did not introduce synaptic facilitation in the connections targeting inhibitory neurons, since we know from the previous studies that it does not significantly affect the occurrence of the PSs in the network (Tsodyks et al., 2000 ).
In simulations, the following values of the parameters were used unless specified otherwise:
The values of τrec and U were based on experimental data from measurements at the somatosensory cortex (Tsodyks and Markram, 1997
), and were supported by preliminary measurements from the primary auditory cortex (Berger and Markram, unpublished data). The values of  and
and  were selected so that the mean spontaneous activity was several Hz (Abeles, 1991
); and the values of τE and τI approximate synaptic conductance's dynamics, following the work of Treves (1993)
. The values of the synaptic efficacies were set according to the results of (Loebel and Tsodyks, 2002
). Specifically, in Loebel and Tsodyks (2002)
we have shown that PSs appear spontaneously if the recurrent excitatory connections strength is above a certain critical value that depends on the parameters of the model. In this study, we chose the connection strength below this critical value, such that PSs can only appear in response to external inputs. The values of
were selected so that the mean spontaneous activity was several Hz (Abeles, 1991
); and the values of τE and τI approximate synaptic conductance's dynamics, following the work of Treves (1993)
. The values of the synaptic efficacies were set according to the results of (Loebel and Tsodyks, 2002
). Specifically, in Loebel and Tsodyks (2002)
we have shown that PSs appear spontaneously if the recurrent excitatory connections strength is above a certain critical value that depends on the parameters of the model. In this study, we chose the connection strength below this critical value, such that PSs can only appear in response to external inputs. The values of  were selected in order to achieve an approximate balance of excitation and inhibition.
Finally, we have previously shown that the qualitative features of the network dynamics do not depend on the precise values of the parameters. We have also shown that our results, obtained with rate equations, were similar when we used more realistic, integrate and fire spiking neuron model (Tsodyks et al., 2000 ; Loebel and Tsodyks, 2002 ).
Modeling A1
P columns were labelled from 1 to P, with each label representing a columns placing along the tonotopic map of A1 with increasing auditory frequencies (Figure 1
B) (Merzenich et al., 1975
; Zhang et al., 2003
). An excitatory neuron within column Q has synaptic connections to all of the excitatory (inhibitory) neurons of columns Q ± 1 and Q ± 2 with efficacies of connections  and
and  , respectively. As within a column, synapses targeting excitatory neurons were modelled with activity-dependent synaptic depression (with the same values for τrec and U), and synapses targeting inhibitory neurons were modelled without the effects of short-term plasticity. With the addition of the intercolumnar connections, the complete system of equations that describe the dynamics of the rate variables has the following form (superscripts denote columns labelling along the map):
The complementary equations for the time evolution of the synaptic depression factors  are as in Equation (2), with the addition of the superscripts where appropriate.
The sensory inputs to the cortex were represented by a sum of iso-frequency contributions, each a product of temporal and spatial components:

where  is the sensory input received by the i-th neuron of column Q when an input was presented with the frequency of column M; ζM(t) represent its temporal envelope; and the spatial component,
  , determined its amplitude as follows:

A is the peak magnitude of the input, at column M; and λS(A) is a parameter that determines how localized is its effect over the cortical sheet. The dependency of λS(A) on the amplitude A reflected the increase in the width of frequency tuning with increasing sound level throughout the auditory system (Hudspeth, 2000 ). For that purpose, the following relation was chosen:
where δ is the auxiliary parameter for determining the degree of localization of a sensory input at high sound levels. Choosing equal values of δ for Q < M (δleft) and for Q > M (δright) resulted with a symmetric effect of a sensory input around column M (Figure 5 B); while non-symmetric effects were simulated by using different values of δleft and δright. An example of the temporal and spatial envelopes of a sustained pure tone is illustrated in Figure 2 (middle and lower panels, respectively).
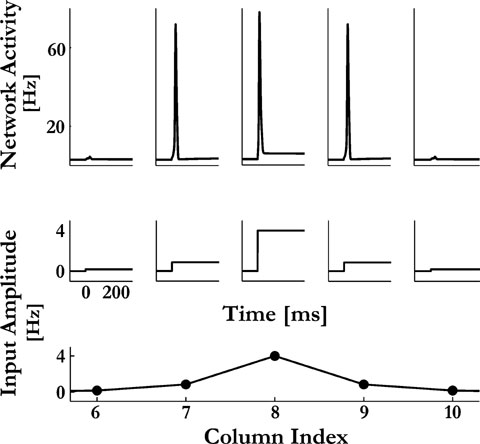
Figure 2. Response of the model to a sustained pure tone input. At time 0 a sensory input is presented with the best frequency of column 8 for 400 ms. The spatial spread of the input is shown at the bottom panel, where the ordinate represents the amplitudes given to the excitatory neurons at the appropriate columns. The mean activity of the excitatory neurons  in columns 6–10 is depicted at the top panel. In this example only column 8 received a supra PS-threshold sensory input. The PS response spread to columns 7 and 9 via the inter-columnar cortical connections.
In simulations, the following values of the parameters presented in this section were used, unless specified otherwise:
In addition, only neurons that displayed non-zero spontaneous activity received sensory stimuli (neurons i = 41…100 for our choice of parameters). The reason for this arrangement is explained in Results (see Figure 11 ).
Results
Basic Properties of the Model
We consider an iso-frequency column as an interconnected network of excitatory and inhibitory neurons, with activity-dependent synaptic depression in the connections onto excitatory neurons. Several such columns are connected along an axis, analogous to the anterior–posterior axis of the tonotopic mapping of A1 (Figure 1 ; Merzenich et al., 1975 ; Zhang et al., 2003 ). The excitatory neurons of each column project to other columns, with connection strength that is decreasing with the distance between the columns. Every neuron receives randomly distributed background input, resulting in the spontaneous population activity with distribution similar to that observed in A1 (Nelken, unpublished data). In addition, the excitatory neurons receive sensory inputs that represent thalamo-cortical activity induced by auditory stimuli. These inputs are computed as a product of a spatial component, which represents the extent of the thalamic input into A1, and a temporal component, which represents the temporal structure of the stimuli (see Methods for more details).
An example of the temporal and spatial components of the sensory inputs is illustrated in Figure 2
(middle and lower panels, respectively), together with a typical response of the model: at the steady state, the average activity of the neurons at each column is on the order of a few Hz, representing asynchronous spontaneous activity. When a sensory input that is strong enough is introduced, the corresponding column emits a single onset PS that may subsequently spread to neighboring columns. The extent of the spread of the PS signals along the cortical map was mainly determined by the sensory input and by the efficacies of the intercolumnar connections (e.g.  ). The connections were fixed at levels that enable PSs to propagate in a gradual manner from one column to another, such that the spread of the PS responses is increasing with the inputs amplitude (Figure 3
). For sustained inputs, after the termination of PS each column exhibited an increase in the asynchronous activity that was proportional to the input intensity as a function of stimulus frequency and amplitude.
). The connections were fixed at levels that enable PSs to propagate in a gradual manner from one column to another, such that the spread of the PS responses is increasing with the inputs amplitude (Figure 3
). For sustained inputs, after the termination of PS each column exhibited an increase in the asynchronous activity that was proportional to the input intensity as a function of stimulus frequency and amplitude.
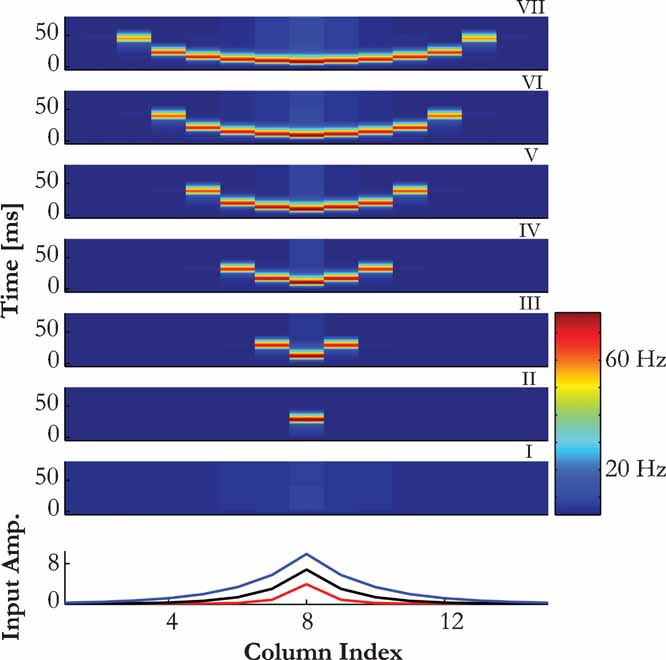
Figure 3. Localization of PS induced activity. (A) Colour map of the network activity, illustrating the spread of a PS for sensory inputs of increasing amplitude (panels I – VII). Bottom graph shows spatial extent of stimuli with three different amplitudes, corresponding to panels II, IV and VI above.
We wanted to estimate the speed of propagation of PSs. To calibrate the cortical dimensions of our model, we used two rough estimates. In the rat, neurons have tuning widths at mid-levels that correspond to about 25% of the frequency range to which a rat is sensitive (Kilgard and Merzenich, 1999 ). As the whole extent of A1 in the rat is few mm, we estimate the cortical extent of the model to be about 1 mm. A similar value is reached for the A1 in the cat, where the tuning width at mid input amplitudes is on the order of one octave, which corresponds to about 1 mm as well (Moshitch et al., 2006 ). With the selected parameters of the model, PS propagation to the edge of the receptive field takes about 25 ms (Figures 3 and 4 B). Thus, the speed of propagation of the PS in the model is 40 mm/second, which is in the order of experimentally estimated speed of propagation of intracortical signals (Bringuier et al., 1999 ).
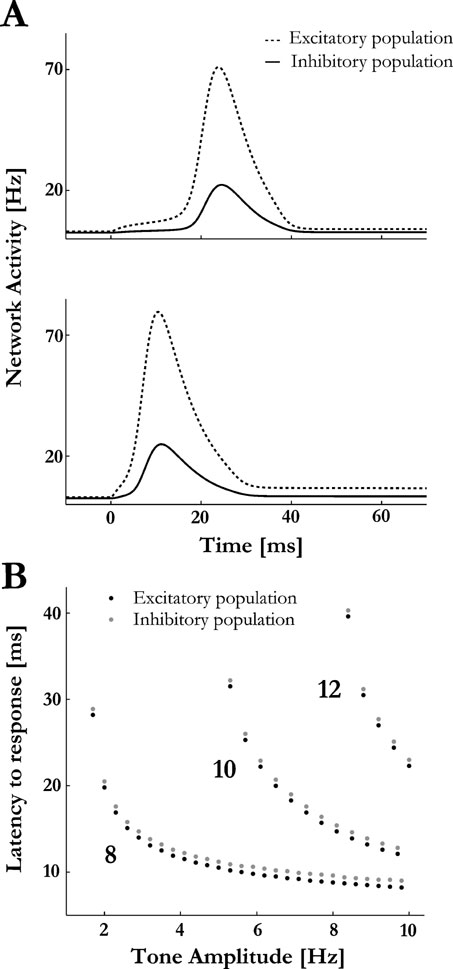
Figure 4. Temporal co-tuning of excitation and inhibition. (A) The responses of the excitatory and inhibitory pools of neurons of one column to a weak and strong pure tone inputs are plotted (top and lower panels, respectively). The onset times of the PSs responses of the excitatory pool depend on the inputs’ amplitude, but the responses of the inhibitory pool are locked to the PS onset. (B) A summary of the latency to the PS response at the excitatory and inhibitory populations at column 8 as a function of tone amplitude, for different tone frequencies (the frequency of the tones is marked next to the curves). The inhibitory response follows the excitatory response for each tone amplitude with a 1ms delay.
It has been observed in A1 that the excitatory and inhibitory components of the synaptic conductance are co-tuned with a stereotypical temporal ordering (Las et al., 2005 ; Wehr and Zador, 2003 ; Zhang et al., 2003 ), such that the initial excitatory conductance is accurately followed by inhibition with a few milliseconds delay. For most A1 neurons the delay is independent of frequency and intensity of the auditory stimuli (Las et al., 2005 ; Wehr and Zador, 2003 ). Our model easily accounts for these observations, because PSs are triggered within the excitatory sub-population and subsequently recruit the inhibitory neurons of the same column. Hence, while the latency of a PS response depends on the amplitude and frequency of the sensory inputs, the relative timing between excitation and inhibition is determined by the intrinsic dynamics of the network and is therefore independent on the input (Figure 4 ).
Frequency Tuning Curves
FTC (FTC) are plots of thresholds to isolated pure tone stimuli as a function of tone frequency. Most neurons in A1 have FTCs with a stereotypic ‘V’ shape showing a single distinct BF (Schreiner et al., 2000 ; Ulanovsky et al., 2003 ). Similarly, FTCs in the model were calculated with pure-tone like inputs (of 50 ms duration) of various amplitudes and frequencies. The stimuli were presented when the network was at the steady-state spontaneous rate, so that the response to a stimulus was not affected by previous stimulus presentations. The minimum amplitude that induced a PS response at a certain column was determined as a function of the input frequency, resulting in a characteristic ‘V’-shaped FTC (Figure 5 A; here and below we use a middle column to illustrate the model behavior).
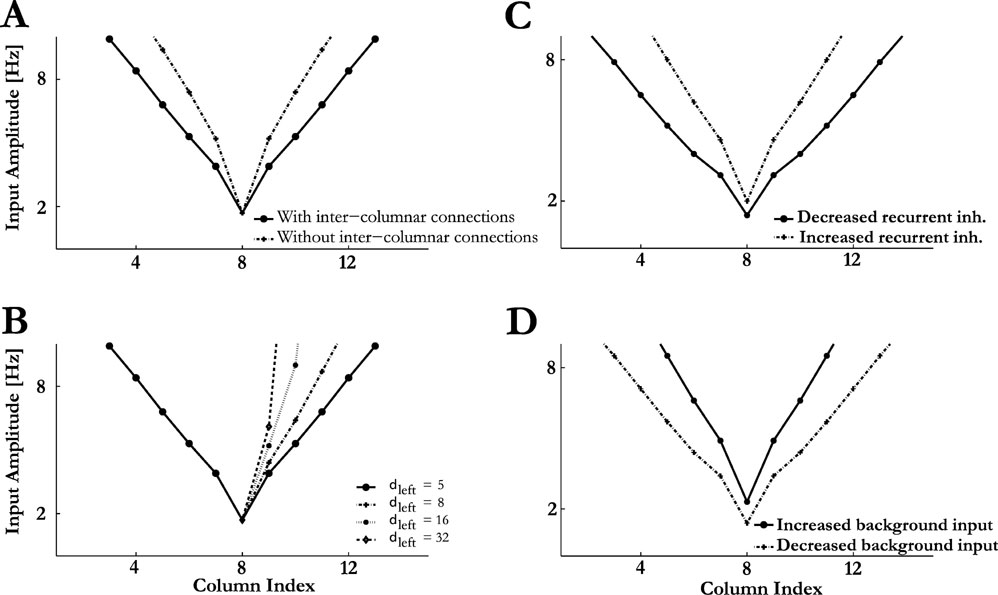
Figure 5. Frequency tuning curves (FTC). (A) FTC in networks with and without inter-columnar connections. (B) Asymmetric spatial spread of the sensory input, modelled by selecting different δleft and δright (see methods; Equation (5)) result in asymmetric FTCs. δleft = 5, with varying δright. (C) Effects of recurrent inhibition modulation on the shape of FTC. (D) Effects of background input modulation on the shape of FTC.
While frequency selectivity in A1 is primarily inherited from its inputs (unlike the corresponding feature selectivity in other sensory areas, such as e.g. the primary visual cortex, Hubel and Wiesel, 1962
), experimental findings indicate that at a given cortical site thalamo-cortical and intracortical pathways preferentially mediate responses to BF and non-BF stimuli (Kaur et al., 2004
). Indeed, the bandwidth of the model FTC was determined both by the spatial spread of the sensory inputs and by the ability of PSs to propagate along the cortical map. This feature of the model can be demonstrated by modifying the efficacies of the lateral intercolumnar connections ( and  ). Weaker intercolumnar connections reduced the spread of the PSs to nearby columns, narrowing the FTC. With very weak intercolumnar connections, the PS responses of the model were induced mainly by the sensory input. On the other hand, changing the intercolumnar connection strengths had no impact on PS threshold and onset latency at the BF, since at that frequency it was always evoked by the sensory input (Figure 5
A, see Kaur et al., 2004
).
). Weaker intercolumnar connections reduced the spread of the PSs to nearby columns, narrowing the FTC. With very weak intercolumnar connections, the PS responses of the model were induced mainly by the sensory input. On the other hand, changing the intercolumnar connection strengths had no impact on PS threshold and onset latency at the BF, since at that frequency it was always evoked by the sensory input (Figure 5
A, see Kaur et al., 2004
).
FTCs are often asymmetric, with different slopes of their upper and lower edges. This feature is at least partially inherited from peripheral responses. However, cortical tuning curves may be substantially wider than peripheral tuning curves (Moshitch et al., 2006 ), and therefore central processes might play a role in determining the symmetry of the cortical FTCs. In the model, FTC symmetry could be manipulated by choosing the parameters of the sensory input that control its localization around the BF (see Methods, Equation 6), while keeping all other parameters of the model fixed (Figure 5 B). Thus, asymmetry of the sensory input results in asymmetry of the cortical FTCs.
While the occurrence of the PSs in the model is due to the synaptic depression of the recurrent excitatory connections, the precise shape of the FTCs is also influenced by recurrent inhibition. In particular, reducing the level of recurrent inhibition ( and
and  ) results in wider FTCs and lower response thresholds (Figure 5
C). This is in agreement with experimental studies showing that microinjections of the GABAA antagonist bicuculline lead to expansion of FTC of A1 neurons and to decreased thresholds in response to BF tones, in a columnar-specific manner (Chen and Jen, 2000
; Wang et al., 2002
). In addition, the PS responses were larger in amplitude for lower feedback inhibition (results not shown), in agreement with experimental findings of higher neural activity in response to sounds after bicuculline application (Chen and Jen, 2000
; Wang et al., 2002
).
) results in wider FTCs and lower response thresholds (Figure 5
C). This is in agreement with experimental studies showing that microinjections of the GABAA antagonist bicuculline lead to expansion of FTC of A1 neurons and to decreased thresholds in response to BF tones, in a columnar-specific manner (Chen and Jen, 2000
; Wang et al., 2002
). In addition, the PS responses were larger in amplitude for lower feedback inhibition (results not shown), in agreement with experimental findings of higher neural activity in response to sounds after bicuculline application (Chen and Jen, 2000
; Wang et al., 2002
).
Rapid and Reversible Modulation of Network Responses by the Modulation of Spontaneous Activity
Neurons in A1 exhibit various levels of spontaneous activity, which presumably reflect inputs from other cortical neurons of the same region and from distinct brain areas. A novel characteristic property of the model is the strong influence of spontaneous activity on the ensembles response. In particular, the PSs strongly depend on the strength of the connections between the neurons of the excitatory pool of a column. A neuron with high spontaneous activity would have weaker effective synaptic connections since its synapses would be in a depressed state. Hence, for two identical sets of absolute synaptic efficacies, different distributions of spontaneous activity across the excitatory pool of neurons of a column result in different states of its synaptic connections, and therefore different response properties to sensory stimuli.
For example, uniformly reducing the spontaneous activity by shifting the distribution of the background inputs toward more negative values ( and
and  for all i,l and Q,see Equation (3)), leads to stronger effective connectivity between the neurons as the synapses are less depressed on average. As a result, the threshold for PS at best frequency is lower and it can propagate further, resulting in wider FTCs (Figure 5
D). Once the background inputs are shifted back to their default values, so does the spontaneous activity of the network, and the FTCs returns to their original form with a time scale of τrec (data not shown). Thus, appropriately adjusting the spontaneous activity may represent a mechanism for rapid and reversible modulation of the responses of neuronal circuits.
for all i,l and Q,see Equation (3)), leads to stronger effective connectivity between the neurons as the synapses are less depressed on average. As a result, the threshold for PS at best frequency is lower and it can propagate further, resulting in wider FTCs (Figure 5
D). Once the background inputs are shifted back to their default values, so does the spontaneous activity of the network, and the FTCs returns to their original form with a time scale of τrec (data not shown). Thus, appropriately adjusting the spontaneous activity may represent a mechanism for rapid and reversible modulation of the responses of neuronal circuits.
Two-tone Interactions: Forward Masking
Presenting pairs of tones in quick succession uncovers highly non-linear dynamical processes in A1. Commonly, the first stimulus (a masker) can suppress responses to subsequent stimuli for hundreds of milliseconds, resulting in forward masking (Brosch and Schreiner, 1997 ; Calford and Semple, 1995 ; Wehr and Zador, 2005 ). In a recent study, Wehr and Zador (2005) used invivo whole cell recordings to measure the synaptic conductances evoked by pairs of brief identical sounds. Although suppressive effects lasted for hundreds of milliseconds, inhibitory conductances did not last longer than 50–100 ms, suggesting that synaptic inhibition is unlikely to play a role in forward suppression beyond the first 100 ms after a stimulus. Wehr and Zador (2005) also found that thalamic auditory neurons have a significantly faster recovery from suppression than A1 neurons. Thus, forward masking seems to have a significant cortical component different from long-lasting inhibition. Other cellular mechanisms, such as post-discharge adaptation, have also been found inadequate for explaining forward masking (Calford and Semple, 1995 ).
In Figure 6 we show forward masking in our model. It has similar features to those observed by Wehr and Zador (2005) . Both tone pips were identical, with amplitude that could elicit a PS response at the corresponding column when presented individually. However, when presented in succession, a response to the masker suppressed the response to the following tone pip for short enough inter-stimulus intervals. The suppression of the second stimulus results from the short term depression expressed at the synaptic connections between the excitatory neurons within a column: after the PS in response to the masker, these synaptic connections are depressed, hence the ability of the network to be recruited for a second PS is diminished (Loebel and Tsodyks, 2002 ; Tsodyks et al., 2000 ). This observation is further reflected in the gradual recovery from masking, which follows an exponential recovery process governed by the time constant of recovery from synaptic depression (Figure 6 B). In addition, the gradual recovery of the neurons of the inhibitory pool was determined by the same process, resulting in an identical time course of recovery, as observed experimentally ((Wehr and Zador, 2005 ); results not shown).
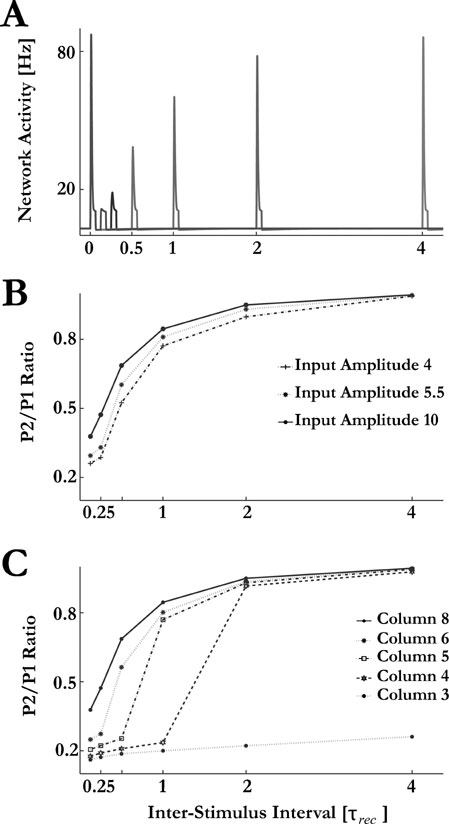
Figure 6. Forward masking: dynamics of recovery. (A) Network response to pairs of identical pure tones (50 ms duration, amplitude of 10 Hz, first tone presented at time ‘0’) at the BF of column 8 with different interstimulus intervals, shown in time units of depression time constant. (B) The recovery dynamics for different input amplitudes. Presented is the ratio between the column responses to the second and first tone. (C) The recovery dynamics at column 8 for input pairs with frequencies corresponding to BFs of different columns.
Interestingly, the time course of recovery is similar for different input amplitudes (Figure 6 B). This is due to the stereotypical nature of the PS in response to the masker– once it occurs, it is largely independent of the stimulus that elicited it (Loebel and Tsodyks, 2002 ). This in turn leads to similar levels of depression among the synaptic connections of the ensemble, which results with similar recovery dynamics.
In contrast, the dynamics of recovery from forward suppression was strongly dependent on the frequency of the tone pips: the farther the frequency of the tone pips was from the BF of the column from which the activity is recorded, the longer was the delay of the recovery from suppression of the PS response to the second stimulus at that column (Figure 6 C). The reason is that in this case, PSs are generated at a column corresponding to the stimulus frequency and then propagate to the recording site through intracortical connections. For the second PS, this propagation is suppressed both due to depressed intracolumnar connections and smaller PS amplitudes at the intermediate columns (Figure 7 ).
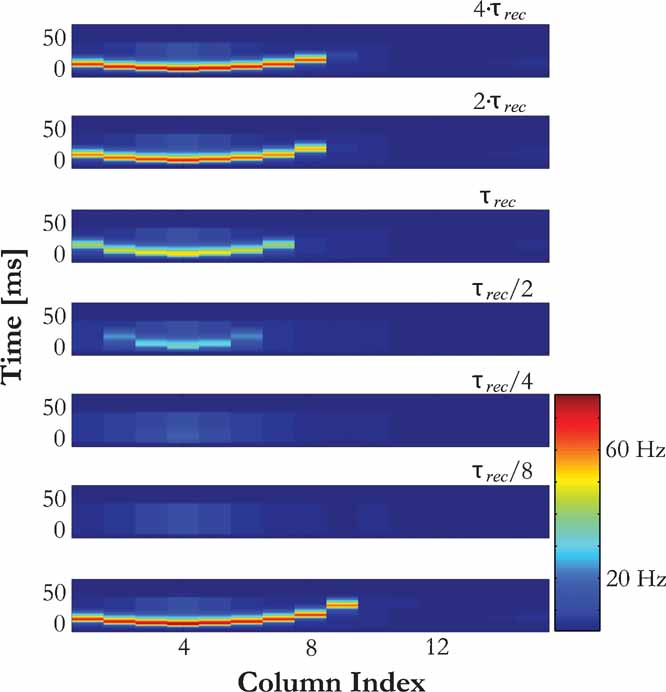
Figure 7. Recovery dynamics from forward masking depends on the intra-cortical pathway. The response of the model to a masker with the frequency of column 4 (bottom panel) and the responses to probes with the same frequency at different inter-stimulus intervals (upper panels) are displayed. The delay in the recovery of the PS to the probes at column 8 depends on the recovery of the intracortical pathway that mediates the propagation of PS activity between columns 4 and 8. The ISI for a given pair of inputs is marked above each panel.
We, therefore, predict that receptive fields of A1 neurons dont recover uniformly from forward masking. Recovery occurs first at frequencies near the neurons’ BF and preferentially at higher amplitudes, followed by a progressive expansion of the receptive fields back to their original form. We illustrate this prediction in Figure 8 . The FTC was measured using pairs of identical tone pips of 50 ms duration, separated by varying interstimulus-interval. The figure presents the FTC for the first and for the second stimuli. As can be observed, for short ISI the FTC in response to the second stimulus covered only a fraction of the FTC in response to the masker. The FTC in response to the second stimulus recovered with a time constant comparable to τrec.
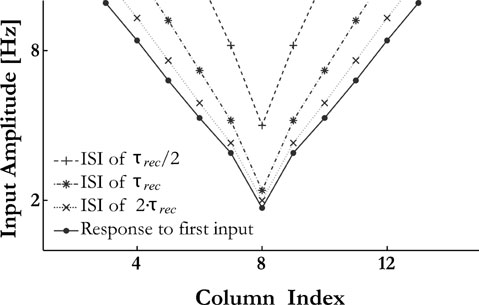
Figure 8. The receptive field of a column depends on the history of the inputs. Pairs of identical pure tones were presented with different ISIs. FTCs for the second tone is computed as a minimal amplitude at which the second PS with the strength of 0.6 of the first one is emitted.
Forward masking depends also on the duration of the masker as shown by Brosch and Schreiner (1997) . They used maskers of varying frequency and sound level, and tested their effects on the responses to a near-threshold, short BF tone (a probe). Figure 9 A shows the response of the model to the maskers of different frequencies and amplitudes. As found in experiments, when the probe was presented just after a masker of a short duration, a response to a masker induced a complete suppression of the response to the probe (Figure 9 B). When the probe was presented with a long delay after the offset of a short masker, there was only minor suppression of the responses to the probe (Figure 9 C). Figure 9 D shows the responses to the probe when the masker duration was selected such that the time from masker onset to probe onset was the same as in Figure 9 C, but the time from masker offset to probe onset was the same as in Figure 9 B. If the response to the probe tones would be determined only by the time elapsed from masker onset, Figure 9 D should have been identical to Figure 9 C. Alternatively, if the response to the probe tones would be determined only by the silent interval between the masker and the probe, Figure 9 D should have been identical to Figure 9 B. In fact, the results were intermediate: suppression was substantially larger than in Figure 9 C, but not as strong as in Figure 9 B). These modeling results qualitatively match the experimental findings (cf. Figure 13 in Brosch and Schreiner, 1997 ). The model accounts for this pattern of responses as follows. The suppression of the PS response to the probe (see Figure 9 B) is due to the depressed state of the synaptic connections within column 8 resulting from the PS in response to a masker, and the recovery of the PS response to the probe in Figure 9 C is due to the recovery of these synaptic connections during the silent period between the masker and the probe. The long tone used in Figure 9 D causes an onset PS response, and this onset response is now followed by an increase of the asynchronous activity of the neurons within the ensemble (Loebel and Tsodyks, 2002 ). Maskers with frequencies that are closer to the BF of column 8 induce asynchronous activity high enough to maintain the depressed state of the synapses after the onset PS response (in response to the masker onset), preventing a subsequent PS (in response to the probe onset). In contrast, maskers with frequencies far from the BF of column 8 induce much less asynchronous activity, and the synapses of column 8 recovered enough to allow the generation of a PS in response to the probe.
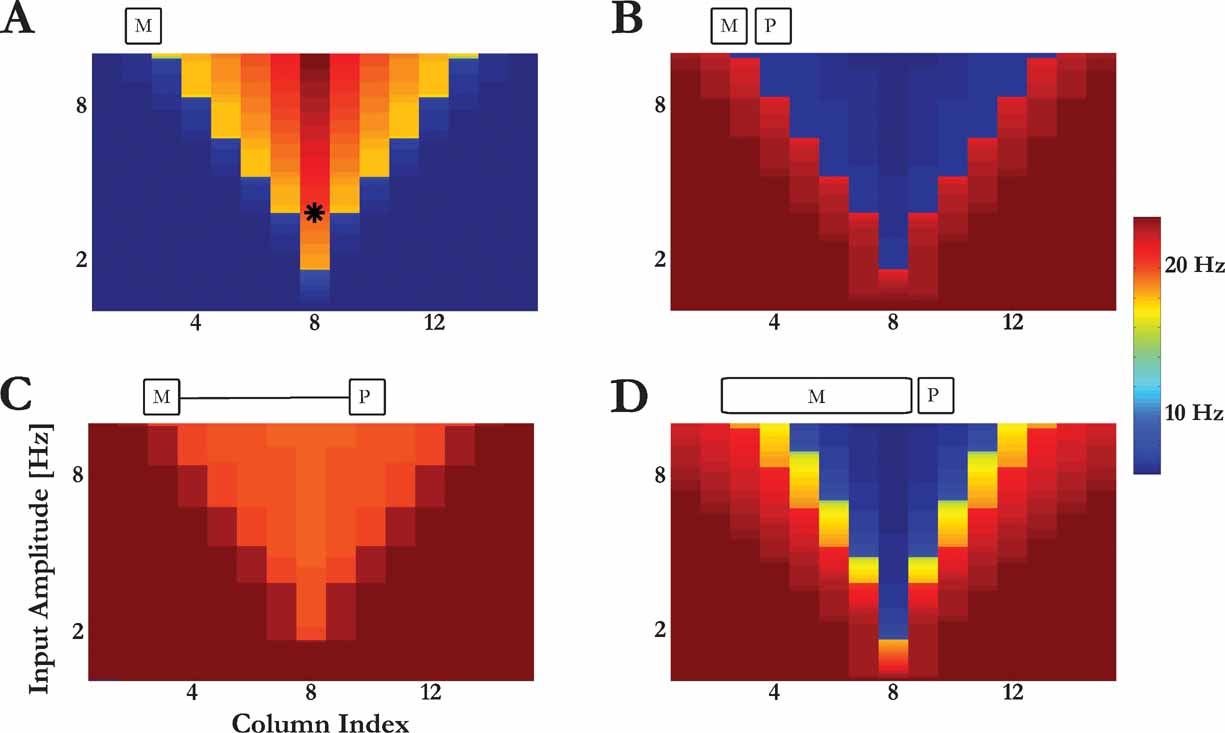
Figure 9. Forward masking: dependency on the duration of the first stimulus. (A) The responses of column 8 to short maskers with varying frequencies and amplitudes. Color code illustrates the average response during the input. (B) The responses of column 8 to a probe with the BF of column 8 (marked with a star in (A)), when presented shortly after a masker. The response is shown as a function of the frequency and amplitude of the preceding masker. (C) Response to the probe (as in (B)) for long silent interval between masker and probe. (D) Response to the probe (as in (B)) for a long masker. The stimulus configurations are schematically displayed on top of each panel.
Pairs of tones have also been used in a different way, to measure inhibitory sidebands of auditory neurons (Rotman et al., 2001 ; Shamma et al., 1993 ). In these experiments, the first tone pip of each pair had a varying frequency (similar to the masker at the previous section). The second tone pip, the probe, was presented at the neurons’ BF before or just after the offset of the masker, with amplitude close to threshold. It was observed that responses to the probe were generally present when the masker frequency was outside the FTC, and that the probe response was suppressed if the neuron responded to the masker. Interestingly, a response to the probe was sometimes partially or even fully suppressed when there was no response to the masker; this happened with masker frequencies just outside the FTC. This result was, at least in part, attributed to the effects of lateral inhibition between neurons with adjacent BF (Calford and Semple, 1995 ; Rotman et al., 2001 ; Wallace et al., 2005 ; Zhang et al., 2003 ). However, this view is inconsistent with the co-tuning of the excitatory and inhibitory receptive fields of A1 neurons (Wehr and Zador, 2003 ; Zhang et al., 2003 ), which suggest that other mechanisms may underlie lateral suppression (Fishbach et al., 2003 ).
In the model, lateral suppression emerges due to synaptic depression (Figure 10 ). Specifically, we demonstrate that a PS response to the probe can be suppressed even when there was no PS response to the masker. This will occur when a masker, which is not in the receptive field of the column from which the activity is recorded, induces an increase in the asynchronous activity sufficient to prevent a PS response at the time of the probe.
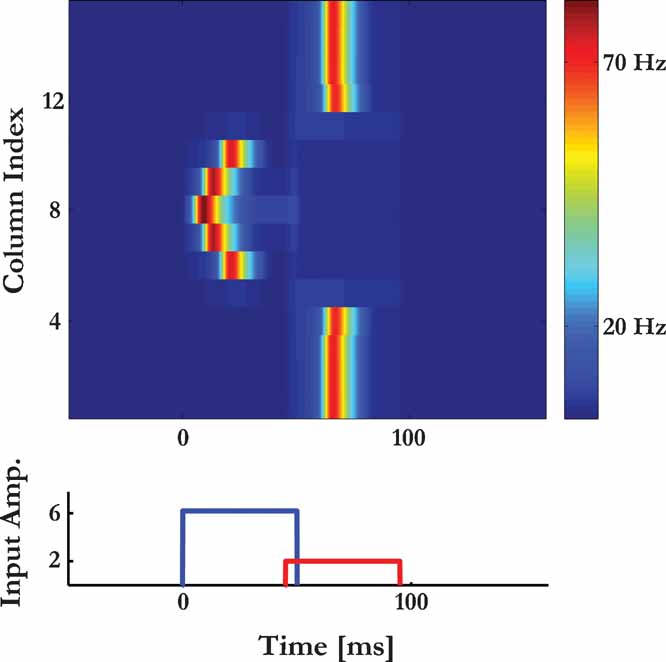
Figure 10. Lateral suppression. Responses of column 8 to overlapping tone pairs (schematically displayed at the bottom) as a function of the frequency of the first tone. The frequency of the second tone is fixed at the BF of column 8.
Hypersensitive Locking Suppression
In hypersensitive locking suppression, the locking of auditory neurons to the amplitude envelope of slowly fluctuating noise is paradoxically suppressed by the addition of low-level tones. The suppression can occur even at tone levels that are sub-threshold, i.e. at levels that are insufficient to induce an onset spiking response when the tones are presented alone (Las et al., 2005 ; Nelken et al., 1999 ).
We have previously demonstrated that synaptic depression is a possible mechanism for locking suppression (Loebel and Tsodyks, 2002 ). Here, we simulated the modulated broad-band noise with a train of excitatory clicks to all columns simultaneously, with amplitude high enough to elicit full entrainment of the PS responses at each column. The addition of a sustained tonic stimulus resulted in an increase of the asynchronous activity of the neurons at the corresponding column, which in turn shifted the effective recurrent synaptic connectivity to a more depressed state, preventing subsequent recruitment of the network to emit PSs. The tone amplitude that is required for suppression depends on the connectivity profile of the thalamic inputs in the network. When the connectivity is uniform, full suppression is only achieved for tone amplitudes significantly higher than threshold for eliciting a PS response when presented alone (Figure 11 A). The hypersensitive locking with sub-threshold tonic inputs can be achieved if the thalamic inputs preferentially target neurons with above-zero spontaneous rate (Figure 11 B). Adding a sustained tone with the BF of column 8 fully suppressed the PS responses to subsequent phases of the noise, even though the tone amplitude was sub-PS threshold, i.e., it elicited no PS response when presented alone. Furthermore, in agreement with experimental findings, the effects of adding the tone were local to the responses of column 8, with little or no suppression of the responses of the other columns to the modulated noise (results not shown; see Rupp et al., in press ). We note, however, that the locking suppression in our model begins from the first cycle after the tone onset, and not from the second cycle as observed in (Las et al., 2005 ).
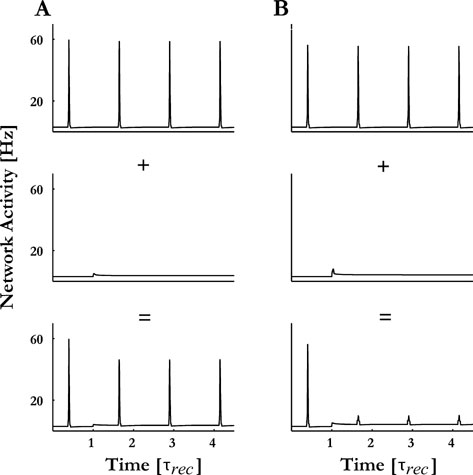
Figure 11. Hyper-sensitive locking suppression. (A) Modulated noise was simulated by presenting clicks to all columns simultaneously so that all columns emitted one PS per click. Adding a sustained pure tone with the BF of column 8 and with a sub-PS threshold amplitude (middle panel) on top of the modulated noise lead to a gradual decrease in columns 8 responses following the tone onset (lower panel). (B) When the inputs (both the modulated noise and the sustained pure tone) were presented only to the spontaneously active neurons within the excitatory pool of each column, a complete suppression of the PSs responses to the clicks that followed the onset of the tone was observed.
Response to Frequency Modulated Sweeps
Typically, the activity of A1 neurons is measured in response to FM sweeps that cover a large range of frequencies centered at the BF of the neuron whose activity is measured, and with an amplitude that is kept fixed during the sweep. The responses of A1 neurons are composed of short bursts of spikes, and depend on the specific parameters of the sweeps, such as their direction (up or down frequency trajectories) and velocity (Heil et al., 1992 ; Nelken and Versnel, 2000 ; Zhang et al., 2003 ). This dependency is already present at sub-cortical nuclei (Clopton and Winfield, 1974 ; Britt and Starr, 1976 ). Indeed, a feed-forward model of neural responses in A1 successfully account for these findings (Fishbach et al., 2003 ).
Here we focus on the additional feature of the responses of A1 neurons to FM sweeps: the linear relation between the sweep velocity and the latency to a neurons response (Heil et al., 1992 ; Nelken and Versnel, 2000 ). From this relation, it follows that the response occurs at a specific triggering frequency, which is independent of the sweep velocity. The triggering frequency falls within the neurons receptive fields, and is above BF for downward sweeps and below BF for upward sweeps. These observations suggest that the front of the propagation of the activity along A1 is temporally synchronized with the FM sweep that induces it, regardless of its velocity.
The model reproduces the above observations. The PS response at column 8 was observed before either upward or downward sweeps reached it, with a characteristic linear relation between the sweeps duration and the onset latency of the PS responses (Figure 12 A). Furthermore, by stimulating with FM sweeps of different amplitudes and computing the corresponding triggering frequencies, we obtained an effective tuning curve that it similar to the tuning curve of the responses to pure tone stimuli when the intercolumnar connections were removed (compare Figure 5 A with Figure 12 B). This counter-intuitive result is accounted for as follows. When stimulated by isolated tones with frequencies that are far from the columns BF, the PS response requires the synchronization of the feed-forward input with the intracortical PSs from the neighbouring columns (Figure 2 ). The FM sweeps desynchronize these inputs, with the PS response of the nearby columns occurring earlier along the sweep. Thus, an FM sweep effectively disconnects the intercolumnar connections, and a PS in the target column will occur only when the feed-forward input is strong enough to induce one on its own, which occurs at the same frequency along the sweep regardless of the its duration.
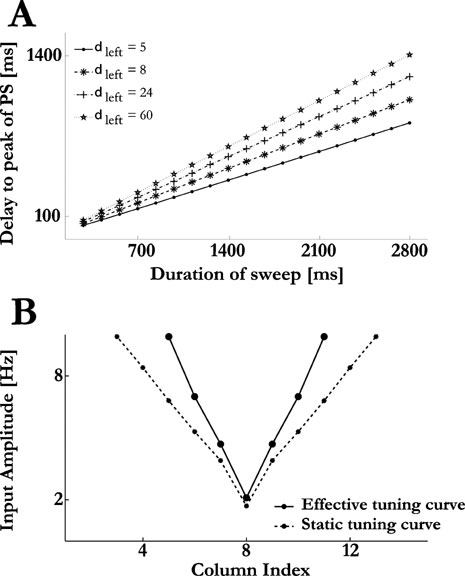
Figure 12. Response of the model to FM sweeps. (A) Downward FM sweeps were composed of a series of clicks with a decreasing BF (the first and last clicks had the BF of columns 15 and 1, respectively), separated by constant interstimulus-intervals. The delay from sweep onset to the peak of the PS response at column 8 vs. sweep duration is shown for various values of δleft. (B) A series of upward and downward FM sweeps of 200 ms duration were presented to the model at various amplitudes. The effective tuning curve for the FM sweep (solid line) is compared to the one measured for pure tones (dashed line).
The prediction that the triggering frequency of FM sweeps is mainly determined by the feed-forward inputs from the auditory thalamus also suggests that comparing tuning curves of cortical neurons in response to FM sweeps and to isolated pure tones could be a way to outline the extent of the supra-threshold thalamic inputs into A1 at a given cortical site. This follows from the above prediction as it asserts that FM sweeps temporally dissociate the contribution of the thalamic inputs to the responses of A1 neurons from that of the lateral intracortical inputs they receive.
PS-based Coding of Complex Sounds
The constrained propagation of a PS signal along the model tonotopic map, and its sensitivity to the temporal characteristics of the stimuli, suggests a PS-based encoding scheme for transforming specific input patterns into temporally precise responses in A1. We illustrate this scheme in Figure 13 , where the responses of the model to several streams of complex sounds are presented. Each sound induced a unique pattern of PS activity along the model tonotopic map. Furthermore, the responses of the model to the complex sounds cannot be inferred from the responses of the columns to their components (cf. Bar-Yosef et al., 2002 ; Rotman et al., 2001 ). For example, a given component will either succeed or fail to elicit a PS response at the corresponding columns, depending on the set of inputs that preceded it. A more subtle effect of the location of an input within the complex sound is on the spread of the evoked PS activity around the input's frequency, which is not always symmetric (as in Figure 3 ).
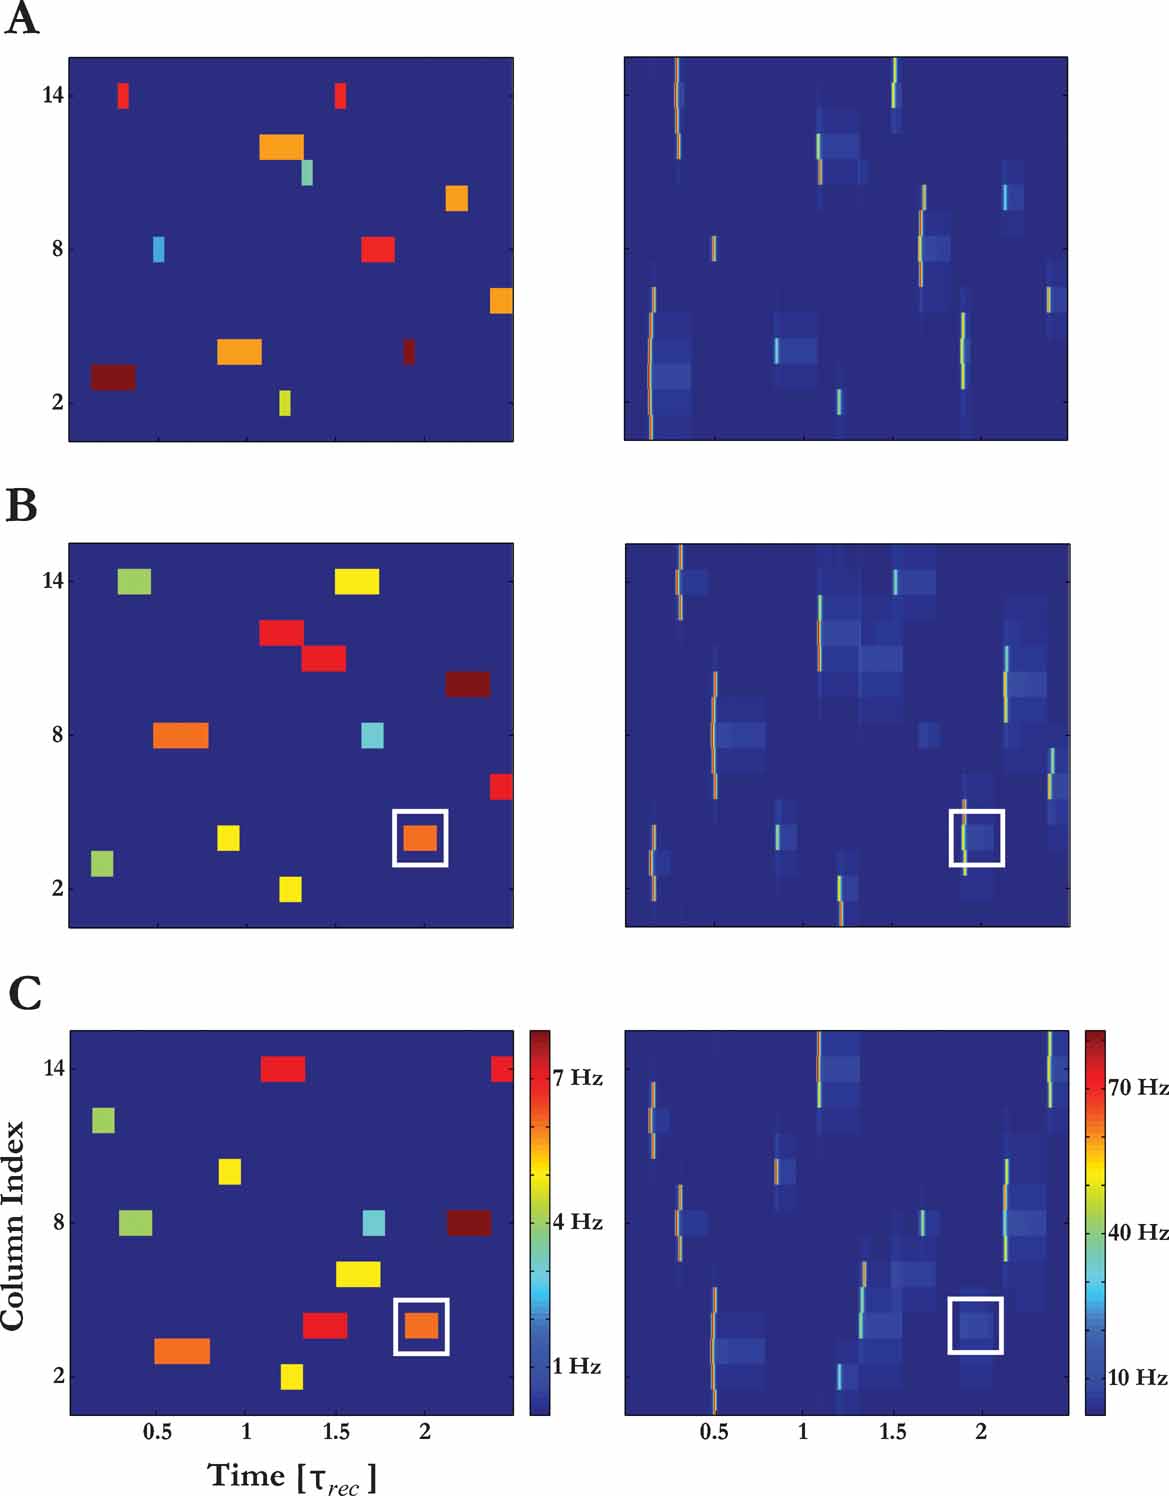
Figure 13. Illustration of PS-based encoding of complex sounds. Different complex sounds elicit different unique PS activity patterns. The left panels represent the spectrogram of three different sounds (spectral components of the sounds that correspond to different columns are colorcoded); the right panels illustrates the resulting PS activity pattern. The white squares highlight one particular tone pip which was identical in (B) and (C) but evoked a PS response only in (B). In (A) and (B), the onset times and frequencies of the sound components were the same, but their duration and amplitudes were modified; in (B) and (C), the onset times, duration and amplitudes were the same, but the frequencies of the tone pips were modified.
Discussion
In the current study we presented a neural network model of the primary auditory cortex (A1). The model is based on three key experimental observations: (i) A1 neurons tend to exhibit temporally locked onset responses to sounds (Phillips and Sark, 1991 ; Calford and Semple, 1995 ; DeWeese et al., 2003 ); (ii) neurons from the same anatomical column have similar response properties and share excitatory and inhibitory inputs (Chen and Jen, 2000 ; Dear et al., 1993 ; Kilgard and Merzenich, 1999 ; Wallace et al., 2005 ); and (iii) excitatory synaptic connections between A1 neurons exhibit short-term synaptic depression (Atzori et al., 2001 ; Berger and Markram, unpublished data). The main novel feature of the model is the introduction of depressing intracortical synaptic connections. The responses of the model to sensory stimuli consist of a combination of increased asynchronous activity interspaced with short epochs of synchronized firing in local ensembles of neurons, called PSs. The PSs emerge due to the recurrent connections in the local ensembles, and propagate along the model's tonotopic map via lateral connections in a stimulus-specific manner. This mechanism of synchronous firing of local neuronal groups is different from the Synfire model (Abeles, 1991 ), where neurons are arranged in uni-directionally connected layers that synchronize sequentially due to feed-forward input.
Our model accounts, in a unified manner, for a wide range of experimentally observed properties of A1 neurons (see Table 1 ). They include responses to pure tones under a large number of manipulations; the structure and timing of excitatory and inhibitory inputs to cortical neurons; the exquisite dependence of cortical responses on the times and frequencies of pairs of tones; the temporal structure of the responses to frequency-modulated tones; and hypersensitive locking suppression.
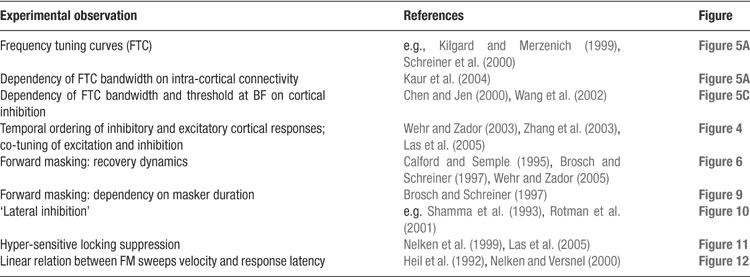
Table 1. A summary of the response characteristics of A1 neurons that the model reproduces.
The model suggests some new interpretations for a number of observations. The cortical well-locked onset responses are identified here with the PSs. Their short duration is accounted for by network dynamics rather than by the presence of quenching fast inhibition (as e.g., in Wehr and Zador, 2003 ). The precise matching between excitation and inhibition, with the constant short delay between them (Figure 4 ), is accounted for by the tight intra-columnar coupling between excitation and inhibition. Furthermore, inhibition does not participate in forward masking (Figure 6 , as experimentally demonstrated in Wehr and Zador, 2005 ), and is not necessary for lateral suppression (Figure 10 , as was already suggested in Fishbach et al., 2003 ). On the other hand, the model suggests that inhibition influences the threshold and tuning width of the cortical neurons (Figure 5 C).
The model provides a new interpretation to the puzzling, highly reproducible finding that FM sweeps evoke spikes at a very precise instantaneous trigger frequency. This high precision can be traced from the auditory periphery all the way to cortical population responses measured by magnetoencephalography (Rupp et al., 2002 ). If one considers the strong non-linearities in the responses of A1 neurons and the temporal dispersion inherent in synaptic transmission, this observation appears to be surprising. The model suggests that when stimulated with an FM sweep, the cortical columns are effectively uncoupled. As a result, neurons respond preferably to their sensory input, resulting in the tight link between instantaneous frequency and the PS response. It is tempting to speculate that it is the PS responses that are reflected in the MEG responses, resulting in their apparent linear dependence on the stimulus.
A key feature of the model that enables it to account for the large diversity of experimental findings in a unified manner is the sensitive interplay between the asynchronous neural activity and the propensity of the ensemble to emit PSs, which emerges due to activity-dependent synaptic depression. We hypothesize that PSs and asynchronous activity represent two different modes of information coding in auditory cortex. Consistently with such interpretation, Nelken (2004) hypothesized that the locked onset responses is a correlate of the onset of new auditory objects in the auditory scene. When such responses are absent, the sound would presumably be perceived as continuous, enabling the auditory system to assign to it properties such as pitch. Indeed, the disappearance of strongly locked responses (presumably corresponding to the PSs in the model) at rates above a few tens of Hz were interpreted as allowing the emergence of the perceptual quality of pitch of a continuous sound, thus determining the lower limit of pitch. On the other hand, the asynchronous component of the responses may encode different facets of the stimuli. For example the sustained responses to pure tones show strong stimulus-specific adaptation, even at interstimulus intervals that are longer than the time constant of synaptic depression (Lu et al., 2001 ), with frequency selectivity that is substantially better than the neuronal tuning curve.
The strong dependence of PSs on the spontaneous network activity means that modulation of the spontaneous spiking activity of neurons within an ensemble could represent a novel form of rapid and reversible modulation of cortical processing. Spontaneous activity, while a ubiquitous feature of cortical neurons, is usually considered as a nuisance as far as measuring sensory responses is concerned. However, in our model spontaneous activity participates in determining the emergence of the PSs in response to sensory stimuli (Loebel and Tsodyks, 2002 ). Dynamic shifts in the state of the synaptic connections in response to different patterns of spontaneous activity would result in effective re-wiring of the cortical network. This re-wiring would be reflected in differential responses of the ensemble to a particular sensory input, hence forming a complex of top-down and bottom-up interactions that shapes cortical activity. However, the re-wiring only last for as long as the spontaneous activity patterns persist, and may be modified on the time scale of synaptic depression. Such patterns of spontaneous activity could be induced by direct excitatory and inhibitory inputs from other brain regions, or by the local release of neuromodulators. Rapid modulation of neural responses has been recently reported at the A1 area of ferrets (Fritz et al., 2003 , 2005 ). It was shown that attending to a target sound induces rapid local modifications in the receptive fields of A1 neurons. In the majority of the neurons the receptive fields rapidly reverted back to their original form once the task ended (Fritz et al., 2003 , 2005 ). An alternative explanation for these observations is the modulation of the synaptic conductances of A1 neurons in the presence of neuromodulators (Soto et al., 2006 ).
The neural network model that we presented in this paper does not attempt to capture the auditory processing in its full details. In particular, we concentrated on the effects of intrinsic dynamics of recurrent cortical circuits on the responses of auditory neurons. We, therefore, neglected to a large degree the complex transformations that the auditory inputs undergo in subcortical structures. Instead, we emphasized relatively simple stimulus configurations in which more faithful description of the thalamic input would probably not change the qualitative aspects of the results. It remains a challenge for the future work to build a more realistic model where both aspects of processing are fully accounted for.
Conflict of Interest Statement
The authors declare that the research was conducted in the absence of any commercial or financial relationship that should be constructed as a potential conflict of interest.
Acknowledgments
We thank Nachum Ulanovsky, Liora Las. and Dina Moshitch for many valuable discussions on the ideas behind this work. AL thanks Adrienne Fairhall for her hospitality and support during the visit in her laboratory, where part of this work was conducted. The work was supported by the Israeli Science Foundation and by the Irving B. Harris Foundation.
References
Abbott, L. F., Varela, J. A., Sen, K., and Nelson, S. B. (1997). Synaptic depression and cortical gain control. Science 275, 220-224.
Andersen, P., Bliss, T. V. P., and Skrede, K. K. (1971). Unit analysis of hippocampal population spikes. Exp. Brain Res. 13, 208-221.
Atzori, M., Lei, S. P., Evans, D. I., Kanold, P. O., Phillips-Tansey, E., McIntyre, O., and McBain, C. J. (2001). Differential synaptic processing separates stationary from transient inputs to the auditory cortex. Nat. Neurosci. 4, 1230-1237.
Bar-Yosef, O., Rotman, Y., and Nelken, I. (2002). Responses of neurons in cat primary auditory cortex to bird chirps: effects of temporal and spectral context. J. Neurosci. 22, 8619-8632.
Bendor, D., and Wang, X. (2005). The neuronal representation of pitch in primate auditory cortex. Nature 436, 1161-1165.
Bringuier, V., Chavane, F., Glaeser, L., and Frégnac, Y. (1999). Horizontal propagation of visual activity in the synaptic integration field of area 17 neurons. Science 283, 695-699.
Britt, R., and Starr, A. (1976). Synaptic events and discharge patterns of cochlear nucleus cells. II. Frequency-modulated tones. J. Neurophysiol. 39, 179-194.
Brosch, M., and Schreiner, C. E. (1997). Time course of forward masking tuning curves in cat primary auditory cortex. J. Neurophysiol. 77, 923-943.
Calford, M. B., and Semple, M. N. (1995). Monaural inhibition in cat auditory cortex. J. Neurophysiol. 73, 1876-1897.
Chen, Q. C., and Jen, P. H. (2000). Bicuculline application affects discharge patterns, rate-intensity functions, and frequency tuning characteristics of bat auditory cortical neurons. Hear. Res. 150, 161-174.
Chimoto, S., Kitama, T., Qin, L., Sakayori, S., and Sato, Y. (2002). Tonal response patterns of primary auditory cortex neurons in alert cats. Brain Res. 934, 34-42.
Clopton, B. M., and Winfield, J. A. (1974). Unit responses in the inferior colliculus of rat to temporal auditory patterns of tone sweeps and noise bursts. Exp. Neurol. 42, 532-540.
Creutzfeldt, O., Hellweg, F. C., and Schreiner, C. (1980). Thalamo-cortical transformation of responses to complex auditory stimuli. Exp. Brain. Res. 39, 87-104.
Dear, S. P., Fritz, J., Haresign, T., Ferragamo, M., and Simmons, J. (1993). Tonotopic and functional organization in the auditory cortex of the big brown bat, Eptesicus fuscus. J. Neurophysiol. 70, 1988-2009.
Denham, S. L. (2001). Cortical synaptic depression and auditory perception. Computational Models of Auditory Function, in: S., Greenberg, and M. Slaney (eds.), Amsterdam, NATO ASI Series, IOS Press pp. 281-296.
DeWeese, M. R., and Zador, A. M. (2005). Reliability and representational bandwidth in the auditory cortex. Neuron 48, 479-488.
DeWeese, M. R., and Zador, A. M. (2006). Non-Gaussian membrane potential dynamics imply sparse, synchronous activity in auditory cortex. J. Neurosci. 26, 12206-12218.
DeWeese, M. R., Wehr, M., and Zador, A. M. (2003). Binary spiking in auditory cortex. J. Neurosci. 23, 7940-7949.
Eggermont, J. J. (1999). The magnitude and phase of temporal modulation transfer functions in cat auditory cortex. J. Neurosci. 19, 2780-2788.
Eggermont, J. J., and Smith, G. M. (1996). Burst-firing sharpens frequency-tuning in primary auditory cortex. Neuroreport 7, 753-757.
Elhilali, M., Fritz, J. B., Klein, D. J., Simon, J. Z., and Shamma, S. A. (2004). Dynamics of precise spike timing in primary auditory cortex. J. Neurosci. 24, 1159-1172.
Fishbach, A., Yeshurun, Y., and Nelken, I. (2003). Neural model for physiological responses to frequency and amplitude transitions uncovers topographical order in the auditory cortex. J. Neurophysiol. 90, 3663-3678.
Fritz, J., Shamma, S., Elhilali, M., and Klein, D. (2003). Rapid task-related plasticity of spectrotemporal receptive fields in primary auditory cortex. Nat. Neurosci. 6, 1216-1223.
Fritz, J., Elhilali, M., and Shamma, S. (2005). Active listening: task-dependent plasticity of spectrotemporal receptive fields in primary auditory cortex. Hear. Res. 206, 159-176.
Heil, P. (1997). Auditory onset responses revisited. I. First-spike timing. J. Neurophysiol. 77, 2616-2641.
Heil, P., Rajan, R., and Irvine, D. R. (1992). Sensitivity of neurons in cat primary auditory cortex to tones and frequency-modulated stimuli. I: Effects of variation of stimulus parameters. Hear. Res. 63, 108-134.
Hubel, D. H., and Wiesel, T. N. (1962). Receptive fields, binocular interaction and functional architecture in the cat's visual cortex. J. Physiol. 160, 106-154.
Hudspeth, A. J. (2000). Hearing. Principles of Neural Science, in: E. R., Kandel, J. H., Schwartz, and T. M., Jessel (eds.), Connecticut, Appleton & Lange, pp. 590-613.
Kaur, S., Lazar, R., and Metherate, R. (2004). Intracortical pathways determine breadth of subthreshold frequency receptive fields in primary auditory cortex. J. Neurophysiol. 91, 2551-2567.
Kilgard, M. P., and Merzenich, M. M. (1999). Distributed representation of spectral and temporal information in rat primary auditory cortex. Hear. Res. 134, 16-28.
Las, L., Stern, E. A., and Nelken, I. (2005). Representation of tone in fluctuating maskers in the ascending auditory system. J. Neurosci. 25, 1503-1513.
Loebel, A., and Tsodyks, M. (2002). Computation by ensemble synchronization in recurrent networks with synaptic depression. J. Comp. Neurosci. 13, 111-124.
Lu, T., Liang, L., and Wang, X. (2001). Temporal and rate representations of time-varying signals in the auditory cortex of awake primates. Nat. Neurosci. 4, 1131-1138.
Machens, C. K., Wehr, M. S., and Zador, A. M. (2004). Linearity of cortical receptive fields measured with natural sounds. J. Neurosci. 24, 1089-1100.
Merzenich, M. M., Knight, P. L., and Roth, G. L. (1975). Representation of cochlea within primary auditory cortex in the cat. J. Neurophysiol. 38, 231-249.
Moshitch, D., Las, L., Ulanovsky, N., Bar-Yosef, O., and Nelken, I. (2006). Responses of neurons in primary auditory cortex (A1) to pure tones in the halothane-anesthetized cat. J. Neurophysiol. 95, 3756-3769.
Nelken, I. (2004). Processing of complex stimuli and natural scenes in the auditory cortex. Curr. Opin. Neurobiol. 14, 474-480.
Nelken, I., and Versnel, H. (2000). Responses to linear and logarithmic frequency-modulated sweeps in ferret primary auditory cortex. Eur. J. Neurosci. 12, 549-562.
Nelken, I., Rotman, Y., and Bar-yosef, O. (1999). Responses of auditory-cortex neurons to structural features of natural sounds. Nature 397, 154-157.
Phillips, D., and Sark, S (1991). Separate mechanisms control spike numbers and inter-spike intervals in transient responses of cat auditory cortex neurons. Hear. Res. 53, 17-27.
Rotman, Y., Bar-Yosef, O., and Nelken, I. (2001). Relating cluster and population responses to natural sounds and tonal stimuli in cat primary auditory cortex. Hear. Res. 152, 110-127.
Rupp, A., Uppenkamp, S., Gutschalk, A., Beucker, R., Patterson, R. D., Dau, T., and Scherg, M. (2002). The representation of peripheral neural activity in the middle-latency evoked field of primary auditory cortex in humans. Hear. Res. 174, 19-31.
Rupp, A., Las, L., and Nelken, I. (in press). Neuromagentic Representation of Comodulation Masking Release in the Human auditory Cortex. Proceedings of the ISH meeting in Oldenburg.
Schiff, M. L., and Reyes, A. D. (2005). Synaptic and membrane properties of thalamocortical recipient neurons in AI. Program No. 615.10. 2005 Abstract Viewer/Itinerary Planner. Washington, DC Society for Neuroscience.
Schreiner, C. E., Read, H. L., and Sutter, M. L. (2000). Modular organization of frequency integration in primary auditory cortex. Annu. Rev. Neurosci. 23, 501-529.
Shamma, S. A., Fleshman, J. W., Wiser, P. R., and Versnel, H. (1993). Organization response areas in ferret primary auditory cortex. J. Neurophysiol. 69, 367-383.
Soto, G., Kopell, N., and Sen, K. (2006). Network architecture, receptive fields, and neuromodulation: computational and functional implications of cholinergic modulation in primary auditory cortex. J. Neurophysiol. 96, 2972-2983.
Thomson, A. M., and Deuchars, J. (1994). Temporal and spatial properties of local circuits in neocortex. Trends Neurosci. 17, 119-126.
Tsodyks, M., and Markram, H. (1997). The neural code between neocortical pyramidal neurons depends on neurotransmitter release probability. Proc. Natl. Acad. Sci., PNAS 94, 719-723.
Tsodyks, M., Uziel, A., and Markram, H. (2000). Synchorony Generation in Recurrent Networks with Frequency-Dependent Synapses. J. Neurosci. 20, RC1 1-5.
Ulanovsky, N., Las, L., and Nelken, I. (2003). Processing of low probability sounds by cortical neurons. Nat. Neurosci. 6, 391-398.
Wallace, M. N., Shackleton, T. M., Anderson, L. A., and Palmer, A. R. (2005). Representation of the purr call in the guinea pig primary auditory cortex. Hear. Res. 204, 115-126.
Wang, J., McFadden, S. L., Caspary, D., and Salvi, R. (2002). Gamma-aminobutyric acid circuits shape response properties of auditory cortex neurons. Brain. Res. 944, 219-231.
Wehr, M., and Zador, A. M. (2003). Balanced inhibition underlies tuning and sharpens spike timing in auditory cortex. Nature 426, 442-446.
Wehr, M., and Zador, A. M. (2005). Synaptic mechanisms of forward suppression in rat auditory cortex. Neuron 47, 437-445.
Wilson, H. R., and Cowan, J. D. (1972). Excitatory and inhibitory interactions in localized populations of model neurons. Biophys. Journal 12, 1-24.
Keywords: auditory processing, neural networks, synaptic depression, synchronization
Citation: Alex Loebel, Israel Nelken and Misha Tsodyks (2007). Processing of sounds by population spikes in a model of primary auditory cortex. Front. Neurosci. 1:1. 197-209. doi: 10.3389/neuro.01/1.1.015.2007
Received: 15 August 2007; Paper pending published: 01 September 2007;
Accepted: 01 September 2007;
Published online: 15 October 2007.
Edited by:
Idan Segev, Hebrew University, IsraelReviewed by:
Terrence J. Sejnowski, The Salk Institute for Biological Studies, USACopyright: © 2007 Loebel, Nelken and Tsodyks. This is an open-access article subject to an exclusive license agreement between the authors and the Frontiers Research Foundation, which permits unrestricted use, distribution, and reproduction in any medium, provided the original authors and source are credited.
*Correspondence: Misha Tsodyks, Department of Neurobiology, Weizmann Institute of Science, Rehovot, Israel. e-mail:bWlzaGFAd2Vpem1hbm4uYWMuaWw=