 Shangyang Shang
 Milica Popović
- Department of Electrical and Computer Engineering, McGill University, Montreal, QC, Canada
Over the past decade, sensors for skin cancer detection, with operation at micro- and millimeter-wave frequency range, have been under investigation. Thus, safety concerns related to radiation exposure have become critical, especially for patients with vulnerable skin. Studies to date fell short in detailed safety assessments. Many evaluations rely on a single-tissue model representing a single anatomical site. Moreover, most studies assess safety solely via specific absorption rate (SAR) but omit the temperature-rise analysis induced by radiation exposure. In this work, we investigate two types of surface-wave-based antennas operating in the microwave band. Multilayer tissue models were constructed to emulate nine major body sites. The key safety metrics, including the SAR distribution and temperature increase, were analyzed through full-wave electromagnetic simulations in Ansys HFSS. The results reveal substantial inter-site variability in the metrics, highlighting the necessity of full-body evaluation prior to determining the overall safety measures for the new diagnostic devices. Furthermore, we derive power limits for surface-wave antennas in accordance with U.S. and Canadian safety standards, and verify their conservativeness via temperature analysis. Our findings provide a basis for a comprehensive framework for radiation safety assessment of wearable devices operating in the microwave band.
1 Introduction
Skin cancer is one of the most prevalent malignancies worldwide (Roky et al., 2025). In recent years, microwave and millimeter sensing techniques have emerged as promising tools for non-invasive skin cancer diagnosis (Naqvi et al., 2025). These methods utilize the dielectric contrast between malignant and healthy tissues, allowing tumor detection without surgical intervention (Wu and Liu, 2024). These approaches are non-ionizing, painless, low-cost, and capable of providing real-time diagnostic information (Schiavoni et al., 2023). Recent advances in micro-/mm-wave systems have further improved spatial resolution and enhanced contrast between tissue types (Mirzaee et al., 2021). In parallel, deep learning techniques have been increasingly applied to signal processing, significantly improving diagnostic reliability (Costanzo et al., 2023). Efforts have also been made to develop compact sensor systems, aiming to facilitate clinical integration and point-of-care deployment (Naqvi et al., 2024).
Despite their clinical potential, safety challenges remain a critical concern for the skin cancer detectors. In the close-contact scenarios, electromagnetic (EM) energy is coupled into the superficial layers, and most of the absorption occurs in the epidermis and dermis (Suryanata et al., 2023), particularly within high-water-content cutaneous appendages (Haider et al., 2022). Previous studies have shown that at anatomical sites where a low-water-content layer (e.g., fat) is sandwiched between high-water-content tissues (e.g., skin and muscle), standing-wave and impedance-matching effects can arise, leading to a significant increase of local SAR within the skin layer (Christ et al., 2006). Although these micro-/mm-wave-based systems medical typically operate at low power levels, attention must be paid to radiation exposure and its physiological effects. In particular, patients with skin cancer may have vulnerable skin at the lesion site, making them more susceptible to EM heating (Alemaryeen and Noghanian, 2023). Exposure safety limits have accordingly been established by national and international standards such as the U.S. Federal Communications Commission (FCC) guidelines (Fields, 1997) and IEEE C95.1 and ICNIRP (Bailey et al., 2019), which confine the localized SAR to
Previous studies have extensively investigated EM radiation safety by analyzing the interactions between electromagnetic waves and biological tissues at various body sites (Kodera et al., 2024; Sacco et al., 2022). However, in the field of detectors for skin cancer diagnosis, most previous studies have rarely evaluated the radiation safety of their designs. Even in the studies including such safety discussion, SAR analysis were often conducted on one tissue model representing a single body site, such as the forearm or abdomen (Kaur et al., 2024; Kaur et al., 2022). These approaches fail to account for the substantial anatomical differences in skin and subcutaneous tissue structures across various body sites. Such anatomical variations significantly influence the electric field distribution and, consequently, the SAR pattern, especially at microwave and millimeter-wave frequencies. As a result, safety assessments based on a single anatomical site may not accurately reflect the actual risks posed during clinical deployment.
An additional limitation of prior studies is the lack of consideration for tissue temperature rise under the exposure. This issue is not confined to skin cancer detection systems but is also present in many researches on wearable micro-/mm-wave devices. Although SAR is the primary metric codified in current safety guidelines, emerging devices with unconventional radiation patterns and scanning schemes may lie outside the assumptions underlying those frameworks. By contrast, temperature rise is the direct physiological factor associated with thermal tissue damage and provides a more comprehensive characterization of thermal effects by integrating factors not captured by SAR, e.g., exposure duration, tissue perfusion, and heat diffusion properties. Accordingly, temperature rise should be incorporated as a complementary indicator in radiation safety evaluation.
This work aims to address the missing studies in radiation safety assessment for skin-cancer-detection sensors and other wearable micro-/millimeter-wave devices. Although this broader term is used, our experiments and analyses are confined to the microwave band. Safety-related radiation metrics were obtained through full-wave EM simulations conducted in Ansys HFSS. Nine multilayer tissue models were constructed to represent the skin and subcutaneous structures at different body sites, including the sole, thigh, buttock, abdomen, palm, arm, neck, and leg. Each model was scanned by two generations of surface-wave antennas developed for skin cancer diagnosis: the Vivaldi antenna (latest design) and the monopole antenna (initial design). To evaluate conservative worst-case scenarios, we focused on three key metrics: peak electric field intensity, peak SAR, and peak temperature rise. The results reveal substantial variation across body sites for all three metrics, confirming the necessity of multi-site modeling in safety evaluations. Furthermore, we observed notable discrepancies between peak SAR and peak temperature rise across sites, underscoring the importance of including both metrics in comprehensive safety analysis. Power limits for each antenna were derived from the SAR results to ensure compliance with the strictest US and Canada standards, and then validated through temperature-rise analysis, demonstrating their effectiveness in maintaining thermal safety.
2 Method and materials
2.1 Surface-wave method for skin cancer diagnosis
Cancerous lesions such as basal cell carcinoma, squamous cell carcinoma, and melanoma typically contain a higher water content than healthy skin tissues (Gniadecka et al., 2003). As a result, these tumors exhibit higher dielectric permittivity, particularly in the microwave frequency bands (Schiavoni et al., 2023). The local EM response varies depending on the presence or absence of a tumor.
In the surface-wave-based sensing approach, two antennas are placed in contact with the skin surface. One acts as a transmitter (Tx) and the other as a receiver (Rx). These antennas are designed to excite and detect EM surface waves that are confined to propagate along the skin–air interface. In comparison to healthy skin, the presence of a cancerous lesion introduces greater attenuation and phase shift between the Tx and Rx antennas. Larger tumor sizes generally enhance these contrast effects. In practical measurements, the transmission coefficient parameter,
2.2 Antenna structures
Two types of surface-wave-based antennas were used in this study to evaluate radiation safety for skin cancer sensing: Vivaldi antennas and monopole antennas, as illustrated in Figure 1. Their designs have been reported in our previous works (Mokhtari and Popović, 2025; Bahramiabarghouei et al., 2015). They were selected in this study as their operation in the desired frequency range is optimized for direct on-skin placement.

Figure 1. Antenna pairs operated on multi-layer tissue models: (a) the Vivaldi antennas; (b) the monopole antennas.
The Vivaldi antennas, shown in Figure 1A, represent the latest surface-wave-based design tailored for skin cancer diagnosis. The antennas are fabricated on a 50-
The monopole antenna (Figure 1B) are the initial version of the surface-wave-based antennas. Originally proposed in (Bahramiabarghouei et al., 2015), they have the same flexible Kapton substrate as the monopole antennas. Each monopole antenna measures 20 mm
2.3 Biological tissue models
As illustrated in Figure 1, the tissue models consist of multiple layers arranged from the surface inward: skin, fat, muscle, and bone. Here, a single-skin layer is used because the wavelengths associated with the selected frequency bandwidths are unlikely to resolve individual layers of the skin. The dielectric dispersions of the four tissue layers from 1 GHz to 10 GHz are shown in Figure 2, with data obtained from (IFAC – CNR, 2024). The thermal properties for each layer were adopted from the IT’IS database (IT'IS Foundation, 2025). A total of nine models were constructed to represent the tissues under test at different body sites, including the abdomen, arm, buttock, forehead, leg, neck, palm, sole, and thigh. In the forehead, palm, and sole models, all four layers are included. For the remaining six models, the bone layer was excluded, as the soft tissue thickness at these sites exceeds 20 mm. In this case, EM waves operating in the 2–6 GHz band attenuate significantly before reaching the bone, making its inclusion unnecessary for accurate simulation.
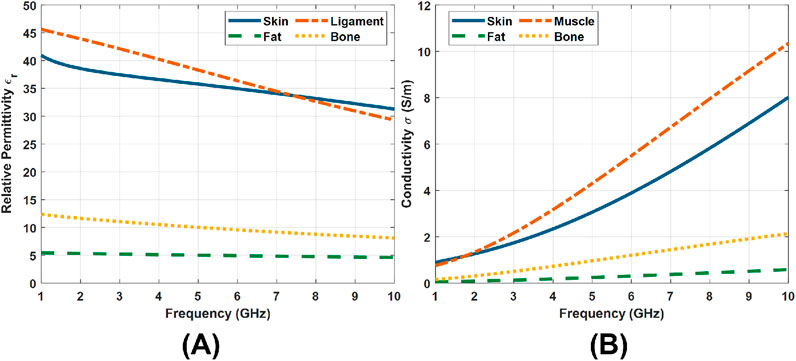
Figure 2. Dielectric properties of tissue layers from 1 GHz to 10 GHz (IFAC – CNR, 2024). (A) Relative permittivity. (B) Conductivity.
All models were built in Ansys HFSS. They share identical lateral dimensions, with a length of 12 cm and a width of 6 cm, providing a surface area large enough to accommodate the selected antennas, which feature compact structures and low spatial requirements. The detailed configurations and thicknesses of each tissue layer are provided in Table 1. The skin and fat thicknesses were obtained from (Lee and Hwang, 2002; Störchle et al., 2018), respectively. For the forehead, the muscle and bone thicknesses were referenced from (Choi et al., 2019; Rowbotham et al., 2023). Similarly, for the palm and sole, the corresponding values were taken from (Morimoto et al., 2017; Morgan et al., 1967; Angin et al., 2014; Griffin and Richmond, 2005). In the remaining six body site models, the muscle layer was uniformly set to 20 mm. Although the actual muscle thickness in these regions is typically greater, this simplification improves computational efficiency. Given that the EM wave penetration depth in soft tissue at 2–6 GHz is less than 20 mm (IFAC – CNR, 2024), this assumption does not compromise the accuracy of the simulation results.

Table 1. Tissue layer thicknesses by body site.
2.4 Radiation safety analysis
The antennas and multilayer tissue models were designed and simulated using Ansys HFSS, in which both EM field analysis and radiation safety evaluation were performed. For the monopole antenna, the frequency sweep was conducted from 2 GHz to 5 GHz with a step size of 0.1 GHz. For the Vivaldi antenna, the sweep range was set from 3 GHz to 6 GHz with the same step size.
Microwave exposure safety is commonly evaluated using two thermally relevant indicators: the SAR and the induced tissue temperature rise. SAR quantifies the rate at which EM energy is absorbed by biological tissues, expressed in watts per kilogram
The simulation parameters in the Ansys HFSS models are summarized here for reproducibility. The solution type was set to Driven Modal, and the antennas were excited using lumped ports with a reference impedance of 50
2.4.1 SAR assessment
The SAR distribution in tissue can be theoretically calculated using the following integral form:
where
In this study, both the electric field and the SAR distribution were extracted from HFSS simulations. To comply with FCC and Canadian regulatory frameworks, all SAR values reported in this work refer to the peak spatial-average SAR computed over a cubic volume corresponding to 1 g of tissue.
2.4.2 Temperature rise assessment
The temperature evolution was governed by Pennes’ bioheat equation (Pennes, 1948). When omitting blood perfusion and metabolic heat, the equation is simplified to the Fourier heat conducting equation (Narasimhan, 1999):
where
To apply Equation 2 to the multilayer tissue model, the computational domain was discretized into cubic voxels of
Equation 2 was solved via an explicit finite-difference scheme:
where
This approach allows for seamless modeling of parameter discontinuities across tissue layers without requiring special treatment at the interfaces. A Neumann (zero-flux) boundary conditions were imposed on all outer faces of the computational domain by setting the boundary temperature gradient to zero (Priya et al., 2013). The initial tissue temperature was set to 36.5 °C uniformly in the tissue models. A uniform spatial step of
where
The above scheme was implemented in MATLAB (Version 2024a). The 3D SAR array was directly imported from the HFSS simulation results, and the tissue-type masks were used to assign
3 Results
3.1 Vivaldi antenna
3.1.1 Electric field analysis
SAR is the primary metric for evaluating EM radiation safety. According to Equation 1, SAR is largely determined by the local electric field intensity
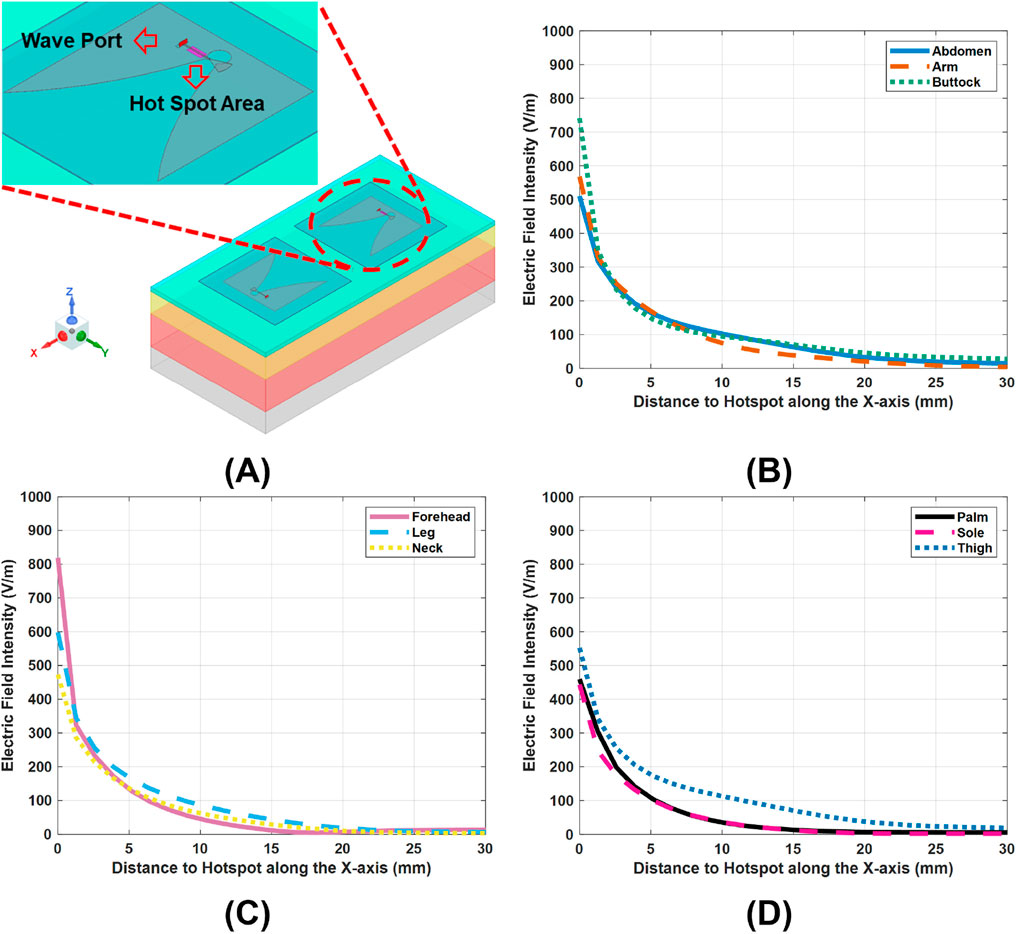
Figure 3. E-field variations across the nine tissue models, under a 10-dBm scans of the Vivaldi antennas. (A), hot spot regions of electric field intensity, mark as pink. (B–D), E-field distributions along the x-axis in the tissue models, with the hotspots set as the origins.
Indeed, variations across layers in electrical properties (conductivity
Figures 3B–D show the lateral
3.1.2 SAR analysis
Figures 4A–C present the peak SAR values in the tissue models across the Vivaldi operating band (3–6 GHz) under an input power of 10 dBm. In all cases, the peak SAR exhibits a clear increasing trend with frequency. This frequency dependence can be explained by the dispersive nature of tissue dielectric properties. As frequency increases, the conductivity

Figure 4. SAR variations across the tissue models under the Vivaldi antenna scans with 10 dBm input power. (A–C) SAR values at the hotspots across the 2–5 GHz frequency band in the tissue models. (D) Comparison of the peak SAR at 6 GHz among the tissue models.
More importantly, Figures 4A–C also reveal substantial differences among body sites. These differences persist across the entire frequency band. For instance, Figure 4D shows that at 6 GHz, the peak SAR in the forehead model approaches almost twice that in the sole or neck model, despite identical input power. Such differences arise from structural variations across body sites, such as differences in soft-tissue thickness, which can either amplify or attenuate the local
3.1.3 Temperature rises analysis
In addition to using SAR, evaluating the temperature rise
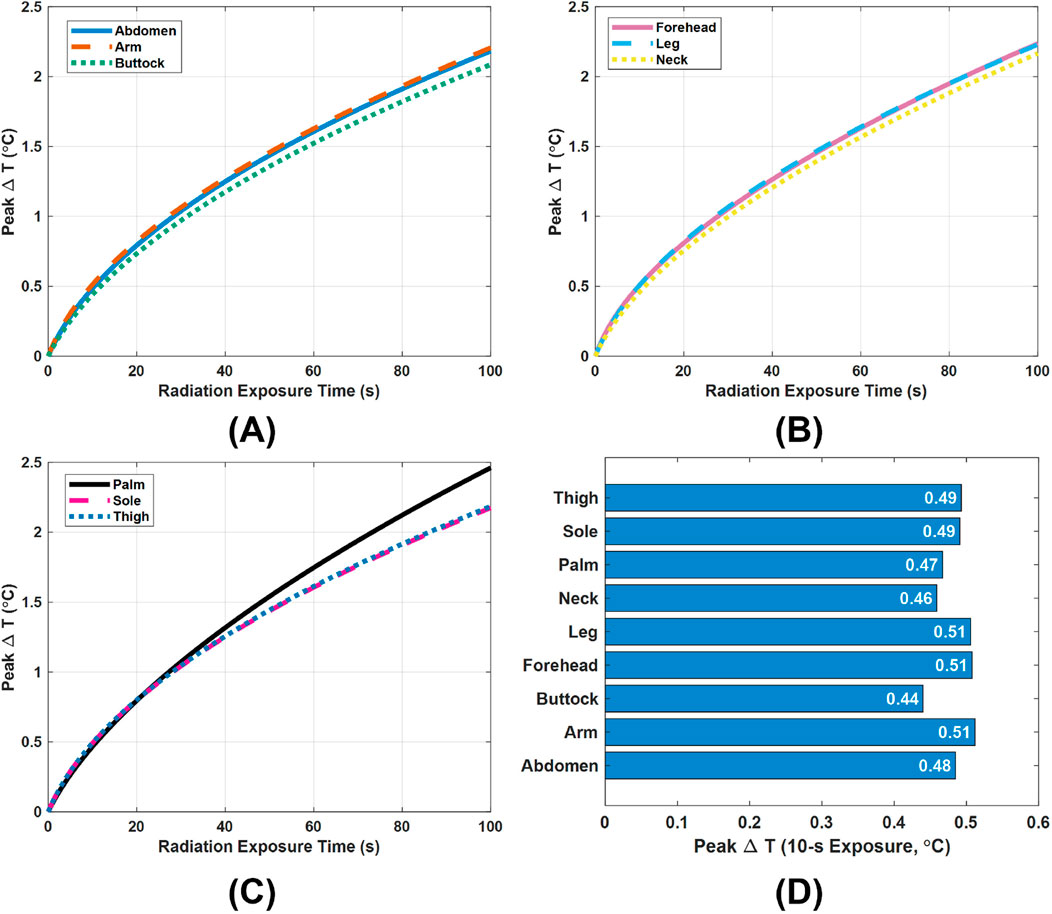
Figure 5. Peak temperature rise
In practice, however, a single scan of the designed Vivaldi or monopole antennas for skin cancer detection is very brief, typically lasting about 5–10 s depending on the frequency range and step size settings. Therefore, special attention must be paid to the peak
The above
3.1.4 Power limit selection
Figures 6A,B illustrates the variation of peak SAR with input power across nine different tissue models, providing guidance for safe power selection. From these results, we derive a power limit for each model that still meets the 1.6 W/kg SAR criterion from FCC. The specific limits for all tissue models are summarized in Figure 6C. Consistent with the SAR variations by body site (see Figure 4), these allowable power levels vary widely among different locations, ranging from as low as 2.2 dBm for the forehead model up to 4.9 dBm for the sole model. In practice, this means the antenna’s placement strongly influences the safe operating power. For instance, when the Vivaldi antenna is used at a particular body site, its input power can be set according to that site’s specific limit. However, for general or full-body use, a conservative approach is adopted: the global input power limit should be the lowest of all local limits. In our case, this corresponds to 2.2 dBm (dictated by the forehead model), ensuring that the SAR remains below 1.6 W/kg in all exposure scenarios.
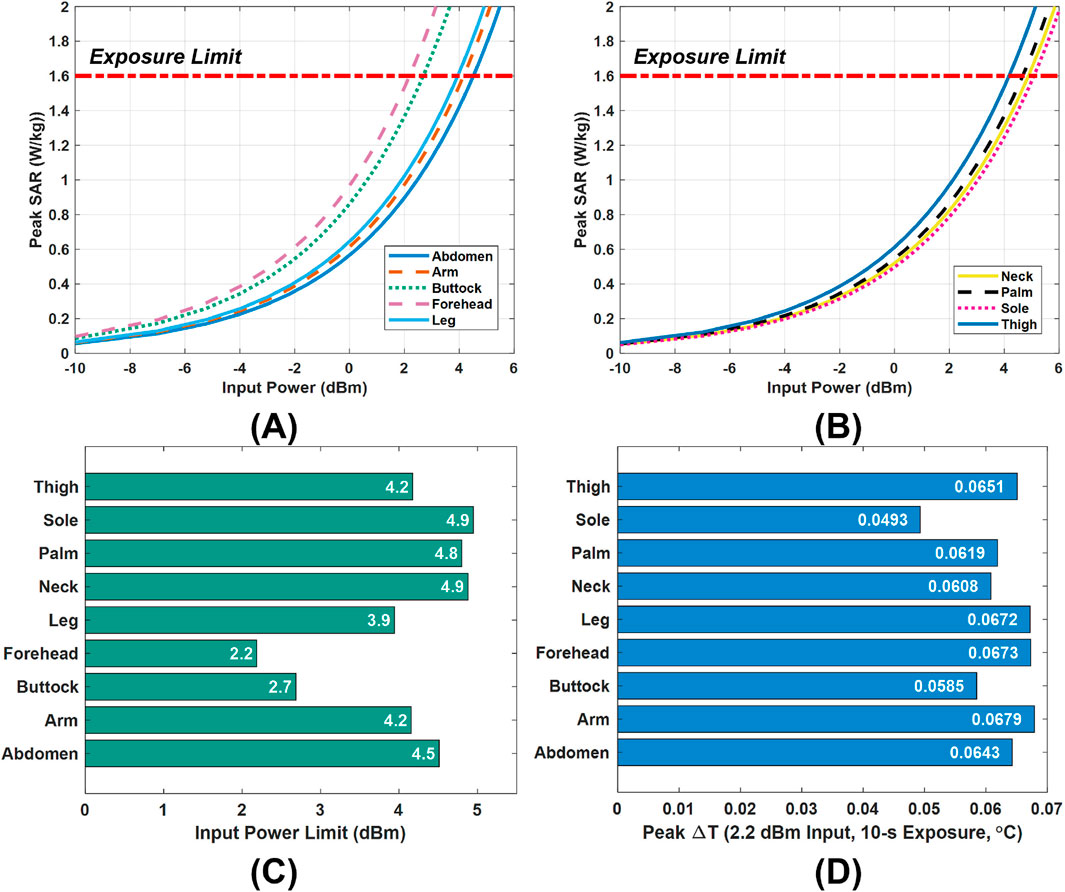
Figure 6. Power limit selection and validation. (A,B), The input power versus peak SAR in the nine tissue models under the Vivaldi antenna scan. (C), Input power limits in the tissue models. (D), Peak temperature rises
A temperature-rise simulation was performed to validate the safety of this 2.2 dBm global power limit. Figure 6D presents the peak tissue temperature increase after a 10-s exposure at 2.2 dBm input power. The observed highest value is only about 0.068 °C, a negligible rise far below levels that would pose any health risk. This minimal heating is in line with the SAR limit compliance and indicates that the chosen power cap does not cause undue thermal stress. Therefore, adopting 2.2 dBm as the input power limit is confirmed to be a safe and reasonable choice.
3.2 Monopole antenna
Following the same analysis methodology developed for the Vivaldi antenna, we evaluate the radiation safety of monopole antennas, which represent our first-generation design of the surface-wave antennas for skin cancer diagnosis. Table 2 summarizes the variations in key radiation metrics across nine body sites with the input power fixed at 10 dBm. The peak
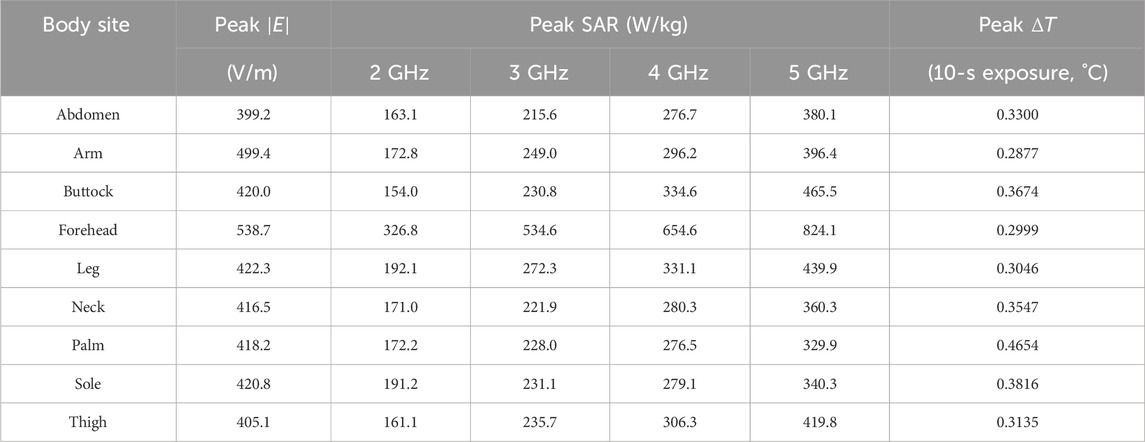
Table 2. Variations of the key metrics across body sites in monopole antenna radiation safety analysis.
In addition to field and SAR metrics, Table 2 also lists the peak temperature rise
Figures 7A,B show the peak SAR values obtained for the monopole antenna, which are used to determine the maximum transmit power that complies with the FCC’s 1.6 W/kg SAR limit. Figure 7C summarizes the corresponding power limits at each examined body site under conservative worst-case conditions. Among all sites, the forehead has the most restrictive allowable power (2.9 dBm). Therefore, when the monopole antenna is intended for use across the entire body, rather than at a single specific site, 2.9 dBm is chosen as a global power limit to ensure compliance at all locations. It is our recommendation that similar analysis be followed for any antenna-like sensor.
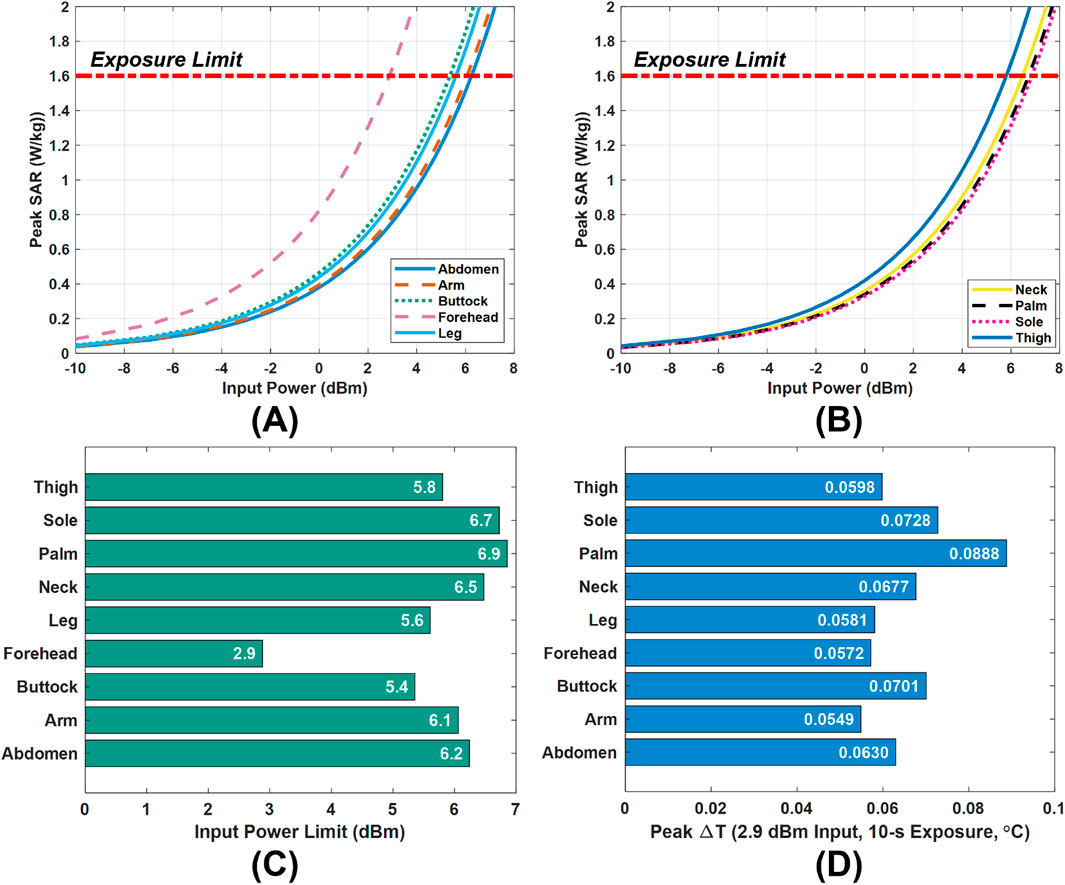
Figure 7. Power limit selection and validation. (A,B) Peak SAR values versus input power. (C) Input power limits in the tissue models. (D) Peak temperature rise
To validate the safety of this global limit, a thermal analysis was conducted by exposing the tissue models to a continuous 10-s scan at 2.9 dBm. Figure 7D presents the resulting temperature rise in tissues. Even at the most affected location (the palm), the peak temperature increase remains below 0.09
4 Conclusion and discussion
This work presented a site-dependent radiation-safety assessment of surface-wave antennas by multiple thermal metrics analysis. Full-wave simulations on nine multilayer tissue models showed significant inter-site variability in peak SAR and temperature increase
The two antenna designs, the Vivaldi and monopole structures, exhibited highly consistent spatial patterns in electric-field distribution and SAR ranking across the examined body sites. Although their working frequency bands are not identical, both antennas produced similar inter-site trends: the forehead model showed the highest field intensity and peak SAR, while the sole model exhibited the lowest values. This similarity supports the general applicability of the proposed evaluation framework for wearable sensors.
The bio-heat formulation used in this study did not include blood perfusion, metabolic heat, and convective cooling at the skin–air interface, which may result in conservative (overestimated) temperature predictions. These simplifications were made with awareness that we are establishing an upper bound for thermal safety. Future work will incorporate perfusion and heterogeneous boundary effects for completeness.
More generally, the present study suggests a standardized methodology for radiation-safety analysis of the microwave devices aimed at healthcare. The proposed workflow, from electric-field mapping and SAR calculation to temperature-rise evaluation and power-limit derivation, offers a comprehensive framework that bridges electromagnetic design and biomedical safety considerations.
Data availability statement
The original contributions presented in the study are included in the article/supplementary material, further inquiries can be directed to the corresponding author.
Author contributions
SS: Conceptualization, Data curation, Formal Analysis, Investigation, Methodology, Software, Visualization, Writing – original draft, Writing – review and editing, Validation. MP: Conceptualization, Formal Analysis, Funding acquisition, Investigation, Project administration, Resources, Supervision, Writing – review and editing.
Funding
The authors declare that financial support was received for the research and/or publication of this article. This work was supported by the Natural Sciences and Engineering Research Council of Canada (NSERC) Discovery Grant RGPIN-2024-06446.
Conflict of interest
The authors declare that the research was conducted in the absence of any commercial or financial relationships that could be construed as a potential conflict of interest.
Generative AI statement
The authors declare that no Generative AI was used in the creation of this manuscript.
Any alternative text (alt text) provided alongside figures in this article has been generated by Frontiers with the support of artificial intelligence and reasonable efforts have been made to ensure accuracy, including review by the authors wherever possible. If you identify any issues, please contact us.
Publisher’s note
All claims expressed in this article are solely those of the authors and do not necessarily represent those of their affiliated organizations, or those of the publisher, the editors and the reviewers. Any product that may be evaluated in this article, or claim that may be made by its manufacturer, is not guaranteed or endorsed by the publisher.
References
Alemaryeen, A., and Noghanian, S. (2023). A survey of the thermal analysis of implanted antennas for wireless biomedical devices. Micromachines 14, 1894. doi:10.3390/mi14101894
Angin, S., Crofts, G., Mickle, K. J., and Nester, C. J. (2014). Ultrasound evaluation of foot muscles and plantar fascia in pes planus. Gait and Posture 40, 48–52. doi:10.1016/j.gaitpost.2014.02.008
Bahramiabarghouei, H., Porter, E., Santorelli, A., Gosselin, B., Popovic, M., and Rusch, L. A. (2015). Flexible 16 antenna array for microwave breast cancer detection. IEEE Trans. Biomed. Eng. 62, 2516–2525. doi:10.1109/TBME.2015.2434956
Bailey, W. H., Bodemann, R., Bushberg, J., Chou, C.-K., Cleveland, R., Faraone, A., et al. (2019). Synopsis of ieee std c95. 1™-2019 “ieee standard for safety levels with respect to human exposure to electric, magnetic, and electromagnetic fields, 0 hz to 300 ghz”. IEEE Access 7, 171346–171356. doi:10.1109/access.2019.2954823
Choi, Y.-J., Lee, K.-W., Gil, Y.-C., Hu, K.-S., and Kim, H.-J. (2019). Ultrasonographic analyses of the forehead region for injectable treatments. Ultrasound Medicine and Biology 45, 2641–2648. doi:10.1016/j.ultrasmedbio.2019.06.414
Christ, A., Klingenbock, A., Samaras, T., Goiceanu, C., and Kuster, N. (2006). The dependence of electromagnetic far-field absorption on body tissue composition in the frequency range from 300 mhz to 6 ghz. IEEE Trans. Microw. Theory Tech. 54, 2188–2195. doi:10.1109/TMTT.2006.872789
Costanzo, S., Flores, A., and Buonanno, G. (2023). Fast and accurate cnn-based machine learning approach for microwave medical imaging in cancer detection. IEEE Access 11, 66063–66075. doi:10.1109/access.2023.3291076
De Moura, C. A., and Kubrusly, C. S. (2013). The courant–friedrichs–lewy (cfl) condition. AMC 10, 45–90. doi:10.1007/978-0-8176-8394-8
Demers, P., Findlay, D., Foster, K. A., Kolb, B., Moulder, J., Nicol, A.-M., et al. (2014). A review of safety code 6 (2013): Health canada’s safety limits for exposure to radiofrequency fields. Canada Ottawa: Royal Society of.
Fields, R. E. (1997). Evaluating compliance with fcc guidelines for human exposure to radiofrequency electromagnetic fields. Oet Bull. 65, 1–57. Available online at: https://transition.fcc.gov/Bureaus/Engineering_Technology/Documents/bulletins/oet65/oet65c.pdf.
Gniadecka, M., Nielsen, O. F., and Wulf, H. C. (2003). Water content and structure in malignant and benign skin tumours. J. Mol. Struct. 661, 405–410. doi:10.1016/j.molstruc.2003.08.030
Griffin, N. L., and Richmond, B. G. (2005). Cross-sectional geometry of the human forefoot. Bone 37, 253–260. doi:10.1016/j.bone.2005.04.019
Haider, Z., Le Drean, Y., Sacco, G., Nikolayev, D., Sauleau, R., and Zhadobov, M. (2022). High-resolution model of human skin appendages for electromagnetic dosimetry at millimeter waves. IEEE J. Microwaves 2, 214–227. doi:10.1109/JMW.2021.3126712
IFAC – CNR (2024). Istituto di Fisica Applicata ’Nello Carrara. Available online at: http://www.ifac.cnr.it/ (Accessed April 14, 2025).
IT'IS Foundation (2025). IT’IS foundation - database of tissue properties. Available online at: http://itis.swiss/virtual-population/tissue-properties/database (Accessed August 10, 2025).
Kaur, K., Arif, A., and Ahmad, A. (2022). In vitro detection of skin cancer using a uwb stacked microstrip patch antenna with microwave imaging. Int. J. RF Microw. Computer-Aided Eng. 32, e23188. doi:10.1002/mmce.23407
Kaur, K., Arif, A., and Ahmad, A. (2024). In silico,, in vitro,, and in vivo validation of a microwave imaging system for early skin cancer detection. Int. J. Imaging Syst. Technol. 30, e23016. doi:10.1002/ima.23016
Kodera, S., Taguchi, K., Diao, Y., Kashiwa, T., and Hirata, A. (2024). Computation of whole-body average sar in realistic human models from 1 to 100 ghz. IEEE Trans. Microw. Theory Tech. 72, 91–100. doi:10.1109/TMTT.2023.3289562
Lee, Y., and Hwang, K. (2002). Skin thickness of Korean adults. Surg. Radiologic Anatomy 24, 183–189. doi:10.1007/s00276-002-0034-5
Mirzaee, M., Ma, X., Rahman, M. T., and Noghanian, S. (2021). “Early skin cancer detection: from desktop imaging setup to real-time handheld device,” in IEEE MTT-S international microwave symposium (IMS) (IEEE), 216–219.
Mokhtari, M., and Popović, M. (2025). “Surface-wave skin characterization with a flexible vivaldi antenna,” in 2025 19th European conference on antennas and propagation (EuCAP) (IEEE), 1–5.
Morgan, D., Spiers, F., Pulvertaft, C., and Fourman, P. (1967). The amount of bone in the metacarpal and the phalanx according to age and sex. Clin. Radiol. 18, 101–108. doi:10.1016/s0009-9260(67)80137-5
Morimoto, A., Suga, T., Tottori, N., Wachi, M., Misaki, J., Tsuchikane, R., et al. (2017). Association between hand muscle thickness and whole-body skeletal muscle mass in healthy adults: a pilot study. J. Physical Therapy Science 29, 1644–1648. doi:10.1589/jpts.29.1644
Naqvi, S. A. R., Mobashsher, A. T., Mohammed, B., Foong, D., and Abbosh, A. (2024). Handheld microwave system for in vivo skin cancer detection: development and clinical validation. IEEE Trans. Instrum. Meas. 73, 1–16. doi:10.1109/tim.2024.3398123
Naqvi, S. A. R., Rajmohan, I. J., Xue, F., Foong, D., and Abbosh, A. (2025). Electromagnetic techniques and systems for non-invasive skin cancer detection and classification: current status and future perspectives. IEEE Trans. Instrum. Meas. 74, 1–24. doi:10.1109/tim.2025.3604920
Narasimhan, T. N. (1999). Fourier’s heat conduction equation: history, influence, and connections. Rev. Geophys. 37, 151–172. doi:10.1029/1998rg900006
Pennes, H. H. (1948). Analysis of tissue and arterial blood temperatures in the resting human forearm. J. Applied Physiology 1, 93–122. doi:10.1152/jappl.1948.1.2.93
Priya, G. S., Prakash, P., Nieto, J., and Kayar, Z. (2013). Higher-order numerical scheme for the fractional heat equation with dirichlet and neumann boundary conditions. Numer. Heat. Transf. Part B Fundam. 63, 540–559. doi:10.1080/10407790.2013.778719
Roky, A. H., Islam, M. M., Ahasan, A. M. F., Mostaq, M. S., Mahmud, M. Z., Amin, M. N., et al. (2025). Overview of skin cancer types and prevalence rates across continents. Cancer Pathogenesis Therapy 3, 89–100. doi:10.1016/j.cpt.2024.08.002
Rowbotham, S. K., Mole, C. G., Tieppo, D., Blaszkowska, M., Cordner, S. M., and Blau, S. (2023). Average thickness of the bones of the human neurocranium: development of reference measurements to assist with blunt force trauma interpretations. Int. Journal Legal Medicine 137, 195–213. doi:10.1007/s00414-022-02824-y
Sacco, G., Haider, Z., and Zhadobov, M. (2022). Exposure levels induced in curved body parts at mmwaves. IEEE J. Electromagn. RF Microwaves Med. Biol. 6, 413–419. doi:10.1109/JERM.2022.3178604
Schiavoni, R., Maietta, G., Filieri, E., Masciullo, A., and Cataldo, A. (2023). Microwave reflectometry sensing system for low-cost in-vivo skin cancer diagnostics. IEEE Access 11, 13918–13928. doi:10.1109/access.2023.3243843
Shang, S., Mokhtari, M., Tchinov, M., and Popović, M. (2024). “Employing surface waves for detection of skin melanoma: initial analysis and simulations,” in 2024 IEEE MTT-S international microwave biomedical conference (Montreal, QC, Canada IMBioC), 96–98. doi:10.1109/IMBioC60287.2024.10590463
Shang, S., Mokhtari, M., and Popović, M. (2025). Employing surface waves for characterizing skin: experimental validation. IEEE J. Electromagn. RF Microwaves Med. Biol. 9, 110–116. doi:10.1109/JERM.2025.3555198
Störchle, P., Müller, W., Sengeis, M., Lackner, S., Holasek, S., and Fürhapter-Rieger, A. (2018). Measurement of mean subcutaneous fat thickness: eight standardised ultrasound sites compared to 216 randomly selected sites. Sci. Reports 8, 16268. doi:10.1038/s41598-018-34213-0
Suryanata, F. A., Muhammad, N. F., Azizi, N. N. A. A., Dewan, R., and Roy, B. (2023). Performance analysis of wearable antenna worn in close proximity with human body. J. Med. Device Technol. 2, 43–49. doi:10.11113/jmeditec.v1n1.28
Keywords: radiation safety, thermal effect, specific absorption rate, skin cancer detector, microwave
Citation: Shang S and Popović M (2025) Site-dependent numerical safety analysis in microwave skin spectroscopy: comparison of monopole and vivaldi antennas. Front. Antennas Propag. 3:1714578. doi: 10.3389/fanpr.2025.1714578
Received: 27 September 2025; Accepted: 21 November 2025;
Published: 12 December 2025.
Edited by:
Giacomo Paolini, University of Bologna, ItalyCopyright © 2025 Shang and Popović. This is an open-access article distributed under the terms of the Creative Commons Attribution License (CC BY). The use, distribution or reproduction in other forums is permitted, provided the original author(s) and the copyright owner(s) are credited and that the original publication in this journal is cited, in accordance with accepted academic practice. No use, distribution or reproduction is permitted which does not comply with these terms.
*Correspondence: Milica Popović, bWlsaWNhLnBvcG92aWNoQG1jZ2lsbC5jYQ==