 Jannick Kappelmann1Bianca Klein1
 Mathias Papenfuß2Julian Lange3
 Bastian Blombach4
 Ralf Takors3Wolfgang Wiechert1Tino Polen1
 Stephan Noack1*
- 1Institute of Bio- and Geosciences 1, IBG-1: Biotechnology, Forschungszentrum Jülich GmbH, Jülich, Germany
- 2Institute of Biochemical Engineering, Braunschweig University of Technology, Braunschweig, Germany
- 3Institute of Biochemical Engineering, University of Stuttgart, Stuttgart, Germany
- 4Microbial Biotechnology, Campus Straubing for Biotechnology and Sustainability, Technical University of Munich, Straubing, Germany
Wild-type C. glutamicum ATCC 13032 is known to possess two enzymes with anaplerotic (C4-directed) carboxylation activity, namely phosphoenolpyruvate carboxylase (PEPCx) and pyruvate carboxylase (PCx). On the other hand, C3-directed decarboxylation can be catalyzed by the three enzymes phosphoenolpyruvate carboxykinase (PEPCk), oxaloacetate decarboxylase (ODx), and malic enzyme (ME). The resulting high metabolic flexibility at the anaplerotic node compromises the unambigous determination of its carbon and energy flux in C. glutamicum wild type. To circumvent this problem we performed a comprehensive analysis of selected single or double deletion mutants in the anaplerosis of wild-type C. glutamicum under defined D-glucose conditions. By applying well-controlled lab-scale bioreactor experiments in combination with untargeted proteomics, quantitative metabolomics and whole-genome sequencing hitherto unknown, and sometimes counter-intuitive, genotype-phenotype relationships in these mutants could be unraveled. In comparison to the wild type the four mutants C. glutamiucm Δpyc, C. glutamiucm Δpyc Δodx, C. glutamiucm Δppc Δpyc, and C. glutamiucm Δpck showed lowered specific growth rates and D-glucose uptake rates, underlining the importance of PCx and PEPCk activity for a balanced carbon and energy flux at the anaplerotic node. Most interestingly, the strain C. glutamiucm Δppc Δpyc could be evolved to grow on D-glucose as the only source of carbon and energy, whereas this combination was previously considered lethal. The prevented anaplerotic carboxylation activity of PEPCx and PCx was found in the evolved strain to be compensated by an up-regulation of the glyoxylate shunt, potentially in combination with the 2-methylcitrate cycle.
Introduction
C. glutamicum is one of the most important organisms for industrial biotechnology and the current product spectrum that is accessible with this host comprises proteinogenic as well as non-proteinogenic amino acids, organic acids, diamines, vitamins, aromates, and alcohols (Becker et al., 2018; Kogure and Inui, 2018). Most production strains have been generated by classical mutagenesis and selection, as well as by targeted and evolutionary metabolic engineering approaches (Lee and Wendisch, 2017; Stella et al., 2019). With the aim to enhance predictability of cellular functions and to reduce interference with heterologous pathways new chassis strains were introduced (Baumgart et al., 2013, 2018; Unthan et al., 2015). Several targeted and untargeted proteomics methods were developed, enabling relative, and absolute quantification of cytosolic as well as membrane-bound proteins (Fränzel et al., 2009; Voges and Noack, 2012; Trötschel et al., 2013; Küberl et al., 2014; Voges et al., 2015; Noack et al., 2017).
At the phosphoenolpyruvate-pyruvate-oxaloacetate node C. glutamicum ATCC 13032 (wild type) is known to possess two enzymes with anaplerotic (C4-directed) carboxylation activity, namely phosphoenolpyruvate carboxylase (PEPCx) and pyruvate carboxylase (PCx). On the other hand, C3-directed decarboxylation can be catalyzed by the three enzymes phosphoenolpyruvate carboxykinase (PEPCk), oxaloacetate decarboxylase (ODx), and malic enzyme (ME). While all enzymes show in vitro activity in cells grown in defined D-glucose media (Cocaign-Bousquet et al., 1996; Uy et al., 1999; Klaffl and Eikmanns, 2010; Blombach et al., 2013), only PEPCx and PCx are currently considered as dependent essential anaplerotic enzymes under these conditions (Figure 1).
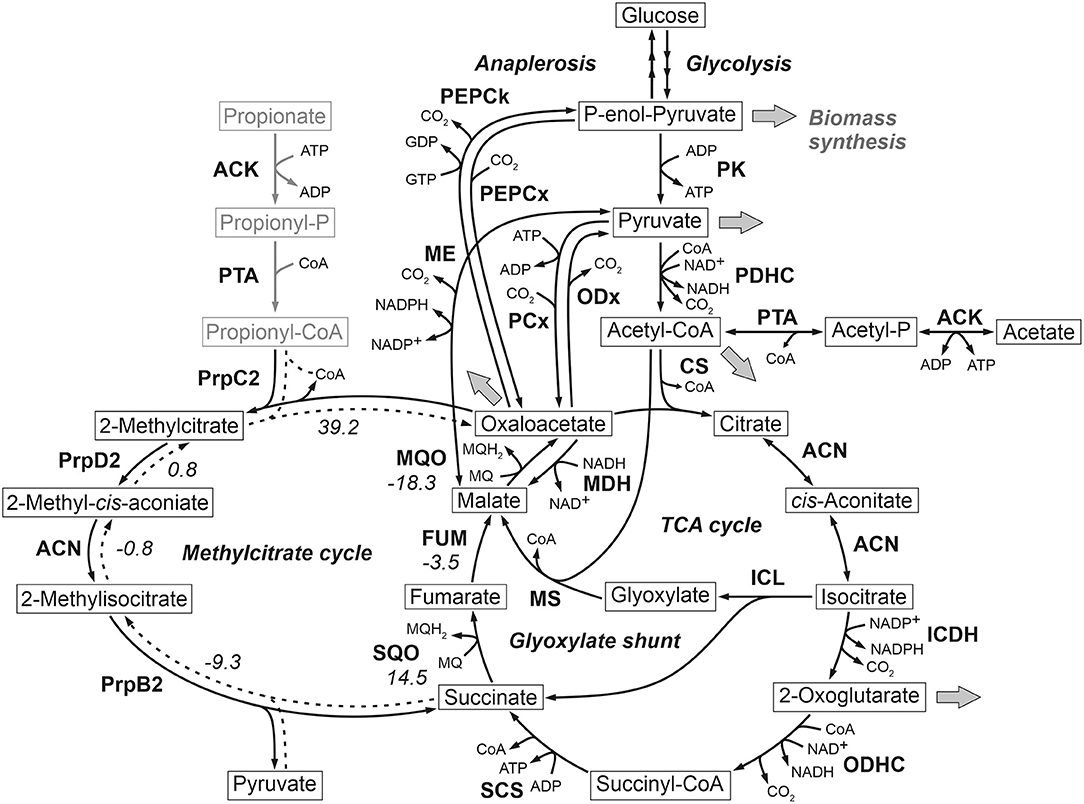
Figure 1. Reactions comprising the anaplerotic node, TCA cycle, glyoxylate shunt and methylcitrate cycle in C. glutamicum ATCC 13032. Precursor effluxes into biomass are depicted by gray arrows. For some reactions the standard Gibbs energy of reaction in kJ/mol are shown, which were estimated using the eQuilibrator tool (Flamholz et al., 2012). The values for the methylcitrate cycle refer to the assumed reverse reaction direction represented by broken lines. ACN, aconitase; ACK, acetate kinase; CS, citrate synthase; FUM, fumarase; ICDH, isocitrate dehydrogenase; ICL, isocitrate lyase; MDH, malate dehydrogenase; ME, malic enzyme; MQO, malate: quinone oxidoreductase; MS, malate synthase; ODHC, 2-oxoglutarate dehydrogenase complex; ODx, oxaloacetate decarboxylase; PCx, pyruvate carboxylase; PDHC, pyruvate dehydrogenase complex; PEPCk, phosphoenolpyruvate carboxykinase; PEPCx, phosphoenolpyruvate carboxylase; PPS, phosphoenolpyruvate synthetase; PK, pyruvate kinase; PQO, pyruvate: quinone oxidoreductase; PrpB2, 2-methylcitrate lyase; PrpC2, 2-methylcitrate synthase; PrpD2, 2-methylcitrate dehydratase; PTA, phosphotransacetylase; SCS, succinyl-CoA-synthetase; SQO, succinate: quinone oxidoreductase.
Recently, the anaplerotic node of C. glutamicum, which represents a very flexible knot for diverting the carbon and energy flux introduced by different potential substrates, has again attracted our attention. Following detailed mathematical modeling and computational analyses, we could prove that only certain anaplerotic deletion mutants allow to uniquely determine the anaplerotic fluxes (Kappelmann et al., 2016).
Following shake flask experiments, it was shown that a single inactivation of either PEPCx, PCx, ODx or ME in wild-type C. glutamicum has no effect on biomass growth (Peters-Wendisch et al., 1993, 1998; Gourdon et al., 2000; Klaffl and Eikmanns, 2010). The only exception was found for PEPCk, whose inactivation resulted in a lower growth rate (Riedel et al., 2001). In contrast, the combined removal of PEPCx and PCx is thought to be lethal for C. glutamicum when grown under glycolytic conditions as no other carboxylation reaction enables replenishment of tricarboxylic acid intermediates (Peters-Wendisch et al., 1998). Recently, Schwentner et al. were able to evolve C. glutamicum Δppc Δpyc to grow on CGXII medium with 20 g L−1 D-glucose and 1 g L−1 yeast extract (or alternatively 1 mM L-glutamate) (Schwentner et al., 2018). Comparative whole-genome sequencing revealed isocitrate dehydrogenase (ICD) as consistent target and the identified mutations could be linked to diminished ICD activities as well as increased activities of the glyoxylate shunt enzymes isocitrate lyase (ICL) and malate synthase (MS). Operation of the glyoxylate shunt can substitute for the missing carboxylation reactions to replenish oxaloacetate required for growth. Interestingly, on pure D-glucose media this evolution failed in the study reported (Schwentner et al., 2018).
In our study, we performed a comprehensive analysis of selected single or double deletion mutants in the anaplerosis of wild-type C. glutamicum under defined D-glucose conditions without other carbon supplements. By applying well-controlled lab-scale bioreactor experiments in combination with untargeted proteomics, quantitative metabolomics and whole-genome sequencing hitherto unknown genotype-phenotype relationships in these mutants could be unraveled and these are discussed in detail with regard to published data.
Materials and Methods
Bacterial Strains
All strains, plasmids and oligonucleotids used in this study are listed in Table 1. The C. glutamicum WT as well as the single deletion mutants Δpyc, ΔmalE, Δpck are from Blombach et al. (2013). The double deletion mutant Δppc Δpyc is described in Schwentner et al. (2018). The three remaining double deletion mutants Δpyc Δodx, Δppc ΔmalE and Δpck ΔmalE were constructed by chromosomal inactivation of the ODx gene odx in C. glutamicum Δpyc, as well as the ME gene malE in C. glutamicum Δpck and C. glutamicum Δppc using the plasmids pK19mobsacB-Δodx and pK19mobsacB-ΔmalE. Isolation of plasmids from Escherichia coli was performed as described elsewhere (Eikmanns et al., 1994). Plasmid DNA transfer into C. glutamicum was carried out by electroporation and recombinant strains were selected on Luria–Bertani Brain Heart Infusion agar plates containing appropriate concentrations of kanamycin (50 μg mL−1) (Van Der Rest et al., 1999). The replacement at the chromosomal locus was verified by colony-PCR using primers odxfow/odxrev and Co-malE1/Co-malE1, respectively (Klaffl and Eikmanns, 2010; Blombach et al., 2011). Subsequently, shaking flasks with CGXII preculture medium containing 1% D-glucose (w v−1) were inoculated with the corresponding strains (Unthan et al., 2014). Each culture was harvested during the late exponential phase following centrifugation at 4,500 rpm for 10 min, resuspension in sterile saline and finally in 20% (v v−1) glycerol solution in sterile 0.9% (w v−1) NaCl in distilled water. From this solution cryo stocks were prepared and immediately stored at −80°C. The Δppc Δpyc mutant was able to grow on acetate, from which a corresponding cryo-culture was produced.
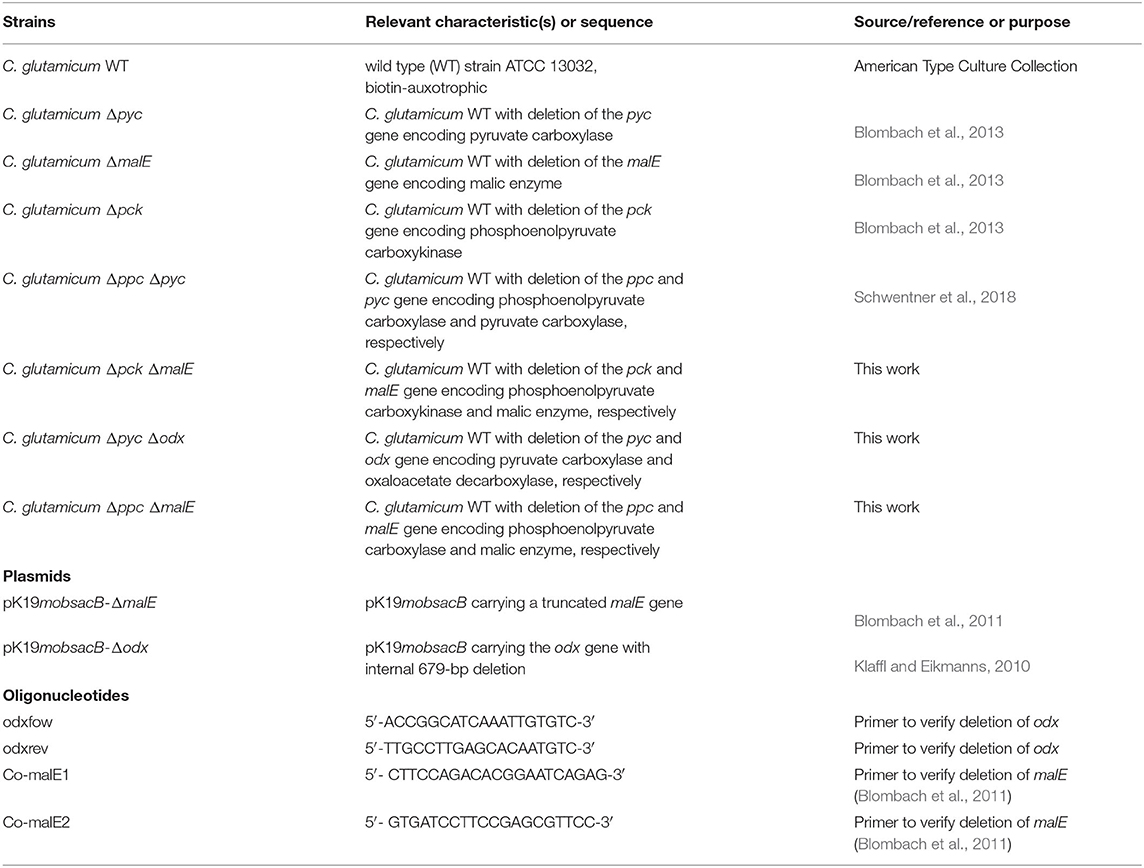
Table 1. Strains, plasmids, and oligonucleotides used in this study.
Evolution and Whole-Genome Sequencing of C. glutamicum Δppc Δpyc
C. glutamicum Δppc Δpyc was grown in microtiter plates in a BioLector parallel cultivation system (m2p-labs). Flowerplates with optodes for optical pH and dissolved oxygen (DO) measurements were employed. A cryo-culture for inoculation was washed once with sterile saline and resuspended in D-glucose-free CGXII medium. From this inoculum 50 μL were transferred into each well containing 950 μL 1% D-glucose medium. The plates were sterilely sealed and incubated at 30°C at 1,300 rpm.
For whole-genome sequencing, 200 μL of a well-inoculated at ODinit = 1 (see Supplementary Figure 1) and after growth has ceased was used to inoculate a subsequent shaking flask culture, from which a cryo-culture was produced. From this cryo-culture a sample was generated for whole-genome sequencing using the Illumina platform followed by sequence analysis as described elsewhere (Kranz et al., 2017).
Bioreactor Cultivations
C. glutamicum deletion strains were cultivated in a DASGIP parallel fermentation system (Eppendorf). Bioreactor cultivations of C. glutamicum strains were carried out with defined CGXII medium containing 1% D-glucose and 0.1% undiluted Antifoam 204 but no 3-(N-Morpholino)propanesulfonic acid (MOPS) buffer (Unthan et al., 2014). Bioreactors were inoculated from a preculture in CGXII medium buffered with 42 g L−1 MOPS at pH 7 which was inoculated directly from a cryo-culture of each strain in 80% 0.9% NaCl/20% glycerol (v v−1) stored at −80°C. During bioreactor cultivations DO levels were maintained above 30% by adjusting stirrer speed and oxygen content of the inlet air. The gassing rate was set to 1 vvm and the pH was maintained at pH 7 by feeding either 4 M NaOH or 4 M HCl. The cultivation temperature was 30°C.
For quantitative metabolomics, samples from bioreactor cultivations were drawn into a syringe in technical duplicate at two time points yielding a total of four technical replicates per strain. These time points correspond to target BV concentrations of 5 μL mL−1 (OD600 = 6.3) and 10 μL mL−1 (OD600 = 12.5), covering the mid-exponential phase (cmp. Supplementary Figure 2). The actual BV concentration in each sample was measured after sampling and used to calculate the extraction volume.
For untargeted proteomics, sampling was performed directly after all quenching samples for the metabolome analysis had been taken. From each reactor samples were drawn in technical quintuplicate by centrifuging 10 mL of culture broth for each replicate (10 min, 4500 rpm, GS-15R Centrifuge, Beckman Coulter). After the supernatant was decanted, the biomass pellets were immediately placed in aluminum racks at −20°C.
For biovolume (BV) measurements, cultivation samples were diluted 1:200 or 1:2,000 depending on the biomass concentration in 10 mL CASYton buffer (OMNI Life Science GmbH). The size distribution of the sample was determined by the MultiSizer3 Coulter Counter (Beckman Coulter) and the biovolume was computed by calculating the first moment of the distribution, assuming a spherical shape of the measured cells. Cell dry weight (CDW) was determined by centrifuging 2 mL of a bioreactor sample in a pre-dried and pre-weighted Eppendorf tube at 13,000 rpm for 7 min. The cells were washed in 1 mL 0.9% (w v−1) NaCl by resuspension and renewed centrifugation. After decanting the supernatant, the pellets were dried for at least 2 days at 80°C.
A correlation between BV in μL mL−1 and CDW in g L−1 was derived for the Δpyc Δodx, Δppc ΔmalE and WT strain (see Supplementary Figure 3) and then applied to calculate the CDW for all cultivations assuming a standard deviation of 5%.
Estimation of Extracellular Rates
Specific rates for biomass growth (μ) and D-glucose uptake (πGLC) were estimated using a model-based approach and process data from the exponential phases of corresponding batch cultivations. In short, the remaining D-glucose concentration cGLC(t) at any given time point t is the integral over the volumetric uptake rate πGLC,vol(t) given in mmol L−1 h−1:
Assuming a constant D-glucose uptake from exponentially growing cells, it holds:
where denotes the biomass concentration in μL mL−1 or g L−1, depending on whether the biomass signal is BV or CDW. Inserting Equations (2) into (1) and carrying out the integration yields:
with model parameters X0, μ, πGLC, and C, where the latter absorbs the integration constant and the initial substrate concentration. Equations (2) and (3) were jointly fitted to the experimentally observed time courses of biomass and substrate concentration, respectively. The end of the exponential phase was judged by the peak in CO2 volume fraction in the exhaust gas stream (see Supplementary Figure 2).
The fitting procedure was carried out using a sequential quadratic programming optimization routine from MATLAB (Mathworks Inc., R2019b). The estimation of confidence intervals was based on a parametric Monte Carlo bootstrapping approach from literature (Dalman et al., 2013). In short, every available measurement was perturbed independently within the normal distribution described by the measurement value and its standard deviation of the respective measurement. The perturbation operation consisted in sampling from the normal distribution of each measurement point and inserting the sample as measurements. The above-described variance-weighted least-square fit was then re-performed. The sample was generated as a Latin-Hypercube sample using the lhs-function of MATLAB and comprised 1,000 samples if not otherwise stated. The upper and lower confidence bounds were then derived as the α-th and (1-α)-th percentile of the parameter sample obtained from 1000 least-squared fits. If not otherwise stated α is set to 0.25, the confidence interval being the Interquartile Range (IQR).
The total CO2 formation rate πCO2,tot(t) given in mol h−1 was calculated from balancing the gas phase of the bioreactor as:
where Φ denotes the volume fraction of the gas species in question in vol% and the superscripts α and ω denote the inlet and outlet concentrations, respectively. F denotes the inlet air flow in m3 h−1. The biomass-specific carbon dioxide formation rate πCO2(t) given in mmol h−1 or mmol h−1, respectively, was obtained by dividing πCO2,tot(t) by X(t) at time point t.
The complete set of extracellular rate estimates for all independent bioreactor cultivation experiments can be found in Supplementary Table 1.
Quantitative Metabolomics
The metabolome samples of all strains were spiked with identical internal standard and were measured in one acquisition batch on the LC-ESI-QqQ MS system. Organic acids and unstable sugar phosphates were measured within 24 h from the extraction of samples. Quenching, cell separation, cell extraction, isotope dilution mass spectrometry and metabolite leakage correction were performed according to previous protocols (Paczia et al., 2012; Tillack et al., 2012).
For quantification of organic acids, samples were separated using a synergy hydro C18 reversed phase column (Phenomenex) on an Agilent 1200 chromatography system (Agilent Technologies). The HPLC column outlet was coupled to a QqQ MS device (API 4000, AB Sciex) equipped with a TurboSpray ion source in negative ionization mode. The elution was isocratic at 84% buffer A and 16% buffer B at a flowrate of 0.45 mL min−1 at 20°C. The eluents were as follows: Buffer A: 10 mM tributylamine, 15 mM acetic acid, pH 4.95; Buffer B: methanol. MS parameters were as follows: CAD (collision gas pressure): 5, CUR (curtain gas flow): 30, GS1 (nebulizer gas flow): 70, GS2 (turbo heater gas flow): 70, IS (electrospray voltage): −4,500 V, TEM (heater gas temperature): 650°C, entrance potential: −10 eV. Injection volume was 10 μL.
For quantification of amino acids, samples were separated using Luna SCX cation exchange column at 60°C on a JASCO HPLC system. The following buffers were employed: Buffer A: 5% acetic acid, B: 15 mM ammonium acetate. The applied elution gradient can be found in Supplementary Table 2. Injection volume was 10 μL.
For quantification of sugar and nucleoside phosphates, samples were separated on a synergy hydro C18 reversed phase column at 40°C. Eluent were Buffer A: 10 mM tributylamine, 15 mM acetic acid, pH 4.95 and Buffer B: methanol. The HPLC system, the QqQ MS device and its MS parameter settings were the same as for the LC-MS/MS method for organic acids. For quantification the gradient of Supplementary Table 3 was applied. Injection volume was 10 μL.
Generation of Ion Libraries for Proteomics
To populate our C. glutamicum ion library, separate IDA acquisitions of samples of C. glutamicum WT cultivated as described above but with different carbon sources were performed. In each cultivation the carbon source was either 55 mM D-glucose, 111 mM sodium pyruvate, 83 mM disodium-L-malate, 55 mM sodium citrate or 48 mM sodium benzoate. Each sample was lysed and 100 μg protein thereof digested and processed as described elsewhere (Voges and Noack, 2012).
These samples were separated on a Agilent 1260 Infinity HPLC system (Agilent Technologies) equipped with a 150 * 2.1 mm Ascentis Express Peptide ES-C18 column with 2.7 μm particle size and an appropriate 5 * 0.3 mm Acclaim PepMap Trap Cartridge (Thermo Scientific) which were both maintained at 25°C and a flow rate of 200 μL min−1. For LC separation 0.1% formic acid in LC-MS grade water (v v−1) was used as buffer A, whereas buffer B was 0.1% formic acid in LC-MS grade acetonitrile (v v−1). Before each injection, the column was equilibrated for 12 min at 97% A. After 20 μL were injected, the gradient of Supplementary Table 4 was applied. The LC-eluent was coupled to an ESI-QqTOF MS (TripleTOF 6600, AB Sciex) equipped with an DuoSpray ion source. The data acquisition was performed using Analyst TF 1.8 (AB Sciex). An information-dependent acquisition was performed on each injection during which all ions with m/z >300, charge state 2–4 and above intensity of 150 were selected for fragmentation.
The acquired MS2 spectra of the C. glutamicum digests were searched against a FASTA database of C. glutamicum ATCC 13032 (GenBank assembly accession: GCA_000196335.1) using ProteinPilot software 5.0 (AB Sciex) employing default probabilities for biological modifications. The confidently identified peptides of each injection were assembled into a library covering 1727 ORFs. This library incorporates the peptide confidence after identification, peptide (precursor) intensity in the MS1 scan from the IDA acquisition, fragment ion intensities and the observed peptide retention time.
SWATH Acquisition
Starting from an IDA acquisition of each organism variable SWATH windows were calculated using the SWATH Variable Window Calculator 1.0 (AB Sciex). Using these windows, a SWATH acquisition method was set up, which employed the same chromatographic gradient and ion source setting as the IDA acquisition. The window width and CE ramp parameters can be found in Supplementary Table 5. For SWATH acquisition a digest of each sample was prepared according to the protocol of Voges and Noack, which involves mixing 50 μg unlabeled sample protein and 50 μg internal standard from a separate cultivation of C. glutamicum with (15NH4)2SO4 (Voges and Noack, 2012). Ten microliter of each sample was injected.
SWATH MS Data Processing
SWATH data processing was performed using the MS/MSall SWATH Acquisition MicroApp in PeakView 2.2 (AB Sciex). The ion library from above was imported from ProteinPilot into this app by excluding shared peptides but not modified ones. From the imported ion library the ten most intense peptides were selected for quantification provided they had a peptide confidence of >96%. The intensity selection is based on the MS1 survey scan intensity of each peptide in the IDA runs used to build the ion library. If <10 peptides fulfilled the above criterion for a protein, only the available peptides were quantified.
For each peptide group the 12 most intense fragment ion traces were chosen by the SWATH processing algorithm. This algorithm favors the most intense fragment ion traces from the library spectrum whose m/z value lies above the Q1 window of their precursor ion. For each fragment ion, within 5 min around the expected retention time, an unlabeled mass trace was extracted from the SWATH spectra within ±15 ppm of its monoisotopic mass, whereas the labeled mass trace was extracted within ±15 ppm of its fully 15N-labeled isotopologue. All transitions of one peptide were assembled into a so called peak group which was scored for congruency with the ion library. The false discovery rate was set to 0.1%. The finished processing session was saved as MarkerView file (.mrkvw extension), which was opened in MarkerView 1.3.1 (AB Sciex) for estimation of fold-changes (ratio of means) of protein levels between mutant and control.
Elemental Analysis of Biomass
The concentration of carbon, nitrogen and sulfur in biomass were determined at the central Analytical core facility of Forschungszentrum Jülich (ZEA-3). Biomass samples from the early stationary phase were processed following the same procedure as for CDW content determination. The dried biomass pellet was ground to a fine powder in a pre-dried mortar using a pre-dried pestle and sent in a sealed container to ZEA-3.
Results and Discussion
Growth Phenotyping of Anaplerotic Deletions Mutants Under Defined D-Glucose Conditions
In our previous flux identifiability analysis focusing on the anaplerotic node in C. glutamicum those metabolic network structures were identified that are structurally identifiable under defined D-glucose conditions (Kappelmann et al., 2016). These structures are based on deletions of specific genes encoding for anaplerotic reactions. In this study, we comprehensively analyzed a set of mutant strains for which a unique solution using 13C-MFA theoretically exists as well as mutants that are non-flux-identifiable strains.
All selected deletion mutants were able to grow on defined CGXII medium with D-glucose as sole carbon and energy source, except for strain C. glutamicum Δppc Δpyc that is deficient in PEPCx and PCx activity (Table 1). While this mutant was able to grow on acetate without lag-phase no biomass formation could be monitored within 48 h cultivation on D-glucose and this observation is concordant with Peters-Wendisch et al. (1998). However, prolonged incubation of C. glutamicum Δppc Δpyc under defined D-glucose conditions in a microbioreactor setup and at different inoculum sizes always resulted in the onset of growth after 75 h or later, mainly after 100 h (Supplementary Figure 1).
The whole mutant library was then cultivated under controlled bioreactor conditions on defined CGXII medium with 1% D-glucose. Specific growth and substrate uptake rates were estimated using a model-based approach (see Materials and Methods section). The D-glucose uptake rate of 4.82 mmol and the specific growth rate of 0.45 h−1 for C. glutamicum WT agree well with literature (Buchholz et al., 2014). Based on the determined confidence intervals discernible growth phenotypes can be identified among the set of deletion mutants (Figure 2A and Table 2).
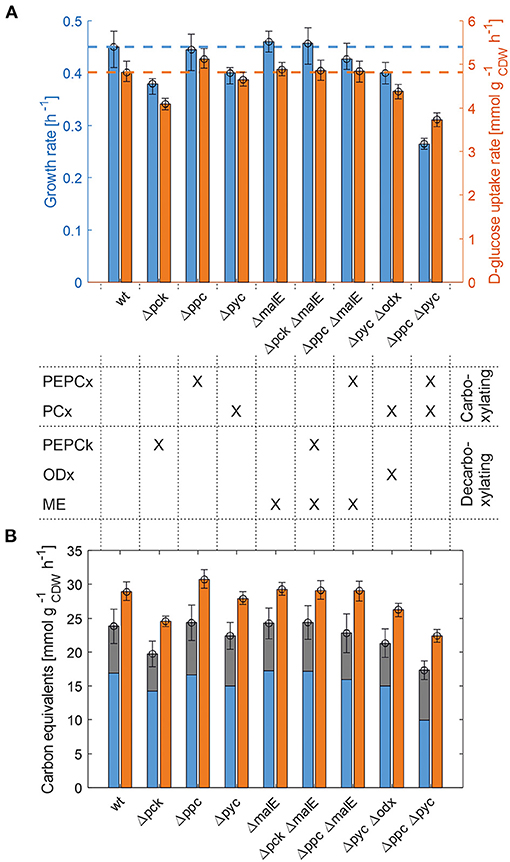
Figure 2. Growth phenotyping of anaplerotic deletions mutants under defined D-glucose conditions. (A) Estimated specific growth and D-glucose uptake rates. Mean values of rate estimates are from biological duplicate or triplicate cultivations. Error estimates are given as the minimum of the lower bound and the maximum of the upper bound of each parameter over all replicate cultivations of the mutant in question (see Supplementary Table 1). (B) Carbon equivalents of the specific growth rate (blue), CO2-formation rate (gray) and the substrate uptake rate (orange). The error bar on the stacked bars is the error on the sum of both rates, which was estimated according to Gaussian error propagation.
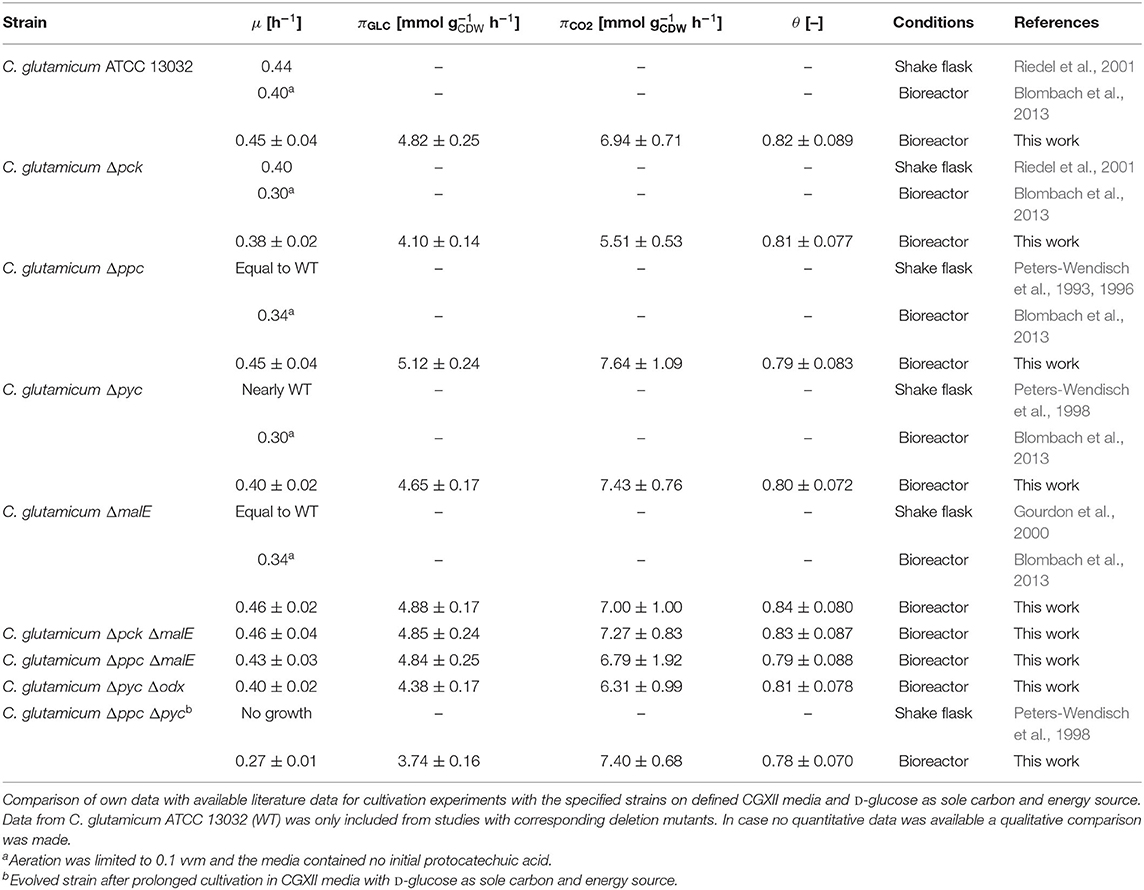
Table 2. Estimated specific growth rates (μ), D-glucose consumption rates (πGLC), CO2 formation rates (πCO2), and instantaneous carbon balance (θ) for anaplerotic deletion mutants during exponential growth.
First, the C. glutamicum Δpck mutant showed a lower growth rate although PEPCk catalyzes a gluconeogenetic reaction, not needed under glycolytic conditions to supply biomass precursors. However, the observed growth defect clearly indicates its activity under glycolytic conditions. This result was also obtained in the study of Riedel et al. with the comparable genotype (Table 2) and in the study of Petersen et al. (2001), who inferred PEPCk activity in a C. glutamicum L-lysine producer from 13C-labeling data. Since the carbon flow catalyzed by PEPCk is of opposite direction compared to the overall carbon flow under glycolytic conditions, its catalytic effect must be of indirect nature. Strangely, the double deletion mutant C. glutamicum Δpck ΔmalE showed a restored growth phenotype, with a growth rate equivalent to the WT.
Deletion mutants comprising a deletion in PEPCx do not show a significantly altered growth phenotype as long as PCx is still active (Figure 2A and Table 2). The stoichiometry of the reaction catalyzed by PEPCx is identical to the reaction sequence of pyruvate kinase (PK) and PCx, which apparently fully compensates for the missing carboxylation activity of PEPCx. On the other hand, mutant strains C. glutamicum Δpyc and C. glutamicum Δpyc Δodx do exhibit a growth phenotype. This finding underscores the role of PCx as most important anaplerotic reaction under aerobic conditions and suggests that its catalyzed flux is most likely greater than that of PEPCx in the WT under standard D-glucose conditions. Noteworthy, a C. glutamicum mutant with single deletion of the odx gene was shown to grow equally well as the wild type (Klaffl and Eikmanns, 2010).
The evolved C. glutamicum Δppc Δpyc strain, missing both carboxylation activities shows a greatly reduced growth rate of 0.27 h−1 (Figure 2A and Table 2). In the absence of both PEPCx and PCx, three other and different anaplerotic activities can possibly substitute the anaplerotic activity of PEPCx and PCx: First, ME may catalyze the carboxylation of pyruvate to malate in an NADPH-dependent manner. This appears plausible since ME was found to catalyze this reaction sequence in in vitro assays (Cocaign-Bousquet et al., 1996; Gourdon et al., 2000). Moreover, it could be experimentally shown that a NADPH-dependent ME from E. coli can act as sole anaplerotic enzyme in Saccharomyces cerevisiae sustaining a growth rate of 0.06 h−1 (Zelle et al., 2011). Second, PEPCk may act in reverse direction from phosphoenolpyruvate to oxaloacetate. This hypothesis is rather unlikely as this reaction directionality would couple anaplerotic carboxylation to the substrate level phosphorylation, generating one GTP molecule. Since the reaction from oxaloacetate to phosphoenolpyruvate is coupled to the hydrolysis of one GTP molecule, it can be expected to be favored. A third alternative represents the glyoxylate shunt, which exclusively fulfills the anaplerotic function in C. glutamicum under growth on acetate (Wendisch et al., 1997).
A Closer Look Into Carbon Balancing
Interestingly, the C. glutamicum Δppc Δpyc mutant also showed an altered ratio of specific glucose uptake and growth rate in comparison to other mutants and the WT (Figure 2A). The observation that less biomass was formed per unit uptake rate raised the question as to where the excess carbon atoms end up. To answer this question, a carbon balance was performed. Contrary to the conventional carbon balancing approach, consisting in the quantification of the total carbon recovery in biomass and exhaust gas by the time all substrate has been consumed (Buchholz et al., 2014), we calculated the instantaneous carbon balance Θ as:
where μ denotes the specific growth rate given in h−1 (here assumed to be constant for the considered exponentially growing cells), ωC denotes the mass fraction of carbon in the biomass in gC , MC denotes the molecular weight of carbon in g mmol−1, and πGLC as well as πCO2 denote the specific D-glucose uptake and carbon dioxide formation rates as derived from Equations (2) to (4).
Equation (5) balances the specific rates of carbon uptake and carbon flow into sinks at any given time. Here biomass and CO2 formation are the only considered carbon sinks (any other by-product formation could be excluded for all strains under investigation). The quantity ωC has been reported several times in the literature: Marx et al. (1996) reported 0.408 gC for C. glutamicum MH20-22B, a L-lysine producer strain, determined in freeze-dried biomass with a CHNS elemental analyzer. More recently, Buchholz et al. (2014) reported a value of 0.514 for C. glutamicum ATCC 13032, which was determined by separately quantifying the total carbon in liquid bioreactor samples (supernatant and biomass) and the total inorganic carbon (total dissolved carbon) in the supernatant. In this work, we experimentally quantified ωC for wild-type C. glutamicum to be around 0.4–0.42 . The uncertainty of this parameter notwithstanding, its value was assumed to be 0.45 for all following calculations. In face of the apparent uncertainty, its standard error was assumed to be 0.05 . The arising interval covers all available literature information on this quantity. The uncertainty in derived quantities thereof can be computed by Gaussian error propagation.
From Figure 2B it becomes apparent that the evolved Δppc Δpyc strain grows with a higher relative CO2-formation rate with respect to the uptake rate. At the same time, the sum of the specific rates at which carbon flows into sinks amounts to the same relative value with respect to the carbon uptake rate as in other strains. Therefore, it seems plausible that a higher decarboxylation activity explains the lower relative growth rate in the C. glutamicum Δppc Δpyc mutant. This higher relative CO2-formation rate further substantiates the hypothesis that an altered ratio of ICL and ICD activity involves the glyoxylate shunt as anaplerotic reaction sequence in this mutant. Exclusive anaplerotic activity through the glyoxylate shunt would release two equivalents CO2 per C4-body of oxaloacetate formed, instead of fixing one CO2 as in the case of alternative ME or reversible PEPCk activities.
One result holds true irrespective of the genetic background: The recovery of carbon at any given time in the reactions that act as carbon sinks amounts to 80% of the carbon equivalent of the uptake rate (Figure 2B and Table 2). The non-closed instantaneous carbon balance may hint to extensive by-product formation or indicate systematically biased extracellular rates. The former is unlikely since C. glutamicum WT is known to produce only minor by-products under aerobic conditions (the DO was maintained at 30%). Notwithstanding, the genetic alterations may induce a more extensive overflow metabolism in some deletion mutants. However, all organic acids, sugar phosphates and amino acids in the culture supernatant measured by targeted LC-MS/MS account for a total of 274–786 μmolC , depending on the strain. Therefore, the exometabolome can be neglected as carbon sink since the gap in the balance of specific rates amounts to several mmolC h−1 (Figure 2B).
Remarkably, the value of 80% for the instantaneous carbon balance matches the determined carbon balance closure in the study of Buchholz et al. (2014). This study convincingly showed that the gap in carbon balance can be traced back to the fact that part of the CO2-production at any given time dissolves as in the culture broth. This share is not recovered as gaseous CO2 at the detector, leading to an underestimation of the CO2-production rate.
Proteomic and Metabolomic Responses to Gene Deletions in Anaplerotic Reactions
To gain further insight into the metabolism of each mutant, untargeted proteome and targeted metabolome analyses were performed. To ensure comparability, eight strains were cultivated in parallel and subjected to identical and isochronous sample processing in subsequent steps (see section Materials and Methods for detailed descriptions). In total, we analyzed 1199 cytosolic proteins and 48 metabolites of central metabolism.
Since the Δppc mutant showed no altered phenotype and has been thoroughly characterized before, it was omitted from the set of strains to be analyzed. The evolved strain C. glutamicum Δppc Δpyc showed significant changes in specific proteins and metabolites, which will be discussed separately in the next section.
Further differentially expressed proteins were found in C. glutamicum Δpck and C. glutamicum Δpyc (Figure 3). In none of the other tested deletion mutants significantly changed protein abundances [p < 0.05, |Log2(fold change)| ≥ 0.5] were found (data not shown).
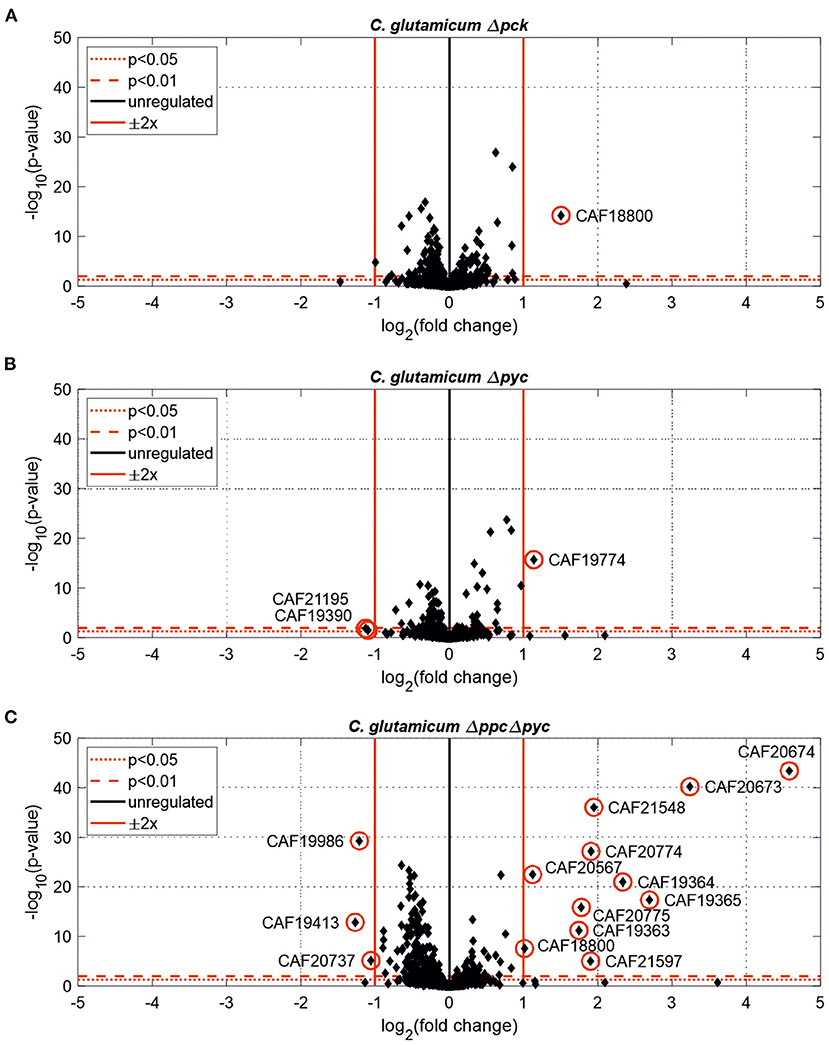
Figure 3. Estimated protein fold-changes for selected C. glutamicum deletion mutants in comparison to the wild type. (A) C. glutamicum Δpck. (B) C. glutamicum Δpyc. (C) C. glutamicum Δppc Δpyc. Volcano plots with significantly changed proteins [p < 0.05, |Log2(fold change)| ≥ 0.5] highlighted in red.
Only one protein encoded by cybD (cg0282) and which might be involved in stress response was found to be up-regulated in the C. glutamicum Δpck mutant (Table 3). In C. glutamicum Δpyc the enzyme quinolinate synthase A encoded by the nadA gene (cg1216) was up-regulated. This enzyme catalyzes the condensation of iminoaspartate with dihydroxyacetone phosphate to form quinolinate, and represents the second step of the de novo synthesis of NAD+. The latter starts from L-aspartate and up-regulation of this enzyme could be a cellular response to the limited availability of this amino acid following the inactivation of PCx and to ensure sufficient NAD+ supply. In addition, the putative transcriptional regulator (cg0787) and the 50S ribosomal protein L36 encoded by the rpmJ gene (cg2791) were found to be down-regulated in C. glutamicum Δpyc.
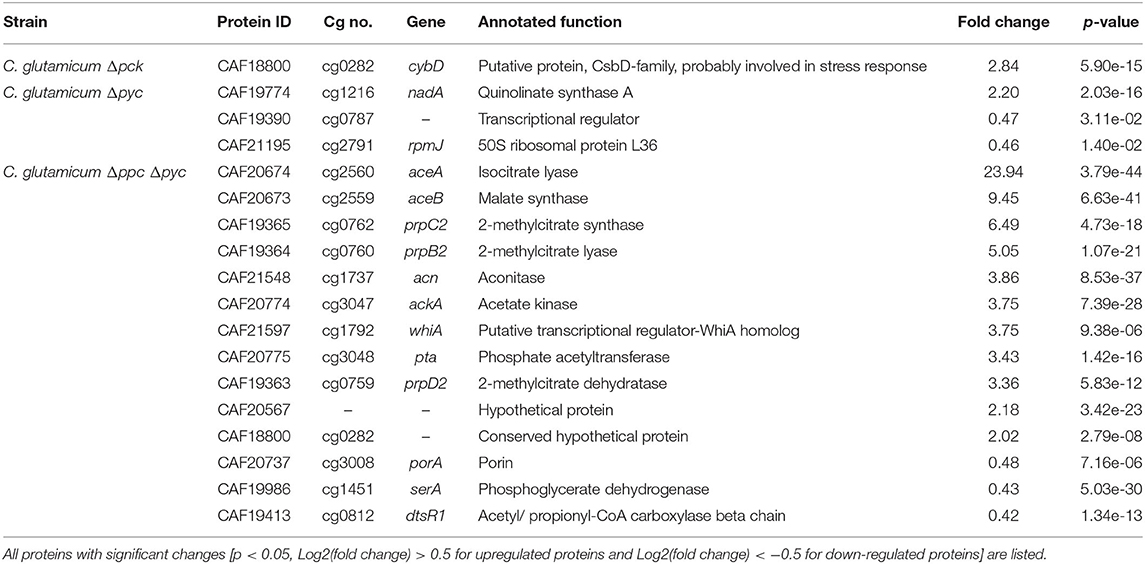
Table 3. Differentially expressed proteins of C. glutamicum anaplerotic deletion mutants in comparison to the wild-type strain.
Figure 4 shows intracellular and extracellular concentrations of selected metabolites. The L-aspartate pool is most closely correlated with the growth rate, i.e., the lowest concentrations were observed for all mutants with reduced growth rate. Apparently, its supply appears to be limiting the growth as the restored growth rate of the Δpck ΔmalE mutant in comparison to the single deletion strain Δpck goes hand in hand with increased L-aspartate supply. The concentration pattern of L-aspartate seems to reflect itself in the L-homoserine pool, which is derived from the former through three intermediate reaction steps, consuming two NAD(P)H molecules and one ATP molecule. In contradistinction to L-aspartate, however, L-homoserine is clearly higher concentrated in the Δpck mutant. Since the reaction sequence between both intermediates is redox-dependent, one may be tempted to attribute this observation to redox balancing. The biosynthesis of L-glutamate from α-ketoglutarate and of L-proline from L-glutamate are also redox-dependent. Conspicuously, both pools are also higher concentrated in this strain (Figure 4).
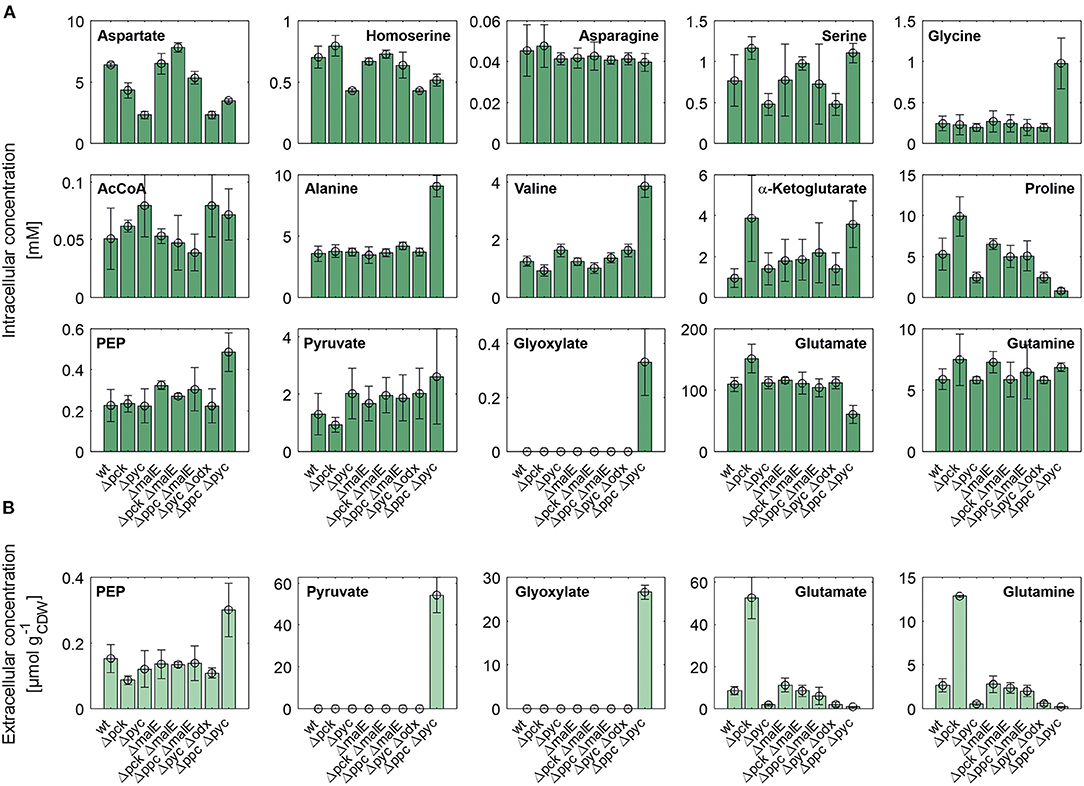
Figure 4. Intracellular (A) and specific extracellular (B) concentrations of selected metabolites in C. glutamicum wild type and anaplerotic deletion mutants cultivated under controlled bioreactor conditions in CGXII medium with D-glucose as sole carbon and energy source. For gene to protein references see Figure 2.
Moreover, we analyzed intracellular levels of NADPH and NADH alongside their oxidized analogs. No significant difference was detected in the reduced forms of these co-factors (data not shown). However, the mean of relative standard deviation over all mutants for NADH and NADPH concentrations amounts to 46% and 48%, respectively. This high technical error, impeding a precise quantification, cannot be traced back to inaccuracies in pipetting or BV concentration measurements since these factors also apply to all other metabolite quantifications in the same sample. Since the mean relative standard deviation for other metabolite pools was below 10% these factors appear to have been controlled quite well. The most likely reason for the observed coefficients of variation is metabolite instability. The redox equivalents are known to be quite sensitive to oxidation and degradation (Siegel et al., 2014). Slightly different temperature time courses, residual enzymatic activity in metabolite extracts and oxidation most likely account for the observed differences. Therefore, no accurate conclusion about the redox state in each mutant could be drawn. Nonetheless, the fact that the removal of a redox-dependent enzyme like ME restores the growth rate of the C. glutamicum Δpck mutant suggests an involvement of the redox balance mediating some of the observed changes in metabolite pools.
Glyoxylate Shunt Enables Growth of C. glutamicum Δppc Δpyc on D-Glucose as Sole Carbon and Energy Source
Whole-genome sequencing of evolved C. glutamicum Δppc Δpyc confirmed the absence of genes ppc and pyc across the cell population (Table 4), excluding any growth contamination effect. Two insertions and some SNPs (see Supplementary Table 6) were detected in the coding region for ICD. Moreover, ICL (cg2560), MS (cg2559), and cis-aconitase (ACN, cg1737) are highly up-regulated in C. glutamicum Δppc Δpyc (Figure 3 and Table 3) and only in this mutant intracellular and extracellular accumulation of glyoxylate was detected (Figure 4).
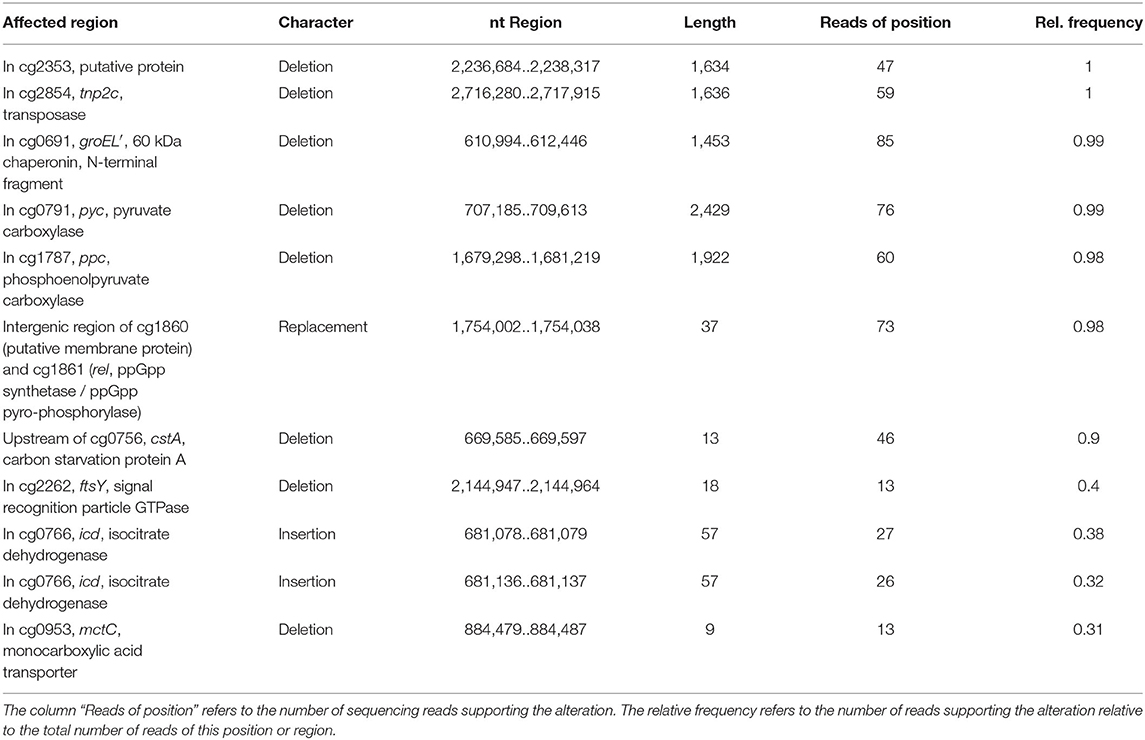
Table 4. Structural variants identified in the C. glutamicum Δppc Δpyc mutant adapted to D-glucose as sole carbon source in comparison to C. glutamicum WT as reference.
These findings are in agreement with the study of Schwentner et al. and point to a redirection of carbon flux in our evolved strain from the oxidative decarboxylation branch of the TCA cycle into the glyoxylate shunt (Schwentner et al., 2018). In the absence of C3-carboxylation activity at the anaplerotic node, accumulation of the substrate pools phosphoenolpyruvate and pyruvate can be expected. Indeed, phosphoenolpyruvate was significantly higher concentrated in the evolved Δppc Δpyc strain, while the intracellular pyruvate pool remained unaffected (Figure 4). However, metabolite levels of L-alanine and L-valine, which are directly derived from pyruvate, were strongly increased and this finding is also consistent with previous data (Schwentner et al., 2018). The lack of statistical significance of strain differences in the pyruvate pool is most likely due to higher technical errors during metabolite quantification. It is well-established that the accurate quantification of organic acids in cell extracts represents a veritable challenge (Zimmermann et al., 2014).
Moreover, the metabolite pool of L-glycine shows one of the most significant concentration changes, clearly distinguishing the evolved Δppc Δpyc strain. L-glycine, in turn, is derived from L-serine, which also showed an increased concentration (Figure 4). It appears that the missing carboxylation rate cannot be matched by the pyruvate dehydrogenase activity in the Δppc Δpyc mutant for substrate pools like phosphoenolpyruvate as well as amino acids derived from the lower glycolytic intermediates appear to accumulate intracellularly. This would also explain why the phosphoglycerate dehydrogenase encoded by serA (cg1451) was found to be significantly down-regulated in this mutant (Table 3). The enzyme catalyzes the first step in the biosynthesis of L-glycine, L-serine and L-cysteine and its down-regulation could be the cellular response to the higher availability of 3-phosphoglycerate.
In terms of glyoxylate shunt regulation, Wendisch et al. suggested that the carbon-source dependent regulation of this pathway is mediated by intracellular acetyl-CoA concentrations (Wendisch et al., 1997). However, intracellular acetyl-CoA concentrations did not vary significantly with respect to strain background (Figure 4), and therefore this hypothesis could not be validated with the made intracellular measurements. Unfortunately, acetyl-CoA measurements are notoriously error-prone due to the high instability of thioesthers. Though taking strenuous efforts to keep the sample below−20°C and immediate analysis after extraction, we still obtained a highly variable signal within each treatment group.
The corresponding genes aceA and aceB of ICL and MS, respectively, are thought to be repressed by the regulator protein RamB (cg0444) under glycolytic conditions (Auchter et al., 2011). Moreover, it has been established that RamA (cg2831) acts as transcriptional activator of both genes when acetate is the carbon source. However, no significant change in the abundances of RamA and RamB were found in Δppc Δpyc mutant compared to the wild type. The fact that a ΔramA mutant is not able to grow on acetate suggests that RamA is strictly required as transcriptional activator for increased expression of at least one of the essential enzymes of acetate assimilation, which are acetate kinase (AK) encoded by ackA (cg3047), phosphotransacetylase (PTA) encoded by pta (cg3048), ICL and MS (Cramer and Eikmanns, 2007). Indeed, AK and PTA are also significantly up-regulated in the Δppc Δpyc mutant (Table 3).
Most interestingly, this strain also shows an up-regulation of the three enzymes of the methylcitrate cycle in C. glutamicum (Claes et al., 2002), namely 2-methylcitrate synthase (PrpC2) encoded by prpC2 (cg0762), 2-methylcitrate dehydratase (PrpD2) encoded by prpD2 (cg0759) and 2-methylcitrate lyase (PrpB2) encoded by prpB2 (cg0760) (Table 3). Together with the activities of AK and PTA this cycle is known to be the predominant route for the degradation of propionate into pyruvate and succinate (Figure 1). In the presence of propionate all three genes are transcriptionally activated by the regulator PrpR (Plassmeier et al., 2012). Under the applied D-glucose conditions, however, no change in the PrpR abundance was detected. Moreover, it was found that the prpDBC2 operon is transcriptionally activated by RamA, but not affected by RamB (Auchter et al., 2011). This makes the conclusion compelling that the concentration of at least one, still unknown, metabolite effector binding to RamA was altered, leading to the activation of the aforementioned genes. Following the strong up-regulation of the prpDBC2 cluster in combination with the glyoxylate shunt it might be speculated that the surplus of pyruvate (from PEPCx and PCx inactivation) and succinate (from ICL activity) is channeled into the methylcitrate cycle, operating in the reverse direction. This route would represent a by-pass of the TCA cycle reactions succinate: quinone oxidoreductase (SQO), fumarase (FUM) and malate: quinone oxidoreductase (MQO) to provide oxaloacetate as biomass precursor (Figure 1). From a thermodynamic point of view, the PrpB2 reaction in direction of 2-methylisocitrate is favored (ΔrG′0 = −9.3 kJ/mol) in comparison to the SQO reaction leading to fumarate (ΔrG′0 = 14.5 kJ/mol). However, the potentially last step of the methylcitrate cycle catalyzed by PrpC2 is thermodynamically very unfavorable (ΔrG′0 = 39.2 kJ/mol), but might still work under in vivo conditions due to very low concentrations of oxaloacetate (<100 nM of lower detection limit of applied LC-QqQ MS). Indeed, Plassmeier et al. showed that the prpDBC2 operon is also expressed under normal cell growth conditions in wild-type C. glutamicum, independent of the application of propionate as carbon source (Plassmeier et al., 2007). Moreover, a high up-regulation of the prpDBC2 operon was found in a C. glutamicum strain engineered for overproduction of L-isoleucine (Ma et al., 2018). Here it was speculated that this up-regulation was due to a high intracellular formation of propionyl-CoA, which was derived from the intermediate 2-ketobutyrate of the L-isoleucine biosynthesis. The resulting propionyl-CoA was then further converted into a polyhydroxyalkanoate by heterologous expression of the phaCAB gene cluster. In our case, however, we can exclude propionyl-CoA formation from 2-ketobutyrate because L-aspartate is limiting. Additionally, it remains open what happens with propionyl-CoA as the second product of the PrpC2 reaction when running in reverse direction (Figure 1). Therefore, further investigations on the interplay between the different pathways are required to substantiate our hypothesis.
Moreover, we found a SNP in the intergenic region between cg3314 and cg3315, four nucleotides upstream from the translation start of MalR (malR, cg3315). This protein has been originally identified as repressor of the malE gene in the study of Krause et al. (2012) and was recently reported to bind to several other loci (Hünnefeld et al., 2019). Since the mutation occurred outside the coding sequence of this regulator, only expression changes of the gene are able to affect metabolism. Unfortunately, the specific protein data for MalR was not very accurate (p > 0.5) to enable any conclusion, but ME appeared to be down-regulated in the evolved Δppc Δpyc strain when grown on D-glucose as sole carbon and energy source (0.54-fold, p < 4.73e-10). Since purified ME of C. glutamicum was shown to carboxylate pyruvate in in vitro assays with an apparent Km constant of 13.8 mM (Gourdon et al., 2000) it was speculated that ME serves as anaplerotic enzyme under circumstances when PEPCx and PCx activities are absent and pyruvate availability is still ensured through running glycolysis. In our case, however, the amount of ME was significantly reduced with respect to the wild type and its intracellular substrate pool of pyruvate is not significantly altered and well below the Km value (Figure 4A). Therefore, it can be excluded that ME catalyzes a flux compensating for the missing PCx and PEPCx activity in the evolved Δppc Δpyc strain.
Finally, a deletion was detected in the mctC gene (cg0953), which has been shown to be essential in C. glutamicum for the uptake of pyruvate (Jolkver et al., 2009). Based on this, it can be hypothesized that the genetic alteration in this transporter may lead to a decreased uptake of pyruvate from the medium, which would explain the extracellular accumulation of pyruvate exclusively found in the Δppc Δpyc mutant (Figure 4B).
Conclusions
We characterized eight different mutant strains of C. glutamicum carrying single or double deletions in five anaplerotic enzymes. The metabolism and adaptation of each mutant during growth under defined D-glucose conditions in lab-scale bioreactors was investigated by quantification of its extracellular rates, central metabolic intermediates by LC-QqQ MS and proteome by SWATH acquisition using a LC-QqTOF MS platform.
In comparison to the wild type the four deletion mutants C. glutamiucm Δpyc, C. glutamiucm Δpyc Δodx, C. glutamiucm Δppc Δpyc, and C. glutamiucm Δpck showed lowered specific growth rates and D-glucose uptake rates, underlining the importance of PCx and PEPCk activity for a balanced carbon and energy flux at the anaplerotic node.
Detailed analyses of the C. glutamicum Δppc Δpyc mutant evolved to grow on D-glucose revealed the strong up-regulation of a few genes that are under control of the transcriptional regulator RamA. Higher protein abundances were found for the enzymes of the glyxoylate shunt as well as the methylcitrate cycle under solely glycolytic conditions, under which condition the corresponding genes were thought to be repressed. It is inferred that this adaptation must be due to a changed concentration of a metabolite affecting the activity of regulator protein RamA, brought about by a concentration change of the former. This metabolite pool, however, could not be identified from the set of metabolites from glycolysis, TCA cycle and amino acids that was targeted in this study. Since the encoding genes of the altered proteins represent just a small subset of the RamA regulon, it can be concluded that the binding affinities of RamA to all target genes may be regulated by various effector metabolites and not a single one. Further research, especially based on untargeted metabolomics, will be needed to identify the metabolite regulator(s) active on RamA under D-glucose conditions.
In conjunction with the intracellular metabolomics data we generally conclude that C. glutamicum is able to compensate missing carboxylation activities of PEPCx and PCx by activation of the glyoxylate shunt, potentially in combination with the methylcitrate cycle to channel the higher levels of PEP/ pyruvate as well as succinate and thereby also contributing to replenish oxaloacetate. To further substantiate the hypothesis on the reverse operation of the methylcitrate cycle isotope-based metabolic flux analyses with the evolved C. glutamicum Δppc Δpyc strain could be conducted in further studies.
Finally, the reproducible effect of bicarbonate formation under excess D-glucose conditions and its consequences for carbon balancing also requires further investigations. For example, a combination of batch experiments under variation of pH and gassing rate as well as thorough modeling of the resulting CO2-dynamics in the gas and liquid phase could be an approach for a more accurate determination of CO2-formation rates.
Data Availability Statement
The mass spectrometry proteomics data have been deposited to the ProteomeXchange Consortium via the PRIDE (Perez-Riverol et al., 2019) partner repository with the dataset identifier PXD022622. The reads data of the Δppc Δpyc strain are available in NCBI's SRA via BioProject ID PRJNA678589. The other datasets generated for this study are available on request to the corresponding author.
Author Contributions
JK and SN designed the research. JK performed data analysis and wrote the manuscript. JK and MP performed the bioreactor cultivations of C. glutamicum. BK lysed and digested all samples and performed the LC-MS/MS measurements. JL constructed the C. glutamicum double deletion mutants used in this manuscript. TP performed the whole-genome sequencing. SN, TP, and WW revised the manuscript. SN, RT, and BB supervised the research. All authors have given approval to the final version of the manuscript.
Funding
This work was partly funded by the Deutsche Forschungsgemeinschaft (priority program SPP2170, Grant No. 427904493).
Conflict of Interest
The authors declare that the research was conducted in the absence of any commercial or financial relationships that could be construed as a potential conflict of interest.
Acknowledgments
We thank Lothar Eggeling for critical comments on the manuscript.
Supplementary Material
The Supplementary Material for this article can be found online at: https://www.frontiersin.org/articles/10.3389/fbioe.2020.602936/full#supplementary-material
References
Auchter, M., Cramer, A., Hüser, A., Rückert, C., Emer, D., Schwarz, P., et al. (2011). RamA and RamB are global transcriptional regulators in Corynebacterium glutamicum and control genes for enzymes of the central metabolism. J. Biotechnol. 154, 126–139. doi: 10.1016/j.jbiotec.2010.07.001
Baumgart, M., Unthan, S., Kloß, R., Radek, A., Polen, T., Tenhaef, N., et al. (2018). Corynebacterium glutamicum chassis C1*: building and testing a novel platform host for synthetic biology and industrial biotechnology. ACS Synth. Biol. 7, 132–144. doi: 10.1021/acssynbio.7b00261
Baumgart, M., Unthan, S., Rückert, C., Sivalingam, J., Grünberger, A., Kalinowski, J., et al. (2013). Construction of a prophage-free variant of Corynebacterium glutamicum ATCC 13032 for use as a platform strain for basic research and industrial biotechnology. Appl. Environ. Microbiol. 79, 6006–6015. doi: 10.1128/AEM.01634-13
Becker, J., Rohles, C. M., and Wittmann, C. (2018). Metabolically engineered Corynebacterium glutamicum for bio-based production of chemicals, fuels, materials, and healthcare products. Metab. Eng. 50, 122–141. doi: 10.1016/j.ymben.2018.07.008
Blombach, B., Buchholz, J., Busche, T., Kalinowski, J., and Takors, R. (2013). Impact of different CO2/ levels on metabolism and regulation in Corynebacterium glutamicum. J. Biotechnol. 168, 331–340. doi: 10.1016/j.jbiotec.2013.10.005
Blombach, B., Riester, T., Wieschalka, S., Ziert, C., Youn, J. W., Wendisch, V. F., et al. (2011). Corynebacterium glutamicum tailored for efficient isobutanol production. Appl. Environ. Microbiol. 77, 3300–3310. doi: 10.1128/AEM.02972-10
Buchholz, J., Graf, M., Blombach, B., and Takors, R. (2014). Improving the carbon balance of fermentations by total carbon analyses. Biochem. Eng. J. 90, 162–169. doi: 10.1016/j.bej.2014.06.007
Claes, W. A., Pühler, A., and Kalinowski, J. (2002). Identification of two prpDBC gene clusters in Corynebacterium glutamicum and their involvement in propionate degradation via the 2-methylcitrate cycle. J. Bacteriol. 184, 2728–2739. doi: 10.1128/JB.184.10.2728-2739.2002
Cocaign-Bousquet, M., Guyonvarch, A., and Lindley, N. D. (1996). Growth rate-dependent modulation of carbon flux through central metabolism and the kinetic consequences for glucose-limited chemostat cultures of Corynebacterium glutamicum. Appl. Environ. Microbiol. 62, 429–436. doi: 10.1128/AEM.62.2.429-436.1996
Cramer, A., and Eikmanns, B. J. (2007). RamA, the transcriptional regulator of acetate metabolism in Corynebacterium glutamicum, is subject to negative autoregulation. J. Mol. Microbiol. Biotechnol. 12, 51–59. doi: 10.1159/000096459
Dalman, T., Dornemann, T., Juhnke, E., Weitzel, M., Wiechert, W., Nöh, K., et al. (2013). Cloud MapReduce for monte carlo bootstrap applied to metabolic flux analysis. Future Gener. Comp. Sy. 29, 582–590. doi: 10.1016/j.future.2011.10.007
Eikmanns, B. J., Thum-Schmitz, N., Eggeling, L., Lüdtke, K.-U., and Sahm, H. (1994). Nucleotide sequence, expression and transcriptional analysis of the Corynebacterium glutamicum gltA gene encoding citrate synthase. Microbiology 140, 1817–1828. doi: 10.1099/13500872-140-8-1817
Flamholz, A., Noor, E., Bar-Even, A., and Milo, R. (2012). eQuilibrator–the biochemical thermodynamics calculator. Nucleic Acids Res. 40, D770–775. doi: 10.1093/nar/gkr874
Fränzel, B., Fischer, F., Trötschel, C., Poetsch, A., and Wolters, D. (2009). The two-phase partitioning system–a powerful technique to purify integral membrane proteins of Corynebacterium glutamicum for quantitative shotgun analysis. Proteomics 9, 2263–2272. doi: 10.1002/pmic.200800766
Gourdon, P., Baucher, M. F., Lindley, N. D., and Guyonvarch, A. (2000). Cloning of the malic enzyme gene from Corynebacterium glutamicum and role of the enzyme in lactate metabolism. Appl. Environ. Microbiol. 66, 2981–2987. doi: 10.1128/AEM.66.7.2981-2987.2000
Hünnefeld, M., Persicke, M., Kalinowski, J., and Frunzke, J. (2019). The MarR-type regulator MalR is involved in stress-responsive cell envelope remodeling in Corynebacterium glutamicum. Front. Microbiol. 10:1039. doi: 10.3389/fmicb.2019.01039
Jolkver, E., Emer, D., Ballan, S., Kramer, R., Eikmanns, B. J., and Marin, K. (2009). Identification and characterization of a bacterial transport system for the uptake of pyruvate, propionate, and acetate in Corynebacterium glutamicum. J. Bacteriol. 191, 940–948. doi: 10.1128/JB.01155-08
Kappelmann, J., Wiechert, W., and Noack, S. (2016). Cutting the gordian knot: identifiability of anaplerotic reactions in Corynebacterium glutamicum by means of 13C-metabolic flux analysis. Biotechnol. Bioeng. 113, 661–674. doi: 10.1002/bit.25833
Klaffl, S., and Eikmanns, B. J. (2010). Genetic and functional analysis of the soluble oxaloacetate decarboxylase from Corynebacterium glutamicum. J. Bacteriol. 192, 2604–2612. doi: 10.1128/JB.01678-09
Kogure, T., and Inui, M. (2018). Recent advances in metabolic engineering of Corynebacterium glutamicum for bioproduction of value-added aromatic chemicals and natural products. Appl. Microbiol. Biotechnol. 102, 8685–8705. doi: 10.1007/s00253-018-9289-6
Kranz, A., Vogel, A., Degner, U., Kiefler, I., Bott, M., Usadel, B., et al. (2017). High precision genome sequencing of engineered Gluconobacter oxydans 621H by combining long nanopore and short accurate illumina reads. J. Biotechnol. 258, 197–205. doi: 10.1016/j.jbiotec.2017.04.016
Krause, J. P., Polen, T., Youn, J. W., Emer, D., Eikmanns, B. J., and Wendisch, V. F. (2012). Regulation of the malic enzyme gene malE by the transcriptional regulator MalR in Corynebacterium glutamicum. J. Biotechnol. 159, 204–215. doi: 10.1016/j.jbiotec.2012.01.003
Küberl, A., Franzel, B., Eggeling, L., Polen, T., Wolters, D. A., and Bott, M. (2014). Pupylated proteins in Corynebacterium glutamicum revealed by MudPIT analysis. Proteomics 14, 1531–1542. doi: 10.1002/pmic.201300531
Lee, J. H., and Wendisch, V. F. (2017). Production of amino acids - genetic and metabolic engineering approaches. Bioresour. Technol. 245, 1575–1587. doi: 10.1016/j.biortech.2017.05.065
Ma, W. J., Wang, J. L., Li, Y., Yin, L. H., and Wang, X. Y. (2018). Poly(3-hydroxybutyrate-co-3-hydroxyvalerate) co-produced with L-isoleucine in Corynebacterium glutamicum WM001. Microb. Cell Fact 17:93. doi: 10.1186/s12934-018-0942-7
Marx, A., De Graaf, A. A., Wiechert, W., Eggeling, L., and Sahm, H. (1996). Determination of the fluxes in the central metabolism of Corynebacterium glutamicum by nuclear magnetic resonance spectroscopy combined with metabolite balancing. Biotechnol. Bioeng. 49, 111–129. doi: 10.1002/(SICI)1097-0290(19960120)49:2<111::AID-BIT1>3.0.CO;2-T
Noack, S., Voges, R., Gätgens, J., and Wiechert, W. (2017). The linkage between nutrient supply, intracellular enzyme abundances and bacterial growth: New evidences from the central carbon metabolism of Corynebacterium glutamicum. J. Biotechnol. 258, 13–24. doi: 10.1016/j.jbiotec.2017.06.407
Paczia, N., Nilgen, A., Lehmann, T., Gätgens, J., Wiechert, W., and Noack, S. (2012). Extensive exometabolome analysis reveals extended overflow metabolism in various microorganisms. Microb. Cell Fact 11:122. doi: 10.1186/1475-2859-11-122
Perez-Riverol, Y., Csordas, A., Bai, J., Bernal-Llinares, M., Hewapathirana, S., Kundu, D. J., et al. (2019). The PRIDE database and related tools and resources in 2019: improving support for quantification data. Nucleic Acids Res. 47, D442–D450. doi: 10.1093/nar/gky1106
Petersen, S., Mack, C., De Graaf, A. A., Riedel, C., Eikmanns, B. J., and Sahm, H. (2001). Metabolic consequences of altered phosphoenolpyruvate carboxykinase activity in Corynebacterium glutamicum reveal anaplerotic regulation mechanisms in vivo. Metab. Eng. 3, 344–361. doi: 10.1006/mben.2001.0198
Peters-Wendisch, P. G., Eikmanns, B. J., Thierbach, G., Bachmann, B., and Sahm, H. (1993). Phosphoenolpyruvate carboxylase in Corynebacterium glutamicum is dispensable for growth and lysine production. FEMS Microbiol. Lett. 114, 243–243.
Peters-Wendisch, P. G., Kreutzer, C., Kalinowski, J., Pátek, M., Sahm, H., and Eikmanns, B. J. (1998). Pyruvate carboxylase from Corynebacterium glutamicum: characterization, expression and inactivation of the pyc gene. Microbiology 144, 915–927. doi: 10.1099/00221287-144-4-915
Peters-Wendisch, P. G., Wendisch, V. F., Degraaf, A. A., Eikmanns, B. J., and Sahm, H. (1996). C-3-carboxylation as an anaplerotic reaction in phosphoenolpyruvate carboxylase-deficient Corynebacterium glutamicum. Arch. Microbiol. 165, 387–396. doi: 10.1007/s002030050342
Plassmeier, J., Barsch, A., Persicke, M., Niehaus, K., and Kalinowski, J. (2007). Investigation of central carbon metabolism and the 2-methylcitrate cycle in Corynebacterium glutamicum by metabolic profiling using gas chromatography-mass spectrometry. J. Biotechnol. 130, 354–363. doi: 10.1016/j.jbiotec.2007.04.026
Plassmeier, J., Persicke, M., Puhler, A., Sterthoff, C., Ruckert, C., and Kalinowski, J. (2012). Molecular characterization of PrpR, the transcriptional activator of propionate catabolism in Corynebacterium glutamicum. J. Biotechnol. 159, 1–11. doi: 10.1016/j.jbiotec.2011.09.009
Riedel, C., Rittmann, D., Dangel, P., Mockel, B., Petersen, S., Sahm, H., et al. (2001). Characterization of the phosphoenolpyruvate carboxykinase gene from Corynebacterium glutamicum and significance of the enzyme for growth and amino acid production. J. Mol. Microbiol. Biotechnol. 3, 573–583.
Schwentner, A., Feith, A., Münch, E., Busche, T., Rückert, C., Kalinowski, J., et al. (2018). Metabolic engineering to guide evolution – Creating a novel mode for L-valine production with Corynebacterium glutamicum. Metab. Eng. 47, 31–41. doi: 10.1016/j.ymben.2018.02.015
Siegel, D., Permentier, H., Reijngoud, D. J., and Bischoff, R. (2014). Chemical and technical challenges in the analysis of central carbon metabolites by liquid-chromatography mass spectrometry. J. Chromatogr. B Analyt Technol. Biomed. Life Sci. 966, 21–33. doi: 10.1016/j.jchromb.2013.11.022
Stella, R. G., Wiechert, J., Noack, S., and Frunzke, J. (2019). Evolutionary engineering of Corynebacterium glutamicum. Biotechnol. J. 14:e1800444. doi: 10.1002/biot.201800444
Tillack, J., Paczia, N., Noh, K., Wiechert, W., and Noack, S. (2012). Error propagation analysis for quantitative intracellular metabolomics. Metabolites 2, 1012–1030. doi: 10.3390/metabo2041012
Trötschel, C., Albaum, S. P., and Poetsch, A. (2013). Proteome turnover in bacteria: current status for Corynebacterium glutamicum and related bacteria. Microb. Biotechnol. 6, 708–719. doi: 10.1111/1751-7915.12035
Unthan, S., Baumgart, M., Radek, A., Herbst, M., Siebert, D., Brühl, N., et al. (2015). Chassis organism from Corynebacterium glutamicum – a top-down approach to identify and delete irrelevant gene clusters. Biotechnol. J. 10, 290–301. doi: 10.1002/biot.201400041
Unthan, S., Grünberger, A., Van Ooyen, J., Gätgens, J., Heinrich, J., Paczia, N., et al. (2014). Beyond growth rate 0.6: What drives Corynebacterium glutamicum to higher growth rates in defined medium. Biotechnol. Bioeng. 111, 359–371. doi: 10.1002/bit.25103
Uy, D., Delaunay, S., Engasser, J. M., and Goergen, J. L. (1999). A method for the determination of pyruvate carboxylase activity during the glutamic acid fermentation with Corynebacterium glutamicum. J. Microbiol. Methods 39, 91–96. doi: 10.1016/S0167-7012(99)00104-9
Van Der Rest, M. E., Lange, C., and Molenaar, D. (1999). A heat shock following electroporation induces highly efficient transformation of Corynebacterium glutamicum with xenogeneic plasmid DNA. Appl. Microb. Biotechnol. 52, 541–545. doi: 10.1007/s002530051557
Voges, R., Corsten, S., Wiechert, W., and Noack, S. (2015). Absolute quantification of Corynebacterium glutamicum glycolytic and anaplerotic enzymes by QconCAT. J. Proteomics 113, 366–377. doi: 10.1016/j.jprot.2014.10.008
Voges, R., and Noack, S. (2012). Quantification of proteome dynamics in Corynebacterium glutamicum by 15N-labeling and selected reaction monitoring. J. Proteomics 75, 2660–2669. doi: 10.1016/j.jprot.2012.03.020
Wendisch, V. F., Spies, M., Reinscheid, D. J., Schnicke, S., Sahm, H., and Eikmanns, B. J. (1997). Regulation of acetate metabolism in Corynebacterium glutamicum: transcriptional control of the isocitrate lyase and malate synthase genes. Arch. Microbiol. 168, 262–269. doi: 10.1007/s002030050497
Zelle, R. M., Harrison, J. C., Pronk, J. T., and Van Maris, A. J. (2011). Anaplerotic role for cytosolic malic enzyme in engineered Saccharomyces cerevisiae strains. Appl. Environ. Microbiol. 77, 732–738. doi: 10.1128/AEM.02132-10
Keywords: Corynebacterium glutamicum, anaplerosis, phosphoenolpyruvate carboxylase, pyruvate carboxylase, phosphoenolpyruvate carboxykinase, oxaloacetate decarboxylase, malic enzyme, methylcitrate cycle
Citation: Kappelmann J, Klein B, Papenfuß M, Lange J, Blombach B, Takors R, Wiechert W, Polen T and Noack S (2021) Comprehensive Analysis of C. glutamicum Anaplerotic Deletion Mutants Under Defined D-Glucose Conditions. Front. Bioeng. Biotechnol. 8:602936. doi: 10.3389/fbioe.2020.602936
Received: 04 September 2020; Accepted: 17 December 2020;
Published: 20 January 2021.
Edited by:
Yu Wang, Chinese Academy of Sciences, ChinaReviewed by:
Guoqiang Xu, Jiangnan University, ChinaChen Yang, Chinese Academy of Sciences (CAS), China
Copyright © 2021 Kappelmann, Klein, Papenfuß, Lange, Blombach, Takors, Wiechert, Polen and Noack. This is an open-access article distributed under the terms of the Creative Commons Attribution License (CC BY). The use, distribution or reproduction in other forums is permitted, provided the original author(s) and the copyright owner(s) are credited and that the original publication in this journal is cited, in accordance with accepted academic practice. No use, distribution or reproduction is permitted which does not comply with these terms.
*Correspondence: Stephan Noack, cy5ub2Fja0Bmei1qdWVsaWNoLmRl