 Tao He1,2†
 Chaozhong Xu
- 1Jiangsu Co-Innovation Center of Efficient Processing and Utilization of Forest Resources, College of Chemical Engineering, Nanjing Forestry University, Nanjing, China
- 2Jiangsu Key Lab of Biomass-based Green Fuels and Chemicals, Nanjing, China
Large amounts of xylose cannot be efficiently metabolized and fermented due to strain limitations in lignocellulosic biorefinery. The conversion of xylose into high value chemicals can help to reduce the cost of commercialization. Therefore, xylonic acid with potential value in the construction industry offers a valuable alternative for xylose biorefinery. However, low productivity is the main challenge for xylonic acid fermentation. This study investigated the effect of three reaction parameters (agitation, aeration, and biomass concentration) on xylose acid production and optimized the key process parameters using response surface methodology The second order polynomial model was able to fit the experimental data by using multiple regression analysis. The maximum specific productivity was achieved with a value of 6.64 ± 0.20 g gx−1 h−1 at the optimal process parameters (agitation speed 728 rpm, aeration rate 7 L min−1, and biomass concentration 1.11 g L−1). These results may help to improve the production efficiency during xylose acid biotransformation from xylose.
Introduction
Xylose, which constitutes about 25% of the total biomass components, is unable to be converted in the lignocellulosic biorefinery process due to the limitation of microorganisms (Zaldivar et al., 2001). Therefore, the utilization of xylose is one of the key factors affecting the commercial production of lignocellulose (Nogue and Karhumaa, 2015). Currently, the bioconversion of xylose to xylonic acid is considered as a promising pathway and has gained much attention (Zhou et al., 2015, Zhou et al., 2017). Xylonic acid (XA), a bio-based chemical of great interest in recent years, is a non-toxic, non-volatile, non-corrosive, water-soluble organic acid. This aldonic acid compound has a similar structure and properties to gluconic acid, and shows a wide variety of applications in various fields. XA can be used as a dispersant to improve the dispersibility of concrete, which can effectively reduce the amount of concrete. In addition, XA has been also used as a raw material for chelating agent, antibiotic, polyamide, hydrogel modifier and 1,2,4-butanetriol precursor (Gupta et al., 2001; Deppenmeier et al., 2002; Chun et al., 2006).
Compared to other bacteria such as Saccharomyces cerevisiae and Escherichia coli, Gluconobacter oxydans has been the most productive in producing XA (Toivari et al., 2012a). G. oxydans is known for its rapid but incomplete oxidation of sugars and sugar alcohols as an obligate aerobic bacterium with a wide range of industrial applications (Toivari et al., 2012b; Zhang et al., 2016a). XA is derived primarily from the further oxidation of xylose, relying on xylose dehydrogenase on the cell membrane of G. oxydans (Mientus et al., 2017). Then, XA is recovered from the culture broth by ion exchange or precipitation methods for downstream processing (Liu et al., 2012; Cao and Xu, 2019). Although G. oxydans shows great potential for XA fermentation, low production efficiency is the main challenge. For bioengineering, an important goal is to achieve high productivity in order to ensure an adequate supply of valued product and to reduce manufacturing costs (Handlogten et al., 2018). Therefore, improving the production efficiency of G. oxydans oxidized xylose would provide new options for large-scale production of XA.
For aerobic bacteria, the inability to utilize sufficient oxygen is the main cause of low productivity. Biochemically speaking, the xylose biocatalysis by G. oxydans is a closely coupled bio-oxidation reaction of cellular respiration and dehydrogenation that relies heavily on oxygen supply (Hoelscher et al., 2009). However, the solubility of oxygen in the broth is less than 0.21 mmol L−1, and the metabolism of bacterial cells is significantly constrained (Hua et al., 2020), leading to a decrease in the catalytic performance of the biological process (Garcia-Ochoa and Gomez, 2009). Therefore, the level of oxygen utilization is a key factor in the final production efficiency.
Often, oxygen utilization is related to the interaction between the oxygen transfer and the oxygen uptake. During aerobic biological reactions, oxygen transfer is the process by which oxygen is transferred from the gas into the liquid phase to come into contact with the cells, while oxygen uptake is the process by which oxygen is utilized by the cells (Garcia-Ochoa et al., 2010). Theoretically, increasing the biomass concentration would enhance the level of oxygen uptake for aerobic biological reactions, but it would break the relationship between oxygen uptake and oxygen transfer. This leads to a decrease in the dissolved oxygen concentration in the broth and thus reduces the catalytic performance of the bacteria, which ultimately leads to a decrease in productivity. Therefore, it is necessary to adjust the appropriate level of oxygen transfer (by changing the agitation and aeration) and oxygen uptake (by changing the biomass concentration) to increase productivity.
To address these issues, this study attempts to use a response surface approach to improve the productivity of xylonic acid fermentation. Response surfaces were used to understand the interactions of aeration, agitation, and biomass concentration on the productivity of xylonic acid production from whole-cell catalytic xylose by G. oxydans using a statistical model. Optimized fermentation conditions were designed to address the low productivity limitations that exist in xylonic acid fermentation. These optimized conditions will provide guidance for the design of xylonic acid production process.
Materials and Methods
Microorganism
G.oxydans NL71 purchased from Nanjing Forestry University of China, was stored on sorbitol agar (sorbitol 50 g L−1, yeast extract 5 g L−1, agar 15 g L−1) at 4°C. The inoculum of G. oxydans NL71 was prepared in 250 ml shake flasks containing 50 ml of medium (sorbitol 50 g L−1, yeast extract 5 g L−1) and incubated at 220 rpm and 30°C for 24 h. The proliferation medium was centrifuged at 6,000 g for 5–10 min to collect cells, and the centrifuged cells were transferred to the fermentation medium on an ultra-clean bench (Zhou et al., 2015).
Whole-Cell Catalysis
The fermentation equipment consists of a stirred tank bioreactor, motor, and control system. Whole-cell catalysis is performed in a 5 L stirred tank reactor containing 3 L of production medium. The biotransformation medium: 5.0 g L−1 yeast extract, 0.5 g L−1 MgSO4, 1.0 g L−1 KH2PO4, 2.0 g L−1 K2HPO4 and 5.0 g L−1 (NH4)2SO4 (Zhou et al., 2017). The temperature was maintained at 30°C throughout the fermentation process. The pH of the medium was monitored online by means of electrodes connected to the pH meter. The peristaltic pump was controlled to add 10% NaOH to maintain the pH at 5.5 automatically (Zhou et al., 2015; Zhang et al., 2017; Zhou et al., 2017).
Experimental Design and Statistical Optimization
A three-factor, three-level Box-Behnken experiment design was used, with specific productivity values (Px) as response values to understand the combined effect of agitation (A), aeration (B) and biomass concentration (C). Table 1 shows the range of agitation, aeration, and biomass concentration of the RSM.

TABLE 1. Experimental range of variables studied during designing of experiments.
Fifteen experiments (Table 2) were designed using Design-Expert 12, and the fermentation results were finally subjected to multiple regression analysis to obtain the optimal fermentation conditions. A second-order polynomial equation was designed to express the predicted response (Y) as a polynomial equation in the independent variable (A-C), expressed as Eq. 1:
where Y is the response,
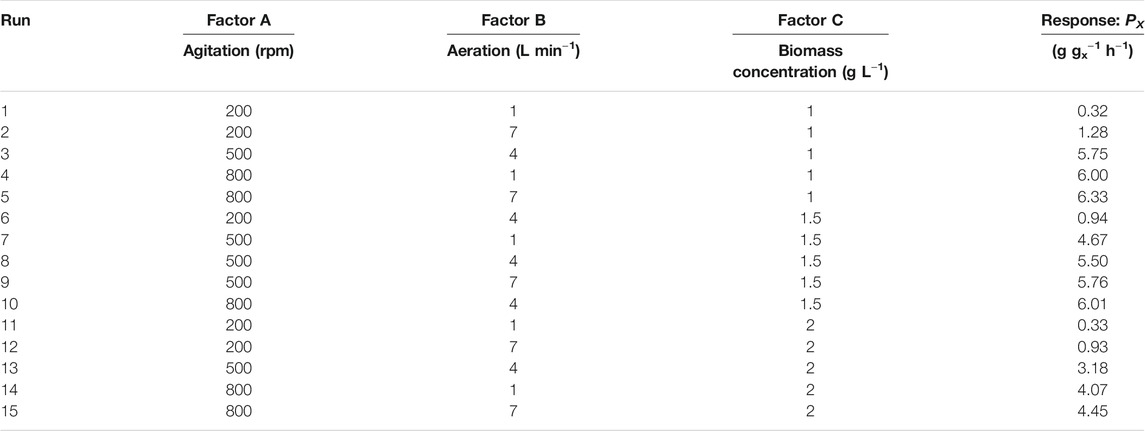
TABLE 2. Experimental matrix design.
Biomass Measurement
The optical density (OD) of the cells was measured at 600 nm using a UV-Vis spectrophotometer (Ultrospec 2100, Amersham Biosciences Corp., United States). Samples were diluted with deionized water and a blank control was also used for the measurements.
Determination of Xylose and Xylonic Acid Content
The simultaneous determination of xylose and XA was performed using high performance anion exchange chromatography combined with pulsed amperometric detection (Thermo ICS-5000) using a CarboPac™ PA10 column (Wang et al., 2014). The samples were filtered (0.22 μm membrane) and injected (10 μL) on a CarboPac PA-10 guard column (2 mm × 50 mm) attached to a CarboPac PA-10 anion-exchange analytical column (2 mm × 250 mm). The column temperature was maintained at 30°C. 100 mM NaOH was used as mobile phase at a flow rate of 0.3 ml min−1. Before each injection, the column was re-equilibrated by running for 15 min with 6 mM NaOH to achieve good repeatability.
Specific Productivity and Volumetric Productivity
XA specific productivity (PX) was calculated for each experiment employing Eq. 2:
Volumetric productivity (QP) was calculated by Eq. 3:
where
Determination of kLa
The dissolved oxygen concentration was monitored using a fast dissolved oxygen electrode (605-ISM, Mettler Toledo, United States), and the kLa values were determined by the dynamic method. First, aeration was stopped, and dissolved oxygen levels were decreased to measure oxygen uptake rate. Then, the broth was reaerated with air until the steady state was reached, and kLa value was calculated by the dissolved oxygen mass balance equation (Garcia-Ochoa and Gomez, 2009).
Results and Discussion
Statistical Analysis
In comparison to univariate experiments, RSM takes into account the interaction of all factors on response variables, and also obtains appropriate optimization conditions. In this study, the RSM examined the effect of three variables: agitation (A), aeration (B) and biomass concentration (C) on PX. The evaluation results show that the model has 9 degrees of freedom (df) and the ‘lack of fit’ has 5 df, indicating that the design is suitable for model development. The model with second-order polynomial was defined according to the coding factor as follows:
The results in Table 3 were verified by Fisher’s test for analysis of variance (ANOVA), which showed that the experimental data fitted well with the second-order polynomial function. The Model F-value of 44.44 implied the model was significant. The probability of not getting the results predicted by the regression model is only 0.01%. The large p-value for ‘lack of fit’ (0.1273 > 0.05) indicated that the “lack of fit” is not significant relative to the pure error. The R2 value of 98.28% indicated that the response model explains 98.28% of the total variation. Usually, regression models with R2 values above 0.9 are considered to have a robust correlation (Ávila-Lara et al., 2015). The value of the adjusted coefficient of determination (R2Adj = 96.07%) was also high enough to indicate the significance of the model. These results all suggest that the model can appropriately account for the cumulative as well as univariate effects of all selected variables on productivity in this biotransformation system.
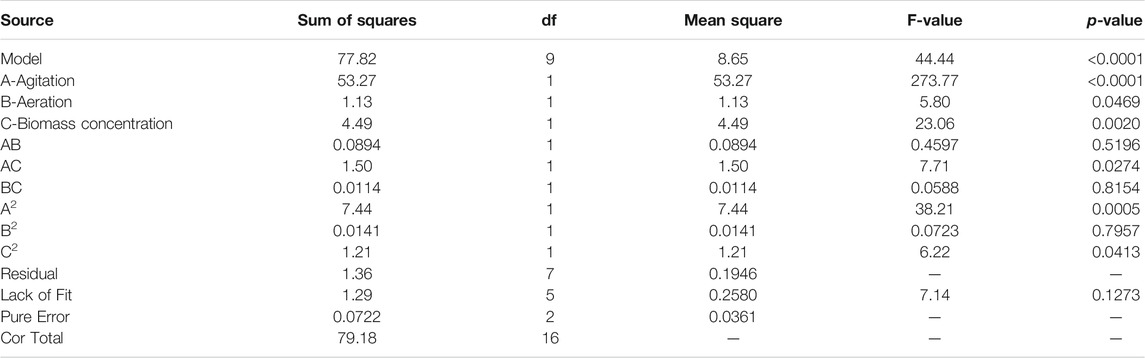
TABLE 3. Analysis of variance (ANOVA) for all model terms.
Figure 1 shows the good correlation between the predicted values and the actual values. The predicted values of the model can match well with the actual values, indicating the good applicability of the model. The model gave the optimized levels of agitation speed (728 rpm), aeration rate (7 L min−1), and biomass concentration (1.11 g L−1), and experiments were conducted in the fermenter. The final PX reached 6.64 ± 0.20 g gx−1 h−1, which is slightly lower than the model value of 6.74 g gx−1 h−1.

FIGURE 1. Parity plot: showing the relation between actual response and predicted values for PX estimation.
Interactive Effect of the Selected Variables on PX
Three different response surface plots (Figures 2A–C) were used to determine the interaction effect between the selected variables on PX. In Figure 2A, the response surface plot shows that the PX value was small at lower agitation speed and aeration rates; as the value of agitation and aeration increase, PX was also enhanced. Theoretically, both agitation speed and aeration affect the oxygen transfer in the fermenter, and an increase in the agitation speed and aeration rates can effectively increase the oxygen transfer coefficient (kLa) in the fermenter (Table 4). Meanwhile, Figure 3 shows that PX was significantly improved as kLa was increased from 0.0018 s−1 to 0.04 s−1, while the increase in PX flattened out as kLa continued to increase. In addition, similar productivity was achieved when kLa was increased from 0.04 s−1 to 0.08 s−1 at a biomass concentration of 1 g L−1 and 1.5 g L−1, respectively. From these results, it can be concluded that the production efficiency of G.oxydans can be effectively increased with an appropriate value of kLa. However, the production efficiency could not be further improved by increasing kLa to a higher level. It can be considered that the overall rate of the biological process is controlled by oxygen transfer when kLa is less than 0.04 s−1. When increasing the oxygen transfer coefficient to more than 0.04 s−1, the reaction efficiency cannot be further improved effectively. At this stage, the overall rate of the biological process is controlled by oxygen uptake. In addition, it can be observed that the curve of aeration is slightly curved on the surface. This observation suggests that the dominant factor in the interaction is agitation, which has been confirmed by previous studies (Dixit et al., 2015; Li et al., 2019). This is in agreement with the report of Pooja Dixit et al. (2015), who also found that agitation has the most decisive effect on kLa. The reason is that agitation reduces the bubble size and increases the gas-liquid contact area.
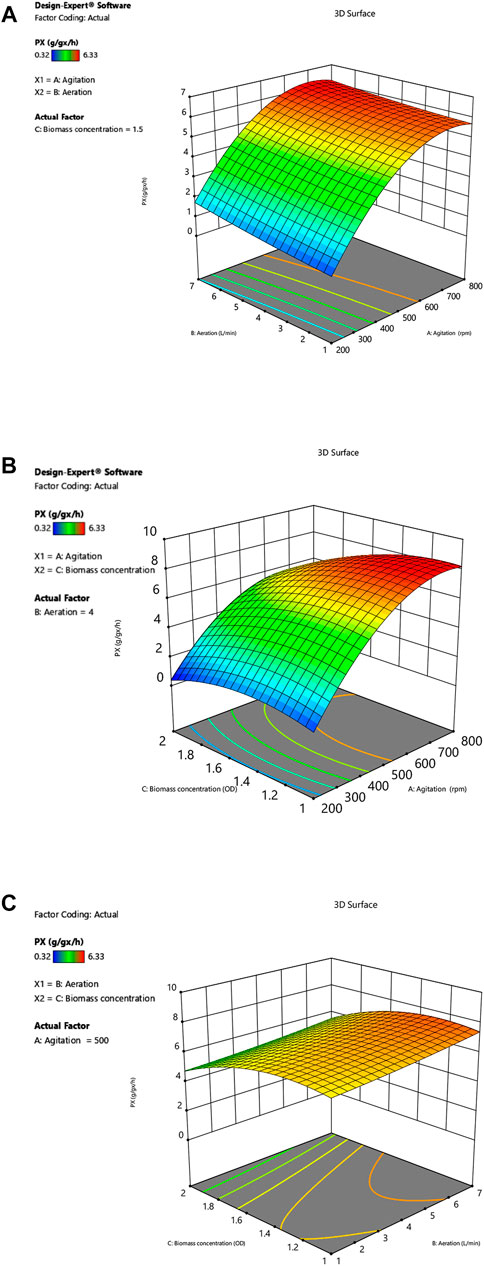
FIGURE 2. (A) Interactive effect of agitation and aeration on PX. (B) Interactive effect of agitation and biomass concentration on PX. (C) Interactive effect of aeration and biomass concentration on PX.
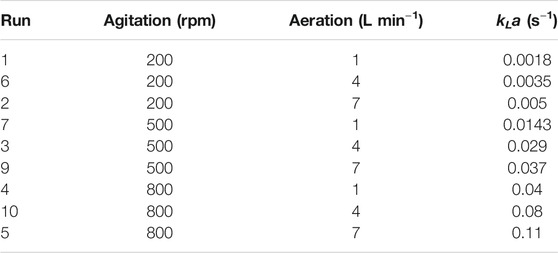
TABLE 4. Mass transfer coefficients (kLa) in fermenters under different operating conditions.
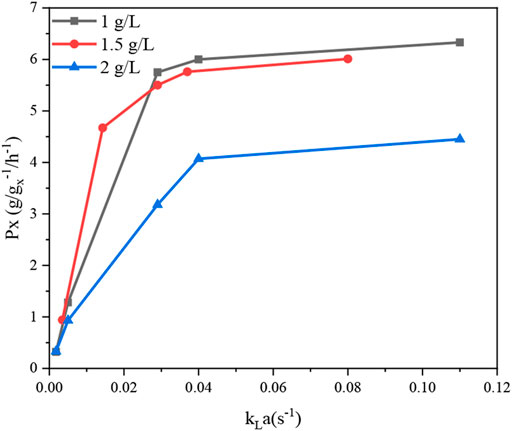
FIGURE 3. Specific productivity of XA production using different concentrations of G. oxydans NL71 at different kLa conditions.
However, it can be observed that the PX value tends to a plateau in the high agitation region (Figure 2A). In addition, an examination of the data (Table 2) showed that the increase in agitation value from 200 to 500 rpm (run no. 6 and 8) caused an increase in PX value from 0.94 g gx−1 h−1–5.50 g gx−1 h−1, whereas an increase in agitation from 500 to 800 rpm (run no. 8 and 10) increased the PX value from 5.50 g gx−1 h−1–6.01 g gx−1 h−1, which was not so significant as compared to previous experiments (run no. 6 and 8). It can be concluded that the improved oxygen transfer conditions brought about by the agitation speed of 800 rpm provide an adequate oxygen supply for oxygen uptake, thus enabling the maximum catalytic performance of the strain.
Figure 2B shows the dependence of PX on biomass concentration CX and agitation at a specific aeration rate. In the low agitation region, the value of PX is small; as the agitation speed is enhanced, PX is also increased. The PX increase tends to level off when the agitation speed exceeds 500 rpm. The maximum Px of 6.33 g gx−1 h−1 was reached at an agitation speed of 800 rpm, which indicates that the catalytic capacity of the bacteria is close to the maximum value at this operating condition. When the capacity of oxygen uptake was enhanced, the results showed that PX instead decreased. It can be confirmed by comparing the data of run 3 and 13 (Table 2), where PX decreased from 5.75 g gx−1 h−1–3.18 g gx−1 h−1 by increasing the biomass concentration from 1 g L−1–2 g L−1. Previously, Yuan et al. (2016) reported similar observations and suggested that the oxygen limitation brought about by the growth of the bacterium at the beginning of fermentation could affect the expression of transhydrogenase on the G. oxydans membrane, which might reduce the catalytic performance of the bacteria. Theoretically, an increase in biomass concentration could improve the level of oxygen uptake, but the imbalance between oxygen uptake and oxygen transfer leads to lower dissolved oxygen levels in the medium. Lack of oxygen may affect the activity of enzymes on the cell membrane.
Figure 2C depicts the effect of biomass concentration and agitation on PX at a specific agitation rate. The response surface plots show that the interaction between aeration rate and biomass concentration on PX is not significant. Although Px is appropriately enhanced by increasing aeration rate, simultaneous increase of in aeration and biomass concentration cause a decrease in PX. The reason is that the increase in biomass concentration leads to an increase in oxygen demand by the cells, while the increase in aeration rate does not bring about optimal oxygen transfer conditions, resulting in oxygen transfer limitation.
Optimization of Specific Productivity for Xylonic Acid Fermentation
By solving Eq. 4, the optimal operating conditions were estimated to be agitation speed 728 rpm, aeration rate 7 L min−1, and biomass concentration 1.11 g L−1 by response surface analysis. Triplicate fermentation experiments were conducted using the predicted optimal conditions to verify the applicability of Eq. 4. After 12 h of whole-cell catalysis, the DO, xylose, and XA content of the fermentation broth decreased from 0.200 mmol L−1 to 0.140 mmol L−1, 100 g L−1 to 21.04 ± 2.6 g L−1, and 0 g L−1 increased to 88.44 ± 2.7 g L−1, respectively (Figure 4).The experimental value of PX was 6.64 ± 0.20 g gx−1 h−1, which is in excellent agreement with the predicted value (6.74 g gx−1 h−1).
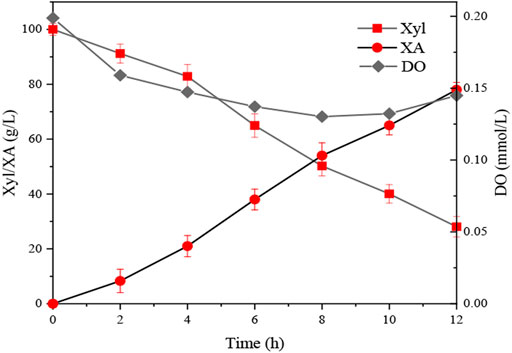
FIGURE 4. XA production under the optimized conditions. Xyl = xylose; XA = xylonic acid; DO = dissolved oxygen.
A Comparison of Specific Productivity for Xylonic Acid Fermentation in the Literature
It can be said that the commercialization of any fermentation technology is impossible without the economic cost considerations. Therefore, it is important to produce xylonic acid economically with a high volumetric productivity. In the literature, many strategies have been conducted to obtain high product titer of xylonic acid. For example, Toivari et al. (2012a) reported that S. cerevisiae was engineered to increase xylonic acid production by genetic engineering. 43 g L−1 of xylonic acid was produced in S. cerevisiae B67002 xylB with a specific productivity of 0.06 g gx−1 h−1. However, the much lower productivity compared to G. oxydans is still a serious weakness. Hahn et al. (2020) reported the effect of different nitrogen sources on the growth and subsequent xylonic acid production. With the addition of 0.32 g L−1 glutamate and 0.15 g L−1 ammonium sulfate as inexpensive nitrogen sources, a xylonic acid volumetric productivity of 2.92 g L−1 h−1 is obtained. The increase in the volumetric productivity was due to the higher cell content obtained by changing the medium conditions. However, the volumetric productivity of 2.92 g L−1 h−1 is still lower when compared to other literature. In shake flask fermentation, oxygen utilization is not the main issue. However, oxygen transfer limitations should be considered when the fermentation system changes from a shake flask to a fermenter. Table 5 shows a comparison of the experimental results for xylonic acid production by other authors. Dai et al. (2020) reported an attempt to use powdered activated carbon treatment to reduce the viscosity of concentrated pre-hydrolysis products and other non-sugar compounds, and 143.6 g L−1 XA and Qp of 4.48 g L−1 h−1 were achieved at 300 rpm. Reducing the viscosity of the medium can change the physicochemical properties and improve the oxygen transfer coefficient, but the final Px of the biotransformation process was only 1.12 g gx−1 h−1.The result indicating that this mass transfer conditions was not sufficient to maximize the catalytic capacity of the strain. Zhang et al. (2017) reported the production of XA using xylose from cellulosic ethanol distillation distillate with a Qp of 5.42 g L−1 h−1 at 500 rpm and 2.5 L min−1. This study provided a practical process option for the production of XA from lignocellulosic feedstock, but the Px was only 2.18 g gx−1 h−1. The agitation rate at 500 rpm and aeration rate at 2.5 L min−1 still does not take advantage of the maximum catalytic capacity of this strain when compared to other reports in the literature. Zhou et al. (2017) reported the improvement of oxygen transfer by increasing the fermenter pressure and introducing pure oxygen, and obtain a total Qp of 32.5 g L−1 h−1 and a PX of 5.26 g gx−1 h−1 at a biomass concentration of 6.08 g L−1, which is the maximum volumetric yield and specific productivity achieved so far. The elevated pressure changes the solubility of oxygen in the medium and the supply of pure oxygen increases the dissolved oxygen concentration, resulting in a significant improvement in oxygen delivery. The high level of oxygen supply makes it feasible to provide the large amounts of oxygen required for high biomass concentration, thus achieving high productivity. However, the costs associated with the supply of pure oxygen and the potential operational difficulties under elevated pressure conditions cannot be ignored. Moreover, Zhou et al. (2019) reported the use of PVA-alginate immobilized G. oxydans NL71 as a biocatalyst for whole-cell catalysis of xylose. Although the immobilized cells could improve the catalytic performance, with a volumetric yield of 7.10 g L−1 h−1 at a biomass concentration up to 10 g L−1, the PX was only 0.71 g gx−1 h−1, which severely wasted the catalytic performance of G. oxydans NL71. The reason may be the oxygen transfer limitation imposed by immobilized cells, which limits the level of oxygen uptake.
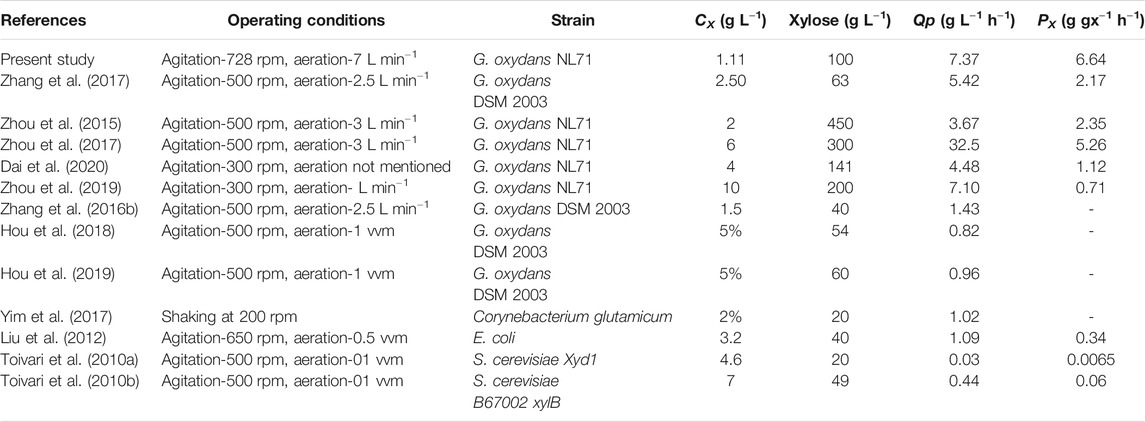
TABLE 5. Comparative literature report on the production of XA under various process conditions.
To solve the problem of low productivity caused by the mismatch between oxygen transfer and oxygen uptake, the fermentation conditions (agitation, aeration, biomass concentration) were optimized by Box-Behnken response surfaces. A final PX of 6.64 ± 0.20 g gx−1 h−1 is achieved, which is significantly higher than that was reported in the literature. The above results indicate that the developed model can be used to improve the production efficiency of xylonic acid.
Conclusion
The efficient bioconversion of xylonic acid using G. oxydans NL71 as a biocatalyst has been investigated using response surface methodology. Also, the maximum PX for xylonic acid production was successfully obtained by multivariate optimization such as agitation, aeration and biomass concentration. A maximum specific productivity of 6.64 ± 0.20 g gx−1 h−1 for xylonic acid was obtained under optimized conditions (728 rpm, 7 L min−1, 1.11 g L−1). The optimized variables not only proved the validity of the models, but also effectively improved the production efficiency of G. oxydans NL71 in the whole-cell catalytic xylose process. Therefore, this study presents the potential application in improving the efficiency of xylonic acid production.
Data Availability Statement
The original contributions presented in the study are included in the article/supplementary material, further inquiries can be directed to the corresponding authors.
Author Contributions
TH and CX conceived and designed the experiments, TH, CD and XL performed the experiments, TH wrote the original draft, CX helped write, review and edit the manuscript. XG acquired the funding. All co-authors performed proofreading of the manuscript.
Funding
This work was financially supported by the National Natural Science Foundation of China (21774059), the Priority Academic Program Development (PAPD) of Jiangsu Higher Education Institutions, and the opening funding of Jiangsu Key Lab of Biomass-based Green Fuels and Chemicals.
Conflict of Interest
The authors declare that the research was conducted in the absence of any commercial or financial relationships that could be construed as a potential conflict of interest.
Publisher’s Note
All claims expressed in this article are solely those of the authors and do not necessarily represent those of their affiliated organizations, or those of the publisher, the editors and the reviewers. Any product that may be evaluated in this article, or claim that may be made by its manufacturer, is not guaranteed or endorsed by the publisher.
References
Ávila-Lara, A. I., Camberos-Flores, J. N., Mendoza-Pérez, J. A., Messina-Fernández, S. R., Saldaña-Duran, C. E., Jimenez-Ruiz, E. I., et al. (2015). Optimization of Alkaline and Dilute Acid Pretreatment of Agave Bagasse by Response Surface Methodology. Front. Bioeng. Biotechnol. 3, 146. doi:10.3389/fbioe.2015.00146
Cao, R., and Xu, Y. (2019). Efficient Preparation of Xylonic Acid from Xylonate Fermentation Broth by Bipolar Membrane Electrodialysis. Appl. Biochem. Biotechnol. 187, 396–406. doi:10.1007/s12010-018-2827-y
Chun, B. W., Dair, B., Macuch, P. J., Wiebe, D., Porteneuve, C., and Jeknavorian, A. (2006). The Development of Cement and concrete Additive: Based on Xylonic Acid Derived via Bioconversion of Xylose. Appl. Biochem. Biotechnol. 129-132, 645–658. doi:10.1385/ABAB:131:1:645
Dai, L., Jiang, W., Zhou, X., and Xu, Y. (2020). Enhancement in Xylonate Production from Hemicellulose Pre-hydrolysate by Powdered Activated Carbon Treatment. Bioresour. Techn. 316, 123944. doi:10.1016/j.biortech.2020.123944
Deppenmeier, U., Hoffmeister, M., and Prust, C. (2002). Biochemistry and Biotechnological Applications of Gluconobacter Strains. Appl. Microbiol. Biotechnol. 60, 233–242. doi:10.1007/s00253-002-1114-5
Dixit, P., Mehta, A., Gahlawat, G., Prasad, G. S., and Choudhury, A. R. (2015). Understanding the Effect of Interaction Among Aeration, Agitation and Impeller Positions on Mass Transfer during Pullulan Fermentation by Aureobasidium Pullulans. RSC Adv. 5, 38984–38994. doi:10.1039/c5ra03715h
Garcia-Ochoa, F., and Gomez, E. (2009). Bioreactor Scale-Up and Oxygen Transfer Rate in Microbial Processes: an Overview. Biotechnol. Adv. 27, 153–176. doi:10.1016/j.biotechadv.2008.10.006
Garcia-Ochoa, F., Gomez, E., Santos, V. E., and Merchuk, J. C. (2010). Oxygen Uptake Rate in Microbial Processes: An Overview. Biochem. Eng. J. 49, 289–307. doi:10.1016/j.bej.2010.01.011
Gupta, A., Singh, V. K., Qazi, G. N., and Kumar, A. (2001). Gluconobacter oxydans: Its biotechnological applications. Microbiol. Biotechnol. 3, 445–456. doi:10.1016/S0167-7012(01)00251-2
Hahn, T., Torkler, S., van Der Bolt, R., Gammel, N., Hesse, M., Möller, A., et al. (2020). Determining Different Impact Factors on the Xylonic Acid Production Using Gluconobacter Oxydans DSM 2343. Process Biochem. 94, 172–179. doi:10.1016/j.procbio.2020.04.011
Handlogten, M. W., Lee-O'Brien, A., Roy, G., Levitskaya, S. V., Venkat, R., Singh, S., et al. (2018). Intracellular Response to Process Optimization and Impact on Productivity and Product Aggregates for a High-Titer CHO Cell Process. Biotechnol. Bioeng. 115, 126–138. doi:10.1002/bit.26460
Hölscher, T., Schleyer, U., Merfort, M., Bringer-Meyer, S., Görisch, H., and Sahm, H. (2009). Glucose Oxidation and PQQ-dependent Dehydrogenases in Gluconobacter Oxydans. J. Mol. Microbiol. Biotechnol. 16, 6–13. doi:10.1159/000142890
Hou, W., Kan, J., and Bao, J. (2019). Rheology Evolution of High Solids Content and Highly Viscous Lignocellulose System in Biorefinery Fermentations for Production of Biofuels and Biochemicals. Fuel 253, 1565–1569. doi:10.1016/j.fuel.2019.05.136
Hou, W., Zhang, M., and Bao, J. (2018). Cascade Hydrolysis and Fermentation of Corn stover for Production of High Titer Gluconic and Xylonic Acids. Bioresour. Techn. 264, 395–399. doi:10.1016/j.biortech.2018.06.025
Hua, X., Zhou, X., Du, G., and Xu, Y. (2020). Resolving the Formidable Barrier of Oxygen Transferring Rate (OTR) in Ultrahigh-Titer Bioconversion/biocatalysis by a Sealed-Oxygen Supply Biotechnology (SOS). Biotechnol. Biofuels. 13, 1. doi:10.1186/s13068-019-1642-1
Li, C., Tian, J., Wang, W., Peng, H., Zhang, M., Hang, H., et al. (2019). Numerical and Experimental Assessment of a Miniature Bioreactor Equipped with a Mechanical Agitator and Non‐invasive Biosensors. J. Chem. Technol. Biotechnol. 94, 2671–2683. doi:10.1002/jctb.6076
Liu, H., Valdehuesa, K. N. G., Nisola, G. M., Ramos, K. R. M., and Chung, W.-J. (2012). High Yield Production of D-Xylonic Acid from D-Xylose Using Engineered Escherichia coli. Bioresour. Techn. 115, 244–248. doi:10.1016/j.biortech.2011.08.065
Mientus, M., Kostner, D., Peters, B., Liebl, W., and Ehrenreich, A. (2017). Characterization of Membrane-Bound Dehydrogenases of Gluconobacter Oxydans 621H Using a New System for Their Functional Expression. Appl. Microbiol. Biotechnol. 101, 3189–3200. doi:10.1007/s00253-016-8069-4
Nogue, V. S., and Karhumaa, K. (2015). Xylose Fermentation as a challenge for Commercialization of Lignocellulosic Fuels and Chemicals. Biotechnol. Lett. 37 (4), 761–772. doi:10.1007/s10529-014-1756-2
Toivari, M. H., Nygård, Y., Penttilä, M., Ruohonen, L., and Wiebe, M. G. (2012b). Microbial D-Xylonate Production. Appl. Microbiol. Biotechnol. 96, 1–8. doi:10.1007/s00253-012-4288-5
Toivari, M. H., Ruohonen, L., Richard, P., Penttilä, M., and Wiebe, M. G. (2010a). Saccharomyces cerevisiae Engineered to Produce D-Xylonate. Appl. Microbiol. Biotechnol. 88 (3), 751–760. doi:10.1007/s00253-010-2787-9
Toivari, M., Nygård, Y., Kumpula, E.-P., Vehkomäki, M.-L., Benčina, M., Valkonen, M., et al. (2012a). Metabolic Engineering of Saccharomyces cerevisiae for Bioconversion of D-Xylose to D-Xylonate. Metab. Eng. 14 (4), 427–436. doi:10.1016/j.ymben.2012.03.002
Wang, X., Xu, Y., Lian, Z., Yong, Q., and Yu, S. (2014). A One-step Method for the Simultaneous Determination of Five wood Monosaccharides and the Corresponding Aldonic Acids in Fermentation Broth Using High-Performance Anion-Exchange Chromatography Coupled with a Pulsed Amperometric Detector. J. Wood Chem. Techn. 34, 67–76. doi:10.1080/02773813.2013.838268
Yim, S. S., Choi, J. W., Lee, S. H., Jeon, E. J., Chung, W.-J., and Jeong, K. J. (2017). Engineering ofCorynebacterium Glutamicumfor Consolidated Conversion of Hemicellulosic Biomass into Xylonic Acid. Biotechnol. J. 12, 1700040. doi:10.1002/biot.201700040
Yuan, J., Wu, M., Lin, J., and Yang, L. (2016). Enhancement of 5-Keto-D-Gluconate Production by a Recombinant Gluconobacter Oxydans Using a Dissolved Oxygen Control Strategy. J. Biosci. Bioeng. 122, 10–16. doi:10.1016/j.jbiosc.2015.12.006
Zaldivar, J., Nielsen, J., and Olsson, L. (2001). Fuel Ethanol Production from Lignocellulose: a challenge for Metabolic Engineering and Process Integration. Appl. Microbiol. Biotechnol. 56 (1-2), 17–34. doi:10.1007/s002530100624
Zhang, H., Han, X., Wei, C., and Bao, J. (2017). Oxidative Production of Xylonic Acid Using Xylose in Distillation Stillage of Cellulosic Ethanol Fermentation Broth by Gluconobacter Oxydans. Bioresour. Techn. 224, 573–580. doi:10.1016/j.biortech.2016.11.039
Zhang, H., Liu, G., Zhang, J., and Bao, J. (2016a). Fermentative Production of High Titer Gluconic and Xylonic Acids from Corn stover Feedstock by Gluconobacter Oxydans and Techno-Economic Analysis. Bioresour. Techn. 219, 123–131. doi:10.1016/j.biortech.2016.07.068
Zhang, H., Shi, L., Mao, X., Lin, J., and Wei, D. (2016b). Enhancement of Cell Growth and Glycolic Acid Production by Overexpression of Membrane-Bound Alcohol Dehydrogenase in Gluconobacter Oxydans DSM 2003. J. Biotechnol. 237, 18–24. doi:10.1016/j.jbiotec.2016.09.003
Zhou, X., Han, J., and Xu, Y. (2019). Electrodialytic Bioproduction of Xylonic Acid in a Bioreactor of Supplied-Oxygen Intensification by Using Immobilized Whole-Cell Gluconobacter Oxydans as Biocatalyst. Bioresour. Techn. 282, 378–383. doi:10.1016/j.biortech.2019.03.042
Zhou, X., Lü, S., Xu, Y., Mo, Y., and Yu, S. (2015). Improving the Performance of Cell Biocatalysis and the Productivity of Xylonic Acid Using a Compressed Oxygen Supply. Biochem. Eng. J. 93, 196–199. doi:10.1016/j.bej.2014.10.014
Keywords: xylonic acid, specific productivity, oxygen transfer, oxygen uptake, response surface methodology
Citation: He T, Xu C, Ding C, Liu X and Gu X (2021) Optimization of Specific Productivity for Xylonic Acid Production by Gluconobacter oxydans Using Response Surface Methodology. Front. Bioeng. Biotechnol. 9:729988. doi: 10.3389/fbioe.2021.729988
Received: 24 June 2021; Accepted: 30 July 2021;
Published: 13 August 2021.
Edited by:
Zhipeng Wang, Qingdao Agricultural University, ChinaReviewed by:
Kris Niño Gomez Valdehuesa, University of Manchester, United KingdomJakub Zdarta, Poznań University of Technology, Poland
Copyright © 2021 He, Xu, Ding, Liu and Gu. This is an open-access article distributed under the terms of the Creative Commons Attribution License (CC BY). The use, distribution or reproduction in other forums is permitted, provided the original author(s) and the copyright owner(s) are credited and that the original publication in this journal is cited, in accordance with accepted academic practice. No use, distribution or reproduction is permitted which does not comply with these terms.
*Correspondence: Chaozhong Xu, eHVjekBuamZ1LmVkdS5jbg==; Xiaoli Gu, Z3V4aWFvbGlAbmpmdS5lZHUuY24=
†These authors have contributed equally to this work and share first authorship