 Qi Ren
 Zhe Chu
 Wei Cui
 Lu Cheng
 Wenjie Su
 Hao Cheng
 Jie Wu
- 1Eye Institute of Shandong First Medical University, Qingdao Eye Hospital of Shandong First Medical University, Qingdao, China
- 2State Key Laboratory Cultivation Base, Shandong Provincial Key Laboratory of Ophthalmology, Qingdao, China
- 3School of Ophthalmology, Shandong First Medical University, Qingdao, China
- 4State Key Laboratory of Ophthalmology, Zhongshan Ophthalmic Center, Sun Yat-sen University, Guangzhou, China
- 5Department of Ophthalmology, The First Affiliated Hospital of Guangzhou Medical University, Guangzhou, China
Purpose: To investigate the relationship between the corneal material stiffness parameter stress-strain index (SSI) and axial length (AL) elongation with varying severities of myopia, based on a mathematical estimation model.
Methods: This single-center, cross-sectional study included data from healthy subjects and patients preparing for refractive surgery in the Qingdao Eye Hospital of Shandong First Medical University. Data were collected from July 2021 to April 2022. First, we performed and tested an estimated AL model (
Results: We found that AL was closely associated with
Conclusion: AL increased with decreasing SSI in myopia.
1 Introduction
Myopia is a refractive error in which light rays enter the eye parallel to the optic axis and are focused in front of the retina when ocular accommodation is relaxed. Usually, this results from a long eyeball, but it can also be caused by an overly curved cornea and/or lens with increased optical power (Flitcroft et al., 2019). As a general phenomenon of optometry, the nature of myopia and the relationship between myopia and refractive development remain unknown. However, it is certain that scleral remodeling plays a key role in both refractive development and myopia progression. Clinical and experimental studies on the biochemical and biomechanical properties of the sclera have shown that it participates in the regulation of axial elongation during refractive development through changes in fibers and extracellular stroma. The spherical equivalent error (SER) is normally distributed after birth, and the mean refractive error is hyperopic (Cook and Glasscock, 1951). Ideally, the sclera should stop elongating once the SER decrease reaches the endpoint of emmetropization, which represents the end of the refractive development period. However, in some individuals, the sclera continues to elongate until myopia develops. As stated earlier, there is no anatomical emmetropization endpoint between myopia and refractive development (Morgan et al., 2010) (Ma et al., 2021); even the normal refractive state is usually a dynamic equilibrium achieved by adjusting mild hyperopia through the lens and other refractive media (Anderson et al., 2010). There is insufficient evidence on the difference in scleral remodeling between non-high myopia and high myopia occurrence, especially high myopia with pathological changes. Likewise, axial myopia, a myopic refractive state attributed to excessive axial elongation, is closely related to scleral remodeling (Flitcroft et al., 2019); however, the differences in the mechanism of scleral remodeling between axial and non-axial myopia are unknown. Thus, there are differences between the biochemical and biomechanical properties of the scleral wall; therefore, understanding the mechanisms of biochemical and biomechanical differences in refractive development and varying severities of myopia is essential to determine the mechanism of myopia.
The refractive status of the cornea is another key factor in understanding myopia. Unlike sclera, the cornea develops by the age of 10 years, and axial elongation can last up to 20 years (Jones et al., 2005) (Wong et al., 2010). The mechanism of corneal biomechanical and behavioral changes related to myopia progression is unclear. One hypothesis is that the cornea undergoes similar changes in mechanical strength owing to scleral thinning and local dilation of the posterior sclera in highly myopic eyes (Rada et al., 2006). Previous reports have shown that axial length (AL) changes in myopia are associated with modifications of the corneal structure (Bueno-Gimeno et al., 2014). Therefore, studying the relationship between corneal biomechanical properties and AL elongation is key to understanding the pathogenesis of myopia and determining its prevention strategies.
Corneal biomechanical properties can be measured by assessing the cornea’s response to stress. Corneal stress can be achieved by applying an external force to the cornea by an air pulse; the ability of the cornea to resist deformation is known as stiffness, which depends on the elastic modulus and size and shape of the cross-section in the direction of force application (Roberts et al., 2016). Elastic modulus is a commonly used parameter for evaluating corneal stiffness (Kling and Hafezi, 2017). It is defined as the slope of the stress-strain curve of a material and describes the degree to which the load (stress) affects the deformation (strain) of the material under specific conditions. The higher the elastic modulus, the stiffer is the material. Because harder materials require greater force to deform (Roberts, 2014), the elastic modulus of the cornea reflects its ability to resist elastic deformation. In vivo measurements have shown that corneal stiffness decreases with increasing severities of myopia (Song et al., 2022) (Plakitsi et al., 2011) (Kang et al., 2018) (Han et al., 2020), indicating that corneal biomechanical changes are involved in the progression of myopia. The stress-strain index (SSI) is a corneal biomechanical parameter provided by Corvis ST Tonometry to evaluate the stiffness of corneal materials, which can intuitively and quantitatively reflect the stress-strain relationship in corneal materials (Eliasy et al., 2019). Previous research has confirmed that a decreased SSI is associated with high myopia based on SER (Liu et al., 2022). As a morphological variable related to axial myopia, theoretically, AL should correlate more with SSI than SER because AL elongation may be caused by a decrease in scleral stiffness. In fact, SSI at AL ≥ 26 mm was found to be smaller than that at AL < 26 mm but was not significantly correlated with AL in the respective groups (Liu et al., 2021) (Chu et al., 2022). To explore the reasons for this, we introduced the corneal radius of curvature (CR) in our previous work using the AL/CR ratio as the linkage variable of AL and SER; we found that AL/CR, which is more related to the severity of myopia, showed a significant negative correlation with SSI (Chu et al., 2022). According to the SSI proposal, SSI should not be correlated with the corneal geometry parameter CR (Eliasy et al., 2019). Therefore, we conjecture that AL increment that matches the CR change may be the driving force of the relationship between SSI and AL. For this reason, to investigate the relationship between SSI and AL elongation with varying severities of myopia, we developed and tested a mathematical model of AL increment corresponding to myopia progression using data from medical service records of a single center. This model is based on the existing mathematical approach for the theoretical estimation of AL in a cross-sectional study (Morgan et al., 2020).
2 Methods
2.1 Clinical data
We collected data for this study from July 2021 to April 2022 from the Picture Archiving and Communication System and Hospital Information System at the Qingdao Eye Hospital of Shandong First Medical University. The study population included healthy subjects and patients preparing for refractive surgery. Subjects were excluded if they met any of the following criteria: 1) 3 diopter (3D) power or more of astigmatism, 2) use of contact lenses, 3) history or suspicion of corneal diseases such as keratoconus, and 4) history of eye surgery.
For eligibility, the medical records of all subjects required the inclusion of a complete medical history and ophthalmic examinations on the same day, including comprehensive optometry results after mydriasis, AL (OA 2000, Tomey, Japan), anterior CR (as mean of Kflat and Ksteep) in a diameter range of 3 mm (OA 2000, Tomey, Japan), and the corneal biomechanical parameter SSI (Corvis ST, Oculus, Wetzlar, Germany). Only measurements with “OK” quality specifications were included in this analysis. All research procedures were conducted following the principles of the Declaration of Helsinki and were approved by the Ethics Committee of the Qingdao Eye Hospital of Shandong First Medical University.
2.2 Mathematical model
1) The theoretical estimation of AL was calculated using the mathematical model proposed by Morgan et al. (2020).
Morgan formula:
(CR = anterior corneal surface radius of curvature, as mean of Kflat and Ksteep; SER = spherical equivalent refractive error at the corneal plane (D). All SERs in this study were obtained from comprehensive optometric results after sufficient mydriasis).
2) The mathematical models of emmetropic AL, corresponding to corneal refraction, and AL increment of ametropia were calculated as:
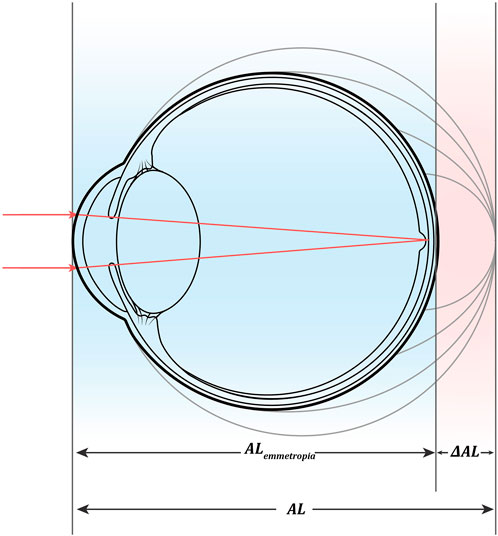
FIGURE 1. Mathematical model of axial increment.
2.3 Statistical analysis
Sociodemographic and clinical variables were summarized using descriptive statistics. The Pearson correlation test and Bland-Altman analysis were performed to analyze the relationship between SER and
3 Results
3.1 Sample characteristics
As summarized in Table 1, our study included 267 subjects. In Table 1, values are expressed as mean (standard deviation) for continuous variables (i.e., age and AL) and sample size (percentage) for gender.
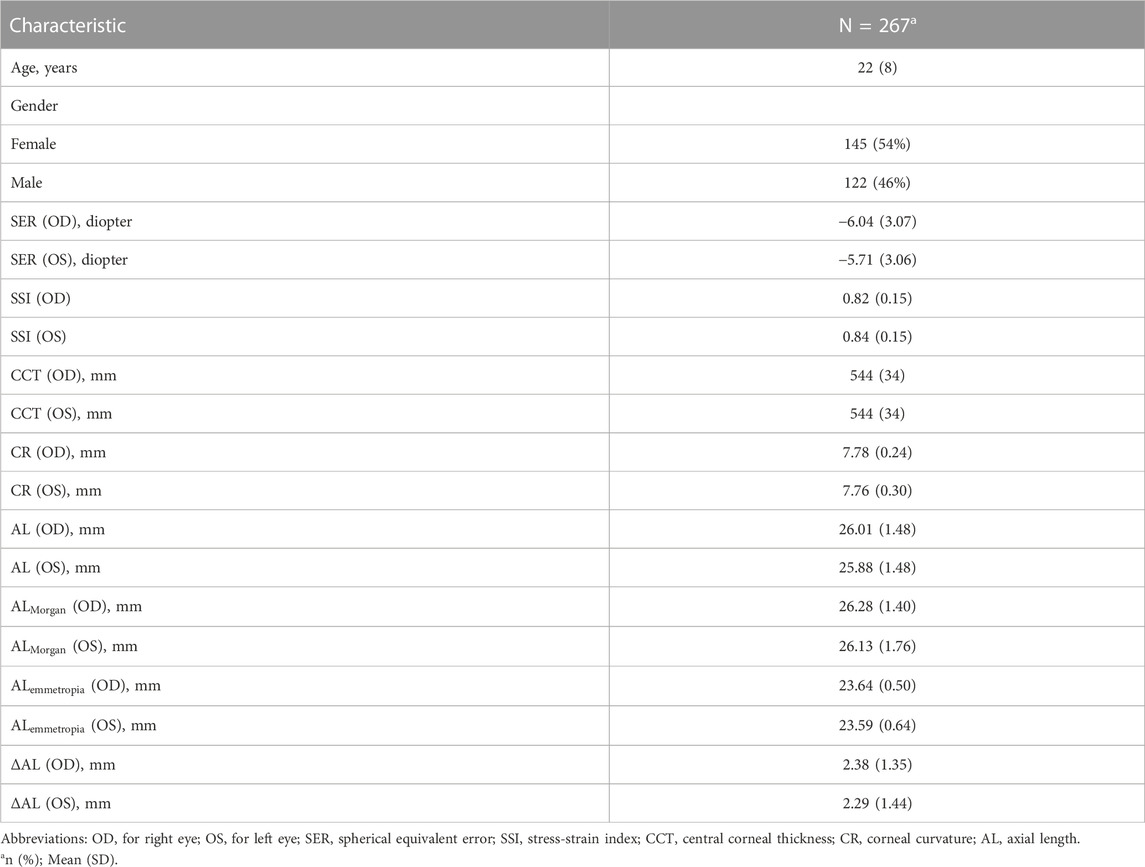
TABLE 1. Characteristics of our study sample.
3.2 Correlation between AL and
To examine the correlation between AL and
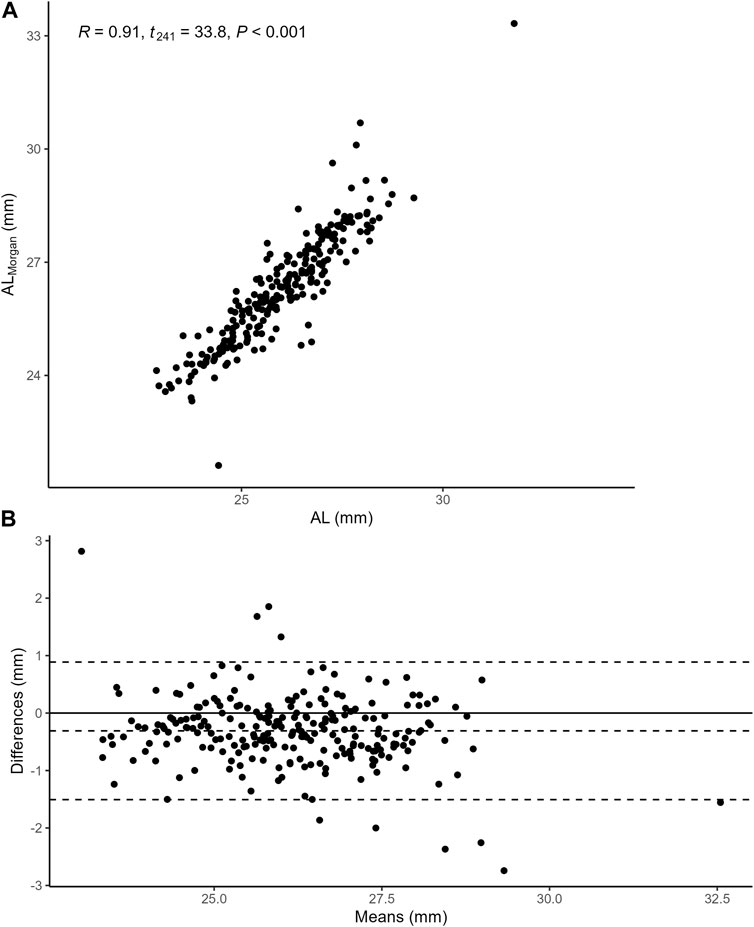
FIGURE 2. (A) the Pearson correlation between AL and
3.3 AL,
Figure 3 demonstrates the relationship between AL,
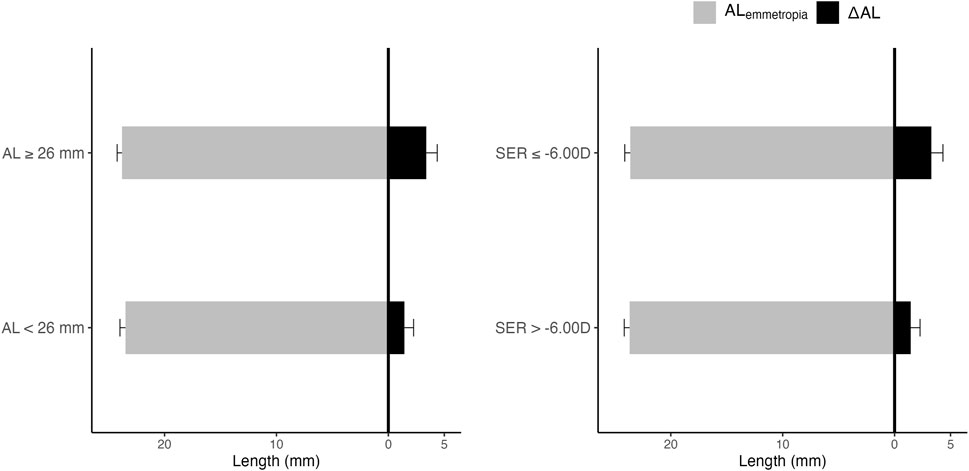
FIGURE 3. AL,
3.4 Correlation between SER and
To examine the correlation between SER and
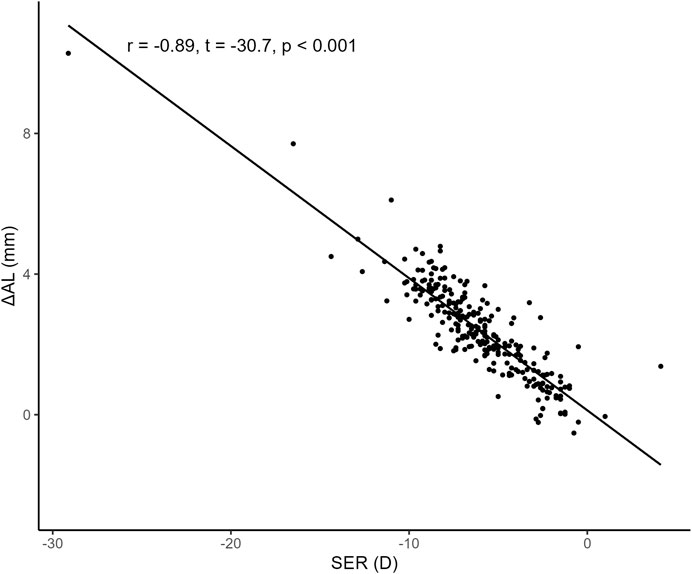
FIGURE 4. Correlation between SER and
3.5 Summary of linear regression models
First, we constructed three simple linear regression models to examine the associations of SSI with AL,
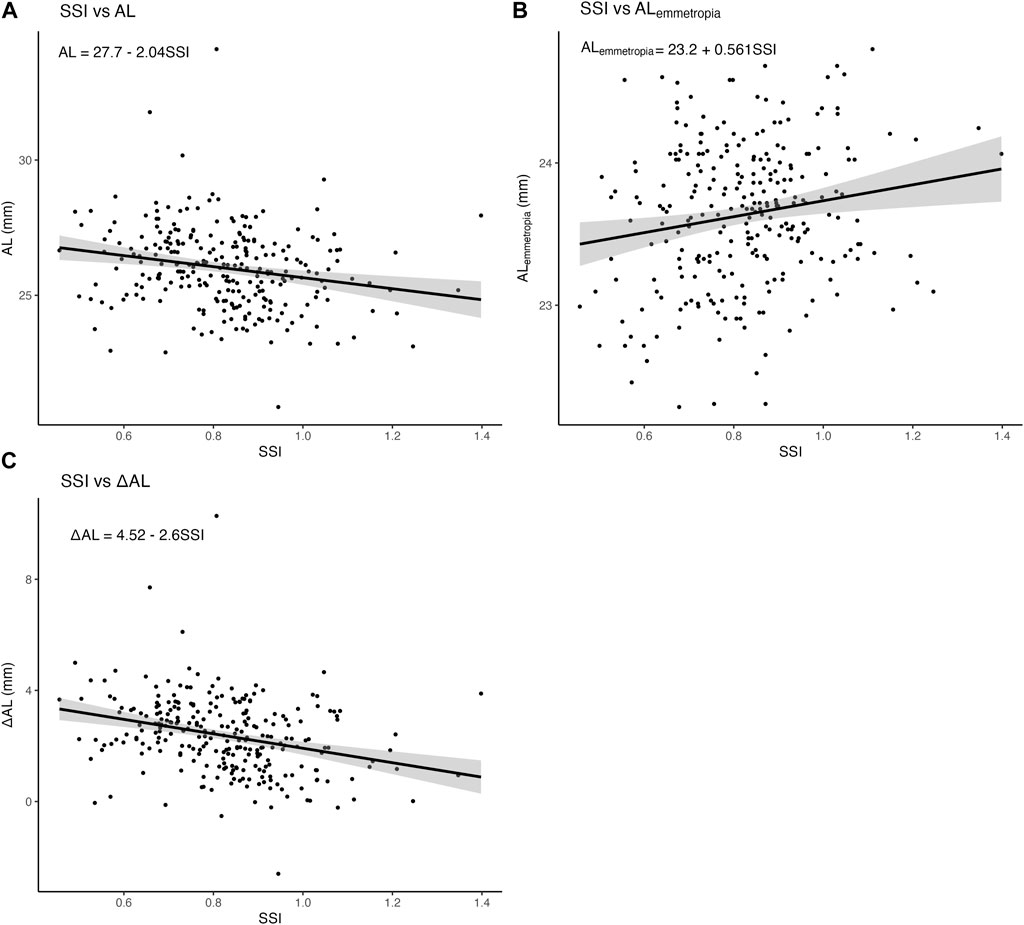
FIGURE 5. Associations of SSI with AL,
Second, several multiple linear regression models were conducted: model 1 with AL as the dependent variable and SSI as the independent variable was adjusted for age, gender, and CCT; model 2 with
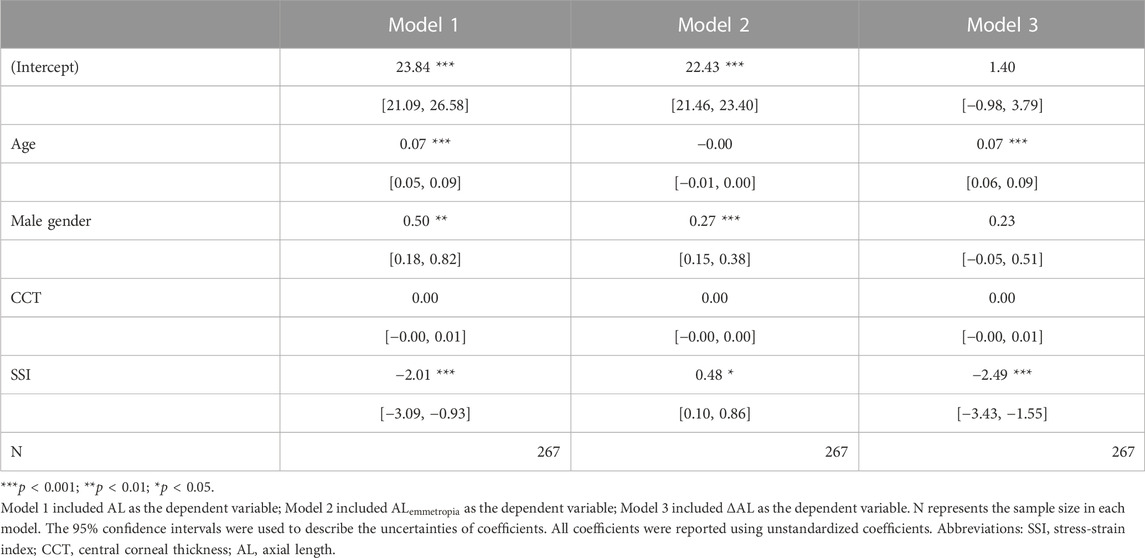
TABLE 2. Summary of linear regression models.
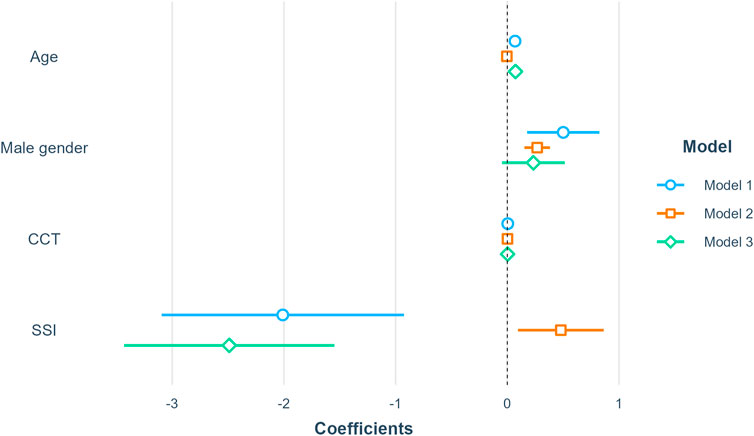
FIGURE 6. Summary of linear regression models. Model 1 included AL as the dependent variable; Model 2 included
To examine whether the association of SSI and
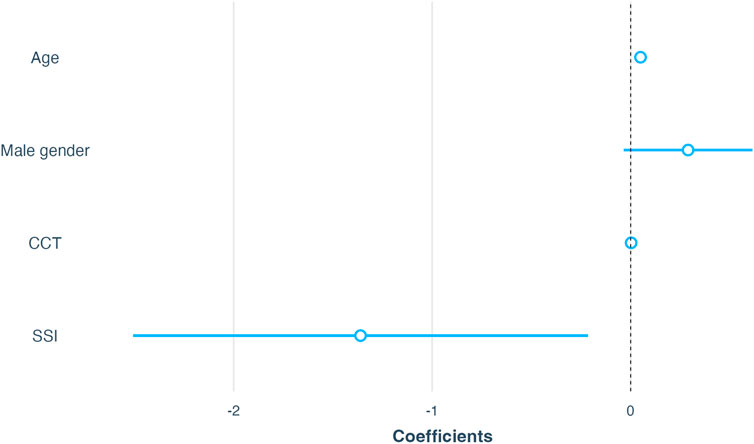
FIGURE 7. Association of SSI with
4 Discussion
By analyzing the data of medical service records and the mathematical estimation model of AL, we found that the AL model of refractive error (
AL changes are reflective of the regulatory processes of the sclera, especially those of the posterior sclera. The cornea and posterior sclerae are not directly connected structurally. Thus, the association between AL increase and SSI should be interpreted as an indirect association through the level of axial myopia, if the acquisition of SSI is not affected by the posterior eyeball structure, which means that corneal material stiffness decreases significantly with the deepening of axial myopia. However, SSI measured using Corvis ST is different from the elastic modulus of corneal tissue measured in the laboratory, as dynamic corneal responses may be affected by the internal structures and sclera stiffness (Kling and Marcos, 2013); to rule out this possibility, more targeted histological evidence is needed, although Corvis ST has good tissue accuracy and reproducibility in assessing biomechanical changes in dynamic corneal response. A recent theory of scleral hypoxia in the development of axial myopia suggests that myopic visual information disrupts retinal dopamine homeostasis and causes choroidal blood flow reduction and scleral hypoxia, resulting in scleral extracellular matrix remodeling and, eventually, scleral elongation (Zhao et al., 2020). Chronic hypoxemia can cause corneal stromal thinning (Bojarun et al., 2019) (Pang et al., 2021), and it is necessary to investigate whether the involvement of factors such as aqueous humor oxygen content and contact lens oxygen transmittance in reducing corneal biomechanical strength is associated with myopia progression (Liesegang, 2002).
An interesting finding was that our model’s intermediate quantity
Since the occurrence of SSI, many remarkable studies have reported on the relationship between corneal biomechanical behavior and myopia. This study is the first to apply mathematical modeling to assess the relationship between SSI and AL increment with myopia progression. The results clarify why SSI is more significantly related to SER than to AL and confirm the hypothesis that SSI is positively correlated with scleral elongation even at AL ≥ 26 mm. This finding supports the idea that the characteristics of the anterior segment of the eyeball change with increasing severity of myopia (Dhakal et al., 2020). Notably, the Morgan formula used to develop this mathematical model has been validated in a previous study (Queiros et al., 2022), highlighting the importance of the results of this study. However, our study has some limitations that should be considered. First, we used a mathematical model, and the databases did not contain information on the refractive power of other media, such as the aqueous humor, lens and vitreous, and accommodation, which could be used to estimate the distance between the imaging location and the photoreceptor. Thus, our model weights may be biased towards the refractive power of the corneal surface. However, if such a bias exists, it would not change our findings because we tested the ΔAL model with SER after mydriasis and established a suitable fit. Second, the sample size of the study was small; owing to the large variability in SSI measurements relative to the range of values, a larger sample size is needed to refine the study results. Finally, given the observational study design, the models may have had residual confounding effects, although we adjusted for several key variables.
Generally, structural changes during refractive development and myopia are interrelated. As observed in this study, any change in the morphological parameters of myopia, such as scleral dilation and corneal flattening, is associated with several other confounding changes, and it is difficult to analyze these changes separately and determine the causal relationship between them. Evaluating the biomechanical properties of the eyeball structure may aid in understanding the underlying causes of morphological changes with myopia; dilation of the posterior sclera is likely the result rather than the cause of sclera stiffness decrease in myopia (Sedaghat et al., 2020; Hon et al., 2017; Haseltine et al., 2012). Additionally, the lag in morphological changes may be avoided by analyzing the biomechanical properties of the eyeball structure in myopia.
In conclusion,
Data availability statement
The original contributions presented in the study are included in the article/Supplementary Material, further inquiries can be directed to the corresponding author.
Ethics statement
The studies involving human participants were reviewed and approved by Ethics Committee of Qingdao Eye Hospital of Shandong First Medical University. Written informed consent for participation was not required for this study in accordance with the national legislation and the institutional requirements.
Author contributions
QR and ZC: study design, data analysis, and manuscript drafting; WC: data acquisition and data analysis; LC: manuscript drafting; HC and JW: manuscript revision; WS: data acquisition.
Acknowledgments
We thank Jie Zhang and Wenjun Zhou from Hangzhou Shansier Medical Technologies Ltd. for their statistical advice.
Conflict of interest
The authors declare that the research was conducted in the absence of any commercial or financial relationships that could be construed as a potential conflict of interest.
Publisher’s note
All claims expressed in this article are solely those of the authors and do not necessarily represent those of their affiliated organizations, or those of the publisher, the editors and the reviewers. Any product that may be evaluated in this article, or claim that may be made by its manufacturer, is not guaranteed or endorsed by the publisher.
References
Anderson, H. A., Glasser, A., Manny, R. E., and Stuebing, K. K. (2010). Age-related changes in accommodative dynamics from preschool to adulthood. Invest. Ophthalmol. Vis. Sci. 51, 614–622. doi:10.1167/iovs.09-3653
Baohong, W., Ge, Y., Jingliang, C., and Xuemin, J. (2016). The three-dimensional MRI for estimating the shape of eyeball of emmetropia and myopia. Chin. J. Ocul. Traum Occupat Eye Dis., 413–416.
Bojarun, A., Vieversyte, Z., Jaruseviciene, R., Galgauskas, S., Asoklis, R., and Zablockis, R. (2019). Effect of obstructive sleep apnea on corneal morphological characteristics. Cornea 38, 1576–1581. doi:10.1097/ico.0000000000002069
Bueno-Gimeno, I., Espana-Gregori, E., Gene-Sampedro, A., Lanzagorta-Aresti, A., and Pinero-Llorens, D. P. (2014). Relationship among corneal biomechanics, refractive error, and axial length. Optom. Vis. Sci. 91, 507–513. doi:10.1097/opx.0000000000000231
Chu, Z., Ren, Q., Chen, M., Cheng, L., Cheng, H., Cui, W., et al. (2022). The relationship between axial length/corneal radius of curvature ratio and stress-strain index in myopic eyeballs: Using Corvis ST tonometry. Front. Bioeng. Biotechnol. 10, 939129. doi:10.3389/fbioe.2022.939129
Cook, R. C., and Glasscock, R. E. (1951). Refractive and ocular findings in the newborn. Am. J. Ophthalmol. 34, 1407–1413. doi:10.1016/0002-9394(51)90481-3
Dhakal, R., Vupparaboina, K. K., and Verkicharla, P. K. (2020). Anterior sclera undergoes thinning with increasing degree of myopia. Invest. Ophthalmol. Vis. Sci. 61, 6. doi:10.1167/iovs.61.4.6
Eliasy, A., Chen, K. J., Vinciguerra, R., Lopes, B. T., Abass, A., Vinciguerra, P., et al. (2019). Determination of corneal biomechanical behavior in-vivo for healthy eyes using CorVis ST tonometry: Stress-strain index. Front. Bioeng. Biotechnol. 7, 105. doi:10.3389/fbioe.2019.00105
Flitcroft, D. I., He, M., Jonas, J. B., Jong, M., Naidoo, K., Ohno-Matsui, K., et al. (2019). Imi - defining and classifying myopia: A proposed set of standards for clinical and epidemiologic studies. Invest. Ophthalmol. Vis. Sci. 60, M20–M30. doi:10.1167/iovs.18-25957
Han, F., Li, M., Wei, P., Ma, J., Jhanji, V., and Wang, Y. (2020). Effect of biomechanical properties on myopia: A study of new corneal biomechanical parameters. BMC Ophthalmol. 20, 459. doi:10.1186/s12886-020-01729-x
Haseltine, S. J., Pae, J., Ehrlich, J. R., Shammas, M., and Radcliffe, N. M. (2012). Variation in corneal hysteresis and central corneal thickness among black, hispanic and white subjects. Acta Ophthalmol. 90, e626–e631. doi:10.1111/j.1755-3768.2012.02509.x
Hon, Y., Chen, G. Z., Lu, S. H., Lam, D. C., and Lam, A. K. (2017). High myopes have lower normalised corneal tangent moduli (less 'stiff' corneas) than low myopes. Ophthalmic Physiol. Opt. 37, 42–50. doi:10.1111/opo.12335
Jones, L. A., Mitchell, G. L., Mutti, D. O., Hayes, J. R., Moeschberger, M. L., and Zadnik, K. (2005). Comparison of ocular component growth curves among refractive error groups in children. Invest. Ophthalmol. Vis. Sci. 46, 2317–2327. doi:10.1167/iovs.04-0945
Kang, B. S., Wang, L. K., Zheng, Y. P., Guggenheim, J. A., Stell, W. K., and Kee, C. S. (2018). High myopia induced by form deprivation is associated with altered corneal biomechanical properties in chicks. PLoS One 13, e0207189. doi:10.1371/journal.pone.0207189
Kling, S., and Hafezi, F. (2017). Corneal biomechanics - a review. Ophthalmic Physiol. Opt. 37, 240–252. doi:10.1111/opo.12345
Kling, S., and Marcos, S. (2013). Contributing factors to corneal deformation in air puff measurements. Invest. Ophthalmol. Vis. Sci. 54, 5078–5085. doi:10.1167/iovs.13-12509
Liesegang, T. J. (2002). Physiologic changes of the cornea with contact lens wear. CLAO J. 28, 12–27.
Liu, G., Rong, H., Zhang, P., Xue, Y., Du, B., Wang, B., et al. (2021). The effect of axial length elongation on corneal biomechanical property. Front. Bioeng. Biotechnol. 9, 777239. doi:10.3389/fbioe.2021.777239
Liu, Y., Pang, C., Ming, S., and Fan, Q. (2022). Effect of myopia and astigmatism deepening on the corneal biomechanical parameter stress-strain index in individuals of Chinese ethnicity. Front. Bioeng. Biotechnol. 10, 1018653. doi:10.3389/fbioe.2022.1018653
Ma, Y., Lin, S., Morgan, I. G., Rozema, J. J., Iribarren, R., Zhu, J., et al. (2021). Eyes grow towards mild hyperopia rather than emmetropia in Chinese preschool children. Acta Ophthalmol. 99, e1274–e1280. doi:10.1111/aos.14810
Morgan, I. G., Rose, K. A., and Ellwein, L. B., and Refractive error study in children survey, G. (2010). is emmetropia the natural endpoint for human refractive development? An analysis of population-based data from the refractive error study in children (RESC). Acta Ophthalmol. 88, 877–884. doi:10.1111/j.1755-3768.2009.01800.x
Morgan, P. B., Mccullough, S. J., and Saunders, K. J. (2020). Estimation of ocular axial length from conventional optometric measures. Cont. Lens Anterior Eye 43, 18–20. doi:10.1016/j.clae.2019.11.005
Pang, K., Lennikov, A., and Yang, M. (2021). Hypoxia adaptation in the cornea: Current animal models and underlying mechanisms. Anim. Model Exp. Med. 4, 300–310. doi:10.1002/ame2.12192
Plakitsi, A., O'donnell, C., Miranda, M. A., Charman, W. N., and Radhakrishnan, H. (2011). Corneal biomechanical properties measured with the Ocular Response Analyser in a myopic population. Ophthalmic Physiol. Opt. 31, 404–412. doi:10.1111/j.1475-1313.2011.00852.x
Queiros, A., Amorim-De-Sousa, A., Fernandes, P., Ribeiro-Queiros, M. S., Villa-Collar, C., and Gonzalez-Meijome, J. M. (2022). Mathematical estimation of axial length increment in the control of myopia progression. J. Clin. Med. 11, 6200. doi:10.3390/jcm11206200
Rada, J. A., Shelton, S., and Norton, T. T. (2006). The sclera and myopia. Exp. Eye Res. 82, 185–200. doi:10.1016/j.exer.2005.08.009
Roberts, C. J. (2014). Concepts and misconceptions in corneal biomechanics. J. Cataract. Refract Surg. 40, 862–869. doi:10.1016/j.jcrs.2014.04.019
Roberts, C. J., Liu, J., and Ebook Central Academic, C. (2016). Corneal biomechanics: From theory to practice. Amsterdam: Kugler Publications.
Sedaghat, M. R., Momeni-Moghaddam, H., Azimi, A., Fakhimi, Z., Ziaei, M., Danesh, Z., et al. (2020). Corneal biomechanical properties in varying severities of myopia. Front. Bioeng. Biotechnol. 8, 595330. doi:10.3389/fbioe.2020.595330
Song, Y., Wu, D., Shen, M., Wang, L., Wang, C., Cai, Y., et al. (2022). Measuring human corneal stromal biomechanical properties using tensile testing combined with optical coherence tomography. Front. Bioeng. Biotechnol. 10, 882392. doi:10.3389/fbioe.2022.882392
Wong, H. B., Machin, D., Tan, S. B., Wong, T. Y., and Saw, S. M. (2010). Ocular component growth curves among Singaporean children with different refractive error status. Invest. Ophthalmol. Vis. Sci. 51, 1341–1347. doi:10.1167/iovs.09-3431
Keywords: spherical equivalent error, axial length, dynamic corneal response, stress-strain index, myopia
Citation: Ren Q, Chu Z, Cui W, Cheng L, Su W, Cheng H and Wu J (2023) Effect of corneal stiffness decrease on axial length elongation in myopia determined based on a mathematical estimation model. Front. Bioeng. Biotechnol. 11:1145032. doi: 10.3389/fbioe.2023.1145032
Received: 15 January 2023; Accepted: 31 March 2023;
Published: 10 April 2023.
Edited by:
Sabine Kling, ETH Zürich, SwitzerlandReviewed by:
Rui B. Ruben, Polytechnic Institute of Leiria, PortugalJunjie Wang, Wenzhou Medical University, China
Copyright © 2023 Ren, Chu, Cui, Cheng, Su, Cheng and Wu. This is an open-access article distributed under the terms of the Creative Commons Attribution License (CC BY). The use, distribution or reproduction in other forums is permitted, provided the original author(s) and the copyright owner(s) are credited and that the original publication in this journal is cited, in accordance with accepted academic practice. No use, distribution or reproduction is permitted which does not comply with these terms.
*Correspondence: Jie Wu, d3VqaWVAc2RmbXUuZWR1LmNu
†These authors have contributed equally to this work and share first authorship