 Hao Huang1†
 Shuang Li1†Xianjing Han1Yule Zhang2
 Lingfeng Gao3Xiangjiang Wang1*Guiqing Wang1*Zhi Chen2*
- 1Department of Orthopaedics, The Sixth Affiliated Hospital of Guangzhou Medical University, Qingyuan People’s Hospital, Guangzhou, China
- 2Key Laboratory of Optoelectronic Devices and Systems of Ministry of Education and Guangdong Province, Collage of Physics and Optoelectronics Engineering, Shenzhen University, Shenzhen, China
- 3College of Material Chemistry and Chemical Engineering, Key Laboratory of Organosilicon Chemistry and Material Technology, Ministry of Education, Hangzhou Normal University, Hangzhou, Zhejiang, China
Osteoarthritis (OA) has become a serious problem to the human society for years due to its high economic burden, disability, pain, and severe impact on the patient’s lifestyle. The importance of current clinical imaging modalities in the assessment of the onset and progression of OA is well recognized by clinicians, but these modalities can only detect OA in the II stage with significant structural deterioration and clinical symptoms. Blood vessel formation induced by vascular endothelial growth factor (VEGF) occurs in the early stage and throughout the entire course of OA, enables VEGF relating gene sequence to act as a biomarker in the field of early diagnosis and monitoring of the disease. Here in, a facile rapid detection of VEGF relating ssDNA sequence was developed, in which manganese-based zeolitic imidazolate framework nanoparticles (Mn-ZIF-NPs) were synthesized by a simple coprecipitation strategy, followed by the introduction and surficial absorption of probe ssDNAs and the CRISPR/Cas12a system components. Furthermore, fluorescence experiments demonstrated that the biosensor displayed a low detection limit of 2.49 nM, a good linear response to the target ssDNA ranging from 10 nM to 500 nM, and the ability of distinguishing single nucleotide polymorphism. This finding opens a new window for the feasible and rapid detection of ssDNA molecules for the early diagnose of OA.
1 Introduction
As the sixth leading cause of disability in the world, OA affects nearly 240 million people worldwide. Approximately 20% of the world’s population will be over 60 years old by 2050 according to the report of World Health Organization (WHO), in which 15% will have symptomatic OA, and one-third of these people will be severely disabled (Nelson, 2018). As a kind of chronic, debilitating joint disease, OA goes beyond anatomical and physiological degenerative alterations caused by cellular stress and degradation of the extracellular cartilage matrix begin with micro-and macro-injuries, which can be mainly characterized by joint degeneration with gradual loss of joint cartilage, bone hypertrophy, changes in the synovial membrane, and mechanical dysfunction (Gardner, 1983; Cicuttini and Wluka, 2014; Tiulpin et al., 2018; Abedin et al., 2019; Chen et al., 2019). Since OA is a very common disease, the early diagnose of it is of crucial importance for the purpose of providing affected patients with proper preventive treatments to delay the progression of OA disease, improve the long-term life quality of these patients, and alleviate the medical burden of human society (Chu et al., 2010; Chu et al., 2012; Iolascon et al., 2017). However, current clinical imaging techniques such as computed tomography (CT) and magnetic resonance imaging (MRI) can only detect OA in the II stage with significant structural deterioration and clinical symptoms (Möller et al., 2008; Braun and Gold, 2012; Roemer et al., 2014), while some biomolecular changes have already taken place prior to this irreversible stage (Debabrata and Sandell Linda, 2011). Articular cartilage (AC) is a layer of transparent cartilage primarily composed of cartilage matrix and chondrocytes located within the matrix lacunae, without any existence of blood vessels or lymphatic vessels. Oxygen molecules and nutrients needed by chondrocytes are supplied by surrounding synovial fluid and the underlying subchondral bone through the diffusion effect. Throughout one’s lifetime, AC maintains a hypoxic microenvironment, which can promote the proliferation and differentiation of chondrocytes and then benefit the synthesis of extracellular matrix. However, blood vessel formation is commonly observed in the AC of OA patients with higher expression level of VEGF in synovial fluid and blood. VEGF can activate endothelial cells and promote their proliferation and differentiation, thereby facilitating the generation of blood vessels in the synovium. Consequently, the formed vascular plexus can cover the surface of AC, preventing the chondrocytes from receiving nutrients from the synovial fluid, then lead to the degradation and destruction of AC (Jansena et al., 2012; Quan et al., 2014; Hamilton et al., 2016; Nagao et al., 2017). As mentioned above, the key role of VEGF playing in the development and progression of OA enables its relating gene sequence to act as a diagnostic marker of the disease.
Clustered regularly interspaced short palindromic repeats (CRISPR)-Cas12a systems can recognize and indiscriminately cleave single-stranded DNA (ssDNA) upon recognition of the complementary DNA by a unique trans-cleavage effect (Chen et al., 2018; Pickar-Oliver and Gersbach, 2019). With the help of this unique trans-cleavage effect of Cas12a protein, CRISPR/Cas12a systems can bring better specificity and efficiency to the field of rapid and simple detection based on fluorescence analysis, which inspired our research (Li et al., 2018; Zhou et al., 2018; Xue et al., 2020; Chen et al., 2022; Wu et al., 2022). Herein, CRISPR/Cas12a and Mn-ZIF-NPs were synergistically driven to build a novel fluorescence-on type biosensor to achieve rapid detection of the VEGF gene sequences. Firstly, Mn-ZIF-NPs was prepared by a facile coprecipitation strategy (Scheme 1a). After that, the cyanine5 (Cy5)-labelled probe 5′-amino ssDNAs were added and adsorbed to the surface of as-prepared Mn-ZIF-NPs via the electrostatic interaction between the positive amino groups of probe ssDNAs and the negative surface of Mn-ZIF-NPs. The close proximity of probe DNA-Cy5 and Mn-ZIF-NPs led to fluorescence quenching of the dye, as the result of the fluorescence resonance energy transfer (FRET) from Cy5 to Mn-ZIF-NPs. After the addition of target VEGF-related DNA, the crRNA formed a duplex with this complementary ssDNA strand by hybridization, and then bound with the Cas12a protein to form a Cas12a-crRNA/ssDNA complex, which leads to the cleavage of probe DNA and the visual fluorescence recovering (Scheme 1b).
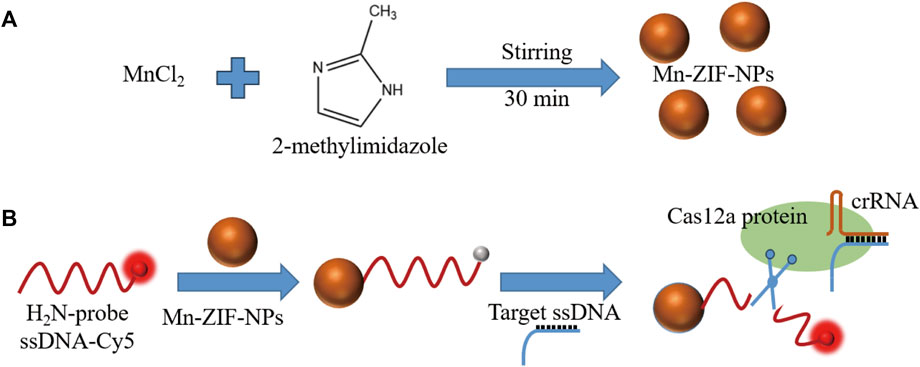
SCHEME 1. (A). Fabrication and (B). schematic diagram of Mn-ZIF-NPs-based CRISPR/Cas12a fluorescent-on type VEGF-related ssDNA sensing nanoplatform.
2 Materials and methods
2.1 Materials and instruments
The polyvinylpyrrolidone (PVP24000) was purchased from Aladdin Reagents. The manganese chloride tetrahydrate (MnCl2·4H2O, 99.99%) and 2-methylimidazole (98%) were both purchased from Macklin Inc. Oligonucleotides were purchased from Tsingke Biotech. Co. Ltd. (Beijing, China) with the sequence information shown in Table 1. Ultrapure water (18.25 MΩ⋅cm, 25°C) was used to prepare all solutions. All other chemicals used in this study were of analytical reagent grade and were used without further purification. The CRISPR/Cas12a assay kit purchasing from EZassay Biotech. Co. Ltd. (Shenzhen, China) was used in accordance with the manufacturer’s guidelines unless otherwise stated. The ultrasonication cleaner, Elmasonic S 60, was purchased from Elma Co. Ltd., Germany. The centrifuge used in this work was a Sigma 3-30k (Sigma, Germany). Fluorescence photos were taken by Quantum ST5 (Vilber Lourmat Co. Ltd., France) and the corresponding quantitative measurements were performed with an LightCycler 480II (Roche Ltd., Switzerland). HRTEM images and EDS Mapping data were both taken under a Talos F200X microscope (FEI Electronics, U.S.A.). AFM images were obtained with Demension icon and XRD data were collected using a D8 Advance instrument (both Bruker, Germany). UV-VIS-NIR curve was measured by UH4150 (Hitachi, Japan). Zeta potential was taken by an Zetasizer Nano ZS90 (Malvern, England).
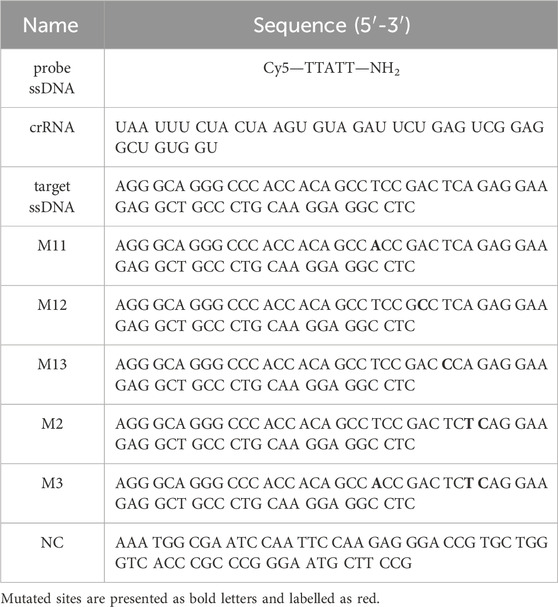
TABLE 1. Sequence information of oligonucleotides used in the experiments, and mutated sites are presented as bold letters and labelled as red.
2.2 Material preparation
In brief, 500 mg PVP24000 was dissolved in 20 mL ultrapure water with continuous stirring of 500 rpm, followed by the addition of MnCl2·4H2O aqueous solution (1 M, 500 μL) and stirring for 3 min. Meanwhile, 2-methylimidazole aqueous solution (1 M, 1 mL) was diluted into 20 mL ultrapure water and then this diluted solution was injected into the abovementioned MnCl2·4H2O aqueous solution, followed by another stirring for 30 min. The resulting suspension was collected and centrifuged at 25000 × g for 2 min, and the precipitation was been washed with ultrapure water for several times. Finally, the as-prepared product was re-dispersed into ultrapure water, then was sealed and stored in a dark environment at room temperature.
2.3 Fluorescent assay of DNA detection
The fluorescent measurements were carried out in 8-strip PCR tubes at 37°C. At the first, 10× reaction buffer (2 μL), Cas12a protein (2 μM, 1 μL) and crRNA (4 μM, 1 μL) were mixed in RNase-free water and incubated at 37°C for 15 min, followed by the addition of various concentration of VEGF-related target ssDNA or mismatch ssDNA (1 μL) and then another incubation at 37°C for 15 min. After that, various concentration of Mn-ZIF-NPs and probe Cy5-ssDNA-NH2 (10 μM, 1 μL) were added with the final volume of 20 μL filled with RNase-free water. Finally, the fluorescence measurement was performed at 37°C.
3 Results and discussions
3.1 Material characterization
The HRTEM images (Figures 1A, B) of the Mn-ZIF-NPs reveal irregular nanocrystals with a mean diameter of about 50 nm and clear lattice fringes of 0.267 nm. The AFM images (Figures 1C, D) indicate that the average thickness of NPs was less than 3.5 nm. EDS element mapping in Figures 1E, F confirms the uniformly distribution of Mn(red), O(yellow), C(green) and N(blue) elements inside the NPs.
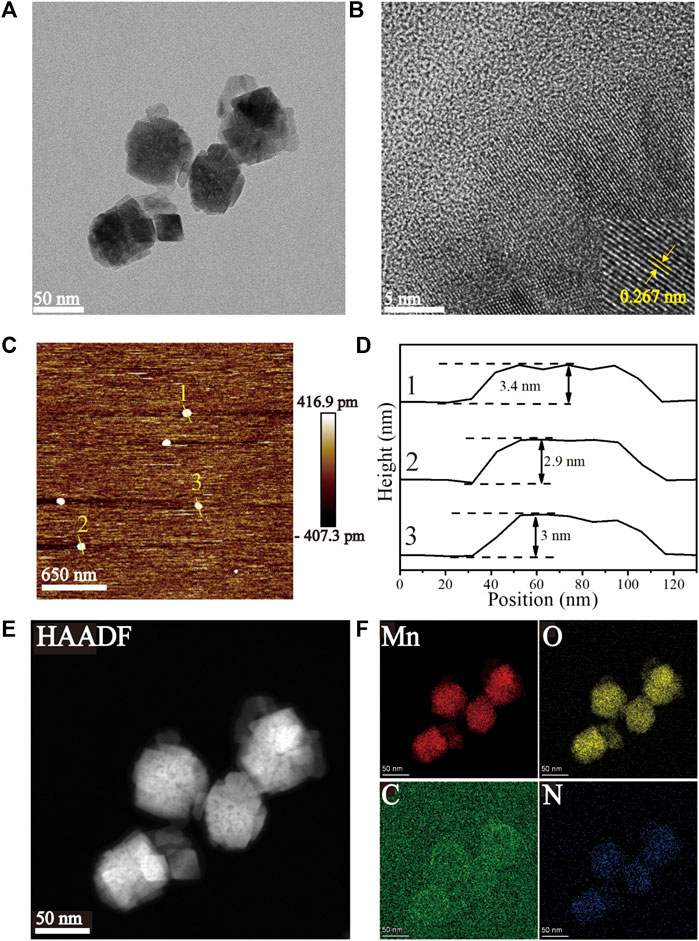
FIGURE 1. Characterization of the as-prepared Mn-ZIF-NPs. (A, B) HRTEM images, (C, D) AFM images, (E, F) EDS Mapping images.
Mn-ZIF-NPs were subjected to XPS analysis to find the elemental states and the result is shown in Figures 2A–D. The observed Mn 3s binding energy values are 83.2 eV and 88.7 eV with two multiple split components caused by coupling of non-ionized 3s electron with 3d valence-band electrons. The ΔE of 5.5 eV is in the range between 6.0 eV (MnO, Mn2+) and 5.3 eV (Mn2O3, Mn3+), indicating that the Mn was observed in multiple oxidation states in the imidazolate framework (Biesinger et al., 2011). Besides, the carbon functionalities like C-C, C-O-C, and O-C=O were observed at 283.4 eV, 285.4 eV and 288 eV, respectively (Shchukarev and Korolkov, 2004). Furthermore, the O 1s spectrum of 529.5 eV and 530.4 eV correspond to Mn−O and C=O/Mn-OH, respectively (Figure 2D). The N 1s XPS spectrum in Figure 2E reveals the existence of 399.7 eV corresponding to C-N. In Figure 2F, the major Raman peak in the spectra of Mn-ZIF-NPs at 642.8 cm−1 can be ascribed to the Mn2+/3+ coordinated with the imidazolate framework. As is shown in Figure 2G, the X-ray diffraction (XRD) peaks of Mn-ZIF-NPs well indexed to coincide with other work (Sankar Selvasundarasekar et al., 2022). The relative high absorption intensity in the VIS region enables the Mn-ZIF-NPs to efficiently quench the fluorescence of our probe ssDNA (Figure 2H), while the zeta potential peak of Mn-ZIF-NPs at −3.26 mV makes the surface absorption of probe DNA possible.
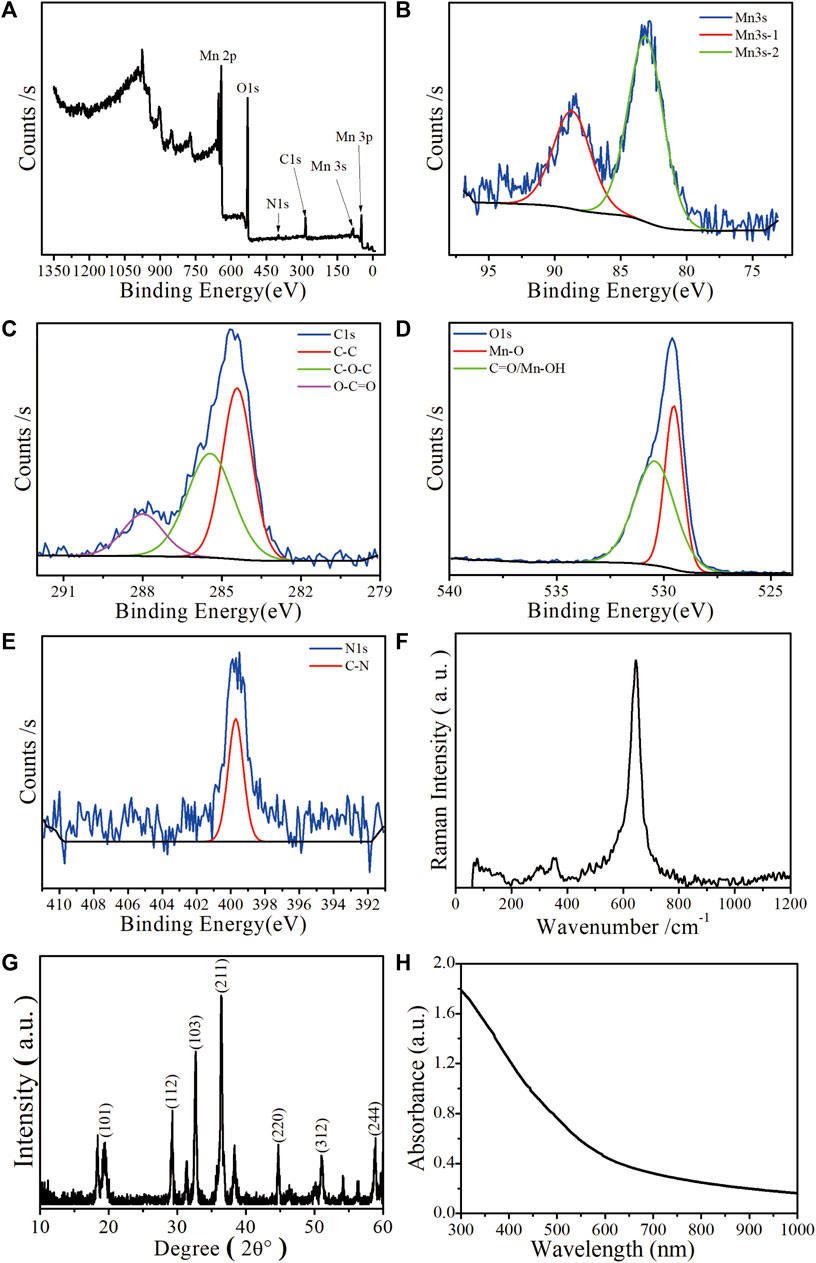
FIGURE 2. Characterization of the as-prepared Mn-ZIF-NPs. (A) XPS spectrum, (B) Mn 3s, (C) C1s, (D) O1s, (E) N1s. (F) Raman spectrum, (G) XRD pattern and (H) UV-VIS-NIR curve.
3.2 Optimization of experimental conditions
The concentration of probe ssDNA and Mn-ZIF-NPs were optimized to make the performance of the biosensor best. The tested probe ssDNA concentration varied from 250 to 1,000 nM, and three concentrations of Mn-ZIF-NPs (750, 500 and 250 μg/mL) were compared after incubation with target VEGF-related ssDNA (100 nM) for 15 min at 37°C. Figure 3A shows the fluorescence curve of probe ssDNA in the presence of Mn-ZIF-NPs at different concentrations, illustrating that the quenching efficiency of probe ssDNA become higher as the concentration of Mn-ZIF-NPs increased, possibly due to the increased amount of probe ssDNA absorbed on Mn-ZIF-NPs. The results for target ssDNA detection were presented in Figures 3B–D. When the concentration of Mn-ZIF-NPs was 750 μg/mL, no linear interval for target ssDNA detection can be observed. Figure 3C shows that there is a linear relationship between ΔF (ΔF = F/F0—1, F0 is the fluorescence intensity of the probe Cy5-ssDNA, F is the fluorescence intensity of the probe Cy5-ssDNA/Mn-ZIF-NP complex after incubating with different concentrations of target ssDNA) and CssDNA in the concentration range of 10 to 500 nM for 500 nM probe ssDNA, 20 to 100 nM for 250 nM probe ssDNA and 10 to 100 nM for 1,000 nM probe ssDNA when the concentration of Mn-ZIF-NPs was 500 μg/mL, respectively. However, when the concentration of Mn-ZIF-NPs further reduces to 250 μg/mL, no linear interval for target ssDNA detection can be observed again (Figure 3D). With the aim of getting clear linear relationship with widest detection range, 500 nM of probe ssDNA and 500 μg/mL of Mn-ZIF-NPs were employed for target ssDNA detection.
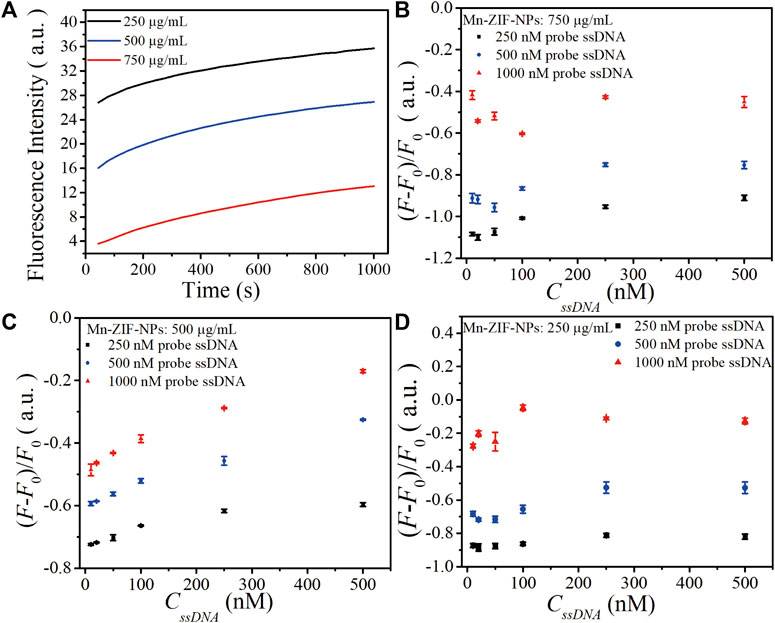
FIGURE 3. (A). The fluorescence curve of probe ssDNA in the presence of Mn-ZIF-NPs at different concentrations (750, 500 and 250 μg/mL) after incubation with target VEGF-related ssDNA (100 nM) for 15 min at 37°C. (B) The calibration relationship of ΔF versus the concentration of target ssDNA (CssDNA) when the Mn-ZIF-NPs concentration was 750 μg/mL. (C) The calibration relationship of ΔF versus CssDNA when the Mn-ZIF-NPs concentration was 500 μg/mL. (D) The calibration relationship of ΔF versus CssDNA when the Mn-ZIF-NPs concentration was 250 μg/mL. The curves represent the average values of three wells with error bars showing the standard deviation of three wells at each condition.
3.3 DNA sensing performance of Mn-ZIF-NPs
Figure 4A depicts fluorescence photos of the probe Cy5-ssDNA solution, as the strong fluorescence dramatically quenched after the addition of Mn-ZIF-NPs with the final concentration of 500 μg⋅mL−1, confirming the efficient quenching capability of the Mn-ZIF-NPs. As shown in Figure 4C, the addition of the target VEGF related ssDNA followed by a total of 30 min’ incubation at 37°C leads to obvious fluorescence recovery even can be directly observed by naked eyes, which is primarily due to the cleavage of probe ssDNA by Cas12a-crRNA/target ssDNA complex and the releasing of Cy5 from the surface of Mn-ZIF-NPs.
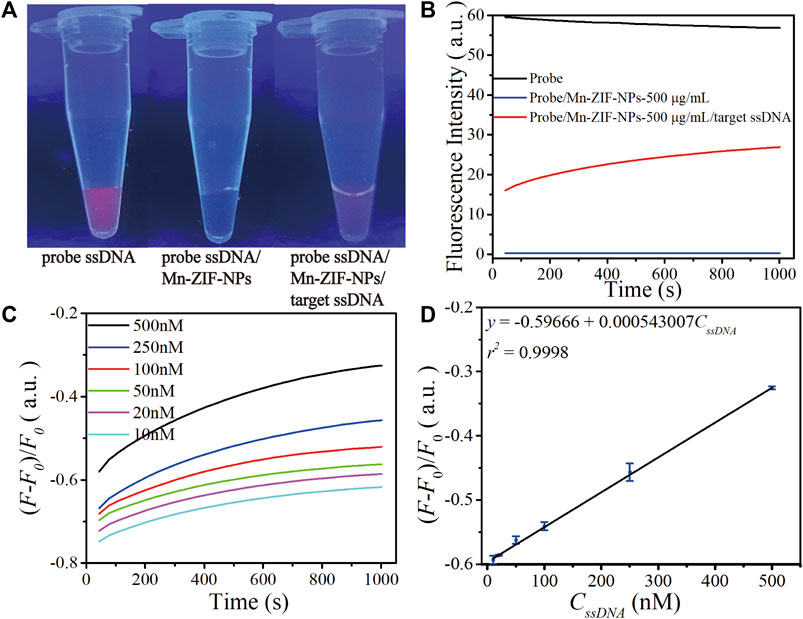
FIGURE 4. Performance of as-prepared ssDNA sensor. (A) Fluorescence image of the CRISPR/Cas12a system including probe Cy5-ssDNA solution (500 nM) before and after mixing with Mn-ZIF-NPs (500 μg⋅mL−1), the Cy5-ssDNA/Mn-ZIF-NP complex after incubation with target VEGF-related ssDNA (100 nM) for 15 min at 37°C. (B) Corresponding fluorescence spectra of the probe Cy5-ssDNA (black curve), Cy5-ssDNA/Mn-ZIF-NPs (blue curve) and Cy5-ssDNA/target ssDNA/Mn-ZIF-NPs (red curve). (C) The fluorescence emission spectra of the probe ssDNA after incubating with varying concentrations of target ssDNA at 10, 20, 50, 100, 250 and 500 nM for a total of 30 min. (D) The calibration curve of OD versus CssDNA (10–500 nM). The curves represent the average values of three wells with error bars showing the standard deviation of three wells at each concentration.
To validate the abovementioned naked-eyes observation more precisely, we performed the fluorescence spectroscopy measurement shown in Figure 4B. The initial value of strong emission of probe Cy5-ssDNA at 670 nm is 56.8 a.u. (black curve). After the addition of Mn-ZIF-NPs, the fluorescence intensity is rapidly quenched to 0.29 a.u. (blue curve). Due to the cleavage of probe ssDNA by Cas12a-crRNA/target ssDNA complex, the fluorescence intensity is greatly increased to 26.9 a.u. after the addition of target ssDNA (red curve).
To examine the sensitivity of this nanoplatform, different concentrations of ssDNA were introduced and then a progressive increase in the fluorescence intensity at λ = 670 nm with increasing ssDNA concentration is observed (Figure 4C), which exhibits a linear response in the concentration range of 10 nM–500 nM. The linear regression equation is ΔF = −0.59666 + 0.000543007⋅CssDNA (nM, r2 = 0.9998). The detection limit is 2.49 nM as estimated according to the 3σ rule (Figure 4D).
To study the selectivity of this platform, a comparison of the fluorescence recovery responses of the target ssDNA, mismatched ssDNA (M11, M12, M13, M2, M3) and non-complementary ssDNA (NC) was performed. As shown in Figure 5, the F/F0 value obtained upon the incubation of 100 nM target ssDNA, M11, M12, M13, M2, M3 and NC are 0.477, 0.266, 0.256, 0.264, 0.262, 0.252 and 0.218, respectively. The fluorescence intensity ratios of all the mismatched group don’t show obvious differences, which demonstrated that our biosensor could distinguish the target ssDNA from single-base mismatched or non-complementary ones.
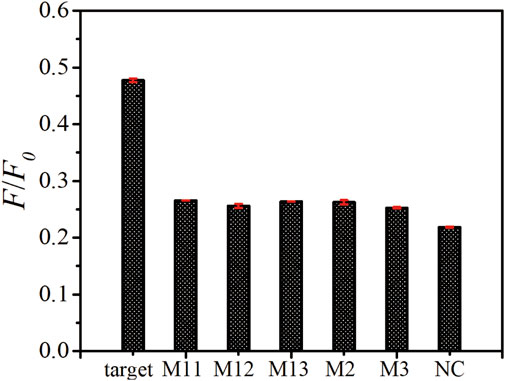
FIGURE 5. Specificity assay of as-prepared ssDNA sensor. The fluorescence emission spectra upon the addition of target ssDNA, M11, M12, M13, M2, M3, and NC with the same concentration of 100 nM. The error bars represent the standard deviation of three wells under the same conditions.
3.4 Additional specificity test
We also tested the responses of biosensor after mixed target ssDNA with M11, M2, M3 and NC, respectively. In our experiments, the detected concentrations of “100 nM target”, “100 nM target mixed with 40 nM M11”, “100 nM target mixed with 40 nM M2”, “100 nM target mixed with 40 nM M3” and “100 nM target mixed with 40 nM NC” are calculated by the linear equation of biosensor. As can be seen from Table 2, the accuracies are in the range of 90% to 110%, which demonstrated that the signal of target ssDNA remains almost the same in the presence of other ssDNAs. The results further verify the specificity of the biosensor.
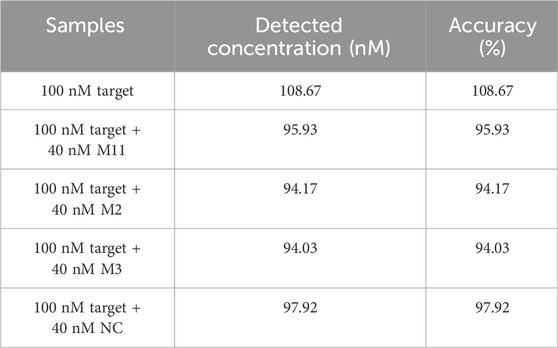
TABLE 2. The responses of biosensor to mixed samples.
4 Conclusion
In summary, we built a simple and fast CRISPR/Cas12a-based VEGF related ssDNA detection nanoplatform by employing Mn-ZIF-NPs prepared through facile nanoprecipitation strategy as fluorescence quenching material. The biosensor had a linear range of 10–500 nM, a detection limit of 2.49 nM, with excellent specificity of single nucleotide polymorphism. It is therefore envisaged that our research paves the way for further investigations and applications of CRISPR/Cas12a system and nanomaterials in fluorescence quenching-based biosensing for biomedical research and particular the early clinical diagnostics of OA.
Data availability statement
The datasets presented in this study can be found in online repositories. The names of the repository/repositories and accession number(s) can be found in the article.
Author contributions
HH: Conceptualization, Formal Analysis, Investigation, Methodology, Project administration, Resources, Software, Supervision, Validation, Visualization, Writing–original draft, Writing–review and editing. SL: Data curation, Formal Analysis, Investigation, Supervision, Validation, Visualization, Writing–review and editing. XH: Data curation, Formal Analysis, Investigation, Resources, Software, Validation, Writing–review and editing. YZ: Data curation, Validation, Writing–review and editing, Formal Analysis, Investigation, Software. LG: Funding acquisition, Supervision, Validation, Writing–review and editing, Conceptualization, Data curation, Methodology. XW: Funding acquisition, Supervision, Validation, Writing–review and editing. GW: Supervision, Validation, Writing–review and editing, Funding acquisition. ZC: Conceptualization, Data curation, Formal Analysis, Methodology, Project administration, Resources, Supervision, Validation, Visualization, Writing–review and editing.
Funding
The author(s) declare financial support was received for the research, authorship, and/or publication of this article. This research was funded by the State Key Research Development Program of China (2022YFB3207204), the Basic and Applied Basic Research Foundation of Guangdong Province-Regional Joint Fund-Key Projects (2019B1515120043 and 2022B1515120012), Science and Technology Innovation Commission of Shenzhen (JCYJ20190814110207603), Guangdong Medical Science and Technology Research Fund (A2023421 and B2023203), the special funds of the clinical research from the Sixth Affiliated Hospital of Guangzhou Medical University, Qingyuan People’s Hospital (QYRYCRC2023010, PA1c1ee205380526 and 200808154561081), and the Hangzhou Normal University “Project to the summit” chemical discipline, the Ministry of Education Key Laboratory Open Scientific Projects Fund (KFJJ2023007).
Acknowledgments
We acknowledge the kindly support from Prof. Han Zhang in Shenzhen University. We also acknowledge the support from Instrumental Analysis Center of Shenzhen University (Xili Campus). We also acknowledge the assistance on HRTEM and EDS Mapping measurements received from the Electron Microscope Center of the Shenzhen University, XRD measurements received from Suzhou Deyo Bot Advanced Materials Co., Ltd. AFM, XPS, UV-VIS-NIR, Raman and Zeta potential measurements received from Fujian Wuyan Liuce New Material Technology Co., Ltd.
Conflict of interest
The authors declare that the research was conducted in the absence of any commercial or financial relationships that could be construed as a potential conflict of interest.
Publisher’s note
All claims expressed in this article are solely those of the authors and do not necessarily represent those of their affiliated organizations, or those of the publisher, the editors and the reviewers. Any product that may be evaluated in this article, or claim that may be made by its manufacturer, is not guaranteed or endorsed by the publisher.
References
Abedin, J., Antony, J., McGuinness, K., Moran, K., O’Connor, N. E., Rebholz-Schuhmann, D., et al. (2019). Predicting knee osteoarthritis severity: comparative modeling based on patient’s data and plain X-ray images. Sci. Rep. 9, 5761. doi:10.1038/s41598-019-42215-9
Biesinger, M. C., Payne, B. P., Grosvenor, A. P., Lau, L. W. M., Gerson, A. R., and Smart, R.St.C. (2011). Resolving surface chemical states in XPS analysis of first row transition metals, oxides and hydroxides: Cr, Mn, Fe, Co and Ni. Appl. Surf. Sci. 257, 2717–2730. doi:10.1016/j.apsusc.2010.10.051
Braun, H. J., and Gold, G. E. (2012). Diagnosis of osteoarthritis: imaging. Bone 51, 278–288. doi:10.1016/j.bone.2011.11.019
Chen, J. S., Ma, E., Harrington, L. B., Da Costa, M., Tian, X., Palefsky, J. M., et al. (2018). CRISPR-Cas12a target binding unleashes indiscriminate single-stranded DNase activity. Science 360, 436–439. doi:10.1126/science.aar6245
Chen, P., Gao, L., Shi, X., Allen, K., and Yang, L. (2019). Fully automatic knee osteoarthritis severity grading using deep neural networks with a novel ordinal loss. Comput. Med. Imaging And Graph. 75, 84–92. doi:10.1016/j.compmedimag.2019.06.002
Chen, Z., Li, J., Li, T., Fan, T., Meng, C., Li, C., et al. (2022). A CRISPR/Cas12a-empowered surface plasmon resonance platform for rapid and specific diagnosis of the Omicron variant of SARS-CoV-2. Natl. Sci. Rev. 9 (8), nwac104. doi:10.1093/nsr/nwac104
Chu, C. R., Williams, A., Tolliver, D., Kwoh, C. K., Bruno, S., and Irrgang, J. J. (2010). Clinical optical coherence tomography of early articular cartilage degeneration in patients with degenerative meniscal tears. Arthritis Rheumatol. 62, 1412–1420. doi:10.1002/art.27378
Chu, C. R., Williams, A. A., Coyle, C. H., and Bowers, M. E. (2012). Early diagnosis to enable early treatment of pre-osteoarthritis. Arthritis Res. Ther. 14, 212. doi:10.1186/ar3845
Cicuttini, F. M., and Wluka, A. E. (2014). Osteoarthritis: is OA a mechanical or systemic disease? Nat. Rev. Rheumatol. 10, 515–516. doi:10.1038/nrrheum.2014.114
Debabrata, P., and Sandell Linda, J. (2011). Recent advances in biomarkers in osteoarthritis. Curr. Opin. Rheumatology 23 (5), 465–470. doi:10.1097/bor.0b013e328349a32b
Gardner, D. L. (1983). The nature and causes of osteoarthrosis. Br. Med. J. 286 (6363), 418–424. doi:10.1136/bmj.286.6363.418
Hamilton, J. L., Nagao, M., Levine, B. R., Chen, Di, Olsen, B. R., and Hee-Jeong, Im (2016). Targeting VEGF and its receptors for the treatment of osteoarthritis and associated pain. J. Bone Mineral Res. 31 (5), 911–924. doi:10.1002/jbmr.2828
Iolascon, G., Gimigliano, F., Moretti, A., de Sire, A., Migliore, A., Brandi, M. L., et al. (2017). Early osteoarthritis: how to define, diagnose, and manage. A systematic review. Eur. Geriatr. Med. 8, 383–396. doi:10.1016/j.eurger.2017.07.008
Jansena, H., Mefferta, R. H., Birkenfeldb, F., Petersenc, W., and Pufed, T. (2012). Detection of vascular endothelial growth factor (VEGF) in moderate osteoarthritis in a rabbit model. Ann. Anat. 194, 452–456. doi:10.1016/j.aanat.2012.01.006
Li, S., Cheng, Q., Wang, J., Li, X., Zhang, Z., Gao, S., et al. (2018). CRISPR-Cas12a-assisted nucleic acid detection. Cell Discov. 4, 20–24. doi:10.1038/s41421-018-0028-z
Möller, I., Bong, D., Naredo, E., Filippucci, E., Carrasco, I., Moragues, C., et al. (2008). Ultrasound in the study and monitoring of osteoarthritis. Osteoarthr. Cartil. 16, S4–S7. doi:10.1016/j.joca.2008.06.005
Nagao, M., JohnHamilton Ranjan, L.K., Berendsen, A. D., Berendsen, A. D., Duan, X., Cheong, C. W., et al. (2017). Vascular endothelial growth factor in cartilage development and osteoarthritis. Sci. Rep. 7, 13027. doi:10.1038/s41598-017-13417-w
Nelson, A. E. (2018). Osteoarthritis year in review 2017: clinical. Clin. Osteoarthr. And Cartil. 26, 319–325. doi:10.1016/j.joca.2017.11.014
Pickar-Oliver, A., and Gersbach, C. A. (2019). The next generation of CRISPR-Cas technologies and applications. Nat. Rev. Mol. Cell Biol. 20, 490–507. doi:10.1038/s41580-019-0131-5
Quan, Y., Sun, L., Li, J.-J., and Chun-Hou, A. (2014). Elevated VEGF levels contribute to the pathogenesis of osteoarthritis. BMC Musculoskelet. Disord. 15, 437. doi:10.1186/1471-2474-15-437
Roemer, F. W., Eckstein, F., Hayashi, D., and Ali, G. (2014). The role of imaging in osteoarthritis. Best Pract. Res. Clin. Rheumatology 28, 31–60. doi:10.1016/j.berh.2014.02.002
Sankar Selvasundarasekar, S., Bijoy, T. K., Kumaravel, S., Karmakar, A., Madhu, R., bera, K., et al. (2022). Effective Formation of a Mn-ZIF-67 nanofibrous network via electrospinning: an active electrocatalyst for OER in alkaline medium. ACS Appl. Mater. Interfaces 14, 46581–46594. doi:10.1021/acsami.2c12643
Shchukarev, A. V., and Korolkov, D. V. (2004). XPS Study of group IA carbonates. Central Eur. J. Chem. 2, 347–362. doi:10.2478/bf02475578
Tiulpin, A., Jėrôme, T., Rahtu, E., Lehenkari, P., and Saarakkala, S. (2018). Automatic knee osteoarthritis diagnosis from plain radiographs: a deep learning-based approach. Sci. Rep. 8, 1727. doi:10.1038/s41598-018-20132-7
Wu, C., Chen, Z., Li, C., Hao, Y., Tang, Y., Yuan, Y., et al. (2022). CRISPR-Cas12a-Empowered electrochemical biosensor for rapid and ultrasensitive detection of SARS-CoV-2 delta variant. Nano-Micro Lett. 14 (1), 159. doi:10.1007/s40820-022-00888-4
Xue, T., Reddy Bongu, S., Huang, H., Liang, W., Wang, Y., Zhang, F., et al. (2020). Ultrasensitive detection of microRNA using a bismuthene-enabled fluorescence quenching biosensor. Chem. Commun. 56, 7041–7044. doi:10.1039/d0cc01004a
Keywords: osteoarthritis, VEGF, photoluminescence, CRISPR/Cas12a, Mn-ZIF
Citation: Huang H, Li S, Han X, Zhang Y, Gao L, Wang X, Wang G and Chen Z (2024) A rapid VEGF-gene-sequence photoluminescence detector for osteoarthritis. Front. Bioeng. Biotechnol. 12:1338901. doi: 10.3389/fbioe.2024.1338901
Received: 15 November 2023; Accepted: 15 January 2024;
Published: 06 February 2024.
Edited by:
Jaesung Jang, Ulsan National Institute of Science and Technology, Republic of KoreaReviewed by:
Wan Jiayu, Chinese Academy of Agricultural Sciences, ChinaSuveen Kumar, University of Delhi, India
Copyright © 2024 Huang, Li, Han, Zhang, Gao, Wang, Wang and Chen. This is an open-access article distributed under the terms of the Creative Commons Attribution License (CC BY). The use, distribution or reproduction in other forums is permitted, provided the original author(s) and the copyright owner(s) are credited and that the original publication in this journal is cited, in accordance with accepted academic practice. No use, distribution or reproduction is permitted which does not comply with these terms.
*Correspondence: Xiangjiang Wang, MzAzOTE2NjVAMTYzLmNvbQ==; Guiqing Wang, Z3VpcWluZ3dhbmcwNzYzQDE2My5jb20=; Zhi Chen, Y2hlbnpoaUBzenUuZWR1LmNu
†These authors have contributed equally to this work