 Aadarsh Mishra
 Robin O. Cleveland
- Institute of Biomedical Engineering, Department of Engineering Science, University of Oxford, Oxford, United Kingdom
The rheological properties of porcine heart, kidney, liver and brain were measured using dynamic oscillatory shear tests over a range of frequencies and shear strains. Frequency sweep tests were performed from 0.1 Hz to a maximum of 9.5 Hz at a shear strain of 0.1%, and strain sweep tests were carried out from 0.01% to 10% at 1 Hz. The effect of pre-compression of samples up to 10% axial strain was considered. The experimental measurements were fit to a Semi-Fractional Kelvin Voight (S-FKV) model. The model was then used to predict the stress relaxation in response to a step strain of 0.1%. The prediction was compared to experimental relaxation data for the porcine organ samples, and the results agreed to within 30%. In conclusion, this study measured the rheological properties of porcine organs and used a fractional viscoelastic model to describe the response in frequency and time domain.
1 Introduction
Biological materials exhibit time and history-dependent stress-strain viscoelastic behaviour (Fung, 1967; Nasseri et al., 2002). In the frequency domain, soft tissues exhibit a power law behaviour which suggests a broad range of relaxation processes that are likely present (Bonfanti et al., 2020). Fractional calculus can be used to model the power-law behaviour of linear viscoelastic models (Torvik and Bagley, 1984; Bagley and Torvik, 1986; Suki et al., 1994; Pritz, 1996; Fabry et al., 2001; Rossikhin and Shitikova, 2001) using elements known as springpots or Scott-Blair elements (Craiem and Armentano, 2006). Fractional viscoeleastic models have been applied to materials such as rubber, polymers and gels (Alcoutlabi and Martinez-Vega, 1998; Chen et al., 2004; Kobayashi et al., 2017; Aime et al., 2018; Bouzid et al., 2018; Kaplan et al., 2019; Katsourinis and Kontou, 2019; Bonfanti et al., 2020) and tissue such as the brain (Sack et al., 2009), liver (Kobayashi et al., 2005; Kobayashi et al., 2009; Nicolle et al., 2010; Kobayashi et al., 2012a; Kobayashi et al., 2012b), kidney (Nicolle et al., 2010), red blood cells (Craiem and Magin, 2010), and arteries (Craiem and Armentano, 2007; Craiem et al., 2008).
In this paper, viscoelastic properties of various porcine organs were measured and fit to a number of three-parameter biomechanical models. It was found that a semi-fractional Kelvin Voight (S-FKV) biomechanical model was the best fit to the power law behaviour of the organs up to 10% axial strain. Fractional viscoelastic models have previously been used in various studies (Kobayashi et al., 2005; Craiem and Armentano, 2007; Craiem et al., 2008; Kobayashi et al., 2009; Sack et al., 2009; Craiem and Magin, 2010; Nicolle et al., 2010; Kobayashi et al., 2012a; Kobayashi et al., 2012b), and the results reported here adds to the quantity of data available to researchers. Further in this study, the S-FKV model was fit to frequency domain measurements, and the model was then used to predict the time domain relaxation behaviour of the organs which were compared with the time domain experimental data. The parameters obtained from the S-FKV model were also extrapolated to higher frequencies and were comparable to elastography measurements.
The time scales (0.1–100 s) and strains (0.01%–10%) reported in these measurements are relevant to a number of clinical applications, in particular to provide input data for simulations. For example, elastography techniques which have been employed for diagnostic applications such as diagnosing liver fibrosis (Yin et al., 2007), characterising brain lesions (Kruse et al., 2008), and characterising cardiac diseases such as myocardial infarction (Kolipaka et al., 2009). A second example is minimally invasive surgery where needles (and other instruments) are inserted into tissue, such as: needle insertion into liver for radiofrequency ablation or percutaneous ethanol injection therapy (Kobayashi et al., 2009). In neurosurgery (Yundt et al., 1997), a biomechanical model could be used to optimise retractor-applied pressure and retractor position for reducing injury to tissue from retractor strains (Kyriacou et al., 2002). A final example is kidney stone treatment, both percutaneous nephrolithotomy done as key hole-surgery (Kallidonis et al., 2020; Barua et al., 2022) and shock wave lithotripsy (Pace et al., 2005) where the pulse repetition frequency of 1–2 Hz are typically employed.
2 Materials and methods
2.1 Preparation of porcine organ samples
Porcine heart, liver and brain were supplied by a local butcher 48–72 h after slaughter. Porcine kidneys were collected from a second local butcher 36–48 h after slaughter. All organs were tested within 2 h after collection. Figure 1 shows representatives images of the organs that were measured in the study. A cork borer was used to extract 25 mm diameter samples and surgical blades were used to dissect slices with 5–6 mm thickness (shown in Table 1). One sample per organ was extracted for all the tests.
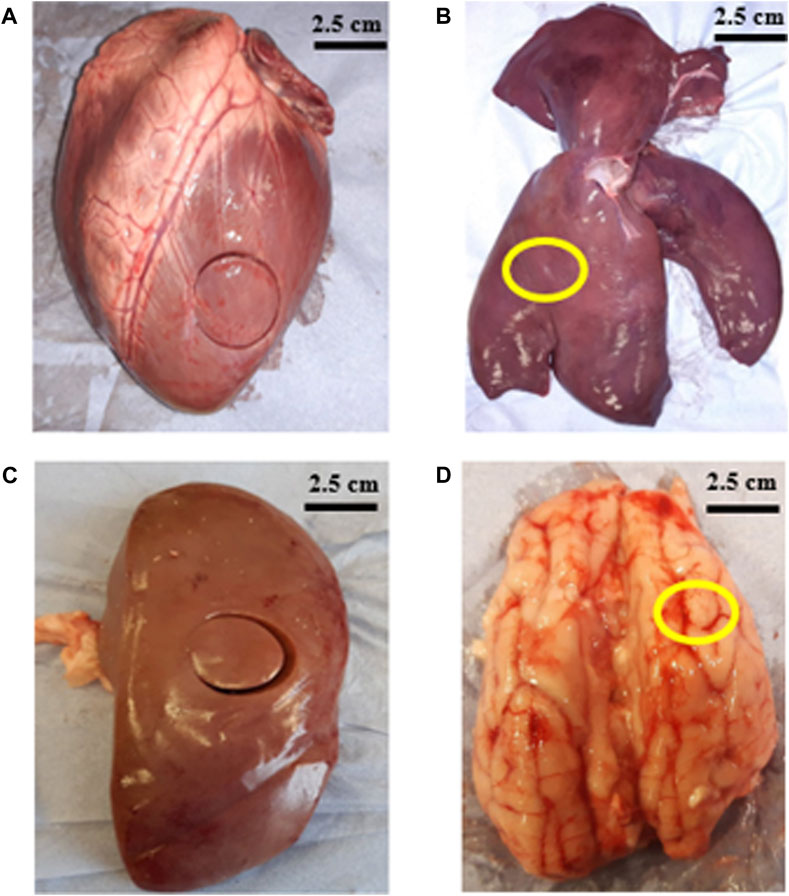
Figure 1. Images show porcine organs and location from where samples were removed (A) left ventricle of heart (B) right lobe of liver (marked in yellow) (C) middle region of kidney (D) frontal lobe of brain (marked in yellow).

Table 1. Thickness of porcine organ samples used for strain sweep, frequency sweep and relaxation tests.
A stress controlled rheometer (Physica MCR 301) is a two plate system, where the upper plate applies torque to the sample and the lower plate is held fixed. The rheometer measures the torque applied and the angle of deformation, converts them into the shear stress and strain from which it outputs the storage modulus
2.2 Viscoelastic model
The springpot element employed in fractional calculus models can be thought of as part way in between a purely elastic element (spring) and a perfectly viscous element (dashpot) (Craiem and Magin, 2010). A fractional order derivative is used to represent its stress (σ) and strain (ε) relationship of a springpot:
where, Kα is the coefficient of consistence (with units of Pa.(s)α) and α is the order of fractional derivative (0 ≤ α ≤ 1). The bounding values of α represent the discrete elements employed in conventional viscoelastic models, that is a spring when α = 0 and Kα = G (modulus), and a dashpot when α = 1 and Kα = η (viscosity).
A fractional Kelvin Voight (FKV) model consists of a spring in parallel with a springpot (Figure 2A) and has a stress-strain relationship:
A S-FKV model consists of a springpot in parallel with a dashpot (Figure 2B) with the stress-strain relationship given by:
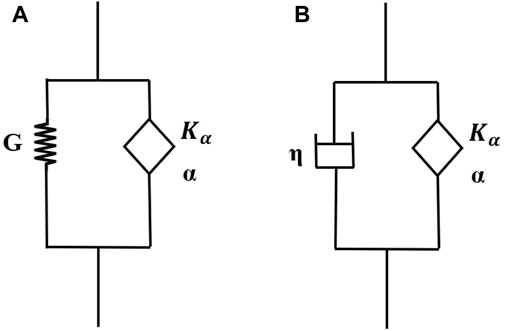
Figure 2. (A) Fractional Kelvin-Voight (FKV) model, and (B) Semi-Fractional Kelvin-Voight (FKV) model.
In the frequency domain the modulus of the S-FKV can be expressed as storage modulus
and a loss modulus
3 Results
3.1 Strain sweep
The storage modulus and loss modulus were provided by the rheometer using strain sweep tests as the strain amplitude was increased from 0.01% to 10% at a frequency of 1 Hz. Figure 3 shows the dependency of both moduli as a function of strain for different porcine organs. The horizontal sections are consistent with the tissue acting as a linear viscoelastic material which is up to 0.1% for the four organs tested here. Table 2 shows the storage modulus and loss modulus at 0.1% strain amplitude which is within the linear viscoelastic region.
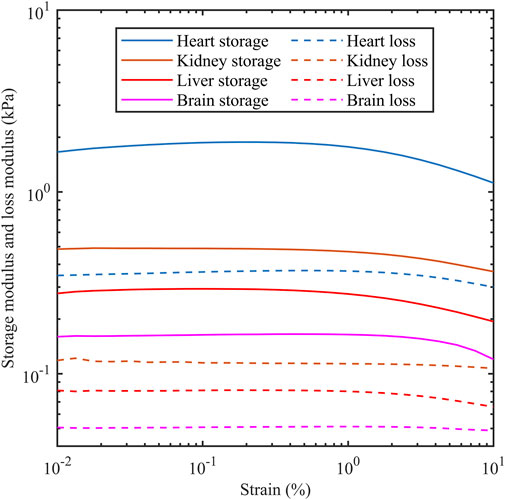
Figure 3. Storage modulus and loss modulus as a function of strain amplitude for porcine heart, kidney, liver and brain. Measurements were carried out at 1 Hz.
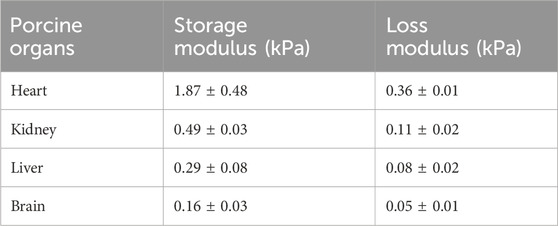
Table 2. The storage modulus and loss modulus for different porcine organs at 0.1% shear strain, and 1 Hz frequency.
3.2 Frequency sweep
For the frequency sweep experiments, the strain amplitude was held at 0.1% and the frequency varied from 0.1 Hz until inertial effects appeared to impact the results. The presence of inertial effects can be seen by a reduction in storage modulus and an increase in the loss modulus (Ewoldt et al., 2015). Figures 4A, B show the effect, and the upper limit of frequency was 9.5 Hz for heart and kidney, 4.2 Hz for liver and 2.8 Hz for brain.
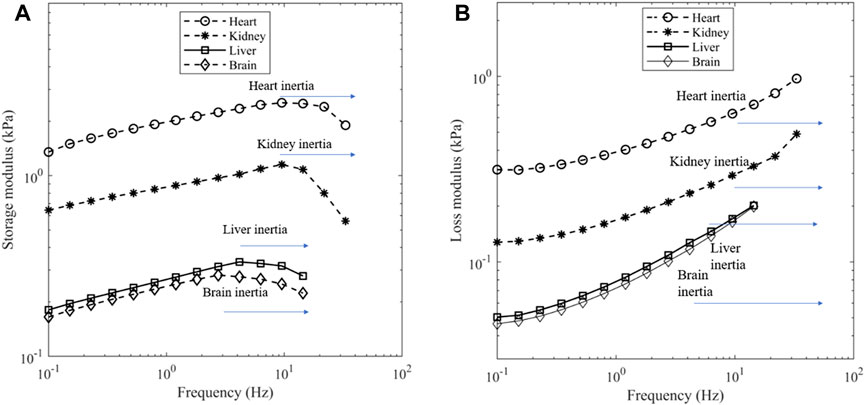
Figure 4. (A) Storage modulus and (B) loss modulus of porcine organs at a contact force of 0.1 N. Depending on the tissue, a dip in storage modulus can be seen near 9.5 Hz for heart and kidney, 4.2 Hz for liver and 2.8 Hz for brain which is indicative of inertia.
Figure 5 shows the experimental data from 0.1 to 9.5 Hz fitted to one of three models: a standard linear solid (SLS) model (spring in parallel with a spring and dashpot), a FKV model (springpot in parallel with a spring) and a S-FKV (springpot in parallel with a dashpot). Each model had three fitting parameters which were chosen using the least square fit function in MATLAB. It can be seen that that SFKV model best captures the response of the tissue and so the SFKV model used for the subsequent fitting on the manuscript.
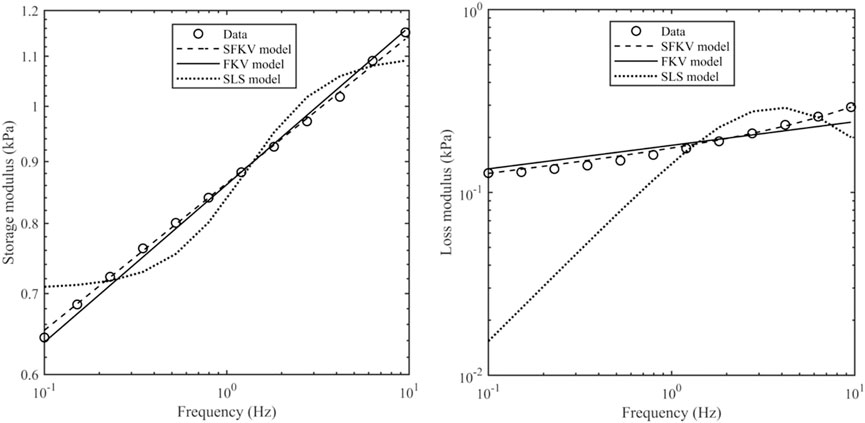
Figure 5. Storage modulus and loss modulus of porcine kidney at a contact force of 0.1 N along with the S-FKV, FKV and SLS model fits.
For the rheometer measurements the samples were put in axial compression with a 0.1 N load before the shear moduli were recorded. In order to relate the axial load and axial strain the elastic modulus (E) was measured independently with a uniaxial compressive tests conducted on 15 porcine kidneys using a Universal Testing Machine (Instron 5582). For the kidneys the elastic modulus E∼44 kPa given by the slope of average stress-strain curve up to 2% axial strain (shown in Supplementary Material) is similar to 48.6 kPa reported in Ref. (Öpik et al., 2012). At a contact force of 0.1 N, the axial stress is
Figure 6 shows the data and model fit of the storage modulus and loss modulus of kidney samples for a range of axial strains, and it can be seen that there is a good agreement over the range of frequencies and strains considered here with a correlation coefficient better than 0.99. The raw data and fitted parameters for all organs are given in the Supplementary Material. Table 3 gives the fitted parameters of Eq. 3 in all porcine organs.
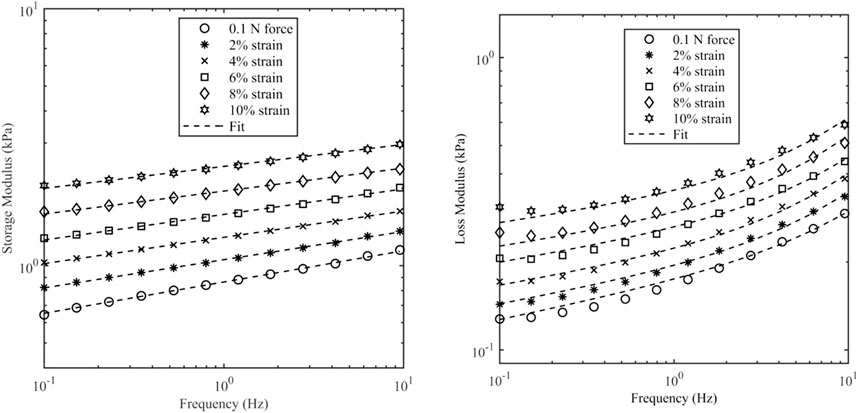
Figure 6. Storage modulus and loss modulus of kidney samples as a function of frequency and axial strain. Axial strain was varied up to 10%. The initial value was based on a contact force of 0.1 N which corresponds to 0.5% strain.
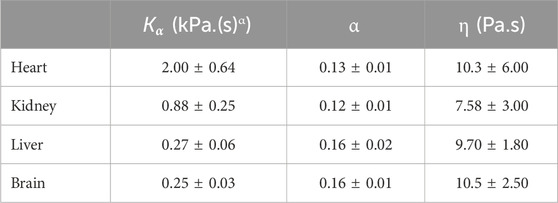
Table 3. S-FKV model parameters for different organs at a contact force of 0.1 N.
The storage modulus and the loss modulus increased monotonically with the axial strain
where
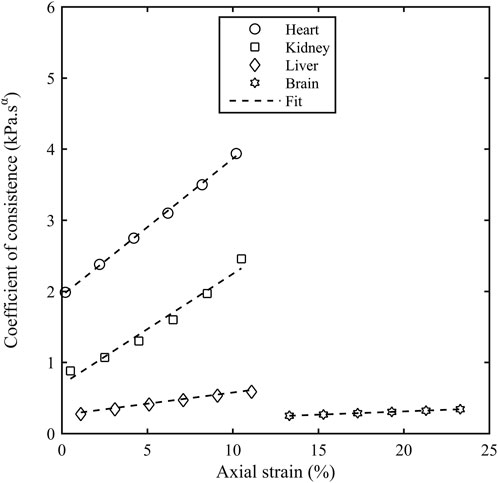
Figure 7. Coefficient of consistence (Kα) as a function of axial strain (εA) for different porcine organs. The contact force of 0.1 N corresponds to an axial strain of 0.2% for heart, 0.5% for kidney, 1.1% for liver and 13.3% for brain.
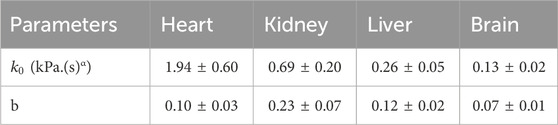
Table 4. Parameters from linear fit in the plot of Kα as a function of
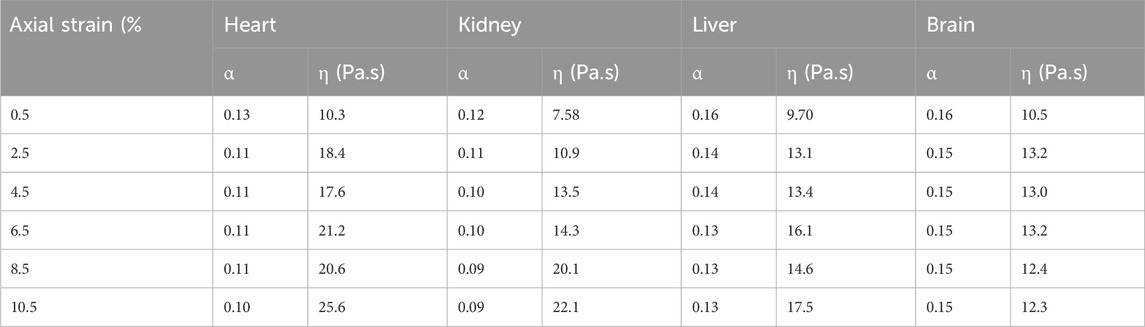
Table 5. Parameters α and η as a function of
3.3 Stress relaxation tests
For the stress relaxation test the samples were compressed to a contact force of 0.1 N and at time t = 0, they were subjected to a step shear strain of 0.1%. The shear stress was then measured every second for 10 s. For the S-FKV model, the response to a step strain
where
The measured stress was compared to predictions based on the S-FKV model using parameters in Table 3. Figure 8 represents the experimental and predicted stress relaxation for different porcine organs. It can be seen that the relaxation time scales of the model and measurements matched well but that the initial values at 1 s varied between the model and measurement. On average, the predicted values were 29% less for heart, 22% greater for kidney, 25% less for liver and 11% greater for brain.
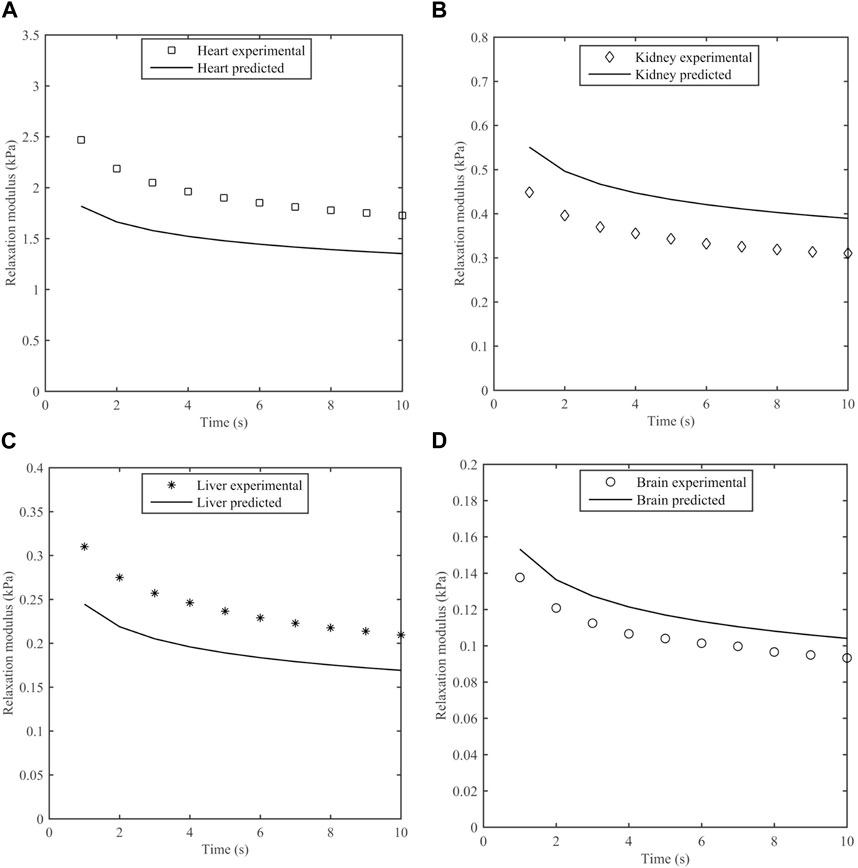
Figure 8. Measured stress relaxation modulus and predicted stress relaxation modulus using S-FKV model for (A) Heart, (B) Kidney, (C) Liver and (D) Brain.
4 Discussion
Measurements of the mechanical properties of porcine heart, kidney, liver and brain are reported here. Storage modulus and loss modulus remained steady during strain sweep tests from 0.01% to 0.1% shear strain suggesting that all organs exhibit linear viscoelastic behaviour in this region. Frequency sweep tests were performed at 0.1% shear strain, and a S-FKV model fitted to the frequency sweep data at different axial strains for all the porcine organs with a correlation coefficient better than 0.99. The S-FKV model had a better fit than both the SLS, which couldn’t capture the storage modulus and loss modulus, and the FKV which couldn’t capture the frequency dependence of the loss modulus. We note that including more viscoelastic elements in the SLS, i.e., generating a Prony series (Mishra and Cleveland, 2024), could result in a better fit but at the cost of needing to fit more parameters. Here all the models we compared only had three fitting parameters.
The coefficient of consistence (Kα) increased monotonically with the axial strain for all the organs and there are two potential reasons behind this increase. Firstly, there is a close contact between connective tissue layers during the pre-compression forcing the interstitial fluid out of the tissue matrix and leading to a more solid like behaviour. Secondly, a higher stress is accumulated at small strains in soft tissues due to their hyperelastic nature thereby requiring a higher torque to deform these samples and hence, a higher storage and loss modulus. The stiffness in shear modulus due to compression observed in our study is similar to the result obtained in the literature (Hrapko et al., 2008; Engstrom et al., 2019). The shear modulus in the study (Hrapko et al., 2008) performed on ex-vivo porcine brains increased by 20% as the precompression force was increased from 5 to 10 mN. A compressional study (Engstrom et al., 2019) performed on mammalian brain tissue observed a linear increase in the shear storage modulus with the uniaxial prestress.
The predictive power of the S-FKV model was tested by comparing the predicted response to a step shear strain with the measured response. The stress relaxation amplitudes of the predictions and measurements were within 30%. One potential reason for the discrepancy is that the S-FKV model was fit to data between 0.1 Hz and ∼10 Hz and so may not capture the response outside this range. We note that the decay of the predicted and measured curves in Figure 8 are very similar and the cause of the discrepancy appears to be associated with the initial values, which will be dependent on the high frequency response of the tissue. A second potential reason is that measurements in the frequency and time domains were done on different tissues samples. The standard deviation in the fitted values for Kα values were 32% in heart, 28.4% in kidney, 22% in liver and 12% in brain which are similar to the differences between the S-FKV model and the relaxation modulus and so biological variability could also contribute to the differences.
The data reported here were all taken at
The fitted S-FKV model was used to predict the shear modulus of organs at frequencies reported in the literature and comparison with literature values are shown in Table 6. It can be seen that in many cases the S-FKV model prediction of shear modulus is consistent with literature values but in some cases there are large discrepancies: up to a factor of 10 is observed in animal organs and up to 27 in human organs. One potential reason is that S-FKV data was measured at frequencies <10 Hz and literature values included measurements up to 1,000 Hz; and the largest discrepancies were typically for data extrapolated beyond 10 Hz. Also, the power law exponent reported here, ∼0.15, is less than reported in the literature 0.3–0.9 (Hoffman et al., 2006; Sack et al., 2009; Grosz et al., 2019; Bonfanti et al., 2020) but again the literature values were obtained in the frequency range of 0.1 Hz–2000 Hz well above the bandwidth measured here. This gives further support to the high-frequency response being responsible for the discrepancies observed in comparison with the relaxation modulus. Other reasons could include variability in the tissue samples and variations in the methods employed.
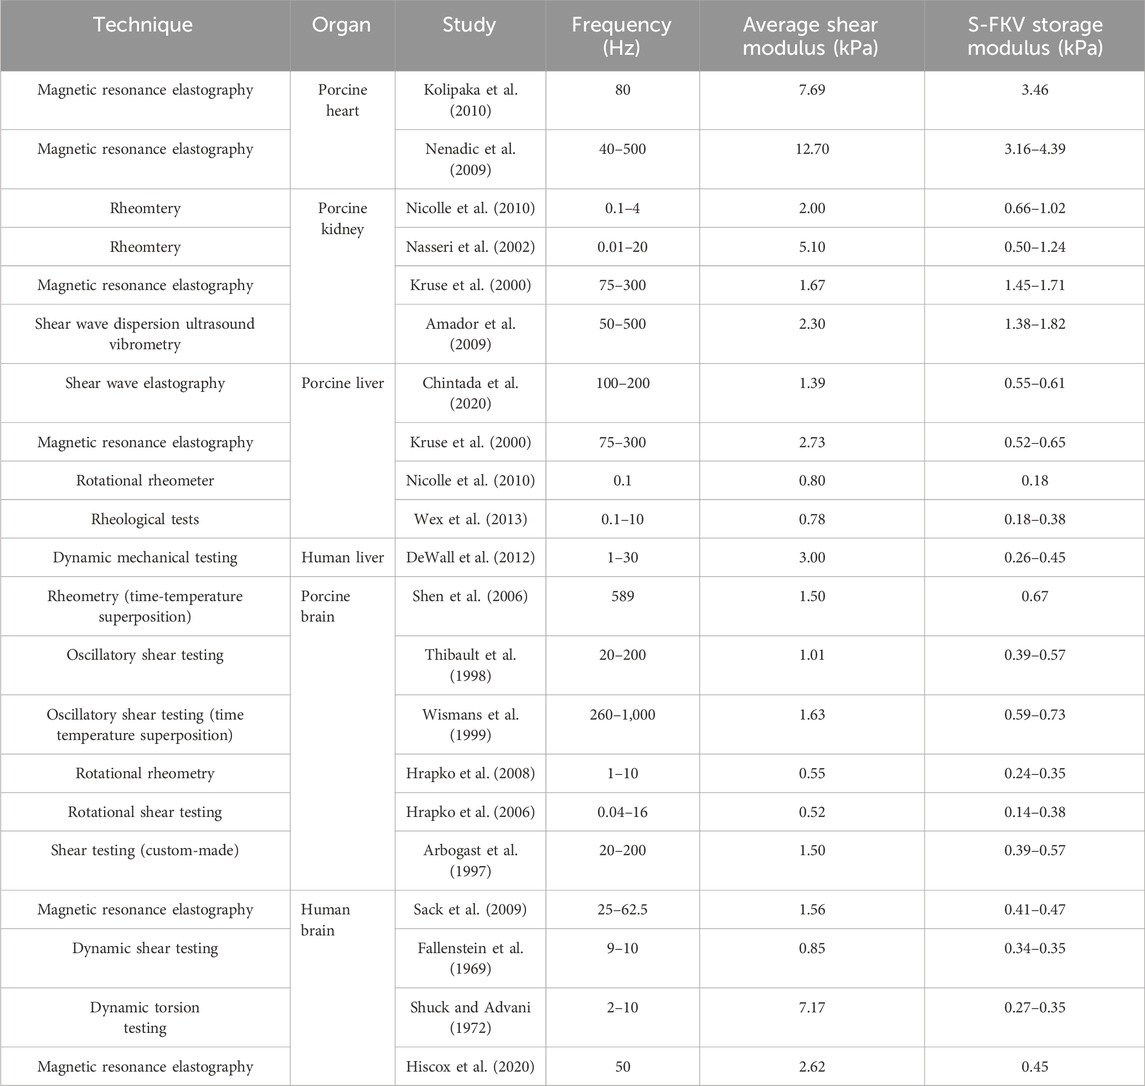
Table 6. Shear modulus reported in the literature compared to the S-FKV model prediction with parameters given by Table 3.
5 Conclusion
In this paper, the rheological behaviour of four porcine organs has been studied from 0.1 Hz up to 9.5 Hz for a range of strain amplitudes and compression. Strain sweep results show that 0.1% strain is within the linear viscoelastic region for all organs. Frequency sweep results showed a monotonic increase in both the storage modulus and loss modulus as a function of frequency and axial strain. This behaviour was better captured with a S-FKV model than a SLS or FKV model. The stress relaxation behaviour of different porcine organs was compared with the stress predicted by S-FKV model and the amplitudes were within 30%. The S-FKV model was extrapolated to predict the shear storage modulus at higher frequencies, and the predictions were consistent with values reported in the literature using other non-invasive methods.
Data availability statement
The original contributions presented in the study are included in the article/Supplementary Material, further inquiries can be directed to the corresponding author.
Ethics statement
Ethical approval was not required for the study involving animals in accordance with the local legislation and institutional requirements because Samples were obtained commercially from an abbatoir.
Author contributions
AM: Conceptualization, Formal Analysis, Investigation, Methodology, Resources, Validation, Visualization, Writing–original draft, Writing–review and editing. RC: Conceptualization, Funding acquisition, Project administration, Supervision, Writing–original draft, Writing–review and editing.
Funding
The author(s) declare that financial support was received for the research, authorship, and/or publication of this article. This work was funded in part by the National Institutes of Health P01-DK43881.
Acknowledgments
The authors thank Nicholas Hawkins for his help in rheometer training and Igor Dyson for Universal testing machine training.
Conflict of interest
The authors declare that the research was conducted in the absence of any commercial or financial relationships that could be construed as a potential conflict of interest.
Publisher’s note
All claims expressed in this article are solely those of the authors and do not necessarily represent those of their affiliated organizations, or those of the publisher, the editors and the reviewers. Any product that may be evaluated in this article, or claim that may be made by its manufacturer, is not guaranteed or endorsed by the publisher.
Supplementary material
The Supplementary Material for this article can be found online at: https://www.frontiersin.org/articles/10.3389/fbioe.2024.1386955/full#supplementary-material
References
Aime, S., Cipelletti, L., and Ramos, L. (2018). Power law viscoelasticity of a fractal colloidal gel. J. Rheol. 62, 1429–1441. doi:10.1122/1.5025622
Alcoutlabi, M., and Martinez-Vega, J. (1998). Application of fractional calculus to viscoelastic behaviour modelling and to the physical ageing phenomenon in glassy amorphous polymers. Polymer 39, 6269–6277. doi:10.1016/s0032-3861(98)00168-2
Amador, C., Urban, M. W., Warner, L. V., and Greenleaf, J. F. (2009). “In vitro renal cortex elasticity and viscosity measurements with shearwave dispersion ultrasound vibrometry (SDUV) on swine kidney,” in 2009 annual international conference of the IEEE engineering in medicine and biology society (IEEE), 4428–4431.
Arbogast, K. B., and Margulies, S. S. (1997). Regional differences in mechanical properties of the porcine central nervous system. SAE Trans., 3807–3814. doi:10.4271/973336
Arunachalam, S. P., Arani, A., Baffour, F., Rysavy, J. A., Rossman, P. J., Glaser, K. J., et al. (2018). Regional assessment of in vivo myocardial stiffness using 3D magnetic resonance elastography in a porcine model of myocardial infarction. Magnetic Reson. Med. 79 (1), 361–369. doi:10.1002/mrm.26695
Bagley, R. L., and Torvik, P. J. (1986). On the fractional calculus model of viscoelastic behavior. J. Rheol. 30, 133–155. doi:10.1122/1.549887
Barua, R., Das, S., Datta, S., Datta, P., and Chowdhury, A. R. (2022). Analysis of surgical needle insertion modeling and viscoelastic tissue material interaction for minimally invasive surgery (MIS). Mater. Today Proc. 57, 259–264. doi:10.1016/j.matpr.2022.02.498
Bonfanti, A., Kaplan, J. L., Charras, G., and Kabla, A. J. (2020). Fractional viscoelastic models for power-law materials. Soft Matter 16, 6002–6020. doi:10.1039/d0sm00354a
Bouzid, M., Keshavarz, B., Geri, M., Divoux, T., Del Gado, E., and McKinley, G. H. (2018). Computing the linear viscoelastic properties of soft gels using an optimally windowed chirp protocol. J. Rheol. 62, 1037–1050. doi:10.1122/1.5018715
Chen, Q., Suki, B., and An, K. N. (2004). Dynamic mechanical properties of agarose gels modeled by a fractional derivative model. J. Biomech. Eng. 126 (5), 666–671. doi:10.1115/1.1797991
Chintada, B. R., Rau, R., and Goksel, O., 2020. Nonlinear characterization of tissue viscoelasticity with acoustoelastic attenuation of shear-waves. arXiv preprint arXiv:2002.12908.
Craiem, D., and Armentano, R. L. (2007). A fractional derivative model to describe arterial viscoelasticity. Biorheology 44, 251–263.
Craiem, D., and Magin, R. L. (2010). Fractional order models of viscoelasticity as an alternative in the analysis of red blood cell (RBC) membrane mechanics. Phys. Biol. 7 (1), 013001. doi:10.1088/1478-3975/7/1/013001
Craiem, D., Rojo, F. J., Atienza, J. M., Armentano, R. L., and Guinea, G. V. (2008). Fractional-order viscoelasticity applied to describe uniaxial stress relaxation of human arteries. Phys. Med. Biol. 53, 4543–4554. doi:10.1088/0031-9155/53/17/006
Craiem, D. O., and Armentano, R. L. (2006) “Engineering in medicine and biology society,” in Annual international conference of the IEEE, 1098.
DeWall, R. J., Bharat, S., Varghese, T., Hanson, M. E., Agni, R. M., and Kliewer, M. A. (2012). Characterizing the compression-dependent viscoelastic properties of human hepatic pathologies using dynamic compression testing. Phys. Med. Biol. 57 (8), 2273–2286. doi:10.1088/0031-9155/57/8/2273
Engstrom, T. A., Pogoda, K., Cruz, K., Janmey, P. A., and Schwarz, J. M. (2019). Compression stiffening in biological tissues: on the possibility of classic elasticity origins. Phys. Rev. E 99 (5), 052413. doi:10.1103/physreve.99.052413
Ewoldt, R. H., Johnston, M. T., and Caretta, L. M. (2015) “Experimental challenges of shear rheology: how to avoid bad data,” in Complex fluids in biological systems: experiment, theory, and computation, 207–241.
Fabry, B., Maksym, G. N., Butler, J. P., Glogauer, M., Navajas, D., and Fredberg, J. J. (2001). Scaling the microrheology of living cells. Phys. Rev. Lett. 87, 148102. doi:10.1103/physrevlett.87.148102
Fallenstein, G. T., Hulce, V. D., and Melvin, J. W. (1969). Dynamic mechanical properties of human brain tissue. J. biomechanics 2 (3), 217–226. doi:10.1016/0021-9290(69)90079-7
Fung, Y. C. (1967). Elasticity of soft tissues in simple elongation. Am. J. Physiology-Legacy Content 213 (6), 1532–1544. doi:10.1152/ajplegacy.1967.213.6.1532
Grosz, S. A., Pereira, R., Bannon, N. A., Urban, M. W., and McGough, R. J. (2019). “Power law behavior of shear waves measured in swine liver,” in 2019 IEEE international ultrasonics symposium (IUS) (IEEE), 2322–2325.
Hiscox, L. V., McGarry, M. D., Schwarb, H., Van Houten, E. E., Pohlig, R. T., Roberts, N., et al. (2020). Standard-space atlas of the viscoelastic properties of the human brain. Hum. brain Mapp. 41 (18), 5282–5300. doi:10.1002/hbm.25192
Hoffman, B. D., Massiera, G., Van Citters, K. M., and Crocker, J. C. (2006). The consensus mechanics of cultured mammalian cells. Proc. Natl. Acad. Sci. 103 (27), 10259–10264. doi:10.1073/pnas.0510348103
Hrapko, M., Van Dommelen, J. A. W., Peters, G. W. M., and Wismans, J. S. H. M. (2006). The mechanical behaviour of brain tissue: large strain response and constitutive modelling. Biorheology 43 (5), 623–636.
Hrapko, M., Van Dommelen, J. A. W., Peters, G. W. M., and Wismans, J. S. H. M. (2008). The influence of test conditions on characterization of the mechanical properties of brain tissue. J. Biomechanical Eng. 130 (3), 031003. doi:10.1115/1.2907746
Johnson, B., Campbell, S., and Campbell-Kyureghyan, N. (2021). Characterizing the material properties of the kidney and liver in unconfined compression and probing protocols with special reference to varying strain rate. Biomechanics 1 (2), 264–280. doi:10.3390/biomechanics1020022
Kallidonis, P., Tsaturyan, A., Lattarulo, M., and Liatsikos, E. (2020). Minimally invasive percutaneous nephrolithotomy (PCNL): techniques and outcomes. Turkish J. Urology 46 (Suppl. 1), S58–S63. doi:10.5152/tud.2020.20161
Kaplan, J. L., Torode, T. A., Bou Daher, F., and Braybrook, S. A. (2019). On pectin mthyl-esterification: implications for in vitro and in vivo viscoelasticity. bioRxiv, 565614. doi:10.1101/565614
Kaster, T., Sack, I., and Samani, A. (2011). Measurement of the hyperelastic properties of ex vivo brain tissue slices. J. biomechanics 44 (6), 1158–1163. doi:10.1016/j.jbiomech.2011.01.019
Katsourinis, S., and Kontou, E. (2019). Fractional viscoelastic models for interconverting linear viscoelastic functions of various polymeric structures. Rheol. Acta 58 (5), 307–320. doi:10.1007/s00397-019-01146-y
Kobayashi, Y., Kato, A., Watanabe, H., Hoshi, T., Kawamura, K., and Fujie, M. G. (2012a). Modeling of viscoelastic and nonlinear material properties of liver tissue using fractional calculations. J. Biomech. Sci. Eng. 7, 177–187. doi:10.1299/jbse.7.177
Kobayashi, Y., Okamoto, J., and Fujie, M. (2005). in Proceedings of the 2005 IEEE international conference on robotics and automation (Piscataway, NJ: IEEE), 1644.
Kobayashi, Y., Onishi, A., Hoshi, T., Kawamura, K., Hashizume, M., and Fujie, M. G. (2009). Development and validation of a viscoelastic and nonlinear liver model for needle insertion. Int. J. Comput. assisted radiology Surg. 4, 53–63. doi:10.1007/s11548-008-0259-9
Kobayashi, Y., Tsukune, M., Miyashita, T., and Fujie, M. G. (2017). Simple empirical model for identifying rheological properties of soft biological tissues. Phys. Rev. E 95 (2), 022418. doi:10.1103/physreve.95.022418
Kobayashi, Y., Watanabe, H., Hoshi, T., Kawamura, K., and Fujie, M. G. (2012b). in Soft tissue biomechanical modeling for computer assisted surgery (Berlin: Springer), 41–67.
Kolipaka, A., Araoz, P. A., McGee, K. P., Manduca, A., and Ehman, R. L. (2010). Magnetic resonance elastography as a method for the assessment of effective myocardial stiffness throughout the cardiac cycle. Magnetic Reson. Med. 64 (3), 862–870. doi:10.1002/mrm.22467
Kolipaka, A., McGee, K. P., Araoz, P. A., Glaser, K. J., Manduca, A., and Ehman, R. L. (2009). Evaluation of a rapid, multiphase MRE sequence in a heart-simulating phantom. Magnetic Reson. Med. An Official J. Int. Soc. Magnetic Reson. Med. 62 (3), 691–698. doi:10.1002/mrm.22048
Kruse, S. A., Rose, G. H., Glaser, K. J., Manduca, A., Felmlee, J. P., Jack Jr, C. R., et al. (2008). Magnetic resonance elastography of the brain. Neuroimage 39 (1), 231–237. doi:10.1016/j.neuroimage.2007.08.030
Kruse, S. A., Smith, J. A., Lawrence, A. J., Dresner, M. A., Manduca, A. J. F. G., Greenleaf, J. F., et al. (2000). Tissue characterization using magnetic resonance elastography: preliminary results. Phys. Med. Biol. 45 (6), 1579–1590. doi:10.1088/0031-9155/45/6/313
Kyriacou, S. K., Mohamed, A., Miller, K., and Neff, S. (2002). Brain mechanics for neurosurgery: modeling issues. Biomechanics Model. Mechanobiol. 1 (2), 151–164. doi:10.1007/s10237-002-0013-0
Mishra, A., and Cleveland, R. O. (2024). Biomechanical modelling of porcine kidney. Bioengineering 11 (6), 537. doi:10.3390/bioengineering11060537
Nasseri, S., Bilston, L. E., and Phan-Thien, N. (2002). Viscoelastic properties of pig kidney in shear, experimental results and modelling. Rheol. acta 41 (1-2), 180–192. doi:10.1007/s003970200017
Nenadic, I., Urban, M. W., and Greenleaf, J. F. (2009). “Ex vivo measurements of myocardial viscoelasticity using Shearwave Dispersion Ultrasound Vibrometry (SDUV),” in 2009 annual international conference of the IEEE engineering in medicine and biology society (IEEE), 2895–2898.
Nicolle, S., Vezin, P., and Palierne, J. F. (2010). A strain-hardening bi-power law for the nonlinear behaviour of biological soft tissues. J. biomechanics 43 (5), 927–932. doi:10.1016/j.jbiomech.2009.11.002
Öpik, R., Hunt, A., Ristolainen, A., Aubin, P. M., and Kruusmaa, M. (2012). “Development of high fidelity liver and kidney phantom organs for use with robotic surgical systems,” in 2012 4th IEEE RAS and EMBS international conference on biomedical robotics and biomechatronics (BioRob) (IEEE), 425–430.
Pace, K. T., Ghiculete, D., Harju, M., and Honey, R. J. D. A.University of Toronto Lithotripsy Associates (2005). Shock wave lithotripsy at 60 or 120 shocks per minute: a randomized, double-blind trial. J. urology 174 (2), 595–599. doi:10.1097/01.ju.0000165156.90011.95
Pritz, T. (1996). Analysis of four-parameter fractional derivative model of real solid materials. J. Sound. Vib. 195, 103–115. doi:10.1006/jsvi.1996.0406
Rossikhin, Y. A., and Shitikova, M. V. (2001). Analysis of dynamic behaviour of viscoelastic rods whose rheological models contain fractional derivatives of two different orders. Z. Angew. Math. Mech. 81, 363–376. doi:10.1002/1521-4001(200106)81:6<363::aid-zamm363>3.0.co;2-9
Sack, I., Beierbach, B., Wuerfel, J., Klatt, D., Hamhaber, U., Papazoglou, S., et al. (2009). The impact of aging and gender on brain viscoelasticity. Neuroimage 46 (3), 652–657. doi:10.1016/j.neuroimage.2009.02.040
Shen, F., Tay, T. E., Li, J. Z., Nigen, S., Lee, P. V. S., and Chan, H. K. (2006). Modified Bilston nonlinear viscoelastic model for finite element head injury studies. J. Biomech. Eng. 128, 797–801. doi:10.1115/1.2264393
Suki, B., Baraba´si, A.-L., and Lutchen, K. R. (1994). Lung tissue viscoelasticity: a mathematical framework and its molecular basis. J. Appl. Physiol. 76, 168–178. doi:10.1152/jappl.1994.76.6.2749
Thibault, K. L., and Margulies, S. S. (1998). Age-dependent material properties of the porcine cerebrum: effect on pediatric inertial head injury criteria. J. biomechanics 31 (12), 1119–1126. doi:10.1016/s0021-9290(98)00122-5
Torvik, P. J., and Bagley, R. L. (1984). On the appearance of the fractional derivative in the behavior of real materials. ASME J. Appl. Mech. 51, 294–298. doi:10.1115/1.3167615
Wex, C., Stoll, A., Fröhlich, M., Arndt, S., and Lippert, H. (2013). How preservation time changes the linear viscoelastic properties of porcine liver. Biorheology 50 (3-4), 115–131. doi:10.3233/bir-130632
Wismans, J. S., and Paas, M. H. (1999). Comparison of the dynamic behaviour of brain tissue and two model materials.
Yin, M., Woollard, J., Wang, X., Torres, V. E., Harris, P. C., Ward, C. J., et al. (2007). Quantitative assessment of hepatic fibrosis in an animal model with magnetic resonance elastography. Magnetic Reson. Med. An Official J. Int. Soc. Magnetic Reson. Med. 58 (2), 346–353. doi:10.1002/mrm.21286
Keywords: fractional viscoelasticity, elastography, porcine organs, rheology, biomechanics
Citation: Mishra A and Cleveland RO (2024) Rheological properties of porcine organs: measurements and fractional viscoelastic model. Front. Bioeng. Biotechnol. 12:1386955. doi: 10.3389/fbioe.2024.1386955
Received: 16 February 2024; Accepted: 19 July 2024;
Published: 01 August 2024.
Edited by:
Salavat Aglyamov, University of Houston, United StatesReviewed by:
Ralph Sinkus, INSERM U1148 Laboratoire de Recherche Vasculaire Translationnelle, FranceRobert McGough, Michigan State University, United States
Copyright © 2024 Mishra and Cleveland. This is an open-access article distributed under the terms of the Creative Commons Attribution License (CC BY). The use, distribution or reproduction in other forums is permitted, provided the original author(s) and the copyright owner(s) are credited and that the original publication in this journal is cited, in accordance with accepted academic practice. No use, distribution or reproduction is permitted which does not comply with these terms.
*Correspondence: Robin O. Cleveland, cm9iaW4uY2xldmVsYW5kQGVuZy5veC5hYy51aw==