 Honghao Zhang1
 Jiu-Tao Hang
 Zhuo Chang
 Hui Yang
 Guang-Kui Xu
- 1School of Mechanical Engineering, Northwestern Polytechnical University, Xi’an, China
- 2Department of Engineering Mechanics, SVL, School of Aerospace Engineering, Xi’an Jiaotong University, Xi’an, China
- 3School of Life Sciences, Northwestern Polytechnical University, Xi’an, China
Studies of cell and tissue mechanics have shown that significant changes in cell and tissue mechanics during lesions and cancers are observed, which provides new mechanical markers for disease diagnosis based on machine learning. However, due to the lack of effective mechanic markers, only elastic modulus and iconographic features are currently used as markers, which greatly limits the application of cell and tissue mechanics in disease diagnosis. Here, we develop a liver pathological state classifier through a support vector machine method, based on high dimensional viscoelastic mechanical data. Accurate diagnosis and grading of hepatic fibrosis facilitates early detection and treatment and may provide an assessment tool for drug development. To this end, we used the viscoelastic parameters obtained from the analysis of creep responses of liver tissues by a self-similar hierarchical model and built a liver state classifier based on machine learning. Using this classifier, we implemented a fast classification of healthy, diseased, and mesenchymal stem cells (MSCs)-treated fibrotic live tissues, and our results showed that the classification accuracy of healthy and diseased livers can reach 0.99, and the classification accuracy of the three liver tissues mixed also reached 0.82. Finally, we provide screening methods for markers in the context of massive data as well as high-dimensional viscoelastic variables based on feature ablation for drug development and accurate grading of liver fibrosis. We propose a novel classifier that uses the dynamical mechanical variables as input markers, which can identify healthy, diseased, and post-treatment liver tissues.
Introduction
Liver cirrhosis and cancer are serious liver diseases with high mortality rates due to their irreversibility (Tapper and Loomba, 2018; Agarwal et al., 2019), whereas liver fibrosis is the early stage of them (Friedman, 2010; Seitz et al., 2018; Stefan et al., 2019) and could be reversed by rational medication (Li et al., 2018; Salarian et al., 2019). To date, early diagnosis and quantification of the extent of liver fibrosis are of great clinical value for timely intervention and reversing the development of liver fibrosis (Friedman, 2010; Zhao et al., 2017; Tapper and Loomba, 2018; Balachandran et al., 2022). The current gold standard for diagnosing liver disease is liver biopsy, which relies on the pathological examination of tissue samples obtained through invasive puncture. However, the invasive nature of biopsies significantly diminishes the patient experience and can potentially lead to complications (Eskew et al., 1997; Yasufuku and Fujisawa, 2007; Veronesi et al., 2010). In contrast, ultrasound has gained widespread applications as the preferred method for clinically screening liver diseases due to its radiation-free nature, cost-effectiveness, convenience, and invaluable real-time imaging capabilities (Bamber et al., 2013; Tapper and Loomba, 2018).
Currently, the primary diagnostic methods for the degree of liver fibrosis are semi-quantitative methods (Sun et al., 2017; Xu et al., 2021), such as liver examinations based on clinical, biochemical, and imaging methods. Therefore, there is a lack of a satisfactory method to accurately determine the degree of hepatic fibrosis. Liver pathology is a complex process characterized by various features at different stages. Utilizing a combination of diagnostic methods is advantageous compared to relying on a single biomarker, as it offers supplementary insights into the condition of the liver. It is well known that the mechanical properties of cells and tissues are closely related to their pathological states (Suresh, 2007; Grant and Twigg, 2013; Rigato et al., 2017; Mandal et al., 2019; Staunton et al., 2019; Guimarães et al., 2020). Utilizing elastography, it is possible to derive the modulus of elasticity of liver tissue and assess the grading of lesions based on their mechanical properties. Many experiments showed that the elastic stiffness is positively correlated with the degree of liver fibrosis (Ziol et al., 2005; Yin et al., 2007). Recent studies (Lei et al., 2017; Lewindon et al., 2019; Xue et al., 2020) have demonstrated that the combination of biochemical and mechanical parameters, along with imaging and ultrasound techniques, exhibits a markedly enhanced diagnostic efficacy for liver lesions compared to individual parameters alone. In addition, SVM has been successfully applied to classify cancerous and normal cells, yielding promising results (Wang et al., 2021). Linking mechanical properties to pathological states provides a novel precise and robust diagnostic marker for diagnosis (Staunton et al., 2019; Wang et al., 2021). However, soft biological tissues are not elastic materials, yet similar to living cells (Fabry et al., 2001; Dimitrije et al., 2004; Smith et al., 2005; Hoffman et al., 2006; Koenderink et al., 2009; Rigato et al., 2017; Hu et al., 2019), they are a viscoelastic material that exhibits a fascinating scaling-law creep response (Liu and Bilston, 2000; Chaudhuri et al., 2016; Chaudhuri et al., 2020). For liver tissues, scaling-law response is also observed in experiments (Chang et al., 2023). It puts doubts as to whether a single value of elastic modulus sufficiently discriminates the pathological stage of liver fibrosis. The correlation between the viscoelastic mechanical properties of liver tissue and liver lesions is currently unexplored. Therefore, quantifying the viscoelastic mechanical properties during liver fibrosis development can provide additional mechanical markers to grade the degree of liver fibrosis and to evaluate the effect of drug treatment, which further improves the precision of diagnosis. However, the high-dimensional mechanical data generated by viscoelastic characterization poses new challenges for evaluating the mechanics of liver fibrosis. The application of machine learning for medical diagnosis in imaging (Kononenko, 2001; Komura and Ishikawa, 2019; Soelistyo et al., 2022) provides us with a viable means to deal with such high-dimensional data.
In this study, we obtained the creep responses of mouse liver tissue sections by atomic force microscopy (AFM). Then, we characterized their creep responses using the self-similar hierarchical model and then acquired high-dimensional viscoelastic mechanical data of healthy, diseased, and MSCs-treated fibrotic liver tissues. Based on a supervised machine learning algorithm, the support vector machine (SVM) method is applied to discover useful mechanical markers, exploiting the hidden associations between viscoelastic parameters with liver pathological states. The combination of high-dimensional viscoelastic mechanical data and machine learning algorithm trained a liver pathological states classifier and the rest of the untrained data was used to test this classifier. We showed that the classifier could achieve 99% accuracy for healthy and diseased livers, 86% accuracy for healthy and MSCs-treated fibrotic livers, and 82% accuracy for a mixture of the three livers together using the viscoelastic mechanical parameters as the input markers.
Methods
Sections of the liver tissues of the mouse were used as the experimental object to acquire a more accurate viscoelastic mechanical response. The mouse liver tissues in the test were divided into three groups: healthy, diseased, and MSCs-treated fibrotic livers. The staging of liver biopsies through the fibrosis scoring systems, such as Batts and Ludwig or Metavir, is deemed most appropriate. Currently, achieving precise modulation for accurate staging of liver lesions during mouse culture remains challenging. Thus, we categorized the mice into three groups: healthy, diseased, and MSCs-treated fibrotic livers. During the mouse culture process, we implemented a relatively prolonged culture period to induce the development of noticeable lesions, with therapeutic drug injection serving as an intermediary state between the healthy and diseased states. C57BL/6 Mice were randomly assigned to three groups. The control group consisted of healthy, wildtype mice that did not receive any injections of MSCs therapy. Liver fibrosis was induced in the other two groups (diseased and MSCs-treated fibrotic groups, n = 2) by intraperitoneal injections of therapeutic drug (1 μL/g) for 7 weeks. At the end of the sixth week, half of the mice received a single intravenous infusion of 2 x10⁵ MSCs. These mice constituted the MSCs-treated fibrotic groups. In the initial step, mouse liver extraction was performed, with particular attention given to isolating the tissues surrounding the portal veins, which connect the left lobe to the rest of the liver tissue. Subsequently, the liver tissues were immediately frozen at - 80°C and cryo-sectioned to a nominal thickness of 15 µm using a Leica CM1850 cryostat (Leica Microsystems (United Kingdom) Ltd., Milton Keynes) and adhered to glass coverslips for future research. Afterward, the dynamical creep indentation test was performed on cells after conducting Masson’s trichrome staining, Sirius Red staining, and aspartate aminotransferase (AST) assay. To mitigate the effects of local remodeling events on the tissue structure under investigation, measurements were carried out at multiple locations separated by a significant distance (i.e., > 50 μm). To reduce the influence of stiff collagen on tissue during characterization, dynamical and static indentation experiments were intentionally conducted away from the portal zones.
To obtain the viscoelastic mechanical properties of liver samples, the creep responses of the liver tissues were obtained by applying step stress to the samples by AFM with a customized spherical probe (diameter = 20 μm) and holding for 10 s. Each creep compliance indentation test was performed randomly on tissue sections with 100 μm spacing between two locations. Due to the relatively large sample area (∼1 cm2), each test performed by the micron-size spherical probe is regarded as a single mechanical measurement on 1 mouse. Each group received 800 measurements. Then, the viscosity (
where R and
where the second is the regular term, w is the normal vector of the classified hyperplane (Eq. 2), C is a constant, and
where xi and xj denote the input categorical feature variables and

Figure 1. Performance assessment of single viscoelastic marker in the test data group of healthy and diseased livers. (A) Overview of machine learning-based liver states classification and diagnosis using viscoelastic mechanical parameters.
Ethical approval
It has been confirmed that the experimental data collection complied with relevant institutional, national, and international guidelines and legislation with permission from the administration committee of experimental animals of The Second Affiliated Hospital of Xi’an Jiaotong University, China. All methods reported follow ARRIVE guidelines.
Results and discussion
Assessment of classification accuracy for viscoelastic variables
The classification of healthy and diseased liver tissues with a single mechanical marker
After building the prediction classifier to output liver pathological states, we evaluated the accuracy of each viscoelastic variable based on the classifier for healthy and diseased livers. In the assessment of the viscoelastic variable of healthy and diseased livers, 70% of the data were treated as the training group and 30% of the data as the test group. The status variables for healthy and diseased liver tissues have been set as 0 and 2, respectively. We first analyze the correlation between the parameters through Pearson’s correlation coefficient. Pearson’s correlation coefficient was calculated by the following formula:
The Pearson correlation coefficient (Eq. 4) of each variable with others is shown in Figure 1B. It indicates that the status of the liver tissue exhibits the highest correlation with the power-law exponent at small time scales
The classification of healthy and diseased liver tissues with multiple mechanical markers
As the viscoelastic properties of liver tissues differ substantially between healthy and diseased states, high classification accuracy can be obtained using a single viscoelastic variable (such as

Figure 2. Multiple dynamical mechanical markers performance assessment on the test data group of healthy and diseased livers. (A) ROCs of the classifier with two viscoelastic variables as marker input. (B) Data points for healthy and diseased livers have their regions when double viscoelastic variables are used as marker input. (C) ROCs of the classifier with three viscoelastic variables as marker input. (D) When the three viscoelastic variables were used as classification marker input, the data point aggregation feature was more pronounced for healthy and diseased livers compared to that of the two variables used.
An interpretable predictive model for the liver pathological states
Adding diseased tissues after drug treatment to the classifier
Having enabled the classification of healthy and diseased livers, we next expanded the machine learning framework to investigate liver tissues after drug treatment (with the status variable of 1). We trained the prediction classifier and measured the accuracy by combining four different combinations of two viscoelastic variables as input markers to the prediction classifier. For each dataset, we split the data by liver status (healthy, diseased, and MSCs-treated fibrotic) and computed separate confusion matrices to ensure that there is no systematic bias in the predictions. Overall, the best-performing combination is the one combing the elastic modulus

Figure 3. Multiple mechanical markers performance assessment on the test data group of healthy, diseased, and MSCs-treated fibrotic livers. (A) Data points for healthy, diseased, and MSCs-treated fibrotic livers have their regions when the two variables are used as classification marker inputs. (B) ROCs of the classifier with 2, 6, and 9 viscoelastic variables as marker input. (C) The heat map of the Pearson correlation coefficient of viscoelastic variables of healthy, diseased, and MSCs-treated fibrotic liver tissues. (D) Optimal accuracy was obtained when different numbers of variables were used for different liver classifications. Here, H, D, and T represent healthy, diseased, and MSCs-treated fibrotic liver tissues, respectively.
As shown in Refs. (Ziol et al., 2005; Yin et al., 2007), the elastic stiffness of healthy and diseased livers show significant differences. Since many viscoelastic parameters exhibit a strong correlation with the elastic stiffness of tissues, a single viscoelastic variable could achieve a sufficiently high classification accuracy. Consequently, when classifying healthy and diseased livers, we mainly investigated the cases of 2 and 3 variables as the marker input. With the introduction of MSCs-treated fibrotic livers, we used cross-validation to obtain optimal classification accuracy by feature elimination for different numbers of mechanical variables. We implemented a k-fold cross validation with k = 10, where the training set was divided into 10 subsamples and one subsample was reserved for model validation, while the remaining nine subsamples were utilized for training. During cross-validation, each subset is iteratively utilized as a test set once, while the remaining k-1 folds are employed as a training set to train the model and assess its performance on each fold. Subsequently, the results from all k evaluations are averaged to derive the final evaluation of the model’s performance. As illustrated in Figure 3D, for the classification of healthy and diseased livers, the optimal classification accuracy is almost independent of the number of input markers, since
Feature ablation studies
In this study, we used nine viscoelastic mechanical variables as input markers in the classification of liver pathological states, but in fact, not only do the viscoelastic properties of liver tissues change when lesions occur, but also other properties such as plasticity, component protein characteristics, and image characteristics. Combining viscoelastic properties with these characteristics will greatly improve the quality of liver lesion diagnosis, but will also result in a considerable computational requirement, therefore, a reasonable selection of markers is crucial to improve the efficiency of liver diagnosis. To determine the minimal information required for liver state prediction, we first determined the importance (Figure 4A) ranking of the viscoelastic features of the tissue using Support Vector Machine Recursive Feature Elimination (SVM-RFE). Subsequently, recursive feature ablation is conducted via cross-validation to determine the optimal number of features. Then, we systematically removed individual principal viscoelastic variables (replacing them with Gaussian noise) and calculated the performance of the classifier after the removal of each viscoelastic variable. Through multiple iterations, we found that a single mechanical marker (
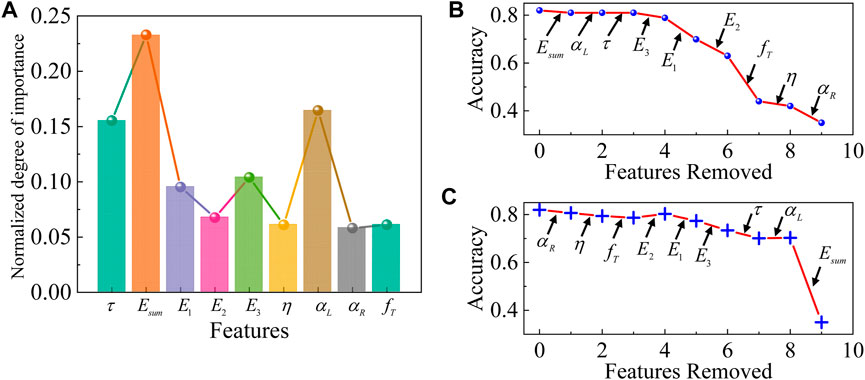
Figure 4. Feature ablation studies of the classifier with healthy, diseased, and MSCs-treated fibrotic liver tissues together. (A) The normalized importance of each feature. Feature ablation (B) from high to low importance and (C) from low to high importance. Feature ablation demonstrates the role of each principal viscoelastic variable in the prediction of the classifier. Each arrow indicates the cumulative replacement of a given principal viscoelastic variable with Gaussian noise.
A method for evaluating drug treatment effects
Having established the SVM-based classifier that can classify livers in an interpretable manner, we sought to define a new approach to drug-based screening using a predictive classifier. To this end, we tested the classification accuracy of liver tissues after drug treatment against healthy and diseased livers to determine the effect of the indicated drug on liver states. The accuracy of classification of treated livers with healthy and diseased livers reached 0.86 and 0.85 (Figure 3D), respectively. The MSCs-treated fibrotic liver tissue was clearly classified from diseased liver tissues and there is a tendency for the elastic modulus to be greatly reduced, which indicates that the drug treatment has freed them from the diseased state. The accurate classification of healthy liver tissues also indicates that the drug treatment has not completely restored them to a healthy state. Overall, drug treatment allows the liver tissue to recover from the disease to healthy state. The accuracy of the classification of liver tissue after drug treatment compared to healthy and diseased liver tissues allows a clear determination of the effect of drug treatment and the need for continued drug use. When the classification accuracy of the MSCs-treated fibrotic liver tissues with healthy liver tissues is reduced to 0.33 and the classification accuracy with diseased tissue reaches a high level, we can assume that the liver tissue has recovered to its original state under drug treatment, which is, of course, the ideal situation. As an example, our method can be used to determine the effect of a drug by screening the recovery of viscoelastic properties induced by the drug. We can further analyze the changes in the main viscoelastic biomarkers to determine the target of the action of the drug. In addition, in the process of liver fibrosis, there exists a grading of its lesion degree. At this time, our three-class classifier can be further extended to achieve accurate grading of liver fibrosis and provide the basis for subsequent treatment.
Discussions
Machine learning is now a powerful tool for medical diagnosis. Although many machine learning diagnostic models are mainly based on the recognition of image technology, they lack suitable mechanical markers, which makes them rarely used to identify tissue lesions in similar states or less severe lesions. Here, we analyzed the creep responses of liver tissues by a self-similar hierarchical model and obtained the viscoelastic properties of liver tissues in different states. Then, we built an SVM-based machine learning classifier with viscoelastic properties as input mechanical markers. Remarkably, our SVM classifier successfully identifies elastic modulus
Data availability statement
The original contributions presented in the study are included in the article/Supplementary Material, further inquiries can be directed to the corresponding authors.
Ethics statement
The animal study was approved by the administration committee of experimental animals of The Second Affiliated Hospital of Xi’an Jiaotong University, China. The study was conducted in accordance with the local legislation and institutional requirements.
Author contributions
HZ: Data curation, Formal Analysis, Investigation, Methodology, Software, Validation, Visualization, Writing–original draft. J-TH: Data curation, Formal Analysis, Investigation, Methodology, Project administration, Resources, Software, Supervision, Validation, Visualization, Writing–original draft, Writing–review and editing. ZC: Data curation, Formal Analysis, Investigation, Methodology, Software, Validation, Writing–original draft. SY: Formal Analysis, Investigation, Methodology, Software, Writing–original draft. HY: Data curation, Formal Analysis, Funding acquisition, Investigation, Methodology, Project administration, Resources, Software, Validation, Visualization, Writing–original draft, Writing–review and editing. G-KX: Conceptualization, Data curation, Formal Analysis, Funding acquisition, Investigation, Methodology, Project administration, Resources, Software, Supervision, Validation, Visualization, Writing–original draft, Writing–review and editing.
Funding
The author(s) declare that financial support was received for the research, authorship, and/or publication of this article. Financial supports from the National Natural Science Foundation of China (Grant No. 12302221), the Natural Science Basic Research Plan in Shaanxi Province of China (Grant No. 2019JC-02), and the Fundamental Research Funds for the Central Universities of China are acknowledged.
Conflict of interest
J-TH, ZC, and G-KX were employed by the SVL.
The remaining authors declare that the research was conducted in the absence of any commercial or financial relationships that could be construed as a potential conflict of interest.
Publisher’s note
All claims expressed in this article are solely those of the authors and do not necessarily represent those of their affiliated organizations, or those of the publisher, the editors and the reviewers. Any product that may be evaluated in this article, or claim that may be made by its manufacturer, is not guaranteed or endorsed by the publisher.
References
Agarwal, T., Subramanian, B., and Maiti, T. K. (2019). Liver tissue engineering: challenges and opportunities. ACS Biomaterials Sci. Eng. 5, 4167–4182. doi:10.1021/acsbiomaterials.9b00745
Balachandran, Y. L., Wang, W., Yang, H., Tong, H., Wang, L., Liu, F., et al. (2022). Heterogeneous iron oxide/dysprosium oxide nanoparticles target liver for precise magnetic resonance imaging of liver fibrosis. ACS Nano 16, 5647–5659. doi:10.1021/acsnano.1c10618
Bamber, J., Cosgrove, D., Dietrich, C., Fromageau, J., Bojunga, J., Calliada, F., et al. (2013). EFSUMB guidelines and recommendations on the clinical use of ultrasound elastography. Part 1: basic principles and technology. Ultraschall Med. 34, 169–184. doi:10.1055/s-0033-1335205
Chang, Z., Zhang, L., Hang, J.-T., Liu, W., and Xu, G.-K. (2023). Viscoelastic multiscale mechanical indexes for assessing liver fibrosis and treatment outcomes. Nano Lett. 23, 9618–9625. doi:10.1021/acs.nanolett.3c03341
Chaudhuri, O., Cooper-White, J., Janmey, P. A., Mooney, D. J., and Shenoy, V. B. (2020). Effects of extracellular matrix viscoelasticity on cellular behaviour. Nature 584, 535–546. doi:10.1038/s41586-020-2612-2
Chaudhuri, O., Klumpers, D., Darnell, M., Bencherif, S. A., Weaver, J. C., et al. (2016). Hydrogels with tunable stress relaxation regulate stem cell fate and activity. Nat. Mater. 15, 326–334. doi:10.1038/nmat4489
Cristianini, N., and Shawe-Taylor, J. (1999). An introduction to support Vector Machines: and other kernel-based learning methods. Cambridge University Press.
Dimitrije, S., Béla, S., Ben, F., Ning, W., Fredberg, J. J., and Buy, J. E. (2004). Rheology of airway smooth muscle cells is associated with cytoskeletal contractile stress. J. Appl. Physiology 96, 1600–1605. doi:10.1152/japplphysiol.00595.2003
Dumais, S., Platt, J., Heckerman, D., and Sahami, M. (1998). Inductive learning algorithms and representations for text categorization.
Eskew, L. A., Bare, R. L., and McCullough, D. L. (1997). Systematic 5 region prostate biopsy is superior to sextant method for diagnosing carcinoma of the prostate. J. Urology 157, 199–203. doi:10.1016/S0022-5347(01)65322-9
Evgeniou, T., and Pontil, M. (2015). in Algorithmic learning theory. Editors O. Watanabe, and T. Yokomori (Springer Berlin Heidelberg), 106–117.
Fabry, B., Maksym, G. N., Butler, J. P., Glogauer, M., Navajas, D., and Fredberg, J. J. (2001). Scaling the microrheology of living cells. Phys. Rev. Lett. 87, 148102. doi:10.1103/physrevlett.87.148102
Friedman, S. L. (2010). Evolving challenges in hepatic fibrosis. Nat. Rev. Gastroenterology Hepatology 7, 425–436. doi:10.1038/nrgastro.2010.97
Grant, C. A., and Twigg, P. C. (2013). Pseudostatic and dynamic nanomechanics of the tunica adventitia in elastic arteries using atomic force microscopy. ACS Nano 7, 456–464. doi:10.1021/nn304508x
Guimarães, C. F., Gasperini, L., Marques, A. P., and Reis, R. L. (2020). The stiffness of living tissues and its implications for tissue engineering. Nat. Rev. Mater. 5, 351–370. doi:10.1038/s41578-019-0169-1
Hang, J.-T., Kang, Y., Xu, G.-K., and Gao, H. (2021). A hierarchical cellular structural model to unravel the universal power-law rheological behavior of living cells. Nat. Commun. 12, 6067. doi:10.1038/s41467-021-26283-y
Hang, J.-T., Xu, G.-K., and Gao, H. Frequency-dependent transition in power-law rheological behavior of living cells. Sci. Adv. 8, eabn6093. doi:10.1126/sciadv.abn60932022).
Hoffman, B. D., Gladys, M., Citters, K. M., and Van and Crocker, J. C. (2006). The consensus mechanics of cultured mammalian cells. Proc. Natl. Acad. Sci. U. S. A. 103, 10259–10264. doi:10.1073/pnas.0510348103
Hu, J., Li, Y., Hao, Y., Zheng, T., Gupta, S. K., Parada, G. A., et al. (2019). High stretchability, strength, and toughness of living cells enabled by hyperelastic vimentin intermediate filaments. Proc. Natl. Acad. Sci. 116, 17175–17180. doi:10.1073/pnas.1903890116
Hurst, S., Vos, B. E., Brandt, M., and Betz, T. (2021). Intracellular softening and increased viscoelastic fluidity during division. Nat. Phys. 17, 1270–1276. doi:10.1038/s41567-021-01368-z
Koenderink, G. H., Dogic, Z., Nakamura, F., Bendix, P. M., MacKintosh, F. C., Hartwig, J. H., et al. (2009). An active biopolymer network controlled by molecular motors. Proc. Natl. Acad. Sci. U. S. A. 106, 15192–15197. doi:10.1073/pnas.0903974106
Komura, D., and Ishikawa, S. (2019). Machine learning approaches for pathologic diagnosis. Virchows Arch. 475, 131–138. doi:10.1007/s00428-019-02594-w
Kononenko, I. (2001). Machine learning for medical diagnosis: history, state of the art and perspective. Artif. Intell. Med. 23, 89–109. doi:10.1016/S0933-3657(01)00077-X
Lei, B., Liu, Y., Dong, C., Chen, X., Zhang, X., Diao, X., et al. (2017). Assessment of liver fibrosis in chronic hepatitis B via multimodal data. Neurocomputing 253, 169–176. doi:10.1016/j.neucom.2016.09.128
Lewindon, P. J., Puertolas-Lopez, M. V., Ramm, L. E., Noble, C., Pereira, T. N., Wixey, J. A., et al. (2019). Accuracy of transient elastography data combined with APRI in detection and staging of liver disease in pediatric patients with cystic fibrosis. Clin. Gastroenterology Hepatology 17, 2561–2569.e5. doi:10.1016/j.cgh.2019.03.015
Li, C., Li, R., and Zhang, W. (2018). Progress in non-invasive detection of liver fibrosis. Cancer Biol. Med. 15, 124. doi:10.20892/j.issn.2095-3941.2018.0018
Lin, D. C., and Horkay, F. (2008). Nanomechanics of polymer gels and biological tissues: a critical review of analytical approaches in the Hertzian regime and beyond. Soft Matter 4, 669–682. doi:10.1039/B714637J
Liu, Z., and Bilston, L. (2000). On the viscoelastic character of liver tissue: experiments and modelling of the linear behaviour. Biorheology 37, 191–201. doi:10.1016/S1083-8791(00)70031-0
Mandal, K., Pogoda, K., Nandi, S., Mathieu, S., Kasri, A., Klein, E., et al. (2019). Role of a kinesin motor in cancer cell mechanics. Nano Lett. 19, 7691–7702. doi:10.1021/acs.nanolett.9b02592
Patel, K., Bedossa, P., and Castera, L. (2015). Diagnosis of liver fibrosis: present and future. Seminars liver Dis. 35, 166–183. doi:10.1055/s-0035-1550059
Rigato, A., Miyagi, A., Scheuring, S., and Rico, F. (2017). High-frequency microrheology reveals cytoskeleton dynamics in living cells. Nat. Phys. 13, 771–775. doi:10.1038/nphys4104
Salarian, M., Turaga, R. C., Xue, S., Nezafati, M., Hekmatyar, K., Qiao, J., et al. (2019). Early detection and staging of chronic liver diseases with a protein MRI contrast agent. Nat. Commun. 10, 4777. doi:10.1038/s41467-019-11984-2
Seitz, H. K., Bataller, R., Cortez-Pinto, H., Gao, B., Gual, A., Lackner, C., et al. (2018). Publisher correction: alcoholic liver disease. Nat. Rev. Dis. Prim. 4, 18. doi:10.1038/s41572-018-0021-8
Smith, B. A., Barbara, T., Martin, J. G., and Peter, G. (2005). Probing the viscoelastic behavior of cultured airway smooth muscle cells with atomic force microscopy: stiffening induced by contractile agonist. Biophysical J. 88, 2994–3007. doi:10.1529/biophysj.104.046649
Soelistyo, C. J., Vallardi, G., Charras, G., and Lowe, A. R. (2022). Learning biophysical determinants of cell fate with deep neural networks. Nat. Mach. Intell. 4, 636–644. doi:10.1038/s42256-022-00503-6
Staunton, J. R., So, W. Y., Paul, C. D., and Tanner, K. (2019). High-frequency microrheology in 3D reveals mismatch between cytoskeletal and extracellular matrix mechanics. Proc. Natl. Acad. Sci. 116, 14448–14455. doi:10.1073/pnas.1814271116
Stefan, N., Häring, H.-U., and Cusi, K. (2019). Non-alcoholic fatty liver disease: causes, diagnosis, cardiometabolic consequences, and treatment strategies. Lancet Diabetes and Endocrinol. 7, 313–324. doi:10.1016/S2213-8587(18)30154-2
Sun, Y., Zhou, J., Wang, L., Wu, X., Chen, Y., Piao, H., et al. (2017). New classification of liver biopsy assessment for fibrosis in chronic hepatitis B patients before and after treatment. Hepatology 65, 1438–1450. doi:10.1002/hep.29009
Suresh, S. (2007). Biomechanics and biophysics of cancer cells. Acta Biomater. 3, 413–438. doi:10.1016/j.actbio.2007.04.002
Tapper, E. B., and Loomba, R. (2018). Noninvasive imaging biomarker assessment of liver fibrosis by elastography in NAFLD. Nat. Rev. Gastroenterology Hepatology 15, 274–282. doi:10.1038/nrgastro.2018.10
Veronesi, U., Viale, G., Paganelli, G., Zurrida, S., Luini, A., Galimberti, V., et al. (2010). Sentinel lymph node biopsy in breast cancer: ten-year results of a randomized controlled study. Ann. Surg. 251, 595–600. doi:10.1097/sla.0b013e3181c0e92a
Wang, H., Zhang, H., Da, B., Tamura, R., Goto, K., et al. (2021). Mechanomics biomarker for cancer cells unidentifiable through morphology and elastic modulus. Nano Lett. 21, 1538–1545. doi:10.1021/acs.nanolett.1c00003
Xu, X., Zhou, X., Xiao, B., Xu, H., Hu, D., Qian, Y., et al. (2021). Glutathione-responsive magnetic nanoparticles for highly sensitive diagnosis of liver metastases. Nano Lett. 21, 2199–2206. doi:10.1021/acs.nanolett.0c04967
Xue, L.-Y., Jiang, Z. Y., Fu, T. T., Wang, Q. M., Zhu, Y. L., Dai, M., et al. (2020). Transfer learning radiomics based on multimodal ultrasound imaging for staging liver fibrosis. Eur. Radiol. 30, 2973–2983. doi:10.1007/s00330-019-06595-w
Yasufuku, K., and Fujisawa, T. (2007). Staging and diagnosis of non-small cell lung cancer: invasive modalities. Respirology 12, 173–183. doi:10.1111/j.1440-1843.2007.01035.x
Yin, M., Talwalkar, J. A., Glaser, K. J., Manduca, A., Grimm, R. C., Rossman, P. J., et al. (2007). Assessment of hepatic fibrosis with magnetic resonance elastography. Clin. Gastroenterology Hepatology 5, 1207–1213.e2. doi:10.1016/j.cgh.2007.06.012
Zhao, J., Zhai, F., Cheng, J., He, Q., Luo, J., Yang, X., et al. (2017). Evaluating the significance of viscoelasticity in diagnosing early-stage liver fibrosis with transient elastography. PLoS ONE 12, e0170073. doi:10.1371/journal.pone.0170073
Keywords: cell mechanics, viscoelastic, machine learning, rheology, liver diagnosis
Citation: Zhang H, Hang J-T, Chang Z, Yu S, Yang H and Xu G-K (2024) Scaling-law mechanical marker for liver fibrosis diagnosis and drug screening through machine learning. Front. Bioeng. Biotechnol. 12:1404508. doi: 10.3389/fbioe.2024.1404508
Received: 21 March 2024; Accepted: 28 June 2024;
Published: 16 July 2024.
Edited by:
Ge He, University of Wisconsin–Milwaukee, United StatesReviewed by:
Yuan Feng, Shanghai Jiao Tong University, ChinaLongwei Liu, University of Southern California, United States
Seungman Park, University of Nevada, United States
Copyright © 2024 Zhang, Hang, Chang, Yu, Yang and Xu. This is an open-access article distributed under the terms of the Creative Commons Attribution License (CC BY). The use, distribution or reproduction in other forums is permitted, provided the original author(s) and the copyright owner(s) are credited and that the original publication in this journal is cited, in accordance with accepted academic practice. No use, distribution or reproduction is permitted which does not comply with these terms.
*Correspondence: Jiu-Tao Hang, aGFuZ2p0QHhqdHUuZWR1LmNu; Hui Yang, a2l0dHl5aEBud3B1LmVkdS5jbg==; Guang-Kui Xu, Z3VhbmdrdWl4dUB4anR1LmVkdS5jbg==