 Zimeng Liu
 Yulin Zhou
 Hui Liu
 Peng Cheng2,3*
- 1School of Sport Science, Beijing Sport University, Beijing, China
- 2China Institute of Sport and Health Science, Beijing Sport University, Beijing, China
- 3Key Laboratory for Performance Training and Recovery of General Administration of Sport, Beijing Sport University, Beijing, China
- 4Anta Sports Science Laboratory, Anta (China) Co., Ltd., Xiamen, China
Objective: The purpose of the study was to investigate the immediate and long-term effects of zero-drop running shoes on lower extremity joint biomechanics.
Methods: Seven male runners participated in this study (height: 1.74 ± 0.03 m, weight: 62.5 ± 3.1 kg, body mass index: 20.6 ± 0.7 kg/m2). Kinematic and kinetic data were collected when the participants ran at a speed of 13 ± 0.65 km/h in running shoes with zero and 15 mm drop both immediately and after the 8-week intervention wearing zero-drop running shoes. Paired t-tests were used to analyze the biomechanical differences between the different drop shoes in the immediate test and the biomechanical changes during the intervention.
Results: The foot strike index increased (zero-drop: p = 0.021, 15 mm drop: p = 0.049), along with the negative work of ankle joint (15 mm drop: p = 0.018), and the hip joint (zero-drop: p = 0.004, 15 mm drop: p = 0.009), while metatarsophalangeal joint negative work decreased (zero-drop: p = 0.029, 15 mm drop: p = 0.028) in post-intervention test compared to the pre-intervention test.
Conclusion: Zero-drop running shoes promote a forefoot strike pattern, which affects the distribution of lower extremity joint work.
1 Introduction
Running is a popular sport widely practiced by sports enthusiasts and professional athletes. In addition to focusing on performance improvement, it is also important to consider the risk of running injuries, which can affect the sports career and health of runners (Desai et al., 2021; Hollander et al., 2018; Scheer et al., 2022). Studies have shown that 70%–80% of running injuries are overuse injuries rather than immediate injuries (Walther et al., 2005). The knee, ankle, and foot are the most common sites of injury in running (Gomes Neto et al., 2023).
The biomechanics of the lower extremity during running are related to both runners’ performance and injury risk (Azeem et al., 2021; Zhang et al., 2021; Quan et al., 2023; Anderson et al., 2022; Zainuddin et al., 2022). For instance, the transition from hindfoot landing to forefoot landing may be accompanied by reductions in step length, step frequency, and other performance indicators (Azeem et al., 2021). Increased negative work of the knee joint may increase the potential risk of muscle injury around the knee joint (Hashizume et al., 2017). Furthermore, higher knee extension moments have been shown to increase peak patellofemoral joint (PFJ) stress (Zhang et al., 2022; Gu et al., 2024), which may lead to patellofemoral pain syndrome (Gu et al., 2024; Zhang et al., 2022). As a medium between the foot and the ground, the condition of running shoes could significantly impact the biomechanics of the lower extremity (Fu et al., 2022).
The heel-to-toe drop (HTD) of running shoes has significant effects on runners’ lower extremity biomechanics (Yu et al., 2022; Zhang et al., 2022; Gu et al., 2024; Malisoux et al., 2016). The HTD is defined as the difference in thickness between the heel and the forefoot of the shoes (Quan et al., 2023), which is a critical parameter of running footwear. Studies have demonstrated that wearing running shoes with a reduced HTD of approximately 15 mm immediately resulted in a 19%–24% decrease in the foot landing angle (Gu et al., 2024; Yu et al., 2022), and a reduction in knee extension moments by 9%–11% (Gu et al., 2024; Zhang et al., 2022) and the peak PFJ stress by 10%–15% (Gu et al., 2024; Zhang et al., 2022). These studies on acute tests led to a conclusion that reducing HTD of running shoes may be a potential strategy for reducing the risk of knee injuries in runners (Gu et al., 2024; Zhang et al., 2022; Zhang et al., 2021).
The long-term effects of reduced HTD on lower extremity biomechanics of runners are still not clear. The initial use of uniquely designed footwear results in higher biomechanical variability, which decreases during adaptation (Stöggl et al., 2010). Literature demonstrated that wearing zero or negative drop shoes resulted in an immediate reduction in foot landing angle (Gu et al., 2024; Yu et al., 2022). These acute effects of reduced HTD may continue to alter the foot landing angle during adaptation, thereby affecting lower extremity biomechanics. Accordingly, long-term follow-up studies on the effects of 0 or negative drop running shoes are essential. Given the higher vertical impact load rate of −8 mm drop shoes (Yu et al., 2022), some researchers suggest that choosing zero-drop shoes may be more appropriate than negative-drop shoes when implementing interventions with minimal HTD shoes (Yu et al., 2022; Davis et al., 2017).
The purpose of this study was to investigate: (1) the differences in gait parameters, lower extremity joint work and joint force between wearing zero-drop running shoes and 15 mm drop running shoes in the immediate test, (2) the changes in lower extremity biomechanics when wearing zero-drop running shoes before and after an 8-week intervention with zero-drop running shoes, and (3) the changes in lower extremity biomechanics when wearing 15 mm drop running shoes before and after the 8-week intervention with zero-drop running shoes. We hypothesized: (1) in the immediate test, the foot strike index (SI) of participants wearing zero-drop running shoes is significantly higher than when wearing 15 mm drop running shoes, (2) after long-term adaptation, the SI of participants is significantly higher than before, (3) in the immediate test, the peak PFJ stress of participants wearing zero-drop running shoes are significantly lower than when wearing 15 mm drop running shoes, (4) after long-term adaptation, the peak PFJ stress of participants is significantly lower than before, (5) in the immediate test, the knee joint negative work of participants wearing zero-drop running shoes is significantly lower than when wearing 15 mm drop running shoes, and (6) after long-term adaptation, the knee joint negative work of participants is significantly lower than before.
2 Methods
2.1 Participants
Seven male runners participated in this study (1.74 ± 0.03 m in standing height, 62.5 ± 3.1 kg in body weight, and 20.6 ± 0.7 kg/m2 in body mass index). Participants were included if they ran at least 10 km per week, had right-sided dominance (Li et al., 2022), and achieved a maximal oxygen uptake (VO2 max) greater than 50 mL/kg/min in a pre-test. Participants who were finally included in the study all had a weekly running volume greater than 30 km. Participants were excluded if they had suffered a lower extremity injury within 6 months prior to the study, or failed the Physical Activity Readiness Questionnaire (PAR-Q) screening.
2.2 Protocol
Before the intervention, participants underwent an immediate test (a pre-intervention test) at a running speed of 13 ± 0.65 km/h, corresponding to approximately 70% of their velocity at VO2 max (vVO2 max). Following this, they engaged in an 8-week running intervention. During the intervention, participants were requested to complete 30 km per week using the zero-drop running shoes while maintaining their preferred training speed. To ensure they achieved the prescribed distance, a researcher monitored the participants’ daily running volume and provided reminders of the remaining weekly mileage. After completing the intervention, participants underwent a post-intervention test. The post-intervention running speed was kept the same as the pre-intervention test because research has shown that running speed significantly affects lower extremity biomechanics (Arampatzis et al., 1999). In each test, participants ran in two types of shoes with one pair of shoes having an HTD of zero, while the other had an HTD of 15 mm (Figure 1). The shoe conditions are shown in Table 1.

Figure 1. Test shoes used in the study.

Table 1. Shoe conditions.
Twenty-six reflective markers were placed bilaterally at acromion, posterior superior iliac spines, anterior superior iliac spines, lateral thighs, lateral and medial femoral condyles, anterior superior shanks, lateral and medial malleoli, toe tips, posterior calcaneus, and first and fifth metatarsophalangeal joints. An additional marker was placed between the fourth and fifth lumbar vertebrae. Each participant had a standing static calibration test. The markers at medial femoral condyles and medial malleoli were then removed.
2.3 Data collection
Kinematic and kinetic data were collected synchronously during the running trials using two three-dimensional force plates (Kistler 9287C, Switzerland) at a sampling frequency of 1,000 Hz and an eight-camera infrared high-speed motion capture system (Qualisys Arqus 12, Sweden) at 200 Hz. Running speed was monitored by a portable timing system (Smart Speed, Australia), with two infrared emitters placed 3 m apart on one side of the force plates.
Each participant completed three successful trials for each shoe condition in each test (Zhang et al., 2022; Yu et al., 2022). A successful trial was defined as: (1) the participant’s running speed was within the required range, (2) the entire stance phase of the dominant leg, from initial contact to toe-off, occurred on the same force plate, and (3) run across the force platform area without any obvious movement adjustment.
2.4 Data reduction
The three-dimensional coordinate data of the markers were filtered by a second-order Butterworth low-pass digital filter with a frequency of 13.3 Hz (Yu et al., 1999). A vertical ground reaction force of 10 N was defined as the threshold for determining the landing and toe-off (Wang et al., 2021).
Step length was defined as the distance from the initial right foot landing to the subsequent left foot landing. Step time was defined as the duration from the initial right foot landing to the subsequent left foot landing. Stance time was defined as the duration from the initial right foot landing to the initial right foot toe-off. The SI was calculated to quantify the foot strike pattern of the runners, as described by Cavanagh (Cavanagh and Lafortune, 1980). A higher SI indicates a more forefoot strike pattern. The SI was calculated as:
where DCOP−Heel represented the distance between the center of pressure (COP) and the heel at the moment of initial right foot contact. Foot length was defined as the distance from the heel marker to the toe marker.
The definitions of lower extremity joint center, joint angles, and angular velocities were consistent with literature (Wu et al., 2002; Willwacher et al., 2013). The net joint moment of the hip, knee and ankle joints were calculated using inverse dynamics (Winter 2009). The net joint moment of the metatarsophalangeal (MTP) joint was calculated using the method described in Cigoja’s study (Cigoja et al., 2019). Joint power was defined as the product of the net joint moment and the angular velocity of the joint, and the trapezoidal method was used to calculate the joint power as an integral over time to obtain the joint work (Willwacher et al., 2013).
Studies have shown that frontal and transverse planes movements have minimal impact on the kinetic indicators during running (Harrison et al., 1986; Williams, 1985). Therefore, only sagittal plane data were analyzed in this study. This study calculated the net work, negative work, and positive work for the hip, knee, ankle, and MTP joints. Patellofemoral joint contact force and stress were calculated as described by Whyte and Vannatta (Whyte et al., 2010; Vannatta and Kernozek, 2015). The Achilles tendon (AT) force during running was approximated as the peak plantar flexion force, calculated as the ratio of the peak plantar flexion moment to the AT moment arm as described by Lyght and Rugg (Lyght et al., 2016; Rugg et al., 1990). All joint force and work results were normalized by their own body weight (BW).
2.5 Data analyses
To test hypotheses 1 to 3, paired t-tests were used to compare the differences in lower extremity biomechanics when participants wore zero-drop running shoes compared to 15 mm drop running shoes in pre-intervention test. To test hypotheses 4 to 6, paired sample t-tests were used to compare the differences in lower extremity biomechanics between pre- and post-intervention tests. It should be noted that this study did not involve multiple comparisons. Statistical testing results with Type I error rate less than 0.05 were considered as statistically significant. All data analyses were performed using SPSS Computer Program Package Version 26.0 (SPSS Science, Chicago, IL, United States). Effect sizes were calculated using Cohen’s d, with Cohen’s d < 0.5 being defined as “small”, 0.5 ≤ Cohen’s d ≤ 0.8 as “medium”, and Cohen’s d > 0.8 as “large”.
3 Results
In pre-intervention test, no significant differences were observed in SI (t = 1.821, p = 0.118, Cohen’s d = 0.74), step length (t = −0.354, p = 0.736, Cohen’s d = 0.14), step time (t = 1.100, p = 0.314, Cohen’s d = 0.45), and stance time (t = −0.147, p = 0.888, Cohen’s d = 0.06) for participants wearing zero-drop running shoes compared to 15 mm drop running shoes. In post-intervention test, the SI was significantly higher (zero-drop: p = 0.021, 15 mm drop: p = 0.049), and the stance time (zero-drop: p = 0.008, 15 mm drop: p = 0.005) was significantly lower compared to the pre-intervention test. No significant difference was observed in step length between pre- and post-intervention tests (zero-drop: p = 0.070, 15 mm drop: p = 0.967). In post-intervention test, the step time of zero-drop running shoes was significantly lower compared to the pre-intervention test (p = 0.032). No significant difference was observed in step time of 15 mm drop running shoes between pre- and post-intervention tests (p = 0.814) (Table 2).
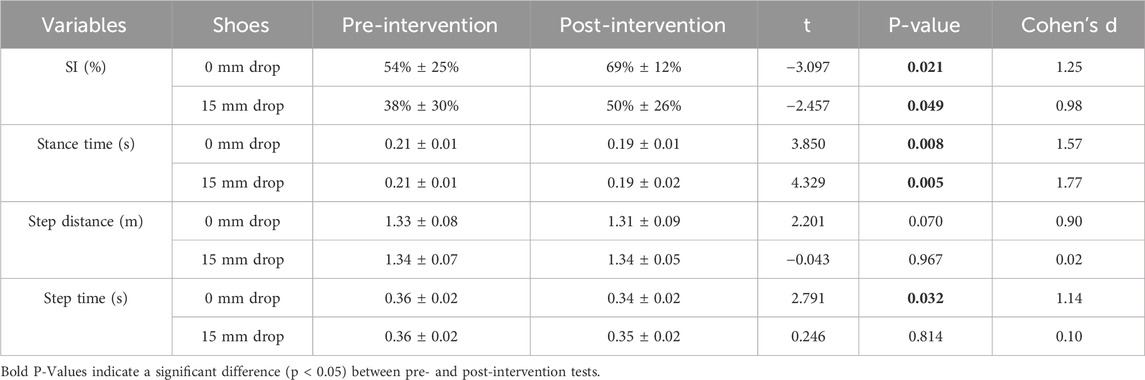
Table 2. Gait indicators.
In pre-intervention test, the peak PFJ stress (t = −3.625, p = 0.011, Cohen’s d = 1.48) was significantly lower when participants wore zero-drop running shoes compared to 15 mm drop running shoes. No significant differences were observed in AT force (t = −0.126, p = 0.904, Cohen’s d = 0.05) and PFJ force (t = −1.845, p = 0.115, Cohen’s d = 0.94) between wearing zero-drop running shoes and 15 mm drop running shoes. In post-intervention test, the peak PFJ stress (zero-drop: p = 0.011, 15 mm drop: p = 0.004) was significantly higher compared to the pre-intervention test. No significant differences were observed in PFJ force (zero-drop: p = 0.056, 15 mm drop: p = 0.086) and AT force (zero-drop: p = 0.606, 15 mm drop: p = 0.213) between pre- and post-intervention tests (Table 3).
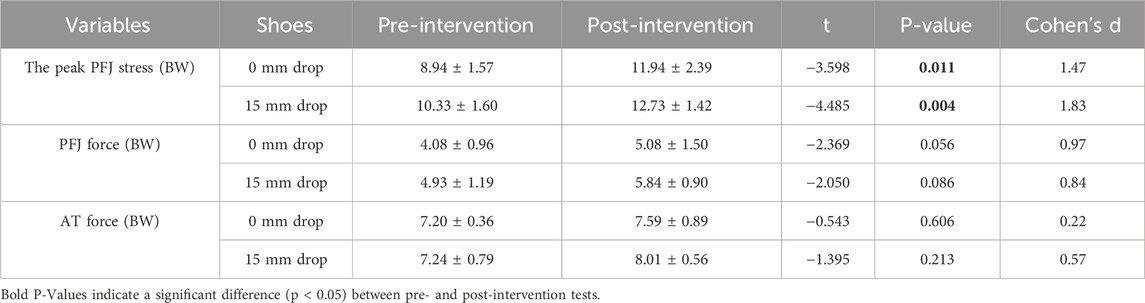
Table 3. Joint force and stress.
In pre-intervention test, the net work (t = 2.988, p = 0.024, Cohen’s d = 1.22) and negative work (t = 3.554, p = 0.012, Cohen’s d = 1.45) of hip joint were significantly lower when participants wore zero-drop running shoes compared to 15 mm drop running shoes. No significant differences were observed in hip joint positive work between zero-drop and 15 mm drop running shoes (t = 0.305, p = 0.771, Cohen’s d = 0.12). In post-intervention test, the positive work (zero-drop: p = 0.014, 15 mm drop: p = 0.005) and negative work (zero-drop: p = 0.004, 15 mm drop: p = 0.009) of hip joint were significantly greater compared to the pre-intervention test. No significant differences were observed in hip joint net work between pre- and post-intervention tests (zero-drop: p = 0.735, 15 mm drop: p = 0.134) (Table 4).
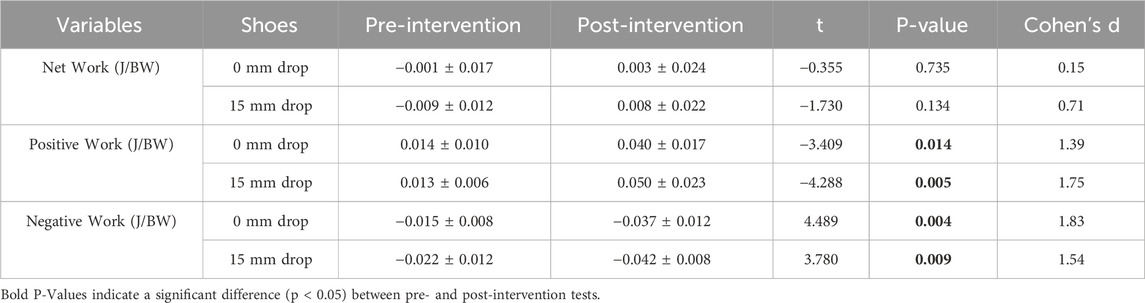
Table 4. Hip joint work.
In pre-intervention test, the knee joint negative work was significantly lower when participants wore zero-drop running shoes compared to 15 mm drop running shoes (t = 2.787, p = 0.032, Cohen’s d = 1.14). No significant differences were observed in net work (t = 1.884, p = 0.109, Cohen’s d = 0.77) and positive work (t = −3.392, p = 0.190, Cohen’s d = 0.60) of knee joint between zero-drop and 15 mm drop running shoes. In post-intervention test, the knee joint net work was significantly lower (zero-drop: p = 0.015, 15 mm drop: p = 0.040), and the knee joint positive work was significantly greater compared to the pre-intervention test (zero-drop: p = 0.002, 15 mm drop: p = 0.040). No significant differences were observed in knee joint negative work between pre- and post-intervention tests (zero-drop: p = 0.942, 15 mm drop: p = 0.767) (Table 5).
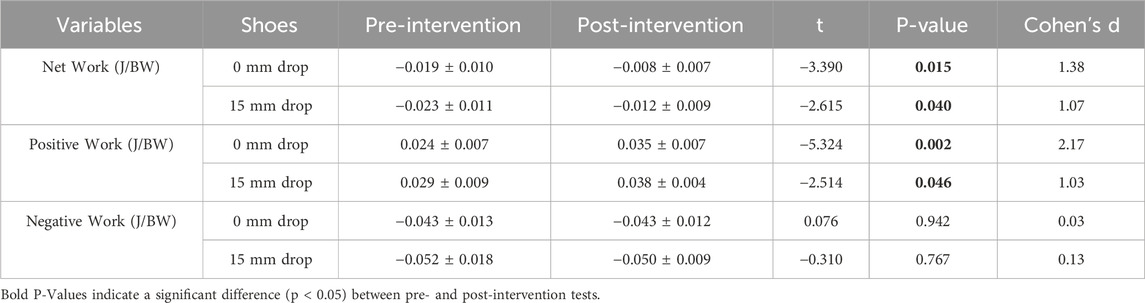
Table 5. Knee joint work.
In pre-intervention test, no significant differences were observed in net work (t = 1.057, p = 0.331, Cohen’s d = 0.43), positive work (t = 0.280, p = 0.789, Cohen’s d = 0.11), and negative work (t = 0.508, p = 0.629, Cohen’s d = 0.21) of ankle joint when participants wore zero-drop running shoes compared to 15 mm drop running shoes. In post-intervention test, the ankle joint net work was significantly lower compared to the pre-intervention test (zero-drop: p = 0.004, 15 mm drop: p = 0.002). No significant difference was observed in ankle joint positive work between pre- and post-intervention tests (zero-drop: p = 0.301, 15 mm drop: p = 0.253). No significant difference was observed in ankle joint negative work of zero-drop running shoes between pre- and post-intervention tests (p = 0.210). In post-intervention test, the ankle joint negative work of 15 mm drop running shoes was significantly lower compared to the pre-intervention test (p = 0.018) (Table 6).
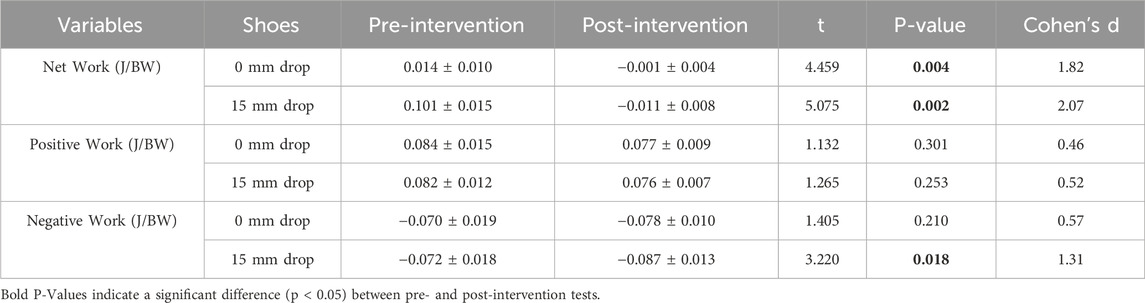
Table 6. Ankle joint work.
In pre-intervention test, the net work (t = 6.158, p = 0.001, Cohen’s d = 2.51), positive work (t = 0.382, p = 0.015, Cohen’s d = −1.38), and negative work (t = 6.117, p = 0.001, Cohen’s d = 2.50) of MTP joint were significantly lower when participants wore zero-drop running shoes compared to 15 mm drop running shoes. In post-intervention test, the net work (zero-drop: p = 0.041, 15 mm drop: p = 0.044), positive work (zero-drop: p = 0.008, 15 mm drop: p = 0.001), and negative work (zero-drop: p = 0.029, 15 mm drop: p = 0.029) of MTP joint were significantly lower compared to the pre-intervention test (Table 7).
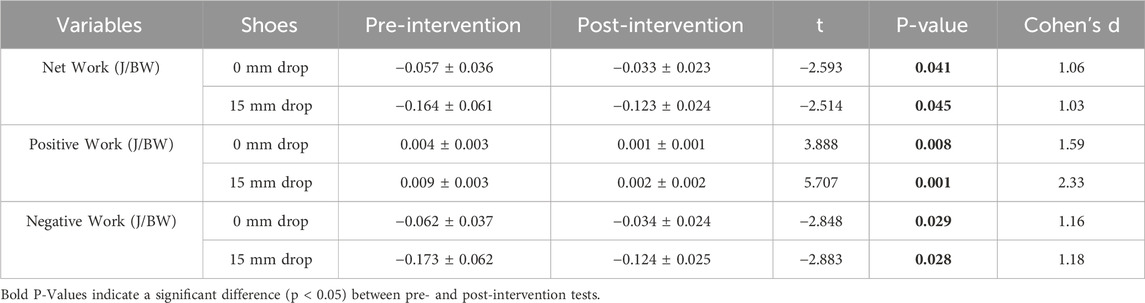
Table 7. MTP joint work.
4 Discussion
This study investigated the immediate and long-term effects of zero-drop running shoes on lower extremity joint biomechanics. The results of this study did not support our first hypothesis that in the immediate test, the SI of participants wearing zero-drop running shoes would be higher than that of those wearing 15 mm drop running shoes. The results of this study did support the second hypothesis that the SI would increase after long-term adaptation. The results of this study supported our third hypothesis that, in the immediate test, participants wearing zero-drop running shoes had significantly lower peak PFJ stress compared to those wearing 15 mm drop running shoes. However, the study did not support our fourth hypothesis that peak PFJ stress would be significantly lower after long-term adaptation. The results of this study supported our fifth hypothesis that, in the immediate test, participants wearing zero-drop running shoes had significantly less negative knee joint work compared to those wearing 15 mm drop running shoes. The results of this study did not support our sixth hypothesis that participants’ knee joint negative work would decrease further after adaptation. In conclusion, after long-term adaptation, there was a more forward foot strike pattern, redistribution of lower extremity joint work, and changes in PFJ stress, which may affect runners’ performance and injury risk.
For foot strike pattern, previous studies demonstrated that zero or negative drop running shoes could reduce the foot landing angle immediately (Zhang et al., 2022; Gu et al., 2024). However, some studies suggested that changing running shoes does not immediately change the foot strike pattern (Mullen et al., 2019). These inconsistent results were possibly due to differences in shoe design and test conditions. In addition to HTD, cushioning is also an influential factor in foot strike pattern. Specifically, the better the cushioning, the more likely a runner is to adopt a rearfoot strike pattern (Squadrone et al., 2015). In terms of sole materials, the zero-drop running shoes used in this study have a lower cushioning effect, while the 15 mm drop shoes have a higher cushioning effect. However, the acute test results in this study showed no significant differences in SI between these two shoes. After long-term adaptation, participants’ foot strike pattern shifted forward, with a 15% increase in SI for zero-drop running shoes and a 12% increase for 15 mm drop running shoes. Previous research has shown that the effect of shoe cushioning on lower extremity biomechanics is independent of adaptation time (Agresta et al., 2018). Therefore, we believe that the observed changes in foot strike patterns following the intervention were primarily driven by adaptation to the zero-drop design, which subsequently influenced lower extremity biomechanics. While forefoot strike patterns have been suggested to reduce impact and push-off force (Mullen et al., 2019), recent prospective research shows no definitive link between foot strike patterns and overall injury risk (Dillon et al., 2023). However, specific injuries, such as increased knee joint stress linked to rearfoot strike pattern and Achilles tendon force associated with forefoot strike patterns, remain important considerations (Dillon et al., 2023). Meanwhile, stance time decreased significantly after long-term adaptation, suggesting that zero-drop running shoes may alter gait patterns. Gait retraining could be widely used to treat running-related injuries (Moran and Wager, 2020).
For joint force, in the immediate test, wearing zero-drop running shoes resulted in a 13% reduction in peak PFJ stress compared to 15 mm drop running shoes, consistent with previous studies. Research demonstrated that shoes with a 10–16 mm HTD reduction could reduce the peak PFJ stress by 9%–16% (Gu et al., 2024; Zhang et al., 2022), primarily due to the reduction in knee joint extension moment (Zhang et al., 2022). These studies suggested that zero or negative HTD shoes effectively reduced the peak PFJ stress, thereby reducing injury risk. Previous studies have demonstrated that increased shoe cushioning is associated with a reduction in joint forces (Meardon et al., 2018). The results of this study suggest that less cushioned, zero-drop running shoes effectively reduced the peak PFJ stress of runners. This indicates that shoe cushioning may not be the primary factor influencing joint force, and other design features such as HTD may play a significant role. After long-term adaptation, the peak PFJ stress increased, possibly due to an increase in lower extremity strength during adaptation to zero-drop running shoes. Previous studies have demonstrated that different strength training methods affect knee extension moments (Aagaard et al., 1994), which in turn affect the peak PFJ stress (Zhang et al., 2022).
For joint work, in the immediate test, wearing zero-drop running shoes resulted in a 17% reduction in negative knee joint work compared to 15 mm drop running shoes. This suggested that zero-drop shoes could reduce the knee joint load during running, thereby decreasing knee joint injury risk and muscle fatigue (Hashizume et al., 2017). No significant change was observed in knee joint negative work between pre- and post-intervention tests, indicating that the reduction in negative work with zero-drop running shoes was unrelated to adaptation. Additionally, results also showed that after long-term adaptation, participants’ ankle joint negative work increased. Studies have demonstrated that a forefoot strike pattern would increase ankle joint negative work and decrease knee joint negative work (Hamill et al., 2014). Negative joint work was associated with a higher risk of muscle injury around the joint (Hashizume et al., 2017). Therefore, runners with poor ankle strength might not be suitable for zero-drop running shoes. In acute tests, the positive and negative work of the MTP joint was lower when wearing zero-drop running shoes. Moreover, after intervention, it was further reduced. Research has found that zero-drop running shoes could reduce MTP joint load and save energy output (Martinez et al., 2024), which is consistent with the results of our study. In this study, besides the significant difference in HTD, the zero-drop shoes had greater stiffness compared to the 15 mm drop shoes. Previous studies have indicated that shoe stiffness primarily affects MTP joint work (Liu et al., 2024). And stiffer shoes leading to a reduction in MTP negative work (Cigoja et al., 2019; Liu et al., 2024) but increase in MTP positive work (Cigoja et al., 2019), which is not entirely consistent with our result. Overall, the sustained decrease in MTP positive and negative work after long-term adaptation may be attributed to the combined effects of higher shoe stiffness and lower HTD, and is mainly influenced by HTD. Research demonstrated that changes in MTP joint power are potential mechanisms for the redistribution of lower extremity joint work (Cigoja et al., 2019). In this study, hip joint negative work, hip joint positive work, and knee joint positive work were increased after long-term adaptation, indicating greater energy output and load at hip joint and greater energy output at the knee joint. The results of this study showed that runners’ lower extremity joint work was redistributed after long-term adaptation.
This study provides a preliminary examination of the effects of long-term adaptation to zero-drop running shoes on lower extremity biomechanics. Several limitations of this study should be acknowledged. First, the running speed during the test was constant, whereas running speed significantly affects lower extremity biomechanics (Arampatzis et al., 1999). Second, we did not measure changes in muscle strength around the joints before and after the intervention, so conclusions about injury risk should be treated with caution and warrant further investigation. Previous studies have shown that, in addition to footwear, running surface type also influences lower extremity biomechanics (Yang et al., 2024). Therefore, future research should focus on examining lower extremity biomechanics under varying running speeds and surface conditions to better inform footwear selection based on running conditions. In addition, lower extremity stiffness would influence the running performance (Ziliaskoudis et al., 2019). Future research can further explore the impact of zero-drop running shoes on lower extremity stiffness.
5 Conclusion
This study found that long-term wearing of zero-drop running shoes resulted in a more forefoot strike pattern in runners. While wearing zero-drop running shoes could immediately reduce the peak PFJ stress, long-term wearing could increase this stress. Long-term wearing of zero-drop running shoes affected the distribution of lower extremity joint work, specifically decreasing the load on the MTP joint while increasing the load on the hip and ankle joints.
Data availability statement
The raw data supporting the conclusions of this article will be made available by the authors, without undue reservation.
Ethics statement
The studies involving humans were approved by Ethics Committee of Beijing Sport University. The studies were conducted in accordance with the local legislation and institutional requirements. The participants provided their written informed consent to participate in this study.
Author contributions
ZL: Data curation, Investigation, Software, Writing–original draft, Writing–review and editing. YZ: Data curation, Investigation, Methodology, Software, Writing–review and editing. HL: Supervision, Writing–review and editing. PC: Funding acquisition, Resources, Supervision, Writing–review and editing. ZZ: Resources, Writing–review and editing. QZ: Resources, Writing–review and editing.
Funding
The author(s) declare that financial support was received for the research, authorship, and/or publication of this article. Supported by “the Fundamental Research Funds for the Central Universities”, Beijing Sport University (Grant Number: 2024TNJN009).
Acknowledgments
The authors would like to extend their gratitude to the study participants and testers who are not included on the author list.
Conflict of interest
Authors ZZ and QZ were employed by Anta (China) Co., Ltd.
The remaining authors declare that the research was conducted in the absence of any commercial or financial relationships that could be construed as a potential conflict of interest.
The reviewer ZY declared a past co-authorship with the authors HL, ZZ to the handling editor.
Publisher’s note
All claims expressed in this article are solely those of the authors and do not necessarily represent those of their affiliated organizations, or those of the publisher, the editors and the reviewers. Any product that may be evaluated in this article, or claim that may be made by its manufacturer, is not guaranteed or endorsed by the publisher.
References
Aagaard, P., Simonsen, E. B., Trolle, M., Bangsbo, J., and Klausen, K. (1994). Effects of different strength training regimes on moment and power generation during dynamic knee extensions. Eur. J. Appl. Physiol. Occup. Physiol. 69, 382–386. doi:10.1007/BF00865399
Agresta, C., Kessler, S., Southern, E., Goulet, G. C., Zernicke, R., and Zendler, J. D. (2018). Immediate and short-term adaptations to maximalist and minimalist running shoes. Footwear Sci. 10, 95–107. doi:10.1080/19424280.2018.1460624
Anderson, L. M., Martin, J. F., Barton, C. J., and Bonanno, D. R. (2022). What is the effect of changing running step rate on injury, performance and biomechanics? A systematic review and meta-analysis. Sports Med. - Open 8, 112. doi:10.1186/s40798-022-00504-0
Arampatzis, A., Brüggemann, G. P., and Metzler, V. (1999). The effect of speed on leg stiffness and joint kinetics in human running. J. Biomech. 32, 1349–1353. doi:10.1016/s0021-9290(99)00133-5
Azeem, Z., Rathod, P., and Palekar, T. J. (2021). Barefoot running: myths and realities of barefoot and shod mechanics towards implicating running related injuries. J. Clin. DIAGNOSTIC Res. 15. doi:10.7860/JCDR/2021/49889.15500
Cavanagh, P. R., and Lafortune, M. A. (1980). Ground reaction forces in distance running. J. Biomech. 13, 397–406. doi:10.1016/0021-9290(80)90033-0
Cigoja, S., Firminger, C. R., Asmussen, M. J., Fletcher, J. R., Edwards, W. B., and Nigg, B. M. (2019). Does increased midsole bending stiffness of sport shoes redistribute lower limb joint work during running? J. Sci. Med. SPORT 22, 1272–1277. doi:10.1016/j.jsams.2019.06.015
Davis, I. S., Rice, H. M., and Wearing, S. C. (2017). Why forefoot striking in minimal shoes might positively change the course of running injuries. J. Sport Health Sci. 6, 154–161. doi:10.1016/j.jshs.2017.03.013
Desai, P., Jungmalm, J., Börjesson, M., Karlsson, J., and Grau, S. (2021). Recreational runners with a history of injury are twice as likely to sustain a running-related injury as runners with No history of injury: a 1-year prospective cohort study. J. Orthop. and SPORTS Phys. Ther. 51, 144–150. doi:10.2519/jospt.2021.9673
Dillon, S., Burke, A., Whyte, E. F., O’Connor, S., Gore, S., and Moran, K. A. (2023). Running towards injury? A prospective investigation of factors associated with running injuries. PLOS ONE 18, e0288814. doi:10.1371/journal.pone.0288814
Fu, F., Guo, L., Tang, X., Wang, J., Xie, Z., Fekete, G., et al. (2022). Effect of the innovative running shoes with the special midsole structure on the female runners' lower limb biomechanics. Front. Bioeng. Biotechnol. 10, 866321. doi:10.3389/fbioe.2022.866321
Gomes Neto, M., Fossati Metsavaht, L., Luciano Arcanjo, F., DE Souza GuimarãES, J., ConceiçãO, C. S., Guadagnin, E. C., et al. (2023). Epidemiology of lower-extremity musculoskeletal injuries in runners: an overview of systematic reviews. Curr. Emerg. Hosp. Med. Rep. 11, 74–87. doi:10.1007/s40138-023-00263-6
Gu, Y., Zheng, Z., Zeng, Q., Yang, C., Song, Y., and Wan, X. (2024). Acute effects of negative heel shoes on perceived pain and knee biomechanical characteristics of runners with patellofemoral pain. J. Foot Ankle Res. 17, e12001. doi:10.1002/jfa2.12001
Hamill, J., Gruber, A. H., and Derrick, T. R. (2014). Lower extremity joint stiffness characteristics during running with different footfall patterns. Eur. J. Sport Sci. 14, 130–136. doi:10.1080/17461391.2012.728249
Harrison, R. N., Lees, A., Mccullagh, P. J., and Rowe, W. B. (1986). A bioengineering analysis of human muscle and joint forces in the lower limbs during running. J. Sports Sci. 4, 201–218. doi:10.1080/02640418608732119
Hashizume, S., Murai, A., Hobara, H., Kobayashi, Y., Tada, M., and Mochimaru, M. (2017). Training shoes do not decrease the negative work of the lower extremity joints. Int. J. Sports Med. 38, 921–927. doi:10.1055/s-0043-117412
Hollander, K., Baumann, A., Zech, A., and Verhagen, E. (2018). Prospective monitoring of health problems among recreational runners preparing for a half marathon. BMJ open sport and Exerc. Med. 4, e000308. doi:10.1136/bmjsem-2017-000308
Li, Q. J., Wan, X. L., Liu, H., Zhu, X. L., Zheng, Z. Y., and Qu, F. (2022). Effect of forefoot bending stiffness of running shoes on the running economy and joint work of lower extremity in male runners. J. Chengdu Sport Univ. 48, 101–106. doi:10.15942/j.jcsu.2022.06.016
Liu, Z. L., Yang, F., Ma, R. Y., and Ding, L. (2024). Impact of footwear bending stiffness on lower-limb work redistribution and running economy. J. Mech. Med. Biol. doi:10.1142/S021951942440044X
Lyght, M., Nockerts, M., Kernozek, T. W., and Ragan, R. (2016). Effects of foot strike and step frequency on Achilles tendon stress during running. J. Appl. Biomech. 32, 365–372. doi:10.1123/jab.2015-0183
Malisoux, L., Chambon, N., Urhausen, A., and Theisen, D. (2016). Influence of the heel-to-toe drop of standard cushioned running shoes on injury risk in leisure-time runners A randomized controlled trial with 6-month follow-up. Am. J. Sports Med. 44, 2933–2940. doi:10.1177/0363546516654690
Martinez, E., Hoogkamer, W., Powell, D. W., and Paquette, M. R. (2024). The influence of “Super-Shoes” and foot strike pattern on metabolic cost and joint mechanics in competitive female runners. Med. Sci. sports Exerc. 56, 1337–1344. doi:10.1249/MSS.0000000000003411
Meardon, S. A., Willson, J. D., Kernozek, T. W., Duerst, A. H., and Derrick, T. R. (2018). Shoe cushioning affects lower extremity joint contact forces during running. Footwear Sci. 10, 109–117. doi:10.1080/19424280.2018.1501771
Moran, M. F., and Wager, J. C. (2020). Influence of gait retraining on running economy: a review and potential applications. Strength and Cond. J. 42, 12–23. doi:10.1519/SSC.0000000000000511
Mullen, S. M., Toby, E. B., Mar, D. E., Bechtold, M., Vopat, B. G., Melugin, H., et al. (2019). Initial response of mature, experienced runners to barefoot running: transition to forefoot strike. Kans. J. Med. 12, 117–120.
Quan, W., Gao, L., Xu, D., Zhou, H., Korim, T., Shao, S., et al. (2023). Simulation of lower limb muscle activation using running shoes with different heel-to-toe drops using opensim. Healthcare 11, 1243. doi:10.3390/healthcare11091243
Rugg, S. G., Gregor, R. J., Mandelbaum, B. R., and Chiu, L. (1990). In vivo moment arm calculations at the ankle using magnetic resonance imaging (MRI). J. Biomech. 23, 495–501. doi:10.1016/0021-9290(90)90305-m
Scheer, V., Tiller, N. B., Doutreleau, S., Khodaee, M., Knechtle, B., Pasternak, A., et al. (2022). Potential long-term health problems associated with ultra-endurance running: a narrative review. Sports Med. 52, 725–740. doi:10.1007/s40279-021-01561-3
Squadrone, R., Rodano, R., Hamill, J., and Preatoni, E. (2015). Acute effect of different minimalist shoes on foot strike pattern and kinematics in rearfoot strikers during running. J. Sports Sci. 33, 1196–1204. doi:10.1080/02640414.2014.989534
StöGGL, T., Haudum, A., Birklbauer, J., Murrer, M., and MüLLER, E. (2010). Short and long term adaptation of variability during walking using unstable (Mbt) shoes. Clin. Biomech. (Bristol, Avon) 25, 816–822. doi:10.1016/j.clinbiomech.2010.05.012
Vannatta, C. N., and Kernozek, T. W. (2015). Patellofemoral joint stress during running with alterations in foot strike pattern. Med. Sci. Sports Exerc 47, 1001–1008. doi:10.1249/MSS.0000000000000503
Walther, M., Reuter, I., Leonhard, T., and Engelhardt, M. (2005). Injuries and response to overload stress in running as a sport. Der Orthop. 34, 399–404. doi:10.1007/s00132-005-0790-0
Wang, Y., Ren, H., Tang, Y. Q., Liang, L. C., Zou, L. M., Liu, Y., et al. (2021). Effects of shoe type and walking speed on knee joint loads. J. Med. Biomech 36, 725–731. doi:10.16156/j.1004-7220.2021.05.010
Whyte, E. F., Moran, K., Shortt, C. P., and Marshall, B. (2010). The influence of reduced hamstring length on patellofemoral joint stress during squatting in healthy male adults. Gait Posture 31, 47–51. doi:10.1016/j.gaitpost.2009.08.243
Williams, K. R. (1985). The relationship between mechanical and physiological energy estimates. Med. Sci. Sports Exerc 17, 317–325. doi:10.1249/00005768-198506000-00004
Willwacher, S., Koenig, M., Potthast, W., and Brueggemann, G.-P. (2013). Does specific footwear facilitate energy storage and return at the metatarsophalangeal joint in running? J. Appl. Biomechanics 29, 583–592. doi:10.1123/jab.29.5.583
Winter, D. A. (2009) “Kinetics: forces and moments of force,” in Biomechanics and motor control of human movement.
Wu, G., Siegler, S., Allard, P., Kirtley, C., Leardini, A., Rosenbaum, D., et al. (2002). ISB recommendation on definitions of joint coordinate system of various joints for the reporting of human joint motion-part I: ankle, hip, and spine. International Society of Biomechanics. J. Biomech. 35, 543–548. doi:10.1016/s0021-9290(01)00222-6
Yang, Z. H., Cui, C. Y., Zhou, Z. P., Zheng, Z. Y., Yan, S. H., Liu, H., et al. (2024). Effect of midsole hardness and surface type cushioning on landing impact in heel-strike runners. J. Biomechanics 165. doi:10.1016/j.jbiomech.2024.111996
Yu, B., Gabriel, D., Noble, L., and An, K.-N. (1999). Estimate of the optimum cutoff frequency for the Butterworth low-pass digital filter. J. Appl. biomechanics 15, 319–329. doi:10.1123/jab.15.3.318
Yu, P., He, Y., Gu, Y., Liu, Y., Xuan, R., and Fernandez, J. (2022). Acute effects of heel-to-toe drop and speed on running biomechanics and strike pattern in male recreational runners: application of statistical nonparametric mapping in lower limb biomechanics. Front. Bioeng. Biotechnol. 9, 821530. doi:10.3389/fbioe.2021.821530
Zainuddin, F. L., Abd Rahman, N. A., Razman, R., and Shaharudin, S. (2022). Lower limb biomechanical factors associated with Achilles tendinopathy in runners: a systematic review. Sport Sci. Health 18, 27–38. doi:10.1186/1757-1146-4-15
Zhang, M., Shi, H., Liu, H., and Zhou, X. (2021). Biomechanical analysis of running in shoes with different heel-to-toe drops. Appl. Sci. 11, 12144. doi:10.3390/app112412144
Zhang, M., Zhou, X., Zhang, L., Liu, H., and Yu, B. (2022). The effect of heel-to-toe drop of running shoes on patellofemoral joint stress during running. Gait and Posture 93, 230–234. doi:10.1016/j.gaitpost.2022.02.008
Keywords: zero-drop running shoes, running biomechanics, strike pattern, joint work, running injury
Citation: Liu Z, Zhou Y, Liu H, Cheng P, Zheng Z and Zeng Q (2025) Immediate and long-term effects of zero-drop running shoes on lower extremity biomechanics. Front. Bioeng. Biotechnol. 13:1462159. doi: 10.3389/fbioe.2025.1462159
Received: 09 July 2024; Accepted: 06 January 2025;
Published: 22 January 2025.
Edited by:
Zixiang Gao, University of Calgary, CanadaCopyright © 2025 Liu, Zhou, Liu, Cheng, Zheng and Zeng. This is an open-access article distributed under the terms of the Creative Commons Attribution License (CC BY). The use, distribution or reproduction in other forums is permitted, provided the original author(s) and the copyright owner(s) are credited and that the original publication in this journal is cited, in accordance with accepted academic practice. No use, distribution or reproduction is permitted which does not comply with these terms.
*Correspondence: Peng Cheng, Y2hlbmdwZW5nNTI5QDEyNi5jb20=