 Margherita Botticelli1
 John Metzcar2
 Thomas Phillips3
 Susan Cox3
 Pradeep Keshavanarayana1,4*
 Fabian Spill1*
- 1School of Mathematics, College of Engineering and Physical Sciences, University of Birmingham, Birmingham, United Kingdom
- 2Intelligent Systems Engineering, Indiana University, Bloomington, IN, United States
- 3Randall Centre for Cell and Molecular Biophysics, King’s College London, London, United Kingdom
- 4Centre for Computational Medicine, University College London, London, United Kingdom
Metastasis, the leading cause of death in cancer patients, arises when cancer cells disseminate from a primary solid tumour to distant organs. Growth and invasion of the solid tumour often involve collective cell migration, which is profoundly influenced by cell-cell interactions and the extracellular matrix (ECM). The ECM’s biochemical composition and mechanical properties, such as stiffness, regulate cancer cell behaviour and migration dynamics. Mathematical modelling serves as a pivotal tool for studying and predicting these complex dynamics, with hybrid discrete-continuous models offering a powerful approach by combining agent-based representations of cells with continuum descriptions of the surrounding microenvironment. In this study, we investigate the impact of ECM stiffness, modulated via ribose-induced collagen cross-linking, on cancer spheroid growth and invasion. We employed a hybrid discrete-continuous model implemented in PhysiCell to simulate spheroid dynamics, successfully replicating three-dimensional in vitro experiments. The model incorporates detailed representations of cell-cell and cell-ECM interactions, ECM remodelling, and cell proliferation. Our simulations align with experimental observations of two breast cancer cell lines, non-invasive MCF7 and invasive HCC 1954, under varying ECM stiffness conditions. The results demonstrate that increased ECM stiffness due to ribose-induced cross-linking inhibits spheroid invasion in invasive cells, whereas non-invasive cells remain largely unaffected. Furthermore, our simulations show that higher ECM degradation by the cells not only enables spheroid growth and invasion but also facilitates the formation of multicellular protrusions. Conversely, increasing the maximum speed that cells can reach due to cell-ECM interactions enhances spheroid growth while promoting single-cell invasion. This hybrid modelling approach enhances our understanding of the interplay between cancer cell migration, proliferation, and ECM mechanical properties, paving the way for future studies incorporating additional ECM characteristics and microenvironmental conditions.
1 Introduction
The extracellular matrix (ECM) is a complex network of numerous macromolecules present within all tissues outside the cells. It comprises approximately 300 different proteins, with fibrous proteins such as collagens being the most abundant (Yue, 2014). The ECM’s composition and structure, which vary based on tissue type and location, determine distinct mechanical and biochemical properties, which regulate tissue homeostasis, cell differentiation and growth, and largely influence cell migration (Muncie and Weaver, 2018). The physical and mechanical characteristics of the ECM, including fibre orientation, stiffness, viscoelasticity and porosity, affect the cell’s direction of movement, speed and various modes of migration (single or collective) (Yamada et al., 2022). The ECM plays an important role in regulating cell migration during cancer metastasis, which is the primary cause of death in cancer patients (Yamada and Sixt, 2019). More mesenchymal cancer cell lines typically invade as single cells and this mode of invasion is profoundly impacted by ECM pore and fibre size (Rodríguez-Cruz et al., 2024). In solid tumours, when cancer cells migrate collectively, their movement is directed by both cell-cell interactions and their interaction with the ECM (Janiszewska et al., 2020). When cells interact with the ECM, they sense and respond to mechanical cues from the ECM through mechanotransduction pathways, often mediated by integrin signalling (Kanchanawong and Calderwood, 2023). These cues can trigger intracellular signalling cascades, ultimately impacting cell behaviour (Alert and Trepat, 2020; Muncie and Weaver, 2018). The tumour microenvironment differs significantly from healthy microenvironments and is heavily remodelled by cancer cells and fibroblasts (Winkler et al., 2020). Understanding how cancer cells sense and respond to the ECM and its mechanical and biochemical features is crucial to better understanding cancer cell migration and invasion.
Over the years, researchers have investigated cell-ECM interactions in relation to various mechanical properties of the ECM, including stiffness, a material’s resistance to deformation. Notably, increases in ECM stiffness can happen during tumour progression and affect cancer cell behaviour and migration (Wullkopf et al., 2018; Micalet et al., 2023; Jahin et al., 2023). Furthermore, higher ECM stiffness in breast cancers is usually associated with poor prognosis and drug resistance (Joyce et al., 2018; Jahin et al., 2023). Many studies looking at ECM stiffness employ in vitro models that simplify the ECM composition, for example, by using only collagen to represent the ECM, and are performed in two dimensions due to ease of sample generation, their simplicity in analysing the results and easier reproducibility (Micalet et al., 2023). However, there are intrinsic differences between cell cultures in two-dimensional (2D) and three-dimensional (3D) matrices. Cell migration features, such as migration speed, directionality, cell morphology and cytoskeletal organisation are profoundly influenced by the surrounding ECM, while key factors seen in vivo such as ECM remodelling inherently require an ECM component (Cavo et al., 2016; Gonçalves and Garcia-Aznar, 2021). For example, cells on 2D matrices present a flatter and more spread-out morphology with large flat protrusions (lamellipodia) mainly localised at the leading edge of the cell. In 3D the cells have a more varied morphology and form protrusions on the whole cell surface, such as pseudopodia and invadopodia, adapting to the surrounding ECM (Caswell and Zech, 2018). Therefore, to faithfully replicate 3D in vivo tumour microenvironments, we must focus on 3D in vitro ECM models rather than relying solely on 2D models. However, creating 3D in vitro ECM models presents challenges due to their complexity, both in sample preparation and data analysis, which explains why researchers often turn to 2D experiments to study mechanical effects of the ECM.
A recent review by Micalet et al. (2023) collected various papers investigating the effects of ECM stiffness in 3D in vitro models of epithelial cancer cells. Some studies found that matrices with higher stiffness can enhance cell migration, and promote epithelial-to-mesenchymal transition (EMT), a process associated with increased invasiveness (Wei et al., 2015; Stowers et al., 2017). On the other hand, other studies have found that less stiff matrices can drive more invasive phenotypes in cancer cells and spheroids (Staneva et al., 2018; Berger et al., 2020; Jahin et al., 2023). Thus, the effect of ECM on cancer migration and invasion depends not only on stiffness, but on several factors, including the cancer cell type, the involvement of other cells such as fibroblasts, and the composition and structure of the surrounding microenvironment. Furthermore, ECM stiffness in in vitro models can be modulated using different techniques, each affecting cell migration differently. One approach involves increasing the collagen density and therefore the extracellular matrix stiffness. However, this alters the structural properties of the ECM, such as its porosity, and influences cell behaviour, including the formation and number of focal adhesions (cell-ECM adhesion sites), which often alters cell migration (Mason et al., 2013). Another method is to modify the alginate hydrogel density. However, this limits cell migration by preventing chemical remodelling of the ECM, essential for cell invasion (Mason et al., 2013). In other studies, the stiffness of the collagen matrix is modulated using non-enzymatic glycation, induced by sugars such as threose and ribose. This process increases cross-links among collagen fibres, increasing fibre stiffness without modifying the structure of the ECM (Staneva et al., 2018; Jahin et al., 2023). The different approaches used in modelling and measuring cancer cell invasion in 3D lead to contradictory results which are also difficult to compare. It is therefore even harder to understand the mechanisms behind cancer cell invasion and their dependence on ECM stiffness.
Given the complexity, cost, and duration of in vitro experiments, computational models have become valuable tools in complementing experimental work by replicating setups, providing insights that help interpret results, and exploring scenarios that are difficult to test experimentally (Metzcar et al., 2019; Crossley et al., 2024). Cancer spheroids, commonly used in 3D in vitro models to investigate tumour growth and invasion, frequently display collective invasion behaviour. Various computational approaches are employed to model this collective migration, including continuous, discrete, and hybrid models, all of which have been used to examine cancer invasion and interactions between the cells and the surrounding extracellular matrix. In continuous models, the cells and the ECM are represented as densities, characterising them with partial differential equations to describe how they change in space and time (Nguyen Edalgo and Ford Versypt, 2018; Szymańska et al., 2024). In discrete frameworks, agent-based modelling is often used, where each biological element, such as a cancer cell or ECM fibre, is distinct and the interactions between the agents are defined. For example, Prasanna et al. (2024) used a cellular Potts model-based multiscale computational framework to investigate spatial tumour heterogeneity. Finally, hybrid models combine multiple methods, such as modelling the cells using a discrete model and the substrate using a continuous model. Poonja et al. (2023) built a model that combines an off-lattice agent-based model for the cells with a vector field representation of the ECM fibril structure. In this model, the ECM is characterised by fibril orientation and stiffness, which can inhibit cell proliferation or trigger cell migration when respective stiffness thresholds are exceeded.
Several software tools that utilise agent-based models for studying collective cell migration problems have gained popularity. These modelling platforms have been used to build custom computational models to simulate various multiscale and multicellular problems utilising different mathematical frameworks. Notable examples include Chaste (Mirams et al., 2013), CompuCell3D, which uses a cellular Potts model (Swat et al., 2012), and PhysiCell, which employs an off-lattice centre-based agent-based model (Ghaffarizadeh et al., 2018). PhysiCell is an efficient and extensible open-source software tool, able to simulate large numbers of cells in high throughput. It has a growing user community and has been previously used to model the extracellular matrix. Gonçalves and Garcia-Aznar (2021) developed a model for spheroid growth with PhyiCell by defining the ECM as part of the chemical microenvironment with zero diffusivity. The extracellular matrix in PhysiCell has also been modelled as an agent in a PhysiCell addon, named PhysiMeSS (Noël et al., 2024). Here each ECM fibre is represented by cylinders with varying stiffness. Another ECM extension of PhysiCell was developed by Metzcar et al. (2025). They modelled the ECM as a continuum, then discretised into smaller volumetric elements which store information about the ECM fibre orientation, average anisotropy and fibre density.
We present a hybrid discrete-continuous model built upon the ECM framework developed by Metzcar et al. (2025) in PhysiCell, utilising its ECM fibre density feature. The model explores the influence of cell-cell and cell-matrix interactions on cancer spheroid growth at different levels of ribose-induced ECM stiffness. Our model accounts for cell-cell and cell-ECM adhesion and repulsion, ECM remodelling, and cell proliferation with associated inhibition of proliferation function, allowing us to successfully replicate the experimental finding of Jahin et al. (2023), which investigated cancer spheroid growth and invasion of non-invasive MCF7 and invasive HCC1954 cells at different ribose-induced stiffnesses of the ECM. Consistent with the in vitro experiments, our results indicate that ribose-induced stiffening can significantly reduce ECM remodelling and confine cancer cell movement, inhibiting spheroid growth and invasion. Moreover, this flexible modelling framework is able to incorporate additional ECM characteristics and microenvironmental conditions, such as fibre orientation and nutrient diffusion, to further refine the dynamics of cancer spheroid-ECM interaction in the future.
2 Materials and methods
2.1 Experimental data
In this paper, we aim to investigate the mechanisms involved in cancer spheroid growth and invasion into the extracellular matrix. Spheroid growth refers to the expansion of the central spheroid mass and its volume change over time as a result of cell proliferation. On the other hand, invasion describes the penetration of single cells or broad multicellular protrusions into the surrounding ECM. We build the model based on the in vitro experiments conducted by Jahin et al. (2023) studying the effect of ribose-induced ECM stiffening on cancer spheroid growth and invasion of non-invasive MCF7 and invasive HCC1954 breast cancer cell lines.
In their study, Jahin et al. (2023) formed tumour spheroids of 200
2.2 Model
2.2.1 PhysiCell and general framework
PhysiCell is an open-source cross-platform compatible multiscale modelling tool, based in C++ (Ghaffarizadeh et al., 2018). It employs a hybrid discrete-continuum approach, coupling an agent-based model for the cells with a continuum model for the diffusive microenvironment. The agent-based model is off-lattice and centre-based. Each agent, corresponding to a single cell, is modelled as a sphere, with its position defined by its centre. The continuum microenvironment consists of chemical substrates with associated diffusion coefficients, decay rates, sources and sinks, and initial and boundary conditions. PhysiCell is coupled to an efficient multi-substrate diffusion solver called BioFVM (Ghaffarizadeh et al., 2016) to simulate the chemical microenvironment using reaction-diffusion PDEs. PhysiCell uses multiscale modelling, as it has been developed with the aim of modelling problems in cancer biology and tissue engineering, which involve processes occurring at different time scales. The system is updated using pre-defined and user-defined parameters and functions, making this tool flexible and customisable.
We build our model upon the PhysiCell (version 1.12.0) ECM framework developed by Metzcar et al. (2025). The continuum ECM is defined separately from the chemical microenvironment and is discretised into volumetric elements, or voxels. In our model, each voxel stores information about the local ECM density and we did not include any additional diffusible substrate. The model consists of three parts:
• ECM remodelling, corresponding to changes in ECM density due to degradation by the cells (Section 2.2.2);
• Cell movement, as a result of cell-cell and cell-ECM interactions (Section 2.2.3);
• Cell proliferation, with associated inhibition of proliferation function (Section 2.2.4).
We assume that the ribose concentration affects how the cells interact with the ECM, reducing ECM remodelling and slowing cell migration. For ECM remodelling and cell movement processes, we update the system every mechanics time step
We present a pseudo-2D model representing a
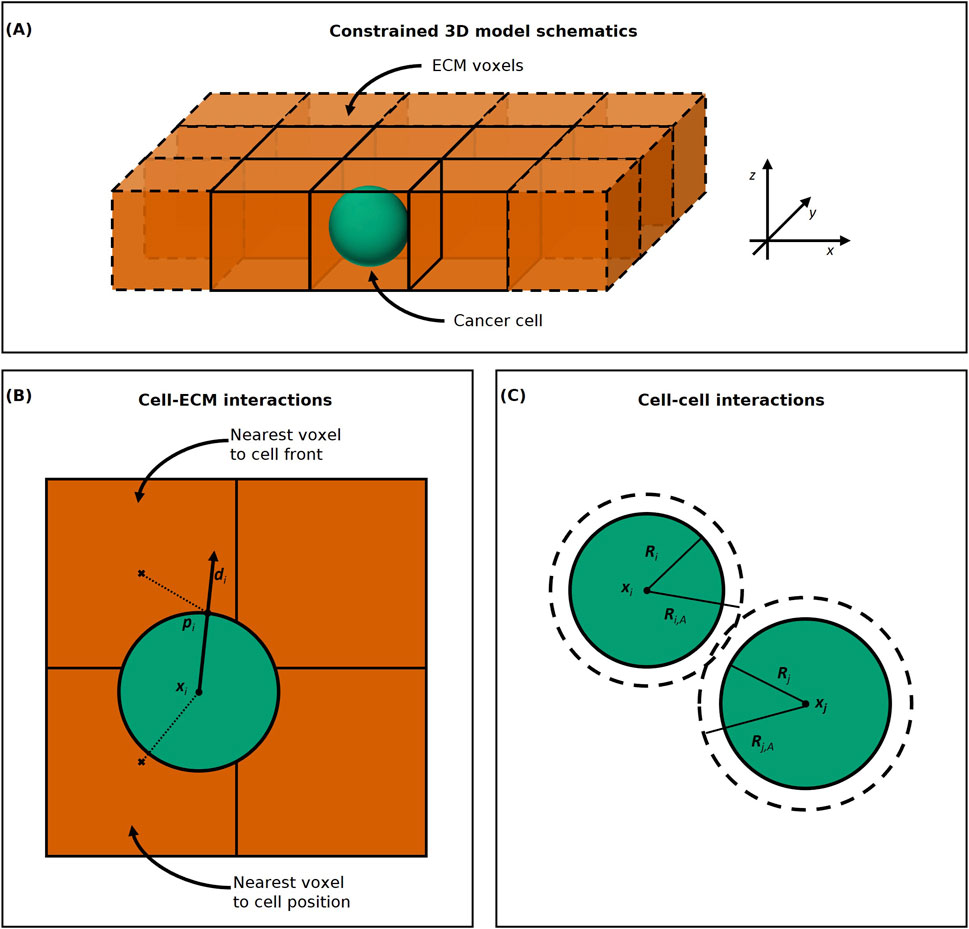
Figure 1. (A) Constrained 3D model schematics. The ECM voxels are represented as orange cubes and the cancer cell as a green sphere. The cancer cell agent moves freely within the ECM voxels in the
To compute cell-ECM interactions for cell movement and ECM remodelling, we must choose which ECM voxel each cell agent interacts with. In PhysiCell the default voxel accessed for cell-substrate interactions is the nearest voxel (centre) to the position
For interactions between cell agents, such as cell-cell adhesion, as in PhysiCell, we consider the set of neighbouring cells
2.2.2 ECM remodelling
When a cell enters into contact with an ECM element, it remodels the matrix substrate by changing its density
where
where
2.2.3 Cell movement
The total velocity
where
2.2.3.1 Cell-cell interactions
To reproduce cell-cell interactions, we use the built-in functions in PhysiCell for cell-cell adhesion and repulsion, in PhysiCell referred to as cell mechanics (Macklin et al., 2012; Ghaffarizadeh et al., 2018; Metzcar et al., 2025). The cell-cell interaction velocity
2.2.3.2 Cell-matrix interactions
The cell-matrix interaction velocity
where
The cell-ECM adhesion velocity
where
where
Further, in a 3D matrix, the ECM fibres act as an obstacle to cell migration when the matrix is dense. When the ECM density
Equations 4, 6 indicate that as the ECM density increases, both cell-ECM adhesion and repulsion speeds increase, leading to a non-monotonic resultant total cell-matrix speed
which reaches its maximum at
2.2.3.3 Cell-ECM interaction velocity update
The persistence in cell movement is defined as the mean time a cell maintains its direction of motion (Maiuri et al., 2015). Therefore, we update the cell direction due to cell-ECM interaction
where
2.2.4 Cell proliferation
For cell proliferation, we use a live cell model from PhysiCell (Ghaffarizadeh et al., 2018). This simple model for proliferation consists of cells dividing in any time interval
where
However, compression of the tumour spheroid due to confinement and lack of nutrients can slow or arrest cell proliferation (Delarue et al., 2014; Engin et al., 2017; Ahn et al., 2024). The spheroid can be compressed when the surrounding ECM is too dense and is not degraded quickly enough, slowing proliferation (Delarue et al., 2014). Nutrient diffusion depends on the porosity of the ECM, which in turn depends on the density of the fibres (Ahn et al., 2024). Furthermore, the cells in the centre of the spheroid are less exposed to nutrients, since the cells in the outer layer consume the nutrients first (Pinto et al., 2020). Therefore, as we chose not to include nutrient diffusion in the current model, we simplify inhibition of proliferation by assuming that proliferation is inhibited when the cells are surrounded by neighbours (the number of neighbours above a pre-defined overcrowding threshold) and is slowed down by the presence of extracellular matrix. We rewrite the probability of division in any time interval
where
with
2.3 Statistical analysis
To compare our results with the experimental data, we calculated spheroid area growth relative to the initial time, cell count and Delaunay mean distance between cells in Python version 3.10.12. Given the stochastic nature of our model, we ran 10 replicates for each simulation and computed the mean and 25th/75th percentile of spheroid area growth relative to the initial time, cell count and Delaunay mean distance every 60 min. Simulations were performed on the University of Birmingham’s high-performance computing (HPC) cluster, BlueBEAR. We utilised a single node (
We computed the spheroid area growth relative to the initial time by calculating the area covered by the cells at each time point and dividing it by the area covered at the initial time
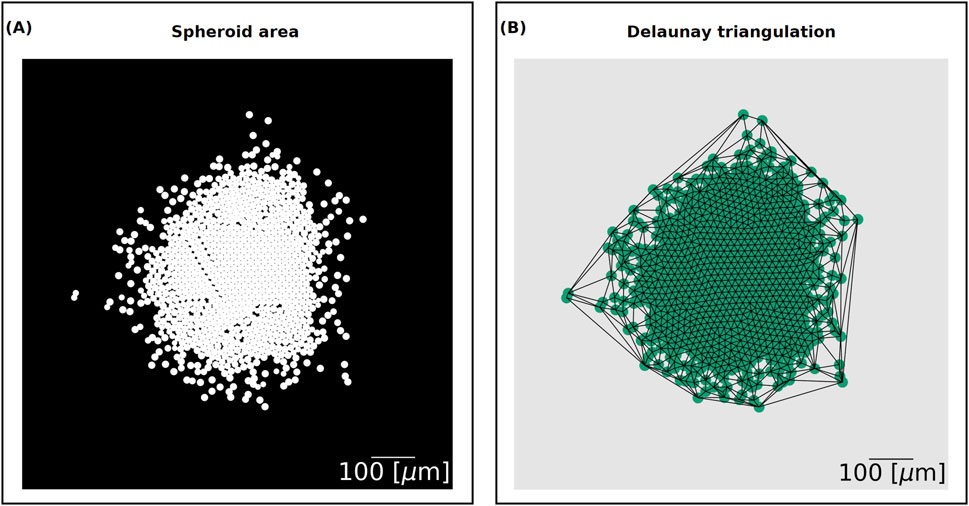
Figure 2. (A) Spheroid area output. The domain is divided into a
For the cell count, we tallied the total number of cells in the simulations at each time point, corresponding to the number of nuclei in a slice of the experimental data.
Finally, the Delaunay mean distance measures the proximity of cells. It utilises the Delaunay triangulation, the dual graph of the Voronoi diagram, of a set of points. The edges of the graph form triangles whose circumscribed circles do not contain any other point. We used the cell centres as the input nodes of the network and generated the Delaunay network using the spacial algorithm Delaunay from the Python library SciPy version 1.11.1 (Figure 2B). We then computed the mean edge length between the nodes to find the Delaunay mean distance.
3 Results
3.1 Impact of key cell-ECM interaction parameters on spheroid growth
Invasion and migration of cancer cells from a cancer spheroid into the surrounding extracellular matrix depends strongly on how they interact with the ECM (Yamada et al., 2022). The cancer cells need to remodel the ECM to enable invasion, and can then use the adhesion sites on the collagen fibres to propel themselves and invade further. In our model, to study such cell-ECM interactions, we consider different biophysical parameters representing cell-ECM cross-talk and specific properties of the ECM. We control how quickly the agent cells reduce locally the ECM density by changing the degradation rate (
We initiated all simulations with a spheroid of cancer cells of 200
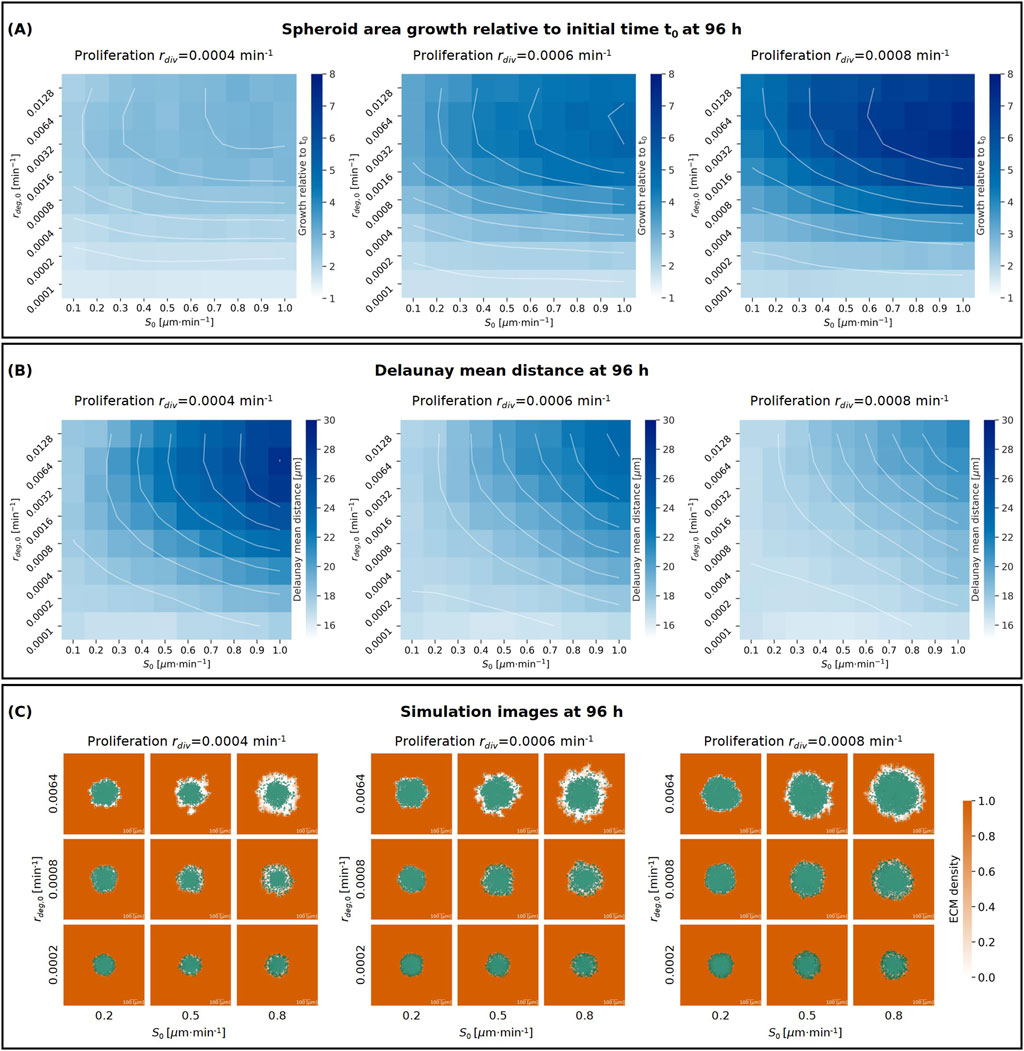
Figure 3. (A, B) Heatmaps showing the effects on spheroid area growth relative to the initial time
Our results demonstrate that an increase in proliferation rate
Further, increasing the maximum cell-ECM interaction speed
Finally, we observed that increasing the degradation rate
Figure 3C shows simulation images at the final time point (96 h) for
We then analysed the impact of the parameters
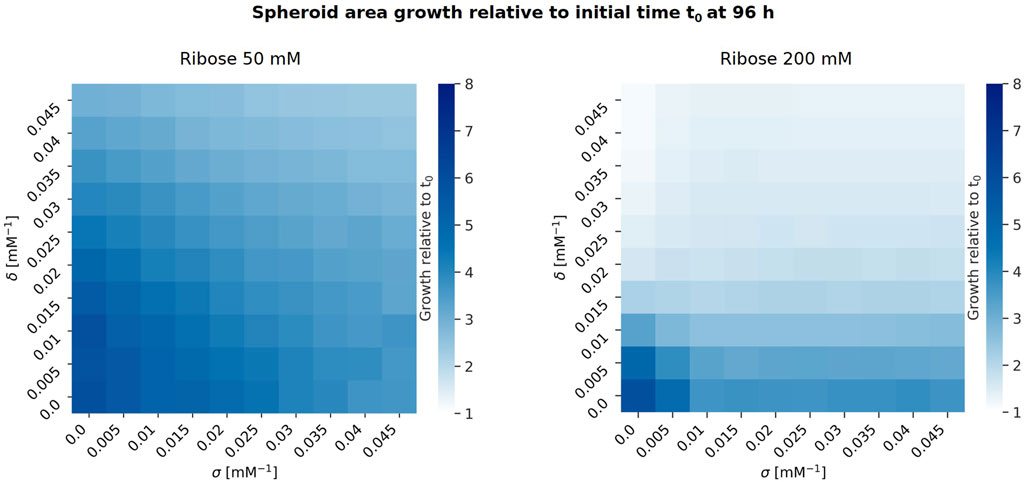
Figure 4. Heatmaps showing spheroid growth relative to the initial time
Figure 4 shows that higher ribose concentrations correspond to a decrease in spheroid growth, and increasing either
3.2 Model captures inhibition of cancer spheroid growth of non-invasive and invasive breast cancer cells when increasing ribose concentration
To begin with, we replicated experiments from Jahin et al. (2023) that study the effect of ribose concentration on two different cell lines of parental breast cancer cells: MCF7 and HCC 1954. MCF7 cells are a non-invasive cell line, which correlates with weaker cell-ECM interactions (Comşa et al., 2015). On the other hand, HCC1954 cells are a more aggressive and invasive cell line, characterised by enhanced contractility, and therefore stronger interactions with the ECM fibres enabling migration, and further ECM remodelling (de Abreu Pereira et al., 2022; Jahin et al., 2023). The in vitro experiments showed that with increasing ribose concentration, and therefore collagen fibre stiffness, the spheroid invasion was inhibited for the invasive HCC1954 cells, while the non-invasive MCF7 cells did not invade for any of the ribose concentrations.
The cell-ECM interactions in our model depend on two parameters: ECM degradation rate, which controls the ECM remodelling by the cells (Equation 1), and maximum cell-ECM interaction speed, which affects the cell’s movement (Equation 4). Given the different invasiveness of the two cell lines, we assume that the invasive cells have a higher ECM degradation rate and maximum cell-ECM interaction speed than the non-invasive cells. From the wide range of values studied in Section 3.1 (Supplementary Figure S3), we choose the values that lead to simulations matching the experimental observations (Figures 5E, F). Hence, we use the following set of values: ECM degradation rate
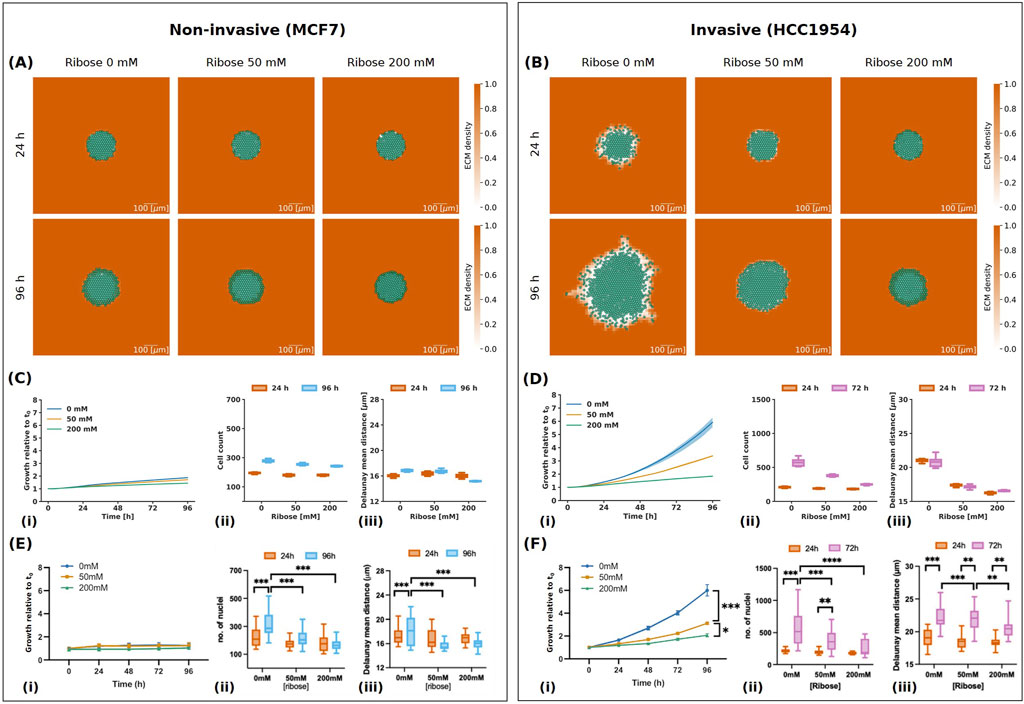
Figure 5. Results of simulations for non-invasive (MCF7) and invasive (HCC 1954) cell lines. (A, B) Simulation images of non-invasive (A) and invasive (B) cell lines respectively, with ribose concentrations of 0 mM, 50 mM and 200 mM at 24 h and 96 h. The cells are represented in semi-transparent green and the ECM density is in orange, with values between 0 and 1 as indicated in the colour bar. The scale bar at the bottom right is 100
In their experiments with non-invasive MCF7 cells, Jahin et al. (2023) observed that increasing ribose concentration did not affect spheroid growth (Figure 5Ei), consistent with previous reports (Ziegler et al., 2014). Our findings also indicate that spheroid growth was inhibited for the non-invasive cells, with the spheroid area growth at the final time point remaining below 2 for all ribose concentrations (Figure 5Ci). However, while the invasion of MCF7 cells was low, Jahin et al. (2023) observed an increase in the number of nuclei, particularly at 0 mM ribose (Figure 5Eii). Similarly, our simulations showed a larger increase in cell count at 0 mM ribose, with the cell count reaching
In contrast, the invasive HCC1954 cells exhibited a reduction in spheroid growth and the number of nuclei with a ribose concentration increase in vitro (Figures 5Fi, ii). Our simulations closely matched the experimental data, resulting in a spheroid growth of
With our choice of parameters, we observe that low degradation rate and maximum cell-ECM interaction speed inhibit both invasion and proliferation of the spheroid. This is mainly due to the cell-ECM repulsive velocity
3.3 MMPs inhibition for invasive cells inhibits spheroid area growth
Cancer cells remodel the extracellular matrix mechanically and proteolytically when invading, creating paths that facilitate the migration of nearby attached cancer cells (Walker et al., 2018). The cells mechanically apply forces to the ECM fibres by pushing or pulling the fibres when adhering to ligand binding sites, resulting in fibre displacement and orientation changes. Fibre orientation can direct migration, and the realignment of the collagen fibres has been associated with higher invasion (Provenzano et al., 2006). On the other hand, proteolytic remodelling involves enzymatic degradation of ECM fibres through the activity of matrix metalloproteinases (MMPs). It has been shown that ECM degradation by MMPs significantly contributes to cell invasion as it facilitates migration and realignment of the fibres (Itoh, 2015). Jahin et al. (2023) investigated the role of MMPs in fibre alignment and invasion by treating the invasive HCC1954 cells with the pan-MMP inhibitor GM6001. They observed that MMPs inhibition significantly reduces invasion for ribose 0 mM, but not for ribose 50 mM and 200 mM (Figure 6C).
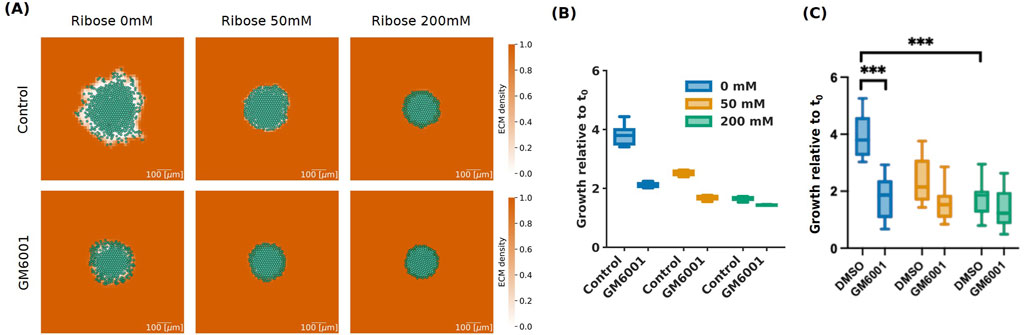
Figure 6. Simulations for invasive (HCC 1954) cells with pan-MMP inhibitor GM6001 at 72 h. (A) Simulation images of invasive cells with high (Control) and low (GM6001) degradation rates, with ribose concentrations of 0 mM, 50 mM and 200 mM, at 72 h. The cells are represented in semi-transparent green and the ECM density is in orange taking values between 0 and 1 as shown in the colour bar. The scale bar on the bottom right of length 100
In our model, ECM remodelling is represented by the degradation rate parameter
Similarly to the results from the experimental data by Jahin et al. (2023) shown in Figure 6C, spheroid area growth relative to the initial time after 72 h was significantly reduced for ribose 0 mM going from
4 Discussions
In this paper, we presented a hybrid discrete-continuous model built in PhysiCell (version 1.12.0) to describe the interactions between cells modelled as discrete agents and the extracellular matrix as a continuum. Our model incorporates cell-cell and cell-ECM adhesion and repulsion, ECM remodelling, and cell proliferation with associated inhibition of proliferation function, allowing us to investigate the critical role of cell-ECM interactions in cancer spheroids.
Our findings indicate that increased cell-ECM adhesion promotes invasion, while ECM degradation significantly influences spheroid growth. Notably, we observed a non-monotonic effect of ECM degradation: increasing degradation enhances growth due to reduced matrix confinement, yet excessive degradation limits migration for the cells at the edge of the spheroid, ultimately restricting invasion. The cell’s maximum speed is reached when the ECM density
We replicated the experiments carried out by Jahin et al. (2023) that investigated the impact of ribose-induced collagen stiffening on the invasion of two parental breast cancer cell lines: the non-invasive MCF7 and the invasive HCC 1954. We differentiated the cell lines based on their cell-ECM interaction parameters: ECM degradation rate
In our current model, we represent the collagen fibre matrix as a homogeneous density and treat the ribose as a separate quantity that directly impacts ECM remodelling and cell migration. However, a more comprehensive framework of the matrix would benefit from incorporating additional ECM properties, such as fibre orientation, alignment and cross-linking (Metzcar et al., 2025; Noël et al., 2024). Fibre orientation and alignment affect the directed migration of cells, which is a process correlated with enhanced spheroid invasion. Furthermore, as cells dynamically remodel the ECM, fibre orientation and alignment change not only locally but also at greater distances. The addition of ribose increases cross-linking between fibres and impacts both the chemical and mechanical remodelling of the ECM by cancer cells. Furthermore, cancer cells also contribute to ECM deposition and cross-linking. Our modelling framework is adaptable and allows for the integration of these additional ECM properties, such as fibre orientation and alignment, as in Metzcar et al. (2025). In subsequent phases of the model development, we plan to implement these features and investigate their effects on spheroid growth.
The ECM can also be characterised by its stiffness, rather than by its density and ribose concentration (Poonja et al., 2023). However, our focus was on understanding how ribose-induced collagen stiffening specifically affected cancer spheroid growth and invasion. As previously mentioned, ECM stiffness can be modulated through various methods, each impacting different properties of the ECM and ultimately influencing the behaviour of the cells, thereby affecting the spheroid growth and invasion. It would be interesting to explore how these different stiffening methods could be reproduced in the current model. Additionally, it has been observed that the timing of ECM stiffening can either inhibit or promote cancer cell invasion, highlighting the complex relationship between ECM stiffness and cancer cell invasion (Staneva et al., 2018). Matrix stiffening after cancer invasion begins promotes further spheroid invasion, while a stiff matrix surrounding the spheroid at the early stages prevents invasion.
In addition to integrating more ECM features, future iterations of our model could incorporate diffusible nutrients and cell death mechanisms (Botte et al., 2023; Ruscone et al., 2023; Mancini et al., 2024; Macnamara et al., 2024). Currently, our model employs an inhibition of proliferation function based on the number of neighbouring cells and ECM density (Equation 8). While this approach provides a basic setup, a more comprehensive model would directly account for the effect of pressure, nutrient availability and cell death on proliferation dynamics. Another extension to the current model could involve incorporating various cell types, such as cancer-associated fibroblasts, which play a role in ECM remodelling by depositing ECM components (Jahin et al., 2023; Metzcar et al., 2025). However, incorporating these additional components into a hybrid model poses challenges, particularly with respect to parameter validation and mathematical function accuracy. This is worsened by the scarcity of relevant data. For instance, we lack the data necessary to distinguish between the proliferation and death of cancer cells within the spheroid.
Adding more features to the model would likely increase the variability of the results. Currently, the variability in the in silico model is considerably lower than that observed in the in vitro experiment. However, this is not necessarily problematic, as we are making a qualitative comparison based on mean values. The in silico model is a simplified description of the more complex in vitro model. For instance, in our simulations, we assume the ECM density to be initially homogeneous, contributing to the reduced variability of the results.
It is also important to note that our model operates within a constrained 3D space. Although we conceptually address the impacts of the ECM on cell migration in 3D, all simulations and analyses were restricted to 2D. We chose this approach to mimic the original 2D data: thin z-slices (microscopy images) of 3D spheroids. Additionally, the ECM framework developed by Metzcar et al. (2025) in PhysiCell currently supports only constrained 3D simulations, representing single slices of a 3D environment. This limits the model’s ability to capture the effects of the 3D environment and unconstrained cell movement on spheroid behaviour. Using the knowledge gained in this quickly executing constrained 3D model, we plan to model a fully 3D spheroid as future work.
In conclusion, the interactions between cancer cells and the extracellular matrix in 3D cancer spheroid growth are intricate and not yet fully understood. Our proposed model represents an initial attempt to account for the chemical and mechanical interactions within this context, paving the way for future research that integrates additional ECM properties and environmental factors.
Data availability statement
The datasets presented in this study can be found in online repositories. The names of the repository/repositories and accession number(s) can be found below: https://github.com/Margherita-Botticelli/PhysiCell-cancer-spheroid-ecm-stiffness.
Author contributions
MB: Conceptualization, Formal Analysis, Methodology, Project administration, Software, Visualization, Writing – original draft, Writing – review and editing. JM: Supervision, Writing – review and editing. TP: Conceptualization, Investigation, Writing – review and editing. SC: Conceptualization, Supervision, Writing – review and editing. PK: Conceptualization, Project administration, Supervision, Writing – review and editing. FS: Conceptualization, Project administration, Supervision, Writing – review and editing.
Funding
The author(s) declare that financial support was received for the research and/or publication of this article. We would like to acknowledge the funding from BBSRC (grant number BB/V002708/1) and a UKRI Future Leaders Fellowship to FS (grant number MR/T043571/1). TP was supported by the BBSRC (grant number BB/M009513/1).
Acknowledgments
MB would like to give a special thanks to Kieran Atkins for sharing his programming expertise, which was crucial in cracking the code. The computations described in this paper were performed using the University of Birmingham’s BlueBEAR HPC service, which provides a High Performance Computing service to the University’s research community. See http://www.birmingham.ac.uk/bear for more details.
Conflict of interest
The authors declare that the research was conducted in the absence of any commercial or financial relationships that could be construed as a potential conflict of interest.
Generative AI statement
The author(s) declare that Generative AI was used in the creation of this manuscript. We acknowledge the use of Grammarly (version 14.1200.0) and chatGPT-4 for text editing and to identify improvements in the writing style.
Publisher’s note
All claims expressed in this article are solely those of the authors and do not necessarily represent those of their affiliated organizations, or those of the publisher, the editors and the reviewers. Any product that may be evaluated in this article, or claim that may be made by its manufacturer, is not guaranteed or endorsed by the publisher.
Supplementary material
The Supplementary Material for this article can be found online at: https://www.frontiersin.org/articles/10.3389/fbioe.2025.1515962/full#supplementary-material
References
Ahn, Y., Chang, H., and Baek, J. (2024). 3D scaffolds-specific cellular mechanoresponsive as a pivotal regulating factor in tissue engineering. JMST Adv. 6 (2), 121–134. doi:10.1007/s42791-024-00076-y
Alert, R., and Trepat, X. (2020). Physical models of collective cell migration. Annu. Rev. Condens. Matter Phys. 11 (1), 77–101. doi:10.1146/annurev-conmatphys-031218-013516
Berger, A. J., Renner, C. M., Hale, I., Yang, X., Ponik, S. M., Weisman, P. S., et al. (2020). Scaffold stiffness influences breast cancer cell invasion via EGFR-linked Mena upregulation and matrix remodeling. Matrix Biol. 85-86, 80–93. doi:10.1016/j.matbio.2019.07.006
Botte, E., Mancini, P., Magliaro, C., and Ahluwalia, A. (2023). A sense of proximity: cell packing modulates oxygen consumption. Apl. Bioeng. 7 (3), 036111. doi:10.1063/5.0160422
Capuana, L., Boström, A., and Etienne-Manneville, S. (2020). Multicellular scale front-to-rear polarity in collective migration. Curr. Opin. Cell Biol. 62, 114–122. doi:10.1016/j.ceb.2019.10.001
Caswell, P. T., and Zech, T. (2018). Actin-based cell protrusion in a 3D matrix. Trends Cell Biol. 28 (10), 823–834. doi:10.1016/j.tcb.2018.06.003
Cavo, M., Fato, M., Peñuela, L., Beltrame, F., Raiteri, R., and Scaglione, S. (2016). Microenvironment complexity and matrix stiffness regulate breast cancer cell activity in a 3D in vitro model. Sci. Rep. 6 (1), 35367. doi:10.1038/srep35367
Chang, J., Pang, E. M., Adebowale, K., Wisdom, K. M., and Chaudhuri, O. (2020). Increased stiffness inhibits invadopodia formation and cell migration in 3D. Biophysical J. 119 (4), 726–736. doi:10.1016/j.bpj.2020.07.003
Comşa, Ş., Cîmpean, A. M., and Raica, M. (2015). The story of MCF-7 breast cancer cell line: 40 years of experience in research. Anticancer Res. 35 (6), 3147–3154.
Crossley, R. M., Johnson, S., Tsingos, E., Bell, Z., Berardi, M., Botticelli, M., et al. (2024). Modeling the extracellular matrix in cell migration and morphogenesis: a guide for the curious biologist. Front. Cell Dev. Biol. 12, 1354132. doi:10.3389/fcell.2024.1354132
de Abreu Pereira, D., Sandim, V., Fernandes, T. F. B., Almeida, V. H., Rocha, M. R., do Amaral, R. J. F. C., et al. (2022). Proteomic analysis of HCC-1954 and MCF-7 cell lines highlights crosstalk between αv and β1 integrins, E-cadherin and HER-2. Int. J. Mol. Sci. 23 (17), 10194. doi:10.3390/ijms231710194
Delarue, M., Montel, F., Vignjevic, D., Prost, J., Joanny, J.-F., and Cappello, G. (2014). Compressive stress inhibits proliferation in tumor spheroids through a volume limitation. Biophysical J. 107 (8), 1821–1828. doi:10.1016/j.bpj.2014.08.031
Engin, A. B., Nikitovic, D., Neagu, M., Henrich-Noack, P., Docea, A. O., Shtilman, M. I., et al. (2017). Mechanistic understanding of nanoparticles’ interactions with extracellular matrix: the cell and immune system. Part. Fibre Toxicol. 14 (1), 22. doi:10.1186/s12989-017-0199-z
Francis-Sedlak, M. E., Moya, M. L., Huang, J.-J., Lucas, S. A., Chandrasekharan, N., Larson, J. C., et al. (2010). Collagen glycation alters neovascularization in vitro and in vivo. Microvasc. Res. 80 (1), 3–9. doi:10.1016/j.mvr.2009.12.005
Ghaffarizadeh, A., Friedman, S. H., and Macklin, P. (2016). Biofvm: an efficient, parallelized diffusive transport solver for 3-d biological simulations. Bioinformatics 32 (8), 1256–1258. doi:10.1093/bioinformatics/btv730
Ghaffarizadeh, A., Heiland, R., Friedman, S. H., Mumenthaler, S. M., and Macklin, P. (2018). PhysiCell: an open source physics-based cell simulator for 3-D multicellular systems. PLoS Comput. Biol. 14, e1005991. doi:10.1371/journal.pcbi.1005991
Gonçalves, I. G., and Garcia-Aznar, J. M. (2021). Extracellular matrix density regulates the formation of tumour spheroids through cell migration. PLOS Comput. Biol. 17 (2), e1008764. doi:10.1371/journal.pcbi.1008764
Itoh, Y. (2015). Membrane-type matrix metalloproteinases: their functions and regulations. Matrix Biol. 44–46, 207–223. doi:10.1016/j.matbio.2015.03.004
Jahin, I., Phillips, T., Marcotti, S., Gorey, M.-A., Cox, S., and Parsons, M. (2023). Extracellular matrix stiffness activates mechanosensitive signals but limits breast cancer cell spheroid proliferation and invasion. Front. Cell Dev. Biol. 11, 1292775. doi:10.3389/fcell.2023.1292775
Janiszewska, M., Primi, M. C., and Izard, T. (2020). Cell adhesion in cancer: beyond the migration of single cells. J. Biol. Chem. 295 (8), 2495–2505. doi:10.1074/jbc.rev119.007759
Joyce, M. H., Lu, C., James, E. R., Hegab, R., Allen, S. C., Suggs, L. J., et al. (2018). Phenotypic basis for matrix stiffness-dependent chemoresistance of breast cancer cells to doxorubicin. Front. Oncol. 8, 337. doi:10.3389/fonc.2018.00337
Kanchanawong, P., and Calderwood, D. A. (2023). Organization, dynamics and mechanoregulation of integrin-mediated cell–ECM adhesions. Nat. Rev. Mol. Cell Biol. 24 (2), 142–161. doi:10.1038/s41580-022-00531-5
Kim, Y.-N., Koo, K. H., Sung, J. Y., Yun, U.-J., and Kim, H. (2012). Anoikis resistance: an essential prerequisite for tumor metastasis. Int. J. Cell Biol. 2012, 1–11. doi:10.1155/2012/306879
Macklin, P., Edgerton, M. E., Thompson, A. M., and Cristini, V. (2012). Patient-calibrated agent-based modelling of ductal carcinoma in situ (DCIS): from microscopic measurements to macroscopic predictions of clinical progression. J. Theor. Biol. 301, 122–140. doi:10.1016/j.jtbi.2012.02.002
Macnamara, C., Conde, I., Lorenzi, T., and Caiazzo, A. (2024). An agent-based modelling framework for tumour growth incorporating mechanical and evolutionary aspects of cell dynamics. Cold Spring Harbor Laboratory. doi:10.1101/2024.05.30.596685
Maiuri, P., Rupprecht, J.-F., Wieser, S., Ruprecht, V., Bénichou, O., Carpi, N., et al. (2015). Actin flows mediate a universal coupling between cell speed and cell persistence. Cell 161 (2), 374–386. doi:10.1016/j.cell.2015.01.056
Mancini, P., Fontana, F., Botte, E., Magliaro, C., and Ahluwalia, A. (2024). Evolvoid: a genetic algorithm for shaping optimal cellular constructs. Cold Spring Harbor Laboratory. doi:10.1101/2024.09.24.614676
Mason, B. N., Starchenko, A., Williams, R. M., Bonassar, L. J., and Reinhart-King, C. A. (2013). Tuning three-dimensional collagen matrix stiffness independently of collagen concentration modulates endothelial cell behavior. Acta Biomater. 9 (1), 4635–4644. doi:10.1016/j.actbio.2012.08.007
Metzcar, J., Duggan, B. S., Fischer, B., Murphy, M., Heiland, R., and Macklin, P. (2025). A simple framework for agent-based modeling with extracellular matrix. Bull. Math. Biol. 87 (3), 43. doi:10.1007/s11538-024-01408-8
Metzcar, J., Wang, Y., Heiland, R., and Macklin, P. (2019). A review of cell-based computational modeling in cancer biology. JCO Clin. Cancer Inf. 3 (3), 1–13. doi:10.1200/cci.18.00069
Micalet, A., Moeendarbary, E., and Cheema, U. (2023). 3D in vitro models for investigating the role of stiffness in cancer invasion. ACS Biomaterials Sci. and Eng. 9 (7), 3729–3741. doi:10.1021/acsbiomaterials.0c01530
Mirams, G., Arthurs, C., Bernabeu, M., Bordas, R., Cooper, J., Corrias, A., et al. (2013). Chaste: an open source c++ library for computational physiology and biology. PLoS Comput. Biol. 9 (3), e1002970. doi:10.1371/journal.pcbi.1002970
Muncie, J. M., and Weaver, V. M. (2018). “Chapter One - the physical and biochemical properties of the extracellular matrix regulate cell fate,” in Current Topics in developmental biology, volume 130 of extracellular Matrix and Egg coats. Editors E. S. Litscher, and P. M. Wassarman (Academic Press), 1–37.
Nguyen Edalgo, Y. T., and Ford Versypt, A. N. (2018). Mathematical modeling of metastatic cancer migration through a remodeling extracellular matrix. Processes 6 (5), 58. doi:10.3390/pr6050058
Noël, V., Ruscone, M., Shuttleworth, R., and Macnamara, C. K. (2024). PhysiMeSS - a new physiCell addon for extracellular matrix modelling. Gigabyte 2024, gigabyte136. doi:10.46471/gigabyte.136
Phillips, T. A., Caprettini, V., Aggarwal, N., Marcotti, S., Tetley, R., Mao, Y., et al. (2023). A method for reproducible high-resolution imaging of 3D cancer cell spheroids. J. Microsc. 291 (1), 30–42. doi:10.1111/jmi.13169
Pinto, B., Henriques, A. C., Silva, P. M. A., and Bousbaa, H. (2020). Three-dimensional spheroids as in vitro preclinical models for cancer research. Pharmaceutics 12 (12), 1186. doi:10.3390/pharmaceutics12121186
Poonja, S., Forero Pinto, A., Lloyd, M. C., Damaghi, M., and Rejniak, K. A. (2023). Dynamics of fibril collagen remodeling by tumor cells: a model of tumor-associated collagen signatures. Cells 12 (23), 2688. doi:10.3390/cells12232688
Prasanna, C. V. S., Jolly, M. K., and Bhat, R. (2024). Spatial heterogeneity in tumor adhesion qualifies collective cell invasion. Biophysical J. 123 (12), 1635–1647. doi:10.1016/j.bpj.2024.05.005
Provenzano, P. P., Eliceiri, K. W., Campbell, J. M., Inman, D. R., White, J. G., and Keely, P. J. (2006). Collagen reorganization at the tumor-stromal interface facilitates local invasion. BMC Med. 4 (1), 38. doi:10.1186/1741-7015-4-38
Rodríguez-Cruz, D., Boquet-Pujadas, A., López-Muñoz, E., Rincón-Heredia, R., Paredes-Díaz, R., Flores-Fortis, M., et al. (2024). Three-dimensional cell culture conditions promoted the Mesenchymal-Amoeboid Transition in the Triple-Negative Breast Cancer cell line MDA-MB-231. Front. Cell Dev. Biol. 12, 1435708. doi:10.3389/fcell.2024.1435708
Ruscone, M., Montagud, A., Chavrier, P., Destaing, O., Bonnet, I., Zinovyev, A., et al. (2023). Multiscale model of the different modes of cancer cell invasion. Bioinformatics 39 (6), btad374. doi:10.1093/bioinformatics/btad374
Staneva, R., Burla, F., Koenderink, G. H., Descroix, S., Vignjevic, D. M., Attieh, Y., et al. (2018). A new biomimetic assay reveals the temporal role of matrix stiffening in cancer cell invasion. Mol. Biol. Cell 29 (25), 2979–2988. doi:10.1091/mbc.e18-01-0068
Stowers, R. S., Allen, S. C., Sanchez, K., Davis, C. L., Ebelt, N. D., Van Den Berg, C., et al. (2017). Extracellular matrix stiffening induces a malignant phenotypic transition in breast epithelial cells. Cell. Mol. Bioeng. 10 (1), 114–123. doi:10.1007/s12195-016-0468-1
Swat, M. H., Thomas, G. L., Belmonte, J. M., Shirinifard, A., Hmeljak, D., and Glazier, J. A. (2012). Multi-scale modeling of tissues using CompuCell3D. Methods Cell Biol. 110, 325–366. doi:10.1016/b978-0-12-388403-9.00013-8
Szymańska, Z., Lachowicz, M., Sfakianakis, N., and Chaplain, M. A. J. (2024). Mathematical modelling of cancer invasion: phenotypic transitioning provides insight into multifocal foci formation. J. Comput. Sci. 75, 102175. doi:10.1016/j.jocs.2023.102175
Walker, C., Mojares, E., and del Río Hernández, A. (2018). Role of extracellular matrix in development and cancer progression. Int. J. Mol. Sci. 19 (10), 3028. doi:10.3390/ijms19103028
Wei, S. C., Fattet, L., Tsai, J. H., Guo, Y., Pai, V. H., Majeski, H. E., et al. (2015). Matrix stiffness drives epithelial–mesenchymal transition and tumour metastasis through a TWIST1–G3BP2 mechanotransduction pathway. Nat. Cell Biol. 17 (5), 678–688. doi:10.1038/ncb3157
Winkler, J., Abisoye-Ogunniyan, A., Metcalf, K. J., and Werb, Z. (2020). Concepts of extracellular matrix remodelling in tumour progression and metastasis. Nat. Commun. 11 (1), 5120. doi:10.1038/s41467-020-18794-x
Wullkopf, L., West, A.-K. V., Leijnse, N., Cox, T. R., Madsen, C. D., Oddershede, L. B., et al. (2018). Cancer cells’ ability to mechanically adjust to extracellular matrix stiffness correlates with their invasive potential. Mol. Biol. Cell 29 (20), 2378–2385. doi:10.1091/mbc.e18-05-0319
Yamada, K. M., Doyle, A. D., and Lu, J. (2022). Cell–3D matrix interactions: recent advances and opportunities. Trends Cell Biol. 32 (10), 883–895. doi:10.1016/j.tcb.2022.03.002
Yamada, K. M., and Sixt, M. (2019). Mechanisms of 3D cell migration. Nat. Rev. Mol. Cell Biol. 20 (12), 738–752. doi:10.1038/s41580-019-0172-9
Yue, B. (2014). Biology of the extracellular matrix: an overview. J. Glaucoma 23, S20–S23. doi:10.1097/ijg.0000000000000108
Keywords: mathematical oncology, agent-based model, collective migration, extracellular matrix, ECM stiffness, cancer cell biology
Citation: Botticelli M, Metzcar J, Phillips T, Cox S, Keshavanarayana P and Spill F (2025) A hybrid computational model of cancer spheroid growth with ribose-induced collagen stiffening. Front. Bioeng. Biotechnol. 13:1515962. doi: 10.3389/fbioe.2025.1515962
Received: 23 October 2024; Accepted: 26 March 2025;
Published: 09 April 2025.
Edited by:
Stefaan Verbruggen, Queen Mary University of London, United KingdomReviewed by:
Chiara Magliaro, University of Pisa, ItalyBeth Coyle, University of Nottingham, United Kingdom
Eoin McEvoy, University of Galway, Ireland
Copyright © 2025 Botticelli, Metzcar, Phillips, Cox, Keshavanarayana and Spill. This is an open-access article distributed under the terms of the Creative Commons Attribution License (CC BY). The use, distribution or reproduction in other forums is permitted, provided the original author(s) and the copyright owner(s) are credited and that the original publication in this journal is cited, in accordance with accepted academic practice. No use, distribution or reproduction is permitted which does not comply with these terms.
*Correspondence: Pradeep Keshavanarayana, cC5rZXNoYXZhbmFyYXlhbmFAYmhhbS5hYy51aw==; Fabian Spill, Zi5zcGlsbEBiaGFtLmFjLnVr