 Iqra Aijaz Abro1
 Shuaa S. Alharbi2
 Naif S. Alshammari3Asaad Algarni4Nouf Abdullah Almujally5
 Ahmad Jalal1,6*
 Hui Liu7,8,9*
- 1Faculty of Computer Science and AI, Air University, Islamabad, Pakistan
- 2Department of Information Technology, College of Computer, Qassim University, Buraydah, Saudi Arabia
- 3Department of Computer Sciences, College of Computer and Information Sciences, Majmaah University, Majmaah, Saudi Arabia
- 4Department of Computer Sciences, Faculty of Computing and Information Technology, Northern Border University, Rafha, Saudi Arabia
- 5Department of Information Systems, College of Computer and Information Sciences, Princess Nourah bint Abdulrahman University, Riyadh, Saudi Arabia
- 6Department of Computer Science and Engineering, College of Informatics, Korea University, Seoul, Republic of Korea
- 7Guodian Nanjing Automation Co., Ltd., Nanjing, China
- 8Jiangsu Key Laboratory of Intelligent Medical Image Computing, School of Future Technology, Nanjing University of Information Science and Technology, Nanjing, China
- 9Cognitive Systems Lab, University of Bremen, Bremen, Germany
Introduction: In the field of human action recognition, the fusion of multi-modal data from RGB and inertial modalities provides a valid technique for identifying activities of daily life and falls.
Methods: Our approach uses two reference datasets: UR-Fall Detection and UMA_Fall Detection for ADL and Fall Events. First, data preprocessing is conducted for each sort of sensor individually, then the signals are windowed and segmented properly. Key features are then extracted, where from RGB data we get 2.5D point clouds, kinetic energy, angles, curve points, ridge features, and inertial signals, giving GCC, GMM, LPCC, and SSCE coefficients. The second method employed is Adam to improve the discriminant of the chosen features. For classification, we employed a Deep Neural Network (DNN) for ADL and fall detection over the UR-Fall dataset and the UMA_Fall dataset.
Results: The classification accuracy achieved on the UMA_Fall dataset is 97% for ADL activities and 96% for fall activities, while for the UR-Fall dataset, it is 94% for ADL activities and 92% for fall activities. This diversified classifier setting compensates for the variety of data and optimizes the system for differentiating between ADL and fall events.
Discussion: The above system provides outstanding results in recognizing these activities on both datasets and illustrates that the multimodal data fusion can boost the human activity identification system for health and safety purposes.
1 Introduction
RGB and inertial sensor fusion has become a critical aspect of human action recognition in monitoring precise ADLs and accurately identifying falls (Padha et al., 2023). ADL surveillance also offers valuable functional health information, whereby mobility shifts suggesting impaired health, poor balance, or a higher risk of falling can be identified at an early stage (Das, 2024; Kumar et al., 2021; Mekruksavanich and Jitpattanakul, 2024). Falls are a common issue for elderly people, and recently it has been discovered that almost 28%–35% of people who are 64 years or older experience at least one fall every year. This puts a lot of pressure on health systems and raises severe dangers if medical assistance is not sought (Kakara et al., 2023). Falls are detected with the help of wearable devices, and due to progress in technological and sensor systems, alarms are received rapidly without significant cost expenditure (Wang et al., 2023).
Our research further extends these innovations by using the UR-Fall Detection and UMA_Fall Detection datasets with RGB and inertial data to enhance the classification between ADLs and falls. DNNs have been reported to provide reliable predictions on sequential data, particularly those with temporal characteristics, such as activity recognition. For instance (Keskin et al., 2020) employed DNNs to analyze daily gait tasks, including standing, sitting, and walking, using kinematic data obtained from sensors placed on the pelvis and spine. Their work demonstrated that DNNs are capable of handling temporal dependencies in sequence-based datasets, making them ideal for tracking postural stress and spinal motion. Similarly, (Fridriksdottir and Bonomi, 2020), used accelerometer data for activity recognition, showcasing the flexibility of DNNs in addressing variations in sensor inputs over time. As the datasets in this study are temporal rather than stationary, the ability of DNNs to model temporal patterns makes them a suitable and efficient choice for this research.
Deep Neural Networks (DNNs) are particularly effective in multimodal sensor fusion tasks, achieving state-of-the-art results in activity recognition, as shown in prior studies (Hossain et al., 2023). To achieve accurate classification, we implemented a DNN model, with both datasets undergoing systematic preprocessing, segmentation, and feature extraction. Key features include 2.5D point clouds, kinetic energy, angles and full-body curve, and full-body ridge. For inertial sensors, we extracted Gammatone Cepstral Coefficients (GCC) and Linear Predictive Cepstral Coefficients (LPCC). The robustness of the DNN is demonstrated by its ability to generalize effectively across datasets with diverse data distributions and feature variations. For example, the classification accuracy on the UMA_Fall dataset is 97% for ADL activities and 96% for fall activities, while on the UR-Fall dataset, it is 94% for ADL activities and 92% for fall activities. These results highlight the system’s effectiveness in addressing contextual nuances between datasets.
To enhance feature discrimination, we applied the Adam optimizer (Afsar et al., 2023), which further refines the DNN’s performance. With the help of this proposed multimodal approach, the accuracy of our system is high for recognizing ADLs and fall events. On the basis of continuous health monitoring and support for elderly care applications, the field of human action recognition is improved.
• This paper presents a novel feature extraction approach that is specific to RGB and inertial data to achieve optimal recognition rate of ADL and falls using Adam and improvement of discriminant analysis of key features comprising of the 2.5D point clouds, kinetic energy, and inertial coefficients.
• For the UR-Fall and UMA_fall dataset, feature-specific DNN classifier for ADL detection and fall detection is used. This classifier diversity provides the highest system reliability when working with different datasets.
• By integrating multimodal data from RGB and inertial sensors, the system captures both visual and motion-based information, offering a more comprehensive analysis of human activities and advancing the capabilities of fall and ADL detection frameworks.
• Preprocessing and segmentation techniques are applied to both RGB and inertial data streams, standardizing the input and reducing noise, which contributes to consistent feature extraction and robust performance across varied sensor orientations and settings.
• The research demonstrates the effectiveness of multimodal sensor fusion in healthcare applications, particularly in continuous health monitoring for elderly care, addressing the dual need for precise ADL monitoring and rapid fall detection.
2 Literature review
2.1 Wearable healthcare monitoring systems
Real-time monitoring of physiological signals is facilitated by wearable healthcare devices for self-management and earlier diagnosis (Di Nuzzo et al., 2021; Kumar, 2024). Some recent research has built upon this space using miniaturized and low-cost designs. Zhuofu et al. (2023) refer to low-cost sensors in terms of the benefits of monitoring heartbeat and temperature using them, despite highlighting multisensor integration and real-time sensitivity issues. Antony (2024) highlight biosensors’ diagnostic capabilities in the absence of conventional bioreceptors, mentioning data variability and security concerns. Arunkumar et al. (2023) investigate post-intervention care through wearables for expedited discharges and streamlined use of resources. Wu et al. (2024) suggest self-powered wearable devices using a nanogenerator, minimizing battery requirements while constrained by portability. These works point toward hybrid, low-cost and real-time wearable devices.
This system builds upon this trend by combining RGB video and inertial sensors for multimodal fusion to increase reliability in activity recognition and fall detection.
2.2 MEMS healthcare monitoring systems
MEMS technology enhances diagnostic and monitoring capabilities due to its compactness and sensitivity (Abdulaziz et al., 2021; Liou, 2019; Haus et al., 2022; Shukla et al., 2022) explore MEMS microcantilever arrays for environmental health monitoring, while (Pothala et al., 2024) highlight the potential for miniaturized and biocompatible devices for cancer diagnostics and neurotransmitter monitoring. Moise et al. (2023) suggest a remote healthcare monitoring system for patients and healthcare professionals. It augments real-time decision-making and relieves hospital burden. Infrastructure reliability and data handling in high-volume environments, however, remain under researched. Padha et al. (2023) discuss wearable smart sensors based on MEMS/NEMS technologies, and particularly those embedded in fabrics for real-time tracking of vital signs. Such sensors promote convenience and portability, although durability, signal integrity, and ease of integration in textiles remain research issues. According to Vaibhavi et al. (2017), the usage of BioMEMS is promising for precision surgery and drug delivery while more investigation is needed for other applications, including those of microneedle patch and stent production. Despite the progress made to demonstrate the utility of MEMS in the field of healthcare, cost factors, infrastructure, and the problem of design constraints continue to pose real challenges in MEMS implementation. (Khan et al., 2021). also, discuss MEMS sensors in pandemics including COVID-19 diagnostics. Based on this application, it is unique to see how MEMS technology can be employed in remote diagnostic and treatment, particularly useful during a healthcare emergency.
In all, these studies validate the healthcare transformation potential of MEMS and nanotech while reflecting existing constraints—complexity of integration, scalability of systems, regulatory adherence, and data security. Closing these gaps is essential for achieving successful deployment of these technologies to healthcare environments.
2.3 ECG, EMG, and EEG healthcare monitoring systems
Continuously monitoring biomedical signals by ECG, EMG, and EEG is paramount for neurological and cardiovascular diagnostics (Li et al., 2022). A system based on IoT for continuous monitoring of biosignals using ESP32 is offered by (Chakole et al., 2024; Nsugbe et al., 2023) compare and contrast modalities for surgery, reporting ECG’s high precision. Bhatlawande et al. (2024) explored multimodal fusion for psychiatric rehabilitation use and found fusion to still be intricate. EMG and ECG signals are utilized by Byeon et al. (2022) in secure biometric systems and disease diagnosis using CNN, without inclusion of EEG. Bhasker et al., 2022 offer a wireless bio-signal system using dry electrodes to make it highly portable, at the expense of longevity.
The proposed system significantly extends these efforts by integrating multimodal data fusion techniques, combining RGB and inertial sensor features for a more holistic view of patient activity. This approach addresses the privacy, security, and fusion challenges of single-modal systems, ensuring robust classification across heterogeneous data.
2.4 Video healthcare monitoring systems
Healthcare monitoring through video has greatly advanced possibilities in the observation of patients at a distance, in patients’ psychological state, and in the care of elderly people with using both online and offline analysis possibilities (Hadjar et al., 2020; Eswaran et al., 2024; Gabriel et al., 2024) offer an AI-powered video monitoring system for real-time hospital behavior monitoring, fall detection, and role identification. Its precision is accurate, yet its performance is subject to diverse camera configurations and finite dataset variety. Patel and Biradar (2024) attain 88.60% accuracy in recognizing behavior based upon HOG, Optical Flow, and SVM in IP webcam and thermal video, although the specific use within the system of recognizing autistic children restricts scalability. Lavanya et al. (2024) propose facial recognition and voice-aided non-intrusive monitoring for Alzheimer’s patients. In improving comfort, its use of vision-based monitoring can overlook meaningful events. Rani et al. (2024) offer an integrated IoT-AI-ML system for predictive diagnosis and healthcare management, while noting infrastructure requirements and system integration issues. Wang et al. (2024) demonstrate contactless vital sign monitoring using video in ICUs and assisted-living units. Despite their advantages, video-based systems face challenges in precision and data privacy.
While video-based systems are noninferior to direct observation through being non-invasive and continuous, these systems need further enhancement in terms of precise detection and challenges in data confidentiality. The proposed system surpasses these limitations by integrating RGB video data with inertial sensor signals, improving detection accuracy through innovative features like 2.5D point clouds, body ridges, and kinetic energy metrics. This hybrid approach enables precise fall detection and healthcare monitoring, ensuring enhanced privacy and adaptability across diverse healthcare scenarios.
2.5 Human gait dynamics and human–exoskeleton interaction
Recent work emphasizes the importance of human-exoskeleton coupling for rehabilitation and mobility. Cheng et al. (2024) propose a nonlinear interaction model using neural networks and GPR for force prediction. Peng et al. (2023) integrate adaptive control with dynamic modeling to minimize tracking errors in exoskeletons. Mosconi et al. (2024) assess EMG responses under varying assistance modes, highlighting the need for personalized control. Yan et al. (2023) use damped-spring models to simulate elastic interaction, optimizing comfort and feedback.
These studies underline the relevance of multimodal dynamics. Our system builds on this by capturing comprehensive body movement using hybrid sensor fusion, applicable to both rehabilitation and assistive technologies.
3 Materials and methods
3.1 System methodology
The proposed system processes multimodal data from RGB video and inertial sensors to classify Activities of Daily Living (ADL) and falls, evaluated using UR-Fall and UMA_Fall datasets. RGB data was denoised with a bilateral filter and converted to grayscale for silhouette extraction, while inertial data was filtered using a Kalman filter. Inertial sensors were segmented using Hamming windows for temporal consistency. From RGB data, skeletal keypoints were extracted to compute geometric features like triangles, along with 2.5D point clouds, kinetic energy, and body ridges. Inertial features such as LPCC, GMM, SSCE, and GCC coefficients were derived from windowed signals. Features from both modalities were fused via a common column approach, optimized using the Adam optimizer, and classified using a Deep Neural Network (DNN). The system demonstrated high accuracy in distinguishing ADL and falls, validating the effectiveness of multimodal data fusion. Figure 1 outlines the system architecture used to classify activities of daily living (ADL) and falls by integrating multimodal data from RGB videos and inertial sensors. Each module is represented to demonstrate the preprocessing, feature extraction, fusion, and classification stages.
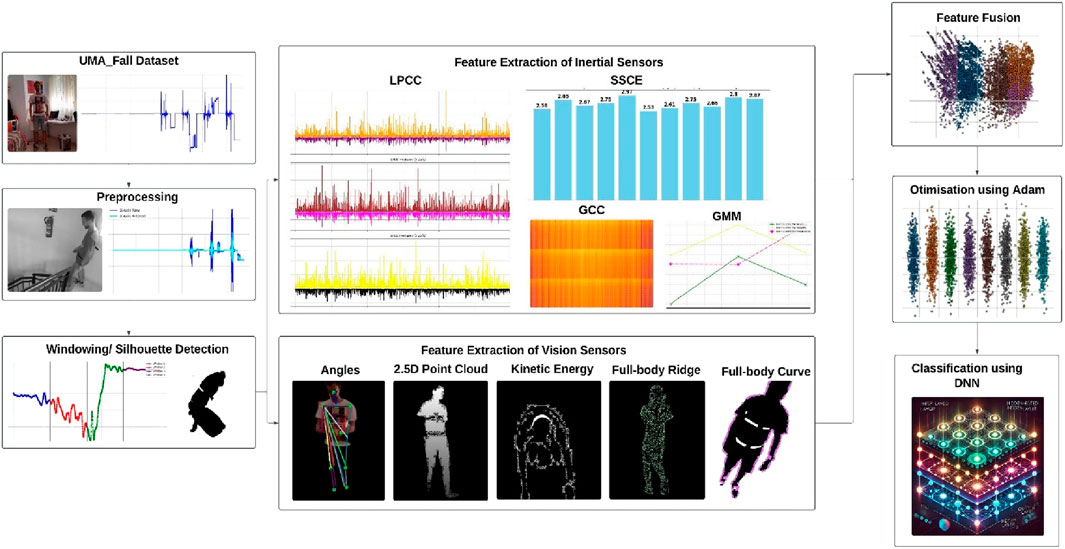
Figure 1. The system architecture of proposed model.
3.2 Sensors filtration and noise removal
This stage involves preprocessing the inertial data with a Kalman filter to enhance the signal and eliminate extraneous noise from the raw accelerometer data. Kalman filter is utilized as best estimator which decreases the mean square error and delivers the present status working from past observation. This guarantees that the signal parameters in noisy data are well retrieved. The filtering is applied to each axis (X, Y, Z) of the accelerometer data, as specified by the state-space model (Equation 1):
In this context,
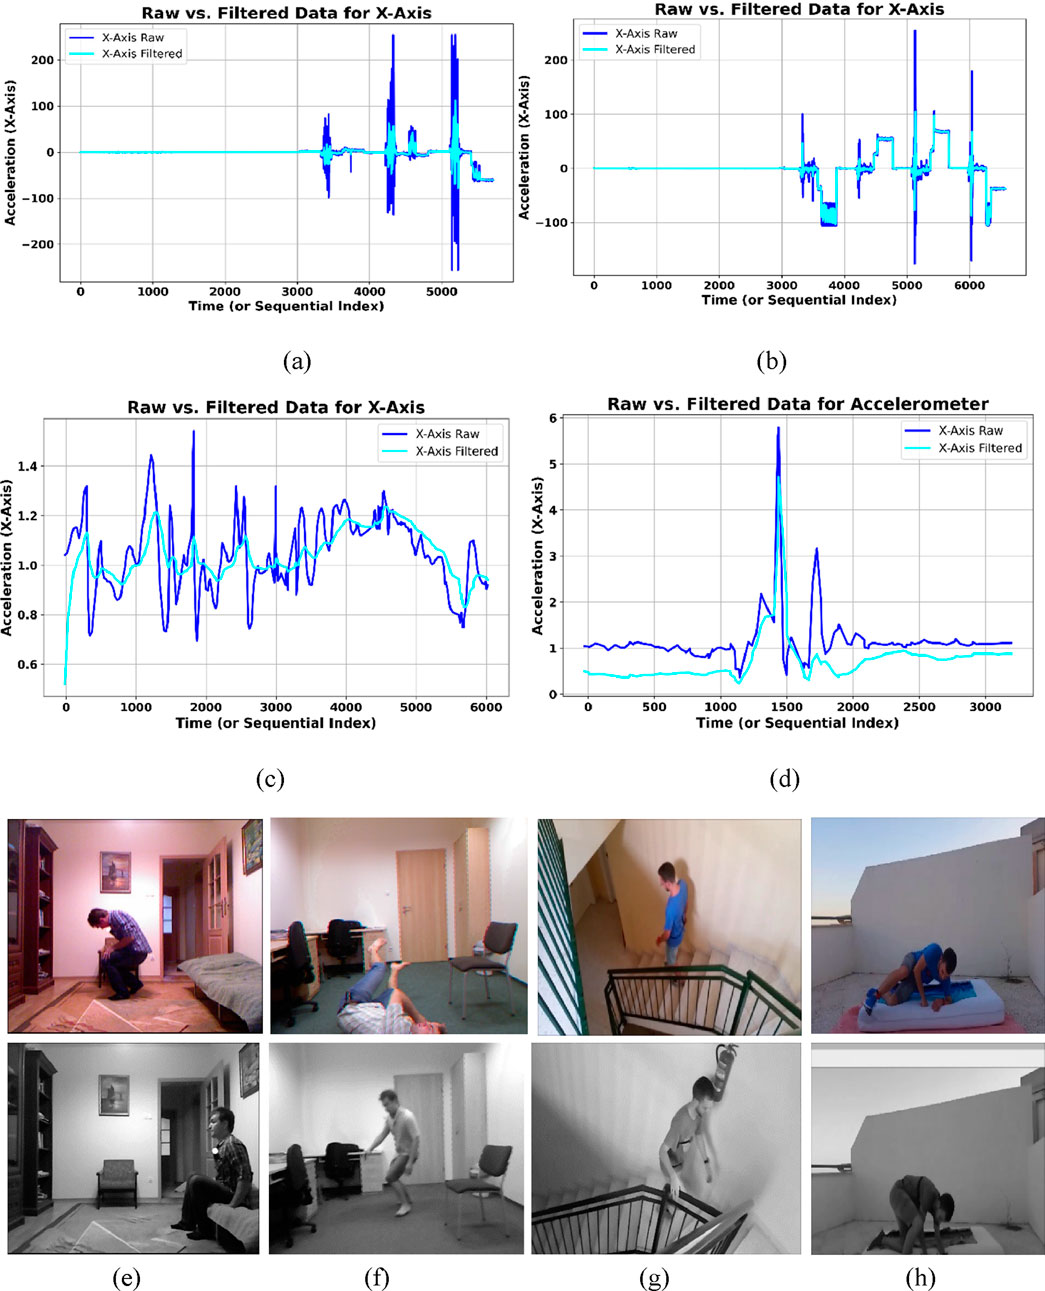
Figure 2. Subplots (a,b) show the raw vs. filtered inertial signals for ADL and fall activities in the UMA_Fall dataset, while (c,d) depict the same for the UR-Fall dataset. Subplots (e,f) present original vs. filtered RGB frames of ADL and fall activities in the UR-Fall dataset, and (g,h) show the same for the UMA_Fall dataset.
For visual sensor data, the system processes the video stream into individual frames for analysis. All subsequent calculations rely on individual images, not the entire video, necessitating this step. First, RGB frames were converted into grayscaled frames and then bilateral filter preprocess the frames to eliminate noise, thereby facilitating further analyses. The bilateral filter is a non-linear picture smoothing filter that keeps edge information by giving pixels’ different weights based on how far apart they are and how bright they are. We can mathematically represent the bilateral filter as shown in Equation 2.
Where,
3.3 Signal windowing
To segment the continuous sensor data stream into overlapping windows, the Hamming window was used. Moreover, a window size of 100 samples was determined to meet the trade-off between acquiring necessary information of activity in addition to acknowledging realistic constraints on computing magnitude. A smaller window size might not catch vehicle characteristics of the activity or other key happenings, but a bigger size might overwhelm the system with computing expenses or smoothen transitions between activities. A 50% overlap between consecutive windows, equal to a step size of 50 samples, was utilized to provide smooth transitions and continuity in the signal, a standard approach in windowing techniques to balance signal representation and computational complexity. The Hamming window is mathematically defined in Equation 3.
Where,
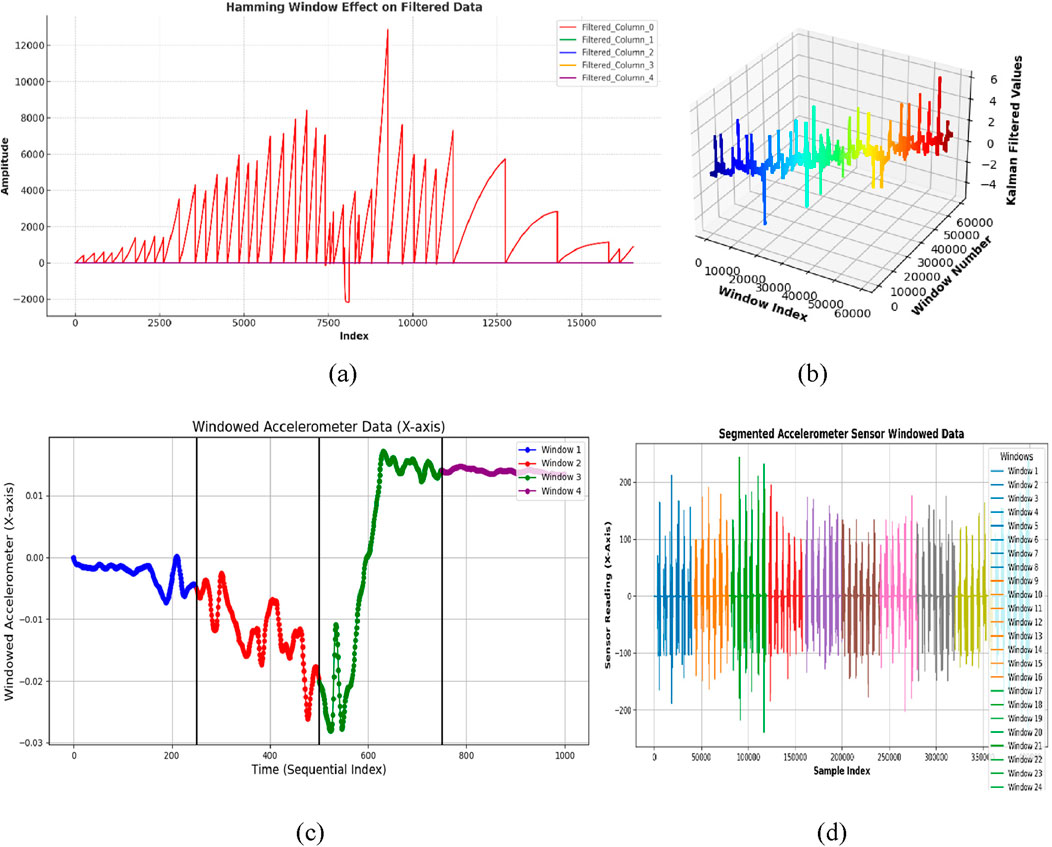
Figure 3. Results of windowed inertial data with (a,b) show windowed signal of ADL and fall activities over UR-Fall dataset, respectively (c,d) show windowed signal of ADL and fall activities over UMA_Fall dataset, respectively.
To empirically establish the ideal windowing setup, an ablation study on different window sizes and overlap rates was performed. As Table 1 indicates, applying a 100-sample window with 50% overlap produced the highest F1 scores on both datasets consistently. It effectively allows for proper temporal segmentation of steady ADLs and sudden changes during falls without sacrificing computational tractability.
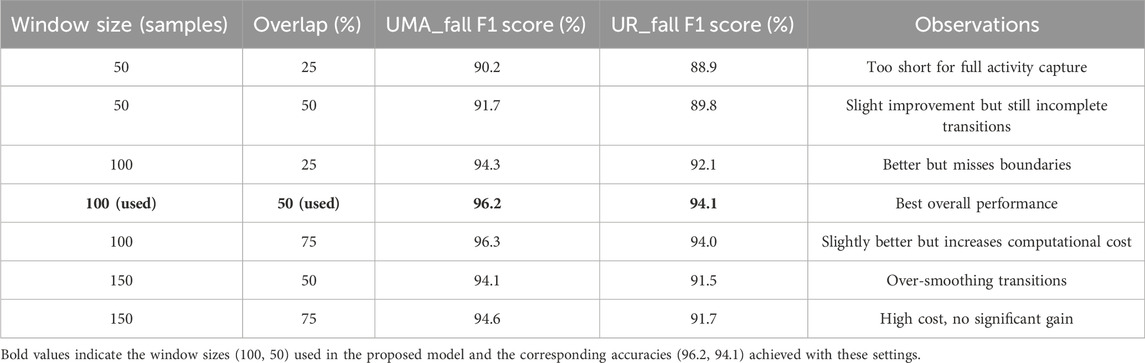
Table 1. Internal ablation study: impact of window size and overlap on F1 score.
3.4 Silhouette detection and skeleton modeling
The silhouette segmentation was performed on preprocessed grayscale frames. First, images were converted to the grayscale images to make minor enhancements on the foreground by reducing noise. For human silhouettes extraction from the foreground, Otsu’s thresholding from the output with a binary inversion was done. This method divides the image into two regions, foreground region also known as silhouette and background using a pixel distinction. The thresholding procedure is mathematically stated in Equation 4.
Where,
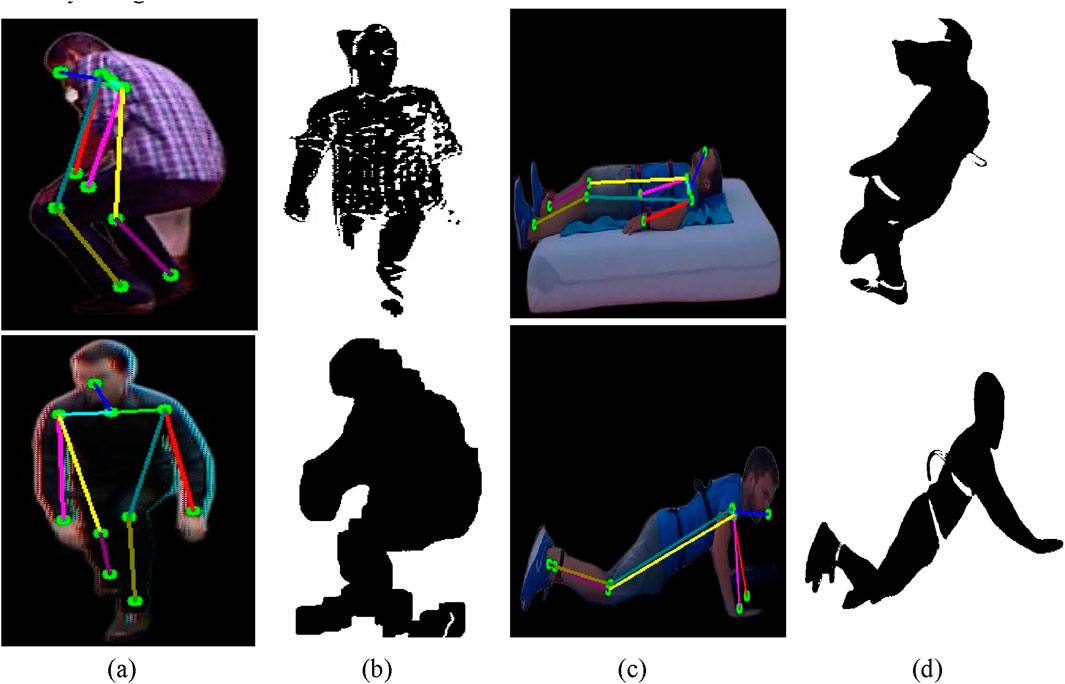
Figure 4. Results of skeleton modeling and silhouette extraction with (a,b) show skeleton model and silhouette extraction over ADL and fall activities of UR-Fall dataset, respectively (c,d) show skeleton model and silhouette extraction over ADL and fall activities of UMA_fall dataset, respectively.
Moreover, Skeletonization in visual sensor data requires the MediaPipe Pose model (Hsieh, J.-T. et al., 2021) to determine essential body features from RGB frames. The model defines various locations such as the head, shoulders, elbow, hip, and knee that constitute the framework we call a skeletal model. Extra points are earned by finding the mean between consecutive landmarks. For instance, the neck coordinates are determined as the midpoint between the left and right shoulders, as in Equation 5:
Where,
Where,
3.5 Feature extraction for inertial-based sensor
In the feature extraction phase of our study, we focused on extracting relevant metrics from the UR-Fall Detection and UMA_Fall datasets that effectively represent physiological processes. Specifically, we identified GCC, GMM, LPCC, and SSCE coefficients as essential features due to their robustness in capturing and describing the spectral, statistical, and temporal complexity present in human movement during ADL and fall activities. GCC and LPCC capture the frequency dynamics of sensor signals; GMM models their statistical distributions; and SSCE quantifies movement irregularity. Together, they provide complementary insights into controlled versus abrupt activities, which are critical for real-world fall detection. The selection balances discriminative performance with computational efficiency to enable deployment in practical healthcare environments. However, the framework remains adaptable, and future work may incorporate raw time-series modeling, energy-based descriptors, or deep-learned representations to further enhance classification performance.
3.5.1 Gammatone cepstral coefficients (GCC)
The Gammatone Cepstral Coefficients (GCC) give an enhanced adaptation of standard Mel Frequency Cepstral Coefficients (MFCC), commonly utilized in speech processing. While MFCC efficiently collects low-frequency information, it confronts limitations in dynamic situations and inertial sensor data due to noise sensitivity and limited adaptability. To overcome these restrictions, the GCC is offered in terms of cubic rather than logarithmic operations and employs Gammatone filters in the place of triangular ones, so it can be suitable for using human action recognition employing inertial information. At the beginning of our technique, the signal is partitioned into overlapping frames. We acquire the frequency spectrum using the Fast Fourier Transform (FFT), and then employ the Gammatone filter bank to perform spectral filtering within 26 gammatone filters. A cubical procedure increases the higher frequency component, which shows the fine features of the signal. The GCC coefficients are then transformed using the Discrete Cosine Transform (DCT) for the summed cubic energies, and the classification is robust. Additionally, a logarithmic scaling promotes coefficient interpretability while maintaining sensitivity to complicated manipulations. The GCC coefficients
Where,
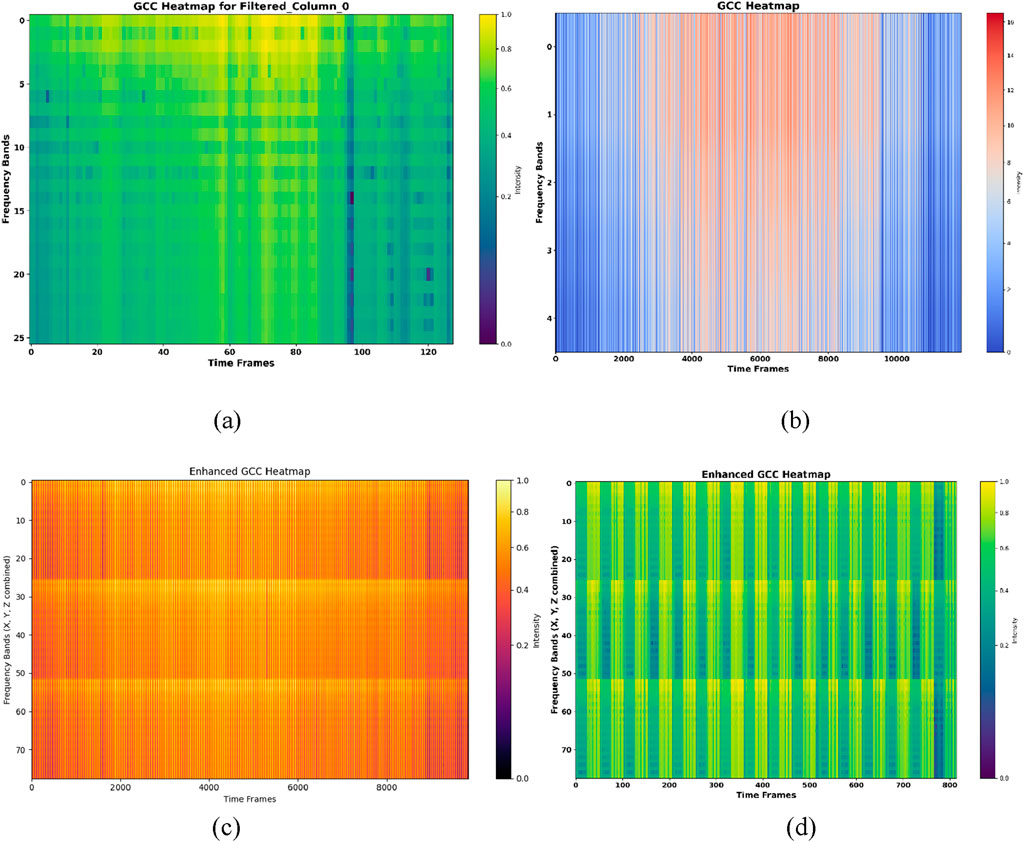
Figure 5. The results for GCC for (a,b) show GCC heatmap over ADL and fall activities of UR-fall (c,d) show GCC heatmap over ADL activities and fall activities of UMA_fall dataset.
3.5.2 Gaussian mixture model (GMM)
Gaussian Mixture Model (GMM) is applied to the preprocessed inertial data to obtain the mean, weight vectors, and covariance of clusters
In our method, the combined X, Y, and Z-axis signals are processed through a GMM with N = 3 components. The mean (μ), weight (w), and covariance (Σ) of the GMM components are retrieved as shown in Equation 8.
Where,
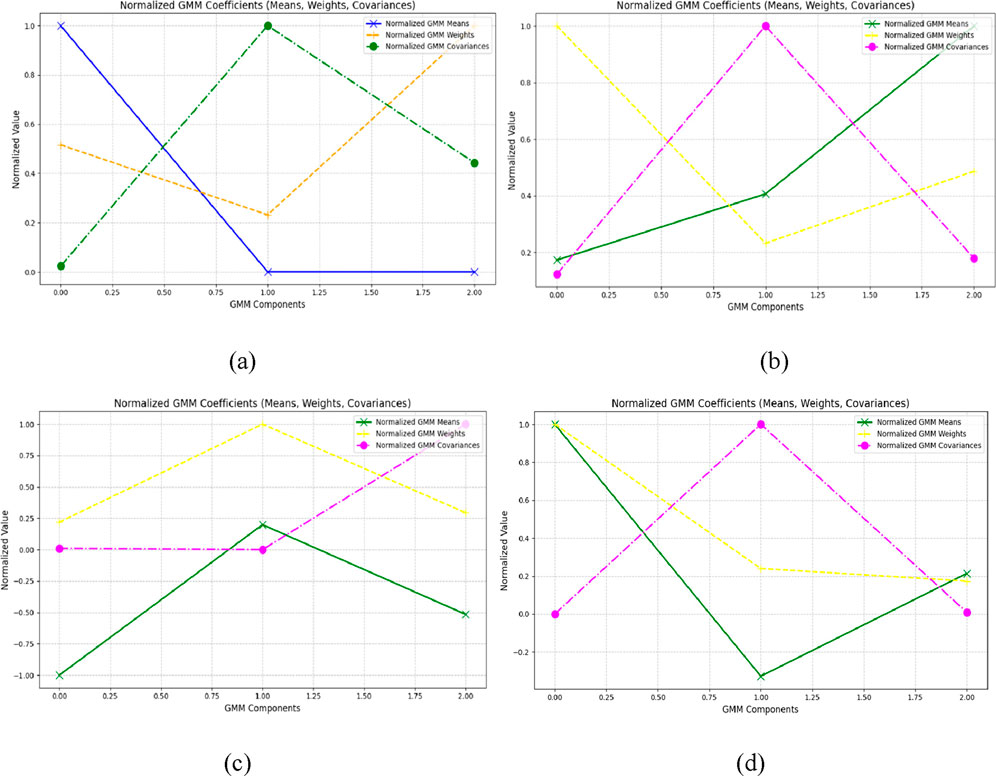
Figure 6. Results of GMM plot (a,b) show GMM of ADL and fall activities over UR-fall dataset (c,d) show GMM of ADL and fall activities over UMA_fall dataset.
3.5.3 Linear prediction cepstral coefficients (LPCC)
From inertial signals, Linear Prediction Cepstral Coefficients (LPCC) are generated using the transfer function of the signal and determining the first derivative over frequency bands. The LPCC, in order to reflect signal dynamics, uses a sequence of recursive calculations related with linear prediction coefficients
Where,
In this work, LPCC coefficients are retrieved for each axis with an order of 12. The estimated LPCC features are shown as time-series plots for the X, Y, and Z-axes, highlighting the temporal fluctuations of the coefficients. This technique offers robust feature extraction, as demonstrated on the UR-fall and UMA_Fall dataset. Figures 7a,b show the temporal variation of LPCC coefficients for ADL and fall activities in the UR-Fall dataset, while Figures 7c,d present the same for the UMA_Fall dataset. The plots reveal distinct patterns: falls exhibit more abrupt and irregular fluctuations compared to the smoother transitions observed in ADL activities. This indicates that falls are characterized by rapid, unstable movements, which is critical for classification.
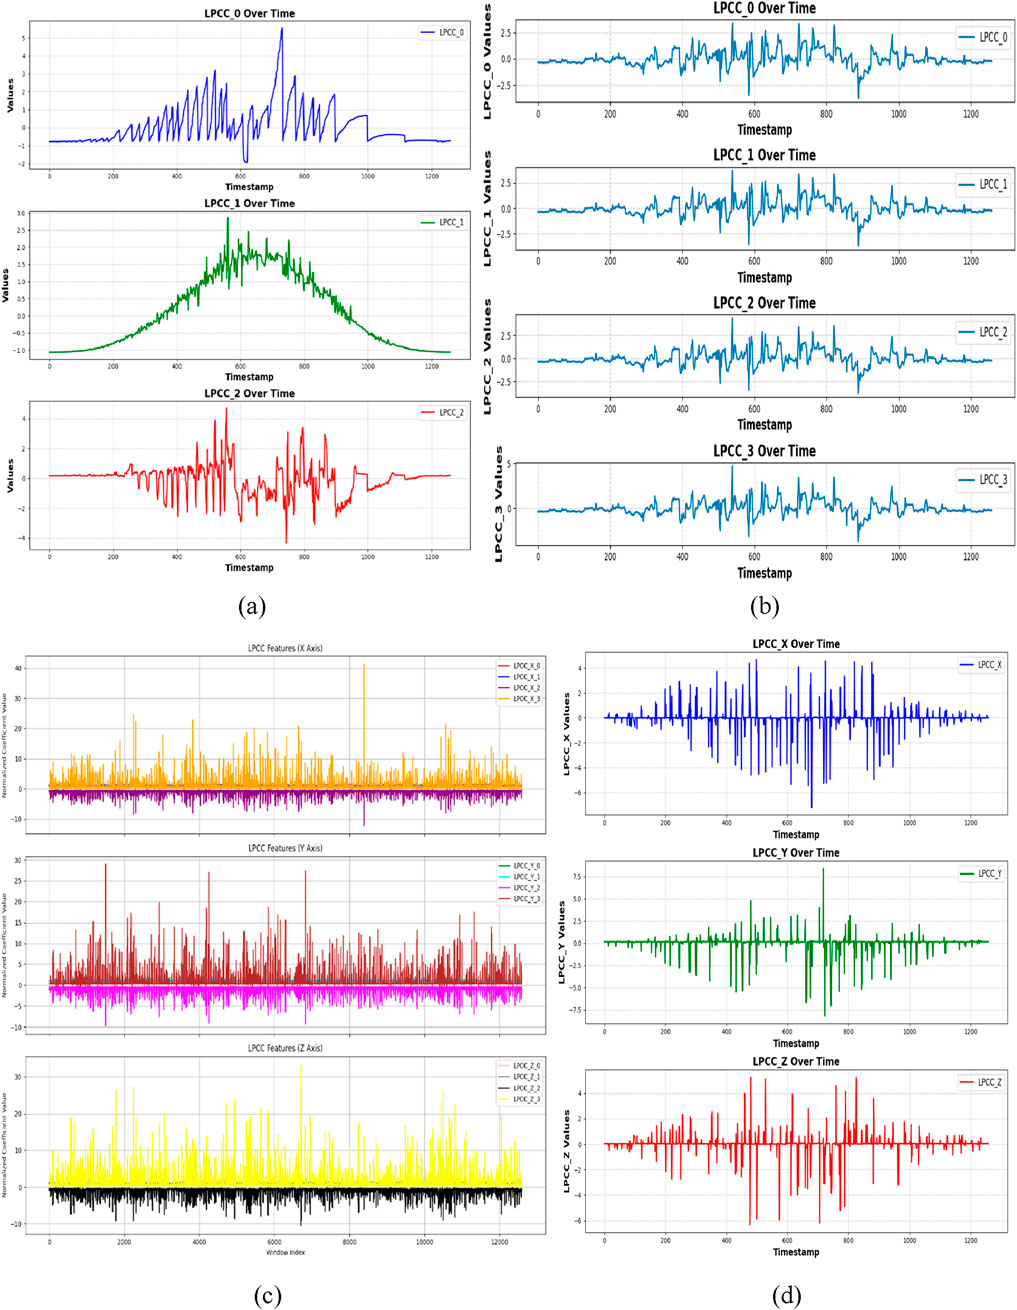
Figure 7. LPCC plotted with (a,b) show LPCC plot over ADL and fall activities over UR-fall dataset (c,d) show LPCC plot over ADL and fall activities over UMA_fall dataset.
3.5.4 State space correlation entropy (SSCE)
Temporal structure and complexity of signals are examined using SSCE to extract features from physical motion data. The time delay is used to partition the signal into overlapping embedded vectors of the signal. These embedded vectors are then, in a pairwise manner, output in the form of a distance matrix, where diagonal terms represent the correlation of vectors to themselves and off-diagonal terms represent vectors’ distances. We then utilize the covariance matrix from these distances to evaluate the likelihood of correlations, computing the SSCE as given in Equation 11.
where
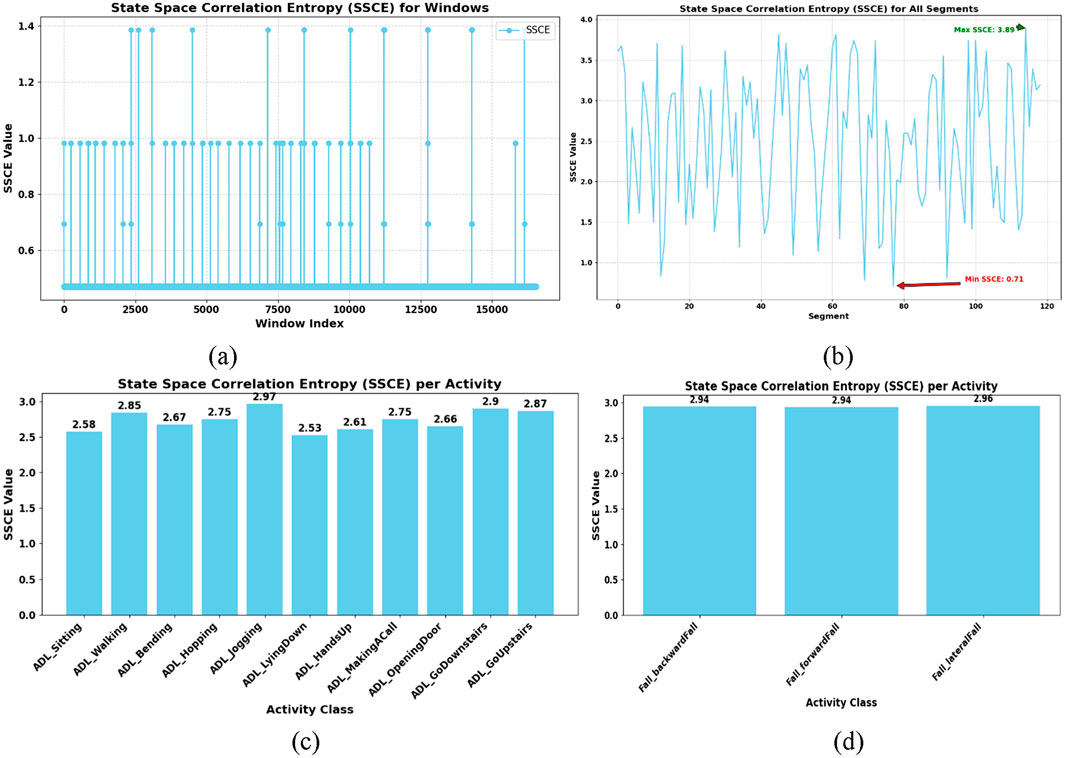
Figure 8. SSCE plotted with (a,b) shows SSCE of ADL and fall activities over UR-fall dataset (c,d) show SSCE of ADL and fall activities over UMA_fall dataset.
3.6 Feature extraction for vision-based sensor
The feature extraction stage saw us acquire important visual features from the UR-Fall and UMA_Fall datasets. The extracted features—2.5D point clouds, kinetic energy, joint angles, curve points, and full-body ridges—were selected meticulously based on the spatial geometry capture, intensity of motion, direction and quality of body orientation and shape changes necessary to identify ADLs from fall activities clearly. Precisely, 2.5D point clouds capture posture with awareness of depth and hence sudden vertical displacements can be detected. Kinetic energy measures intensity of frame-wise movement and assists with detection of sudden changes. Joint angles provide insight into the coordination and alignment of limbs and curve points and ridges provide capture of deformities in outlines and contours particularly in occlusion or poor illumination scenarios. Collectively, these features play complementary roles synergistically to enable detection in diverse visual and occlusion environments typical to real-world eldercare and healthcare monitoring environments. The current set of features serves the dual purpose of interpretability and computational efficacy; however, the system is extensible and can in the future be extended to include sophisticated descriptors like optical flow, the body’s path-wise metrics, or deep visual embeddings depending on application needs.
3.6.1 2.5D point cloud feature
The resulting 2.5D point cloud comprises both depth, and RGB information to allow exact spatial analysis of motion. From the silhouette images collected from the UMA_Fall dataset, depth values were retrieved and projected onto corresponding RGB frames and then turned into the 3D points. The depth Z was computed using Equation 12.
Here,
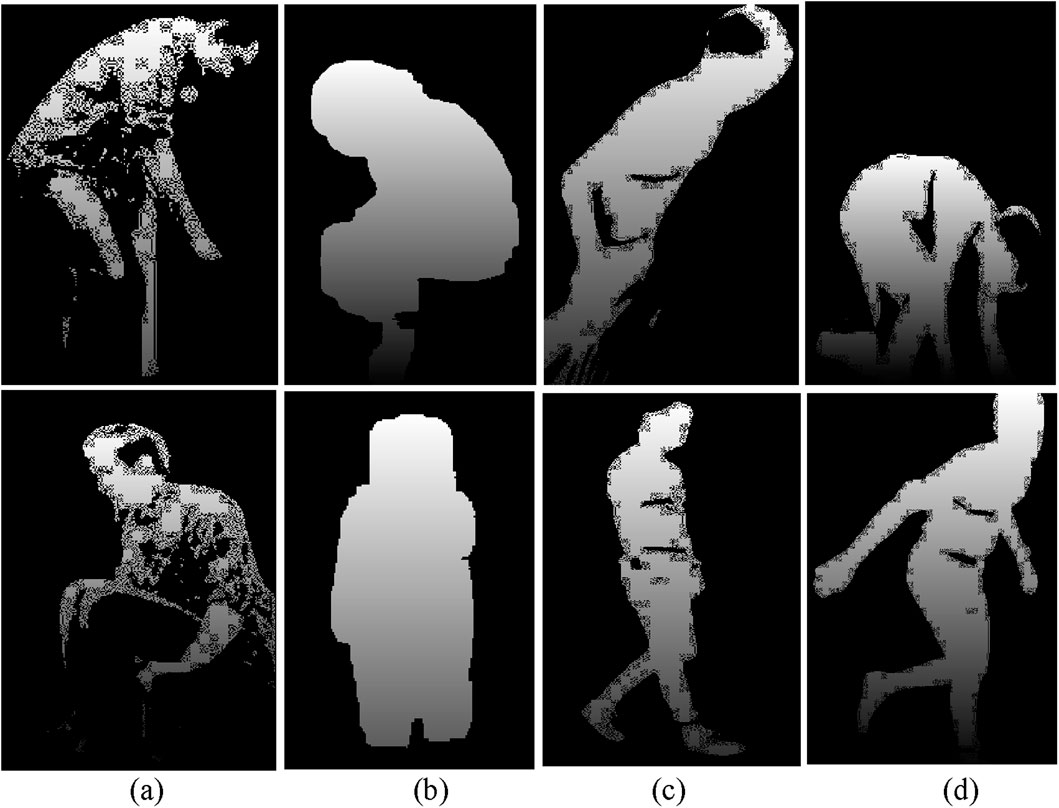
Figure 9. (a,b) show 2.5D representations for ADL and fall activities in the UR-Fall dataset, while (c,d) display the same for the UMA_Fall dataset.
3.6.2 Kinetic energy
Kinetic energy preserves the intensity of motion between subsequent frames and acts as an invariant attribute for activity detection. Using the UR-Fall dataset and UMA_fall dataset, for smoothening binary silhouette images of differing motions in successive frames, pixel variation was derived that mirrored the quantitative motion dynamics using Equation 13.
Where,
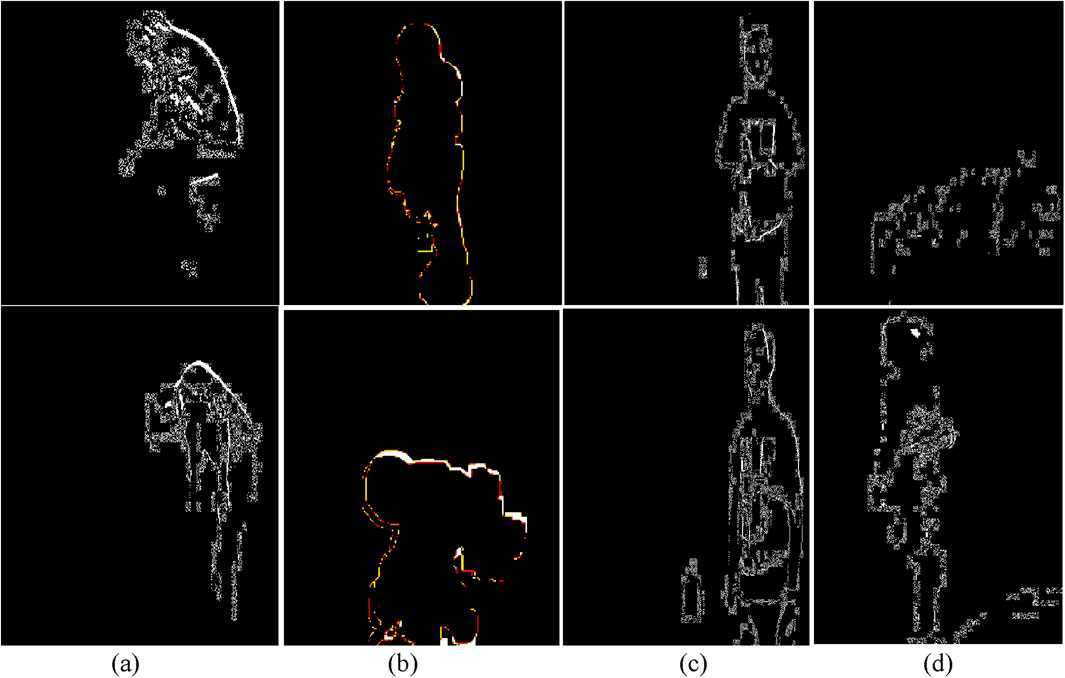
Figure 10. Kinetic energy feature results over various fall and ADL activities from the UR-Fall and UMA_Fall datasets (a,b) illustrate kinetic energy variations for ADL and fall activities in the UR-Fall dataset, while (c,d) show the same for the UMA_Fall dataset.
3.6.3 Geometric feature (triangles)
Joint angles concern the positions of some segments in relation to other segments during particular activities and, as such, supply information regarding dynamic movements. These angles alter based on the activity, thus boosting the action recognition accuracy. The essential body locations allowed twelve joint angles to be determined in this investigation. Each angle was worked out using three pits, and consequently a triangle was involved in the assessment of each angle. The angles were determined with the formula below in Equation 14.
Here,
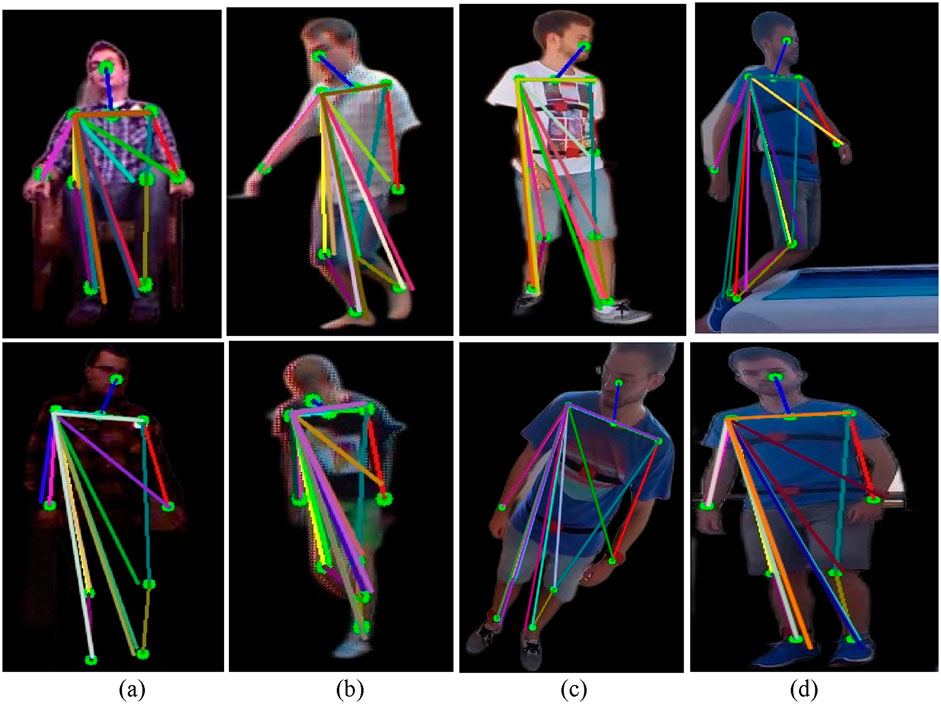
Figure 11. Triangle feature results over various fall and ADL activities from the UR-Fall and UMA_Fall datasets for (a,b) depict triangle representations for ADL and fall activities in the UR-Fall dataset, while (c,d) show the same for the UMA_Fall dataset.
3.6.4 Full-body curve
In our research, we achieved this by capturing the complete body contour using canny edge detection and freeman chain coding, which made it easy to recognize the most important contour regions. Canny edge detection enhances the edges of an object, while Freeman’s chain coding codes the object’s contour with a specific directed direction. The utilized eight directional vectors are shown in Equation 15.
The silhouette boundary points are specified in Equation 16:
Here,
The detected curve points were visualized on the original silhouette by marking every nth point for clarity. Figures 12a,b show the full-body curve points for ADL and fall activities in the UR-Fall dataset, while Figures 12c,d present the same for the UMA_Fall dataset. ADL activities display evenly distributed curve points, indicating balanced body posture. In falls, the points cluster around areas with rapid contour changes, highlighting irregular postures. This distinction captures dynamic body shapes and supports robust activity recognition. This technique efficiently captures the dynamic properties of the human body’s shape for applications in motion and posture analysis.
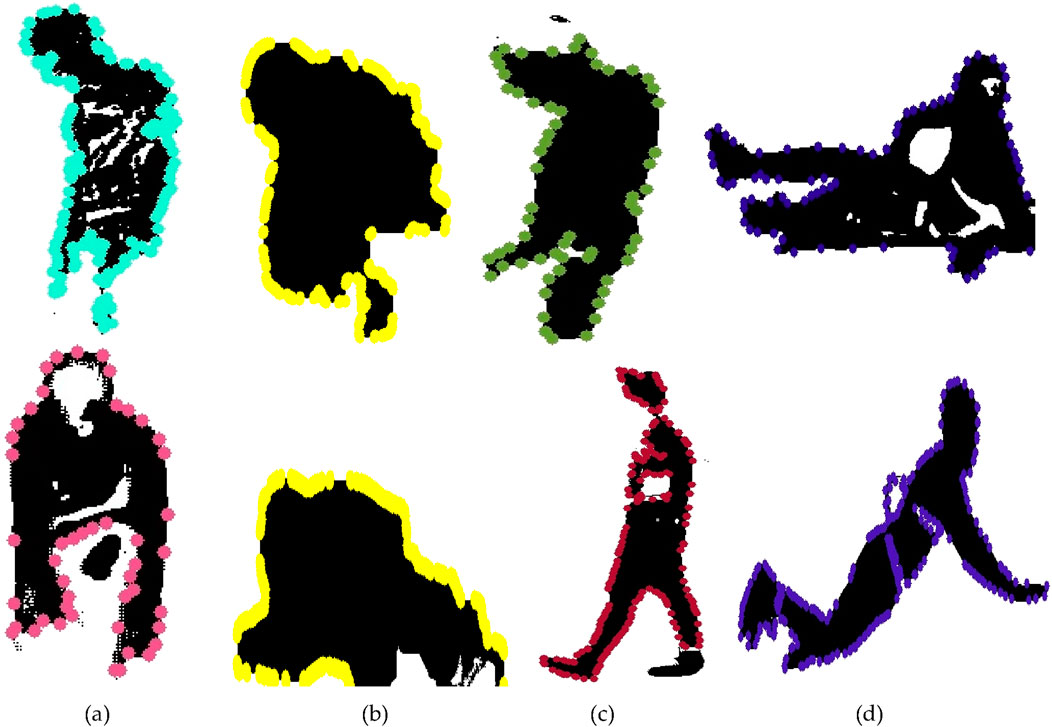
Figure 12. Full-body curve point feature results over various fall and ADL activities from the UR-Fall and UMA_Fall datasets. (a,b) show the full-body curve points for ADL and fall activities in the UR-Fall dataset, while (c,d) present the same for the UMA_Fall dataset.
3.6.5 Full-body ridge
The ridge characteristics were created from binary edge data acquired using Hessian matrix-based processing. Depth silhouettes were applied to extract binary edges, which were subsequently processed using the Hessian matrix to construct second-order derivatives. Specifically, the matrix components
Where
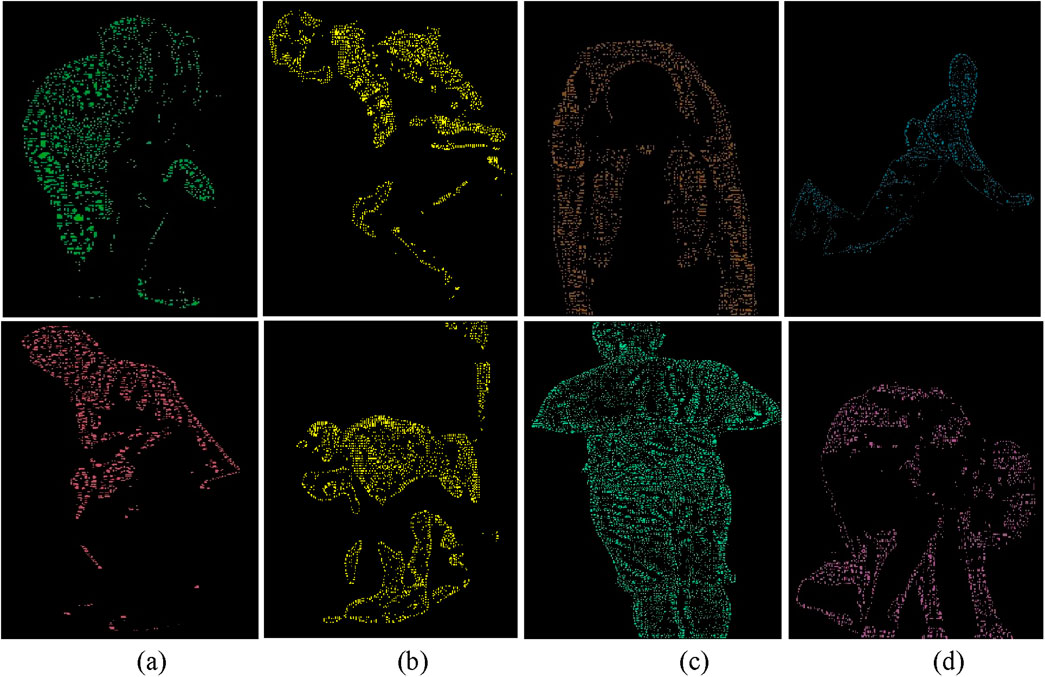
Figure 13. Full-body ridge feature representations with labeled body parts for various ADL and fall activities in (a,b) the UR-Fall dataset and (c,d) the UMA-Fall dataset.
3.7 Feature fusion
In this work, we have used vision-based and inertial-based sensor data to classify falls and Activities of Daily Living (ADL) using a multimodal feature fusion method. Using Hamming windows, inertial properties such as LPCC, GMM, SSCE, and GCC coefficients were first extracted from segmented signals. This process captured both temporal and frequency characteristics. A generalized inertial model was then constructed via intra-modality fusion. Features from the vision-based data, including body ridges, kinetic energy, 2.5D point clouds, and skeletal keypoints, were simultaneously recovered and incorporated into the visual modality. Last but not least, the two modalities were integrated by inter-modality fusion using a well-liked column fusion technique enhanced by the Adam optimizer. The column fusion approach entailed horizontal concatenation of modality features, which were normalized together. All windows were kept consistent in dimensions, and adaptive weights were handled by the DNN model without requiring manually defined fusion weights. To preserve interpretability and modality-specific variance, no explicit dimensionality reduction (e.g., PCA) was applied. Instead, feature selection and optimization were embedded within the dense layers of the DNN, allowing the model to learn modality interactions and eliminate redundancy. This produced a high-level multimodal feature set for ADL and fall classification, which was saved for further use.
3.8 Feature optimization
In this work, we employed the Adaptive Moment Estimation (Adam) optimizer to train a Deep Neural Network (DNN) for the classification of Activities of Daily Living (ADL) and falls. Adam dynamically adjusts the learning rate based on the first and second moments of gradients, computed using Equations 19, 20
where
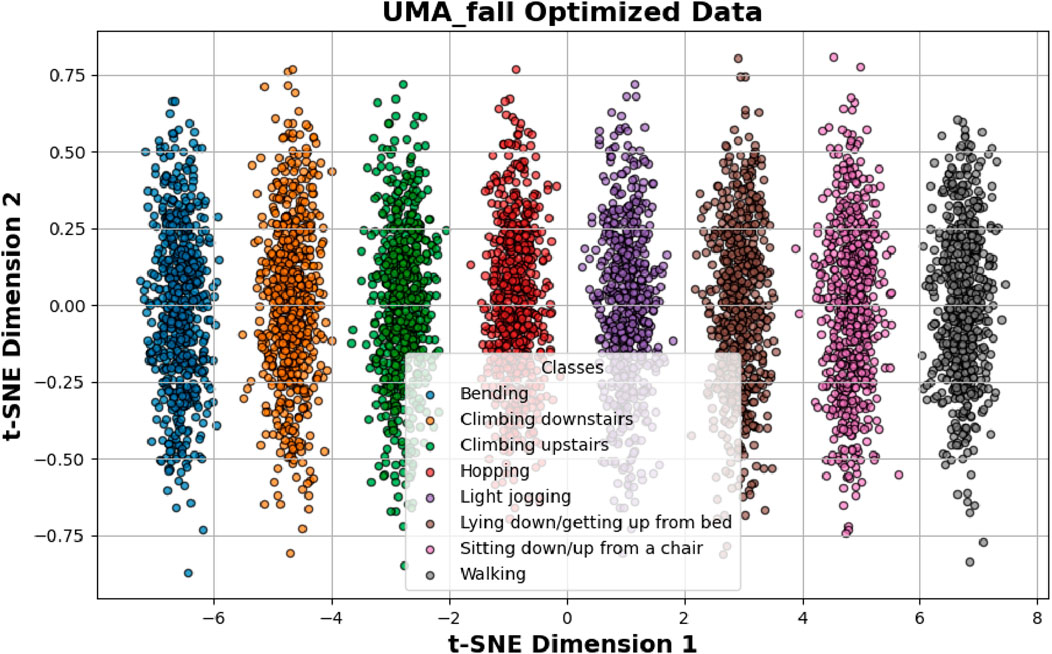
Figure 14. Shows optimization results over UMA_fall dataset.
3.9 Rationale for choosing deep neural network (DNN) classifier
The choice of Deep Neural Networks (DNNs) for this research was informed by their better ability to learn non-linear and complex patterns in multimodal and temporally dynamic data—abilities basic to our fused RGB and inertial sensor data. In contrast to conventional classifiers like Support Vector Machines (SVMs), Decision Trees, and k-Nearest Neighbors (k-NN), which frequently use manually chosen features and have poor performances in modeling high-dimensional or temporal data, DNNs provide automatic hierarchical feature abstraction suitable for our heterogeneous features such as 2.5D point clouds, kinetic energy, ridges features, and inertial coefficients such as LPCC, GCC, and GMM. Although classical models perform better on low-keyed or static data, their performance breaks down when handling multimodal time-series data due to the inability to model temporal correlations and inter-modality relations basic to human activity recognition tasks. Ensemble models like Random Forests, although good for categorization in general, do not generalize well when feature space is non-homogeneous and temporally inconstant, such as in the cases of ADL and fall events. In contrast, DNNs capture such dynamics intrinsically and performed well in terms of generalization across UR-Fall and UMA_Fall datasets, outperforming other models such as CNN-SVM and CNN-LSTM hybrids documented in earlier research (Modak et al., 2024; Nooyimsai et al., 2022). In addition, integrating the Adam optimizer improved training stability and convergence of DNN, rendering it computationally efficient and highly accurate. In particular, DNNs have been used effectively for similar tasks in human activity identification by using body-worn sensors and video streams, substantiating our selection by drawing upon empirical evidence (Fridriksdottir and Bonomi, 2020; Keskin et al., 2020; Hossain et al., 2023). With such capabilities, DNNs represent an effective and scalable solution for intricate healthcare monitoring platforms, especially those demanding accurate identification of minimal-motion movements and transitions in activities.
3.10 Classification
In our research, we used Deep Neural Network (DNN) architecture that is designed to recognize multi-dimensional data points obtained from wearable sensors. This design incorporates several dense layers in the structure of the dropout, which is useful for too many sophisticated sensor data inputs like the accelerometer and gyroscope data. The full architectural configuration of the DNN is detailed in Table 2. Subsequently, each layer performs increasingly pervasively higher-order feature extraction and enables identification of complicated correlations associated with varied activities. The early levels remove recognized and articulated patterns completely and involve just the fundamental intuitive aspects of acceleration, velocity vectors, and direction. It is in this hierarchical structure that it becomes advantageous to Filter for vocations that have similar motion profiles but different contextual subtleties. For this reason, the DNN is adaptable and easy to apply globally with users, especially when other users with a different structure are introduced. Using a wide and balanced set of activities for the training of the network, our architecture produces both accurate and semantically sound categorization results. Specifically, the classification accuracy for UMA_fall ADL activities is 97%, while for UMA_fall fall activities, it is 96%. Additionally, the accuracy for UR-fall ADL activities is 94%, and for UR-fall fall activities, it is 92%. During the training process, such parameters as runtime and memory reveal that the proposed technique works nicely with real datasets. During training, performance metrics such as runtime and memory usage demonstrated that the proposed model handles real-world data efficiently. To further validate the real-time applicability of our model, we evaluated inference latency and memory footprint on a standard computing system: Intel Core i7-10510U (1.80 GHz), 8 GB RAM, Windows 10, using Python in PyCharm without GPU acceleration. The model’s performance demonstrated an average inference latency of about 13.5 milliseconds per instance and maximum memory utilization around 310 MB when evaluated. The outcomes confirm the system to be deployable in real-time or near real-time in healthcare-oriented embedded environments.
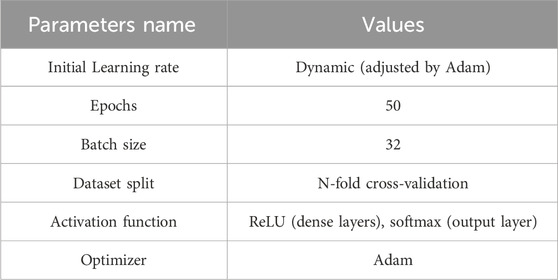
Table 2. Parameter configuration for DNN algorithm.
4 Performance evaluation
The system in question was examined using two common benchmark datasets. Its performance was thoroughly investigated by confusion matrices, precision and recall metrics, F1 scores, and Receiver Operating Characteristic (ROC) curves, collectively highlighting its usefulness.
4.1 Dataset description
4.1.1 UMA_fall dataset
The UMA_Fall Detection dataset contains data from 19 people aged between 18 and 52 years old; all subjects were of various height, ranging from 155 cm to 195 cm, and weight, ranging from 50 kg to 93 kg. This was done through video participants doing falls and accomplishing ADLs while wearing five internal sensors (gyroscopes, accelerometers, and magnetometers in cellphones) and four external IMUs. The ADLs covered such functions as bending, moving up and down stairs, hopping, mild jogging, reclining and sitting down/getting up from bed/a chair, and walking at a flat rate. Additionally, the dataset covers three fall types: There are mechanical movements, namely,: backward, forward, and lateral. Figures 15c,d represent live examples of dataset.
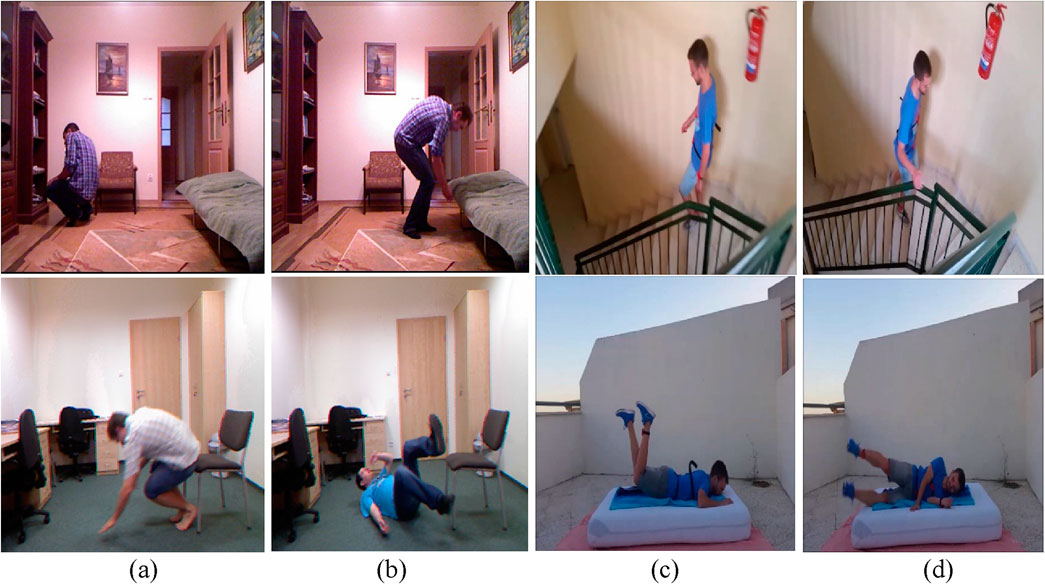
Figure 15. Shows various ADL and fall activities across the UR-Fall and UMA_Fall datasets: (a,b) show ADL and fall activities from the UR-Fall dataset, while (c,d) show ADL and fall activities from the UMA_Fall dataset.
4.1.2 UR fall detection dataset
The UR Fall Detection dataset was generated by gathering data from two Kinect cameras connected via USB and an IMU device worn on the waist and paired via Bluetooth. Activities of Daily Living (ADLs) were collected using camera 0 and an accelerometer, while devices such as the PS Move and x-IMU captured additional sensor data. Five participants participated, undertaking 70 sequences that included 30 falls and 40 ADLs within an office scenario. Falls were done onto a carpet approximately 2 cm thick, with the x-IMU positioned at the pelvis. Each volunteer conducted forward, backward, and lateral falls at least three times, as well as ADLs such as standing, sitting, squatting, bending, picking up goods, and resting on a sofa, as shown in Figures 15a,b. All deliberate falls were properly detected, with rapid sitting movements categorized as ADLs despite their similarity to falls when evaluated with an accelerometer or a combination of accelerometer and gyroscope. The dataset also includes falls from standing positions and while sitting on a chair. Raw accelerometer data and depth and RGB image sequences collected by two Kinect cameras were kept for each incident. Additionally, a threshold-based fall detection system was implemented, with images obtained using Microsoft Kinect cameras.
Although the proposed system functions reliably on both datasets, there exist data collection-related limitations that should be noted. Firstly, the datasets are predicated on fixed sensor placement, which may not directly translate to practical deployments and could impact signal quality. Secondly, although the UMA_Fall dataset contains participants with diverse height and weight ranges, both datasets are confined to healthy adults and exclude elderly, pediatric, and physically challenged participants to restrict generalizability. Finally, data were acquired under constrained conditions, with real-world environments potentially bringing extraneous issues like sensor movement, occlusion, or unmodeled activities to the fore. Remedying these concerns is critical to future clinical or home-based deployments.
5 Results and analysis
In this section, various experiments were conducted to evaluate the proposed system. The evaluation utilized metrics such as the confusion matrix, precision, recall, F1 score, and Receiver Operating Characteristic (ROC) curve. A comprehensive discussion and analysis of the results are provided below.
5.1 Experiment 1: confusion matrix
In the first experiment, we plotted the confusion matrix for both datasets. The confusion matrix gives a concise visual representation of the classifier’s performance, emphasizing its strengths and limitations in terms of how it handles different classes. Tables 3 and 4 exhibit the confusion matrix for the UMA_fall ADL and fall activities, respectively. While tables 5 and 6 show confusion matrix for the UR-fall dataset over ADL and fall activities, respectively.
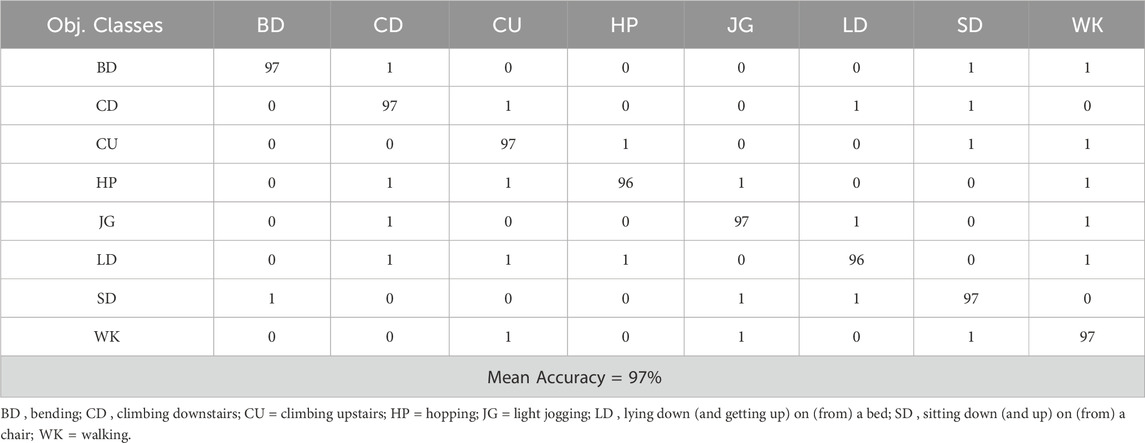
Table 3. Confusion matrix calculated over the ADL activities of UMA_fall Dataset.
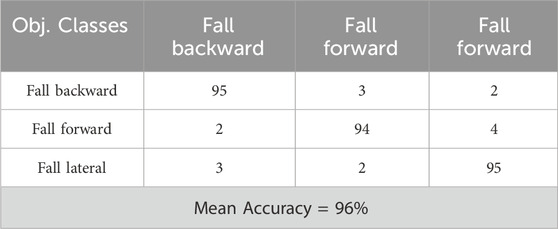
Table 4. Confusion matrix calculated over fall activities of UMA_fall Dataset.
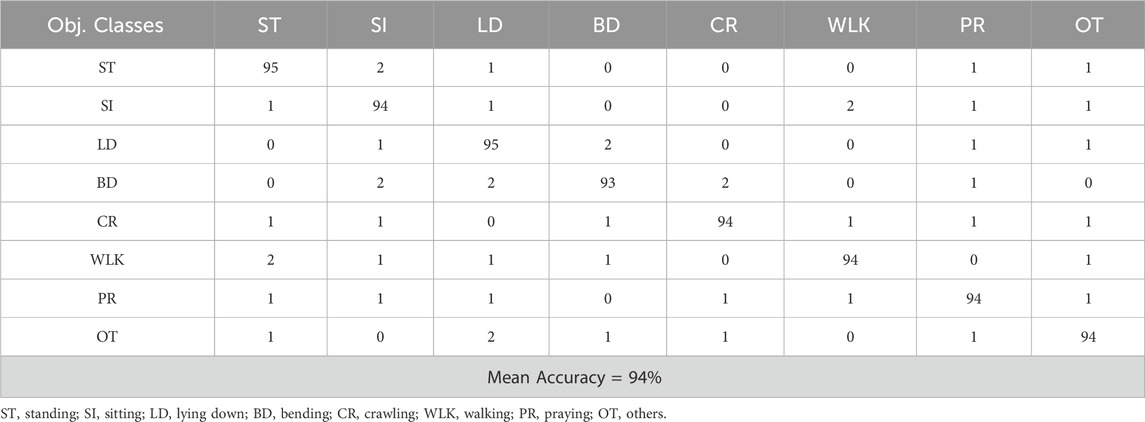
Table 5. Confusion matrix calculated over ADL activities of UR-fall Dataset.
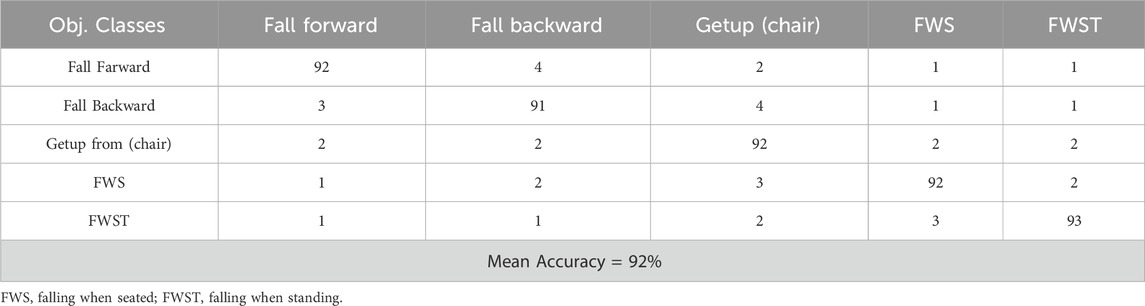
Table 6. Confusion matrix calculated over fall activities of UR-fall Dataset.
5.2 Experiment 2: precision, recall and F1 score
In this experiment, the proposed system undergoes a thorough evaluation, accompanied by an in-depth analysis of its specific implications in certain domains. Table 7 presents the evaluation matrics, including precision, recall and F1 score for both datasets.
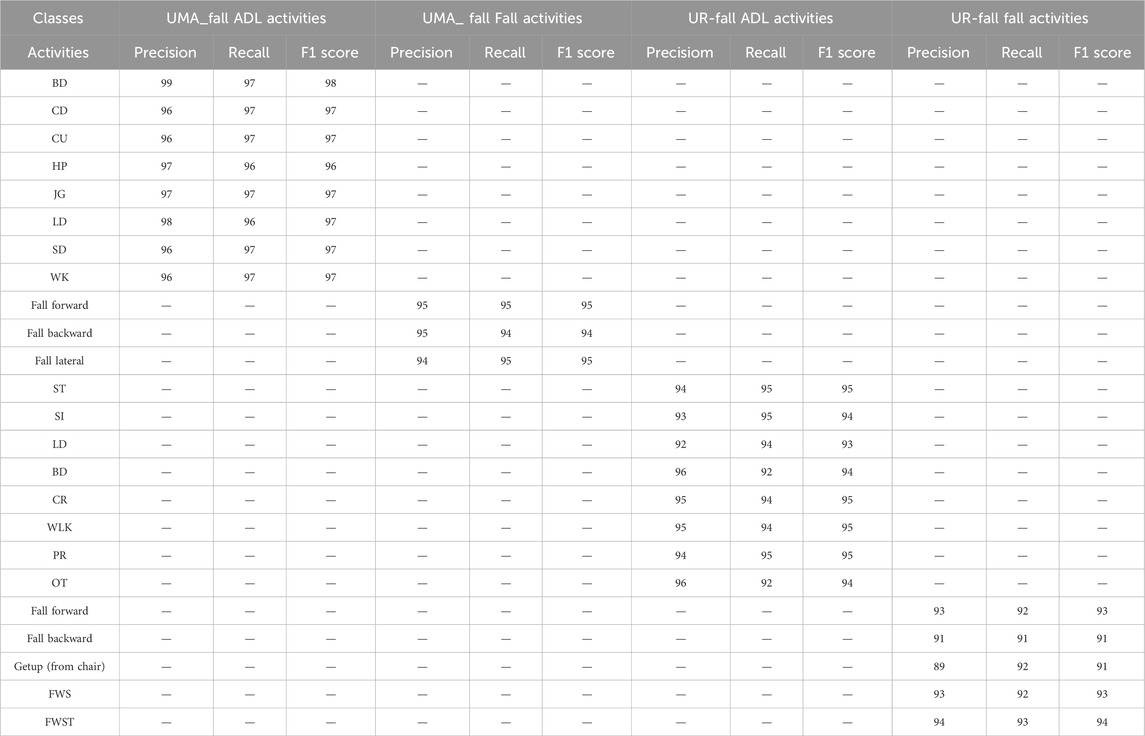
Table 7. Precision, Recall, and F1 score for ADL and Fall activities over UMA_fall and UR-fall Datasets.
5.2.1 Discussion and analysis
The analysis of the fall detection and activity recognition performance using the UMA_Fall and UR_Fall datasets demonstrates strong reliability across various activities. The precision, defined as the rate of accurate identification of activities, is notably high for some activities such as ‘Lying Down,’ ‘Jogging,’ and ‘Sitting Down’ in the UMA_Fall dataset, exceeding 96. This indicates the reliability of the method for monitoring essential everyday activities in elder care and rehabilitation. Similarly, activities that resemble falling, such as ‘Fall Forward,’ ‘Fall Backward,’ and ‘Fall Lateral,’ exhibit exceptionally high precision and recall, specifically 95, so affirming the adequacy of the proposed model for real-time fall detection. In the context of the UR_Fall dataset, the ‘Standing’ and ‘Sitting’ categories exhibit precision and recall exceeding 93, indicating the model’s adaptability across various sensors. Nonetheless, certain movement transitions exhibit marginally reduced accuracy, as evidenced by a recall of 89 for the state ‘Get up (from chair)' in the UR_Fall dataset; this aspect could be improved to better capture significant, albeit occasionally subtle, movements for various applications, such as physical therapy or workplace ergonomics. The F1 score, which measures the average of precision and recall, remained elevated in most tasks, reflecting the model’s overall competence. Notable favorable connections exist between health monitoring and fall prevention, while there are places where the system’s effectiveness regarding activity transitions might be enhanced.
A significant factor in the detection of falls is false positives caused by high-velocity ADLs like sudden sitting or lying down. Such actions can cause motion signatures that are very similar to falls when using only accelerometer or gyroscope signals. Our system’s sensor fusion, however, through visual and inertial features like body posture modeling, curve dynamics, and 2.5D point cloud transition allows successful discrimination to be performed. As exemplified by the confusion matrices (Tables 4 and 5), activities like “Getup (chair)” and “Sitting” are differentiated well from fall events, verifying the learning system’s capability to break down motion similarities through semantic and context clues.
5.3 Experiment 3: ROC (receiver operating characteristic curve)
The Receiver Operating Characteristic (ROC) curves presented in Figures 16a,b depict the performance of a categorization system of various health related activities. The AUC under the ROC curve provides a single metric summarizing the performance. The closer the AUC gets to 1, the better the model is at distinguishing the positive class (the specific activity) from the negative class (all the other activities).
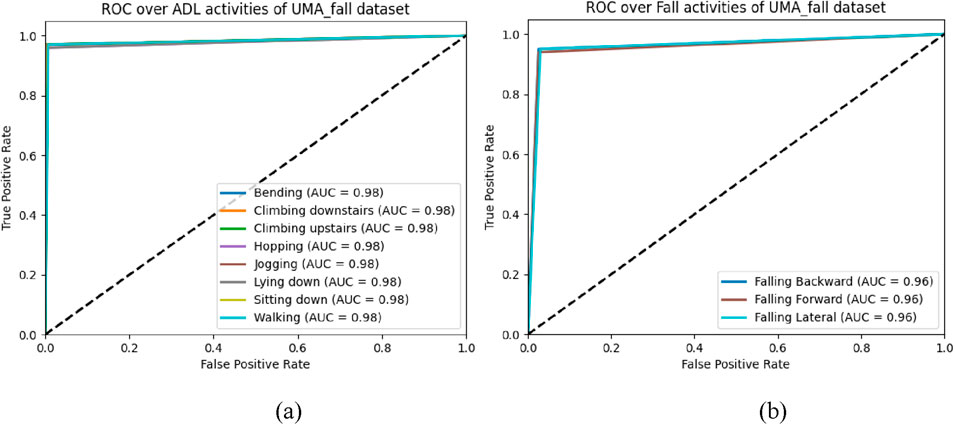
Figure 16. ROC curves for the UMA_Fall dataset: (a) ADL activities, (b) Fall activities.
5.3.1 Discussion and analysis of ROC curve
In Figure 16a, by considering the ADL dataset of the UMA_fall dataset, it is clear that the ‘Walking’ and ‘Sitting’ activities demonstrated the maximum model efficiency with approximately 100 percent accuracy as seen by the AUC values equal to 0.98. The other movements, such as ‘Climbing downstairs,’ ‘Bending,’ ‘Climbing upstairs,’ ‘Hopping,’ ‘Jogging,’ and ‘Lying down,’ also exhibit remarkable model performance with an AUC of 0.98 for all. These outcomes illustrate the capacity of the model to recognize a large variety of ADLs utilizing a decreased quantity of misclassification. In Figure 16b, which examines fall-related activities, the model likewise performs robustly, reaching AUCs of 0.96 across all three fall scenarios: These include ‘Falling Backward, Falling Forward’, and ‘Falling Lateral’. This is significant in fall detection systems and shows that the suggested model is capable of identifying falls with sufficient reliability across the different types of falls. The AUCs, albeit high, are slightly lower than those obtained by the identical activities in ADLs, which hint to the prospective opportunity for development in dealing with more sophisticated fall detection circumstances.
5.4 Experiment 5: comparisons with state of the art (SOTA)
In (Modak et al., 2024), the UMA_Fall dataset, with its 25 hand-engineered features, enabled the delopment of hybrid models combining 1D CNNs and classifiers like Xception and SVM, achieving 92% accuracy. Its sensor-based approach is effective for mobility applications but poses compliance challenges, especially for elderly users. (Hafeez et al., 2023). integrated inertial sensors and RGB features, combining accelerometer data with skeletal tracking from Kinect to achieve high accuracy in ADL and fall detection. However, synchronization challenges between sensors remain. Another study used the URFall datasets, leveraging histogram and motion vector features to achieve 92.83% accuracy, respectively. While highly accurate, distinguishing between similar activities remains an issue.
In (Nooyimsai et al., 2022), a CNN-LSTM ensemble model classified falls into non-fall, pre-fall, and fall states using UMA_Fall dataset, achieving state-of-the-art accuracies of 96.16%. The approach combined temporal modeling and feature extraction, demonstrating strong real-world potential. Finally, a novel macro-feature-based method in (Beddiar et al., 2022) utilized Le2i and UR-FD datasets to calculate body posture angles and distances, achieving high performance with LSTM, TCN, and SVM models, though improvements in annotation and posture differentiation are needed. Together, these works demonstrate the strengths of sensor-based (e.g., UMA_Fall and UR-Fall) datasets. Combining these approaches through hybrid systems, such as multi-sensor fusion and CNN-LSTM ensembles, could enhance robustness, accuracy, and applicability in diverse fall detection scenarios. Table 8 shows the comparison of proposed method with state-of-the-art methods.
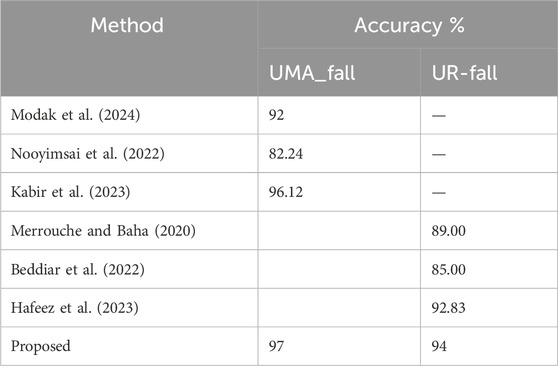
Table 8. Comparisons with state of the art.
6 Implication of proposed system
There are many implications of the proposed system since the strong performance of the metrics for both the UMA_Fall and UR_Fall datasets. The AUC of ROC curves show that the algorithm performs well for ‘Walking’ and ‘Sitting’ as well as falling activities such as ‘Falling Backward, Falling Forward,’ and ‘Falling Lateral.’ From these results, it can be concluded that the system indeed possesses an excellent true positive detection rate in both the daily actions and autumn events with low false positive rates of the algorithm. Precision, recall and F1 score are also used to give more information about the reliability of the system. In the UMA_Fall dataset, the ‘Lying Down’ F1 score is 97, ‘Jogging’ F1 score is 97, and ‘Sitting Down’ F1 score is 97, it shows that the proposed model works effectively in accurate classification of regular movements. Typical fall actions such as “fall forward,” “fall backward,” and “fall laterally” reliably achieve F1 scores of 95, illustrating the system’s resilience in principal fall scenarios. With the UR_Fall dataset, the basic activities – ‘Standing’ (F1 = 95) and ‘Walking’ ((F1 = 95) demonstrate that the system functions well with multiple sensors; ‘Get up (from chair)’ results demonstrated somewhat lower accuracy (F1 = 91) which could be fine-tuned. Such findings clearly suggest the possibility of the use of the system in a myriad of fields such as elder care, emergency response, and smart homes among others.
7 Conclusion
This work introduced a new and extremely efficient paradigm for human action identification based on information fusion from RGB and inertial sensors, state-of-the-art machine learning methods, and DNN. The proposed system achieves high accuracy in distinguishing ADLs and falls using optimized features: 2.5D point cloud, kinetic energy, and inertial coefficients. Higher levels of preprocessing and accurate segmentation improved the quality and trustworthiness of features in various datasets. The performance and flexibility given by the system recommend it as a suitable option for long-term health checks and fall detection in aged care and practical healthcare settings.
Evaluations on the UMA_Fall and UR-Fall datasets showcased the system’s ability to generalize effectively, achieving high classification accuracies and demonstrating robustness to variations in working conditions such as sensor placement, participant diversity, and environmental noise. Techniques such as regularization, data augmentation, and cross-validation ensured the stability and reliability of the method across different scenarios.
The performance and flexibility offered by the system make it a promising option for long-term health monitoring and fall detection, particularly in elderly care and practical healthcare applications. By leveraging advanced multimodal data fusion and robust feature extraction, the system provides a dependable solution for real-world healthcare challenges, paving the way for improved patient outcomes and proactive health management.
Data availability statement
Publicly available datasets were analyzed in this study. This data can be found here: https://paperswithcode.com/dataset/urfd-dataset, https://figshare.com/articles/dataset/UMA_ADL_FALL_Dataset_zip/4214283.
Ethics statement
Ethical review and approval was not required for the study on human participants in accordance with the local legislation and institutional requirements. Written informed consent from the patients/ participants OR patients/participants legal guardian/next of kin was not required to participate in this study in accordance with the national legislation and the institutional requirements.
Author contributions
IA: Methodology, Writing – original draft. SA: Formal Analysis, Writing – review and editing. NaA: Conceptualization, Writing – review and editing. AA: Validation, Writing – review and editing. NoA: Conceptualization, Writing – review and editing. AJ: Supervision, Writing – review and editing. HL: Resources, Writing – review and editing.
Funding
The author(s) declare that financial support was received for the research and/or publication of this article. The APC was funded by the Open Access Initiative of the University of Bremen and the DFG via SuUB Bremen. The support of this work was provided by Princess Nourah bint Abdulrahman University Researchers Supporting Project number (PNURSP 2025R410), Princess Nourah bint Abdulrahman University, Riyadh, Saudi Arabia. The authors extend their appreciation to the Deanship of Scientific Research at Northern Border University, Arar, KSA for funding this research work through the project number “NBU-FFR-2025-231-05”.
Acknowledgments
The authors are thankful to Princess Nourah bint Abdulrahman University Researchers Supporting Project number (PNURSP 2025R410), Princess Nourah bint Abdulrahman University, Riyadh, Saudi Arabia.
Conflict of interest
Author HL was employed by Guodian Nanjing Automation Co., Ltd.
The remaining authors declare that the research was conducted in the absence of any commercial or financial relationships that could be construed as a potential conflict of interest.
Generative AI statement
The author(s) declare that no Generative AI was used in the creation of this manuscript.
Publisher’s note
All claims expressed in this article are solely those of the authors and do not necessarily represent those of their affiliated organizations, or those of the publisher, the editors and the reviewers. Any product that may be evaluated in this article, or claim that may be made by its manufacturer, is not guaranteed or endorsed by the publisher.
References
Abdulaziz, A., Abubaker-Eseddig, F., Mahmoud, E., and Shamsul, A. M. (2021). IoT MEMS: IoT-based paradigm for medical equipment management systems of ICUs in light of COVID-19 outbreak. IEEE Access 9, 131120–131133. doi:10.1109/ACCESS.2021.3069255
Afsar, M. M., Saqib, S., Aladfaj, M., Alatiyyah, M. H., Alnowaiser, K., Aljuaid, H., et al. (2023). Body-worn sensors for recognizing physical sports activities in exergaming via deep learning model. IEEE Access 11, 12460–12473. doi:10.1109/ACCESS.2023.3239692
Antony, A. (2024). “Flexible and wearable biosensors: revolutionizing health monitoring,” in Proceedings of the 9th international conference on flexible electronics and wearable technology. doi:10.1007/978-981-97-3048-3_12
Arunkumar, J. R., Raman, R., Sivakumar, S., and Pavithra, R. (2023). “Wearable devices for patient monitoring system using IoT,” in Proceedings of the 2023 international conference on communication and electronics systems (ICCES 2023). doi:10.1109/icces57224.2023.10192741
Beddiar, D. R., Oussalah, M., and Nini, B. (2022). Fall detection using body geometry and human pose estimation in video sequences. J. Vis. Commun. Image Represent. 82, 103407. doi:10.1016/j.jvcir.2021.103407
Bhasker, D., Tamilselvi, M., Baburaj, E., and Omkumar, S. (2022). Biosignal electrode-based patient health monitoring system. Nucleation Atmos. Aerosols. doi:10.1063/5.0109775
Bhatlawande, S., Shilaskar, S., Pramanik, S., and Sole, S. (2024). Multimodal emotion recognition based on the fusion of vision, EEG, ECG, and EMG signals. Int. J. Electr. Comput. Eng. Syst. 15, 41–58. doi:10.32985/ijeces.15.1.5
Byeon, Y.-H., Pan, S.-B., and Kwak, K.-C. (2022). “Biometrics and healthcare system using EMG and ECG signals,” in Proceedings of the 7th international conference on mechanical engineering and robotics research (ICMERR). Krakow, Poland, 196–200. doi:10.1109/ICMERR56497.2022.10097819
Chakole, M., Ainchwar, I., Budhe, V., Babhale, A., Katolkar, A., and Dorle, S. S. (2024). “IoT - driven bioelectrical signals detection and monitoring system,” in Proceedings of the 2024 IEEE international conference on computational intelligence and communication applications. doi:10.1109/iccica60014.2024.10585066
Chavan, A., Desai, S., Patil, A., Joshi, M., and Gokhale, U. (2023). Selecting the best optimizers for deep learning–based medical image segmentation. Front. Radiol. 3, 1175473. doi:10.3389/fradi.2023.1175473
Cheng, H., Ji, S., Chen, Z., Sun, T., and Yan, Y. (2024). Identification and analysis of human-exoskeleton coupling parameters in lower extremities. IEEE Trans. Haptics 17, 650–661. doi:10.1109/toh.2024.3375295
Das, S. (2024). “Applications of sensor technology in healthcare,” in Advances in medical technology and clinical practice. doi:10.4018/979-8-3693-2762-3.ch006
Di Nuzzo, F., Brunelli, D., Polonelli, T., and Benini, L. (2021). Structural health monitoring system with narrowband IoT and MEMS sensors. IEEE Sens. J. 9, 16371–16380. doi:10.1109/JSEN.2021.3075093
Eswaran, U., Eswaran, V., and Murali, K. (2024). “Healthcare smart sensors,” in Advances in medical diagnostics, treatment, and care (AMDTC). doi:10.4018/979-8-3693-3679-3.ch002
Fridriksdottir, E., and Bonomi, A. G. (2020). Accelerometer-based human activity recognition for patient monitoring using a deep neural network. Sensors 20, 6424. doi:10.3390/s20226424
Gabriel, P. G., Rehani, P., Troy, T. P., Wyatt, T. R., Choma, M. A., and Singh, N. (2024). Continuous patient monitoring with AI: real-time analysis of video in hospital care settings. arXiv. doi:10.48550/arxiv.2412.13152
Hadjar, H., Lange, J., Vu, B., Engel, F., Mayer, G., McKevitt, P., et al. (2020). “Video-based automated emotional monitoring in mental health care supported by a generic patient data management system,” in Proc. PSYCHOBIT.
Hafeez, S., Alotaibi, S. S., Alazeb, A., Mudawi, N. A., and Kim, W. (2023). Multi-sensor-based action monitoring and recognition via hybrid descriptors and logistic regression. IEEE Access 11, 48145–48157. doi:10.1109/ACCESS.2023.3275733
Haus, J. N., Lang, W., Roloff, T. P., Rittmeier, L., Bornemann, S., Sinapius, M., et al. (2022). MEMS vibrometer for structural health monitoring using guided ultrasonic waves. Sensors 22, 5368. doi:10.3390/s22145368
Hossain, M. S., Deb, K., Hossain, S. M. M., and Jo, K.-H. (2023). “Daily living human activity recognition using deep neural networks,” in International workshop on intelligent systems (IWIS), ulsan, korea, 1–6. doi:10.1109/IWIS58789.2023.10284678
Kabir, M. M., Shin, J., and Mridha, M. F. (2023). Secure your steps: a class-based ensemble framework for real-time fall detection using deep neural networks. IEEE Access 11, 64097–64113. doi:10.1109/ACCESS.2023.3289402
Kakara, R., Bergen, G., Burns, E., and Stevens, M. (2023). Nonfatal and fatal falls among adults aged ≥65 Years — United States, 2020–2021. MMWR Morb. Mortal. Wkly. Rep. 72, 938–943. doi:10.15585/mmwr.mm7235a1
Keskin, Ş. R., Gençdoğmuş, A., Yıldırım, B., Doğan, G., and Öztürk, Y. (2020). “DNN and CNN approach for human activity recognition,” in Proceedings of the 7th international conference on electrical and electronics engineering (ICEEE) (Antalya, Turkey), 254–258. doi:10.1109/ICEEE49618.2020.9102624
Khan, M. S., Tariq, M. O., Nawaz, M., and Ahmed, J. (2021). MEMS sensors for diagnostics and treatment in the fight against COVID-19 and other pandemics. IEEE Access 9, 61123–61149. doi:10.1109/ACCESS.2021.3073958
Kumar, K., Bhaumik, S., and Tripathi, S. L. (2021). Health monitoring system. Adv. Med. Sens. Tech., 461–480. doi:10.1016/B978-0-323-85172-5.00018-6
Kumar, M. (2024). Wearable sensors: applications and challenges. Wearable Tech. Monogr., 98–106. doi:10.9734/bpi/mono/978-81-973809-6-9/ch9
Lavanya, N., Varshitha, S., Manmatti, S., Shirisha, M., Rani, K. P. A., and Gowrishankar, S. (2024). “Comprehensive non-intrusive patient monitoring system using advanced AI and ML,” in Proceedings of the 2024 international conference on smart technologies in signal and systems (CSITSS), 1–7. doi:10.1109/csitss64042.2024.10816875
Li, P., Qian, Y., and Si, N. (2022). “Electroencephalogram and electrocardiogram in human-computer interaction,” in Proceedings of the 2022 international conference on distributed smart computing applications (ICDSCA 2022). doi:10.1109/ICDSCA56264.2022.9988056
Liou, J.-C. (2019). The advent of application specific integrated circuits (ASIC)-MEMS within the medical system. Telehealth. IntechOpen. doi:10.5772/intechopen.80391
Mekruksavanich, S., and Jitpattanakul, A. (2024). Device position-independent human activity recognition with wearable sensors using deep neural networks. Appl. Sci. 14, 2107. doi:10.3390/app14052107
Merrouche, F., and Baha, N. (2020). Fall detection based on shape deformation. Multimedia Tools Appl. 79, 30489–30508. doi:10.1007/s11042-019-08428-w
Modak, R., Majumder, K., Chatterjee, S., Shaw, R. N., and Ghosh, A. (2024). “Empowering elderly safety: 1D-CNN and IoT-enabled fall detection system,” in Innovations in electrical and electronic engineering, lecture notes in electrical engineering. Editors R. N. Shaw, P. Siano, S. Makhilef, A. Ghosh, and S. L. Shimi (Singapore: Springer), 1115, 513–553. doi:10.1007/978-981-99-8661-3_38
Moise, M. V., Pantazica, M., and Otoiu, M. (2023). “IoT portable patient health monitoring system using MEMS sensors,” in Proceedings of the 2023 IEEE international symposium on smart electronics. doi:10.1109/isse57496.2023.10168525
Mosconi, D., Moreno, Y., and Siqueira, A. A. G. (2024). Exploring human–exoskeleton interaction dynamics: an in-depth analysis of knee flexion–extension performance across varied robot assistance–resistance configurations. Sensors 24, 2645. doi:10.3390/s24082645
Nooyimsai, L., Pakdeepong, O., Chatchawalvoradech, S., Phiakhan, T., and Laitrakun, S. (2022). “Smartphone-based human activity and fall recognition using deep feature extraction and machine-learning classifiers,” in Proceedings of the 17th international joint symposium on artificial intelligence and natural language processing (iSAI-NLP). Thailand: Chiang Mai, 1–6. doi:10.1109/iSAI-NLP56921.2022.9960250
Nsugbe, E., Connelly, S., and Mutanga, I. (2023). Towards an affordable means of surgical depth of anesthesia monitoring: an EMG-ECG-EEG case study. BioMedInformatics 3, 769–790. doi:10.3390/biomedinformatics3030049
Padha, B., Yadav, I., Dutta, S., and Arya, S. (2023). Recent developments in wearable NEMS/MEMS-Based smart infrared sensors for healthcare applications. ACS Appl. Electron. Mater. 5, 5386–5411. doi:10.1021/acsaelm.3c00860
Patel, P., and Biradar, V. (2024). Utilizing video data for estimating and monitoring physiological and mental health status. Afr. J. Biol. Sci. 6 (5). doi:10.48047/afjbs.6.5.2024.11570-11583
Peng, X., Zhang, S., Cai, M., and Yan, Y. (2023). Modelling and RBF control of low-limb swinging dynamics of a human–exoskeleton system. Actuators 12, 353. doi:10.3390/act12090353
Pothala, R. S. R., Reddy, B., Sekaran, S., and Reddy, P. R. S. (2024). Review on next-gen healthcare: the role of MEMS and nanomaterials in enhancing diagnostic and therapeutic outcomes. Biomaterials Technol. 1 (1), 1. doi:10.69709/biomatc.2024.131006
Rani, M., Ahmed, E., Perwej, Y., Kumar, S., Hariram, V., and Vani, V. G. (2024). A comprehensive framework for IoT, AI, and machine learning in healthcare analytics. Nanotechnol. Perceptions 20, 2118–2131. doi:10.62441/nano-ntp.vi.3072
Schmidt, R. M., Schneider, F., and Hennig, P. (2021). Descending through a crowded valley—benchmarking deep learning optimizers. Proc. 38th Int. Conf. Mach. Learn. 139, 9367–9376. Available online at: https://proceedings.mlr.press/v139/schmidt21a.html.
Shukla, K. K., Muthumanickam., T., and Sheela, T. (2022). Investigation to improve reliableness for health monitoring in different environments using MEMS-based higher sensitive microcantilever array. Southeast. Eur. J. Public Health (SEEJPH). doi:10.1109/ICEFEET51821.2022.9847970
Vaibhavi, A., Sonetha, P., Agarwal, P., Doshi, S., Kumar, R., and Mehta, B. (2017). Microelectromechanical systems in medicine. J. Med. Biol. Eng. 2017, 580–601. doi:10.1007/S40846-017-0265-X
Wang, W., Shan, C., Leonhardt, S., Mukkamala, R., and Nowara, E. (2024). Guest editorial: camera-based health monitoring in real-world scenarios. IEEE J. Biomed. Health Inf. 28, 595–597. doi:10.1109/jbhi.2023.3348248
Wang, Y., Chang, T., Wu, H., Dong, Z., Wei, B., and Chang, L. (2023). “Biomedical microelectromechanical system for molecular, cellular, and organ study,” in Nanomedicine. Micro/nano technologies. Editor N. Gu (Singapore: Springer). doi:10.1007/978-981-16-8984-0_27
Wu, J., Lin, X., Yang, C., Yang, S., Liu, C., and Cao, Y. (2024). Wearable sensors based on miniaturized high-performance hybrid nanogenerator for medical health monitoring. Biosensors 14, 361. doi:10.3390/bios14080361
Yan, Y., Chen, Z., Huang, C., and Guo, Q. (2023). Modelling and analysis of coupling dynamics of swinging a lower limb exoskeleton. Nonlinear Dyn. 111, 1213–1234. doi:10.1007/s11071-022-07876-8
Keywords: biosensing devices, artificial intelligence, machine learning, body pose, disease detection, decision-making, healthcare management biosensing devices, healthcare management
Citation: Abro IA, Alharbi SS, Alshammari NS, Algarni A, Almujally NA, Jalal A and Liu H (2025) Multimodal intelligent biosensors framework for fall disease detection and healthcare monitoring. Front. Bioeng. Biotechnol. 13:1544968. doi: 10.3389/fbioe.2025.1544968
Received: 13 December 2024; Accepted: 30 April 2025;
Published: 13 June 2025.
Edited by:
Wenlei Zhu, Nanjing University, ChinaReviewed by:
Yue Cao, Nanjing University of Posts and Telecommunications, ChinaRong-Bin Song, Zhengzhou University, China
Copyright © 2025 Abro, Alharbi, Alshammari, Algarni, Almujally, Jalal and Liu. This is an open-access article distributed under the terms of the Creative Commons Attribution License (CC BY). The use, distribution or reproduction in other forums is permitted, provided the original author(s) and the copyright owner(s) are credited and that the original publication in this journal is cited, in accordance with accepted academic practice. No use, distribution or reproduction is permitted which does not comply with these terms.
*Correspondence: Hui Liu, aHVpLmxpdUB1bmktYnJlbWVuLmRl; Ahmad Jalal, YWhtYWRqYWxhbEBtYWlsLmF1LmVkdS5waw==