 Iva Radić
1*†
Iva Radić
1*†
 Suzana Blesić
1
†
Suzana Blesić
1
†
 Zdravko Aničić
2
Zdravko Aničić
2
 Sladjan Milanović
1
Sladjan Milanović
1
 Dragan M. Mirkov
2
Dragan M. Mirkov
2
 Olivera M. Knežević
2
Olivera M. Knežević
2
- 1 Institute for Medical Research, University of Belgrade, Belgrade, Serbia
- 2 Faculty of Sport and Physical Education, University of Belgrade, Belgrade, Serbia
Introduction: Human balance control is regulated by complex temporal processes that may be disrupted by injury or increased task difficulty.
Methods: We examined long-range temporal characteristics of force platform recordings during quiet standing in 76 physically active participants with or without lower-limb injury, and in 13 non-injured participants standing with eyes closed or on one leg. Detrended fluctuation analysis (DFA) and wavelet transform spectral analysis (WTS) were used to quantify the temporal dynamics of postural control.
Results: All recordings showed long-range autocorrelated behavior, with a visible crossover point separating random fluctuations at small time scales from structured dynamics at higher time scales (100 ms to 1 s). Changes in scaling behavior occurred only above the crossover point in response to altered stance or injury. Specifically, standing on one leg increased DFA and WTS slopes, likely due to enhanced amplitudes of characteristic peaks at approximately 250 ms and 650 ms. Two distinct postural responses to injury emerged: (1) compensation - characterized by increased amplitudes of all high-scale WTS modes and a crossover shift to smaller scales; and (2) underachievement - marked by decreased amplitudes and a shift of the crossover to larger time scales.
Discussion: These findings support the potential of DFA, WTS, and similar time series techniques as sensitive tools for assessing subtle impairments in postural control.
1 Introduction
Participation in sports or recreational activities, besides the apparent health-related benefits, is also associated with a high risk of injuries, particularly in professional athletes (Emery and Pasanen, 2019). Most sport-related injuries are muscular or skeletal, affecting soft tissue, bones, ligaments, and nerves, thus reducing performance by causing muscle imbalances and asymmetries (Gimigliano et al., 2021). Although the type and intensity of muscle or motor capacity reduction depend on the type and severity of the injury, almost all of them affect the ability of athletes to maintain proper postural stability and balance. Since maintaining balance consists of movements around the ankle, knee, and hip joints and is regulated by the harmonized activity of corresponding muscles, injury, or reduction in the capacity of any of these muscles, can potentially affect the ability to control the balance efficiently (Panjan and Sarabon, 2010).
In general, balance can be considered locally as the ability of muscles to maintain equilibrium around single joints, or generally as the ability of body parts or of the overall body to achieve and maintain some steady state (Panjan and Sarabon, 2010; Winter, 1995). It can be described as static when the goal is to maintain the center of gravity (CoG) within the base of support with minimum movement, or dynamic when the task is to keep the stable position while performing given movements or tasks (Winter et al., 1990; Ricotti, 2011). Therefore, most of the methods used to assess balance have been focused on the trajectory of CoG, based on the idea that its variability is closely related to the ability to control the CoG over the base of support (Błaszczyk, 2016).
Thus, tests aimed to assess balance are usually based on tasks that challenge the control of CoG over the base of support while standing still on both legs and/or on one leg. Different approaches are used to quantify the amount, variation, and direction of the body sway (movement of CoG) or weight distribution between the legs (for a more detailed description of tests and derived variables please see (Panjan and Sarabon, 2010)). The rationale for assessment of balance as a part of performance examination among populations of athletes is based on the presumption that good balance represents one of the main prerequisites of an efficient athletic performance, but also on the fact that among other factors, good balance depends on the efficient synergistic action of the involved muscles (Behm and Anderson, 2006; Hrysomallis, 2011; Zemková, 2014).
In recent years, technological advances in rehabilitation—such as robotic-assisted systems, virtual reality environments, and wearable sensor technologies—have shown considerable promise in promoting motor recovery, particularly within gait training protocols (Ciobanu et al., 2018). While these approaches primarily target locomotor function, similar principles are increasingly being applied to postural balance rehabilitation, which remains the central focus of the present study.
Movements of the body or its CoG are nowadays most commonly measured on a force platform which measures the center of pressure (CoP) of the whole human body (Panjan and Sarabon, 2010). Records from a force platform are by nature complex outputs of fluctuating internal (body) drivers acting on different time scales. As such, they have been proven to be stochastic and long-range autocorrelated (Collins and De Luca, 1994), as are many other physiological records (Blesić et al., 1999; Milošević et al., 2002; Blesic et al., 2011; Stanley et al., 1999; Hausdorff et al., 2001; Wayne et al., 2013). In this paper, we examined long-range features of force platform data in quiet standing with or without injury, and in non-injured standing with eyes closed and on one leg only. To achieve this, we used the detrended fluctuation analysis (DFA) and the wavelet transform spectral analysis (WTS). DFA and WTS were applied to quantify the temporal dynamics of force platform data scaling exponents and characteristic times from their spectral decomposition, and to show how those parameters change with task or injury. It was already shown before that such time series parameters may provide a complementary and, in some instances, more sensitive and discriminating metric (compared to classical approaches) for characterizing human posture, and may serve as new indicators of change (Wayne et al., 2014).
The stochasticity of human quiet standing and in associated tasks or disorders has been assessed before (Collins and De Luca, 1994; Wayne et al., 2013; Wayne et al., 2014; Duarte and Zatsiorsky, 2001; Shimzu et al., 2002; Chagdes et al., 2009; Kirchner et al., 2012; Maze et al., 2016). Assessments of monofractal (including DFA) CoP characteristics of human postural sway have found that force platform recordings of quiet standing exhibit scaling behaviour, with crossovers in scaling and non-stationary dynamics (manifested, in the case of DFA scaling, in values of scaling exponents larger than 1) on time scales larger than 1 s (Collins and De Luca, 1994; Duarte and Zatsiorsky, 2001). To manage found data non-stationarity some of these researches additionally analysed time series of force platform increments (Kirchner et al., 2012), thus examining a more stationary data, or adopted the hypothesis that observed range of DFA exponents is within the range of error of the 1/f noise (Duarte and Zatsiorsky, 2001). Both DFA and spectral analysis of standing data found the crossover in CoP scaling to be in the time range between 10 ms and 1 s (Duarte and Zatsiorsky, 2001; Kirchner et al., 2012; Collins et al., 1995). It was shown that the position of the crossover changes with experimental conditions (such as standing with eyes closed or open), or with age (Kirchner et al., 2012). Additionally, studies have demonstrated that both monofractal and multifractal features of human quiet standing changed with training (Wayne et al., 2014), in the presence of balance disorders and pathologies (Maze et al., 2016), or with task and age (Chagdes et al., 2009). Finally, systematic assessments of surrogate data proved that the observed CoP behaviour was not a result of any feature of the methods used: DFA exponents of the shuffled surrogate sequences were around 0.5 for all subjects and conditions (Blesić et al., 1999; Kirchner et al., 2012). Namely, since all long-range correlations are destroyed by the shuffling procedure, the corresponding shuffled series will have scaling exponents of the random time series (Kantelhardt et al., 2001).
In this paper, we analysed recordings from two force platforms, to assess balance dynamics for each leg separately (Harrison et al., 2021). Due to the length of the recordings and constrains on data analysis posed by the finite size effects (see Data and Methods below), we analysed DFA and WTS features of time series in our dataset in time ranges of 2 ms to 1 s (or 1–500 Hz). This gave us insight into scaling behaviour in lower ranges of time scales compared to those reported in the literature to date (Duarte and Zatsiorsky, 2001; Kirchner et al., 2012). The inclusion of WTS analysis in our approach enabled identification of characteristic spectral (temporal) modes that constitute human posture in this time range.
Building on this methodological framework, the main motivation for this study is to enhance our understanding of how injuries and altered standing tasks affect the temporal dynamics of balance control in physically active individuals. Despite extensive existing research, the precise changes in balance control mechanisms following injury, as well as during challenging balance tasks, are not fully understood, particularly regarding the underlying temporal structure of postural sway.
Therefore, the specific aims of this study were: 1. To characterize and quantify the temporal scaling behavior of balance control signals (force platform data) using advanced time series analytical methods, namely, Detrended Fluctuation Analysis (DFA) and Wavelet Transform Spectral (WTS) analysis. 2. To identify how specific conditions (standing with eyes closed, standing on one leg only) and injuries (to the knee or ankle) alter the scaling dynamics, particularly focusing on long-range temporal correlations and characteristic spectral modes of sway.
We hypothesized that: 1. Changes in balance tasks (such as eyes-closed and single-leg stance) would lead to distinct alterations in scaling exponents and characteristic spectral peaks, indicative of modified neuromuscular control strategies. 2. Injuries to the lower extremities would result in identifiable patterns of compensation or underachievement in postural control, reflected through significant changes in the long-range temporal characteristics and spectral modes in the force platform data.
The findings from testing these hypotheses aim to demonstrate that DFA and WTS analyses could serve as more sensitive and informative tools for clinical assessments, rehabilitation monitoring, and injury prevention strategies by identifying subtle but significant shifts in balance control mechanisms that are typically undetected by conventional measures.
This paper is organized as follows: in the following section we provide essential information on experimental settings and participants to our experiments, together with a brief introduction to the two methods of time series analysis used. In the third section we describe our results. In the final section we provide discussion of our findings and propose directions for future research.
2 Materials and methods
2.1 Participants
Data from 93 physical active participants - 49 females (body weight 64 ± 7 kg; body height 174 ± 8 cm; age 22 ± 5) and 44 males (body weight 81 ± 8 kg; height 185 ± 7 cm; age 24 ± 2), were analysed in this study. All participants were physically active through their academic curriculum, which included approximately six to eight physical activity classes per week. Participants were free of any muscle-skeletal or neurological disease and had not taken any medications for at least 6 months prior to study participation. They were instructed to avoid any strenuous exercise for 2 days before the testing sessions. Prior to testing, participants were informed about the research purpose and procedures and provided written informed consent which was in accordance with the Declaration of Helsinki and approved by the University of Belgrade Institutional Review Board (02-273/21-1). Participants’ characteristics are summarized in Table 1. As part of the individual data collection, participants reported any history of knee, ankle, or other lower extremity injury.
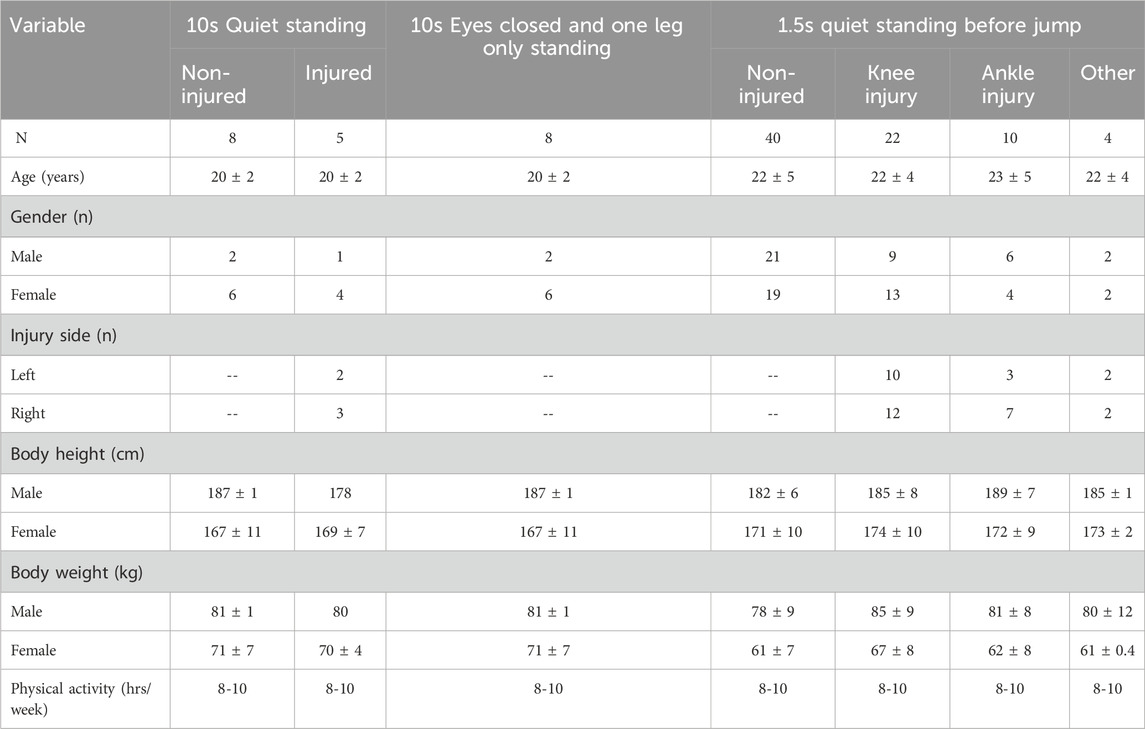
Table 1. Characteristics of participants of standing recording.
2.2 Experimental procedures
Participants were instructed to stand still on two force platforms (AMTI BP600400, Advanced Mechanical Technology, Inc. Watertown, MA 02472–4800 United States) that sampled the horizontal (x and y) and vertical (z) components of the resultant ground reaction force at 1,000 Hz, separately for each leg. In the first experimental setting, 13 non-injured participants were required to perform three tasks that involved: 1) quiet standing with eyes open, 2) quiet standing with eyes closed, and 3) one-leg standing with arms relaxed (please see Table 1). After assuming the requested position, the task lasted for 10 s. A minute rest was given between the trials while rests between different tasks lasted 2 min.
In another set of experiments, 76 participants (see Table 1) were instructed to stand still on two force platforms for 2 s, as explained above, as an introduction to the countermovement jump exercise. The initial 1.5-s segments of the quiet standing from this experiment were used for time series analysis in this paper.
2.3 Data analysis
We used the detrended fluctuation analysis of the second order (DFA2) and wavelet transform spectral analysis (WTS) to investigate our data dynamics.
Detrended fluctuation analysis is a variant of a conventional fluctuation analysis, adapted for the analysis of non-stationary, non-linear data (Peng et al., 1994). In DFA, a fluctuation function
The DFA method proved to be more stable than the conventional autocorrelation (ACF) or Fourier power spectra (PwS) analyses, with less noise and less pronounced finite-size effects (Bunde and Lennartz, 2012). It was shown in numerous repeated applications (Blesić, 2020), that due to the inherent power-law data dynamics in most of the real-world records - physiological and movement data included (Blesic et al., 2011) -
The advantages of using DFA and WTS over the more conventional statistical approaches (such as the calculation of Fourier power spectra) for the analysis of records from natural complex systems, including characterization of effects of tracking injuries are manyfold, and stem from the methods design (please see (Blesić et al., 2019) and references therein). The DFA, by way of detrending as preprocessing, produces a time series that fluctuates much less than the original, while preserving its statistical properties (Stanley, 2000). In this way it partially resolves the problem of direct calculations of the Fourier power spectra that are hindered by the level of noise present in a typical natural record (please see Figure 1B below). In this way DFA method provides a function that is allowing for clearer and less noisy presentation and interpretation of the results on log–log graphs.
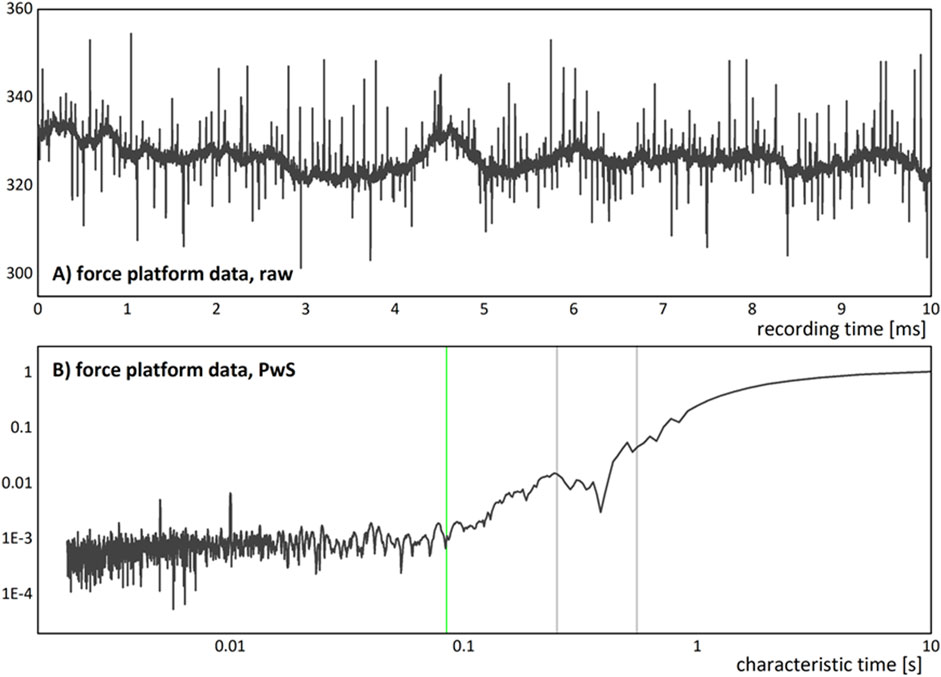
Figure 1. (A) An example of a force platform recording in quiet standing, of a z-axis (vertical direction) variations of the right leg. This raw data example shows noisy behaviour with visible multimodal variability (quasi harmonic behaviour of the low frequency underlying trend) which is present in all records in our dataset. (B) Log-log plot of Fourier power spectrum of the record in (A), given as dependence of PwS on the characteristic time scale. The PwS presents with a possible crossover that is marked by a vertical green line, and two peaks after the crossover, at 250 and at around 550 ms, that are marked by the vertical light grey lines.
Furthermore, pure long-range autocorrelated behavior rarely occurs in natural records. The corresponding DFA2 functions, depicted on the log–log graphs, tend to display transient crossovers in scaling that stem from occurrences of different intrinsic drivers of the analyzed behaviour (Blesić et al., 2019). When the effects of such irregularities are visible on DFA2 curves but are not comparatively strong to change the global behavior of DFA2 functions. We then use WT analysis to investigate them.
The wavelet transformation method was introduced to achieve signal localization and decomposition in both time and frequency (Wilczok, 2000). This method has been proven to possess the optimal joint time–frequency localization (Torrence and Compo, 1998) and can thus be used to effectively detect locations and spatial distribution of singularities in time series (Mallat and Hwang, 1992). Wavelet transformation is a two-dimensional time or space and scale decomposition of any signal or discrete series with functions constructed by expanding by time scale and translating along real time (or space) of a specifically chosen original wavelet function (Torrence and Compo, 1998). Decomposition along the real time in addition to time scale (analogues to frequency in Fourier analysis) allows for visualisation and inspection of local temporal components of the analysed signal (Torrence and Compo, 1998; Addison, 2018). This enables calculation of the local wavelet power spectra (lWTS), which are the localized contributions of the analysed time series energy at a specific time scale and at specific point in real time. Global wavelet power spectra
To obtain statistically significant results and avoid effects of records' finite sizes on DFA2 statistics we calculated them between the time scales of n = 5 and n = N/5. Similarly, to obtain relevant statistical results for the WTS analysis, we calculated WTS functions between the time scales of n = 1 and n = N/5. In our dataset, with time series length of N = 10,000 data points for 10 s measurements or N = 1,500 for 1.5 s recordings, this limits time range of our investigations to
3 Results
In Figure 1 we present one force platform record in quiet standing used in this study, in the form of raw data (Figure 1A) with their PwS spectrum (Figure 1B) given as a log-log plot of dependence on time scale instead of frequency (so that it could be compared with WTS spectra). The raw data show noisy behaviour with visible multimodal variability of the low frequency underlying trend that is present in all records in our dataset. The PwS spectrum of this record shows possible crossover in power-law (scaling) behaviour at time scales around 100 ms, with the probable existence of at least two peaks at the higher time scales, after the crossover.
In Figure 2 we present a typical result from our DFA2 and WTS analysis of standing still on a force platform data, for an individual who did not report recent injuries (from this point on, the ‘non-injured’ record or case). In all the force platform records that we analysed we found that DFA2 curves, as those depicted in Figure 2A, are approximately straight lines on log–log graphs. The scaling that we observed always exhibited crossover at timescales in the range of 50–100 ms, with scaling exponents below the crossover α1 equal to 0.5 (or
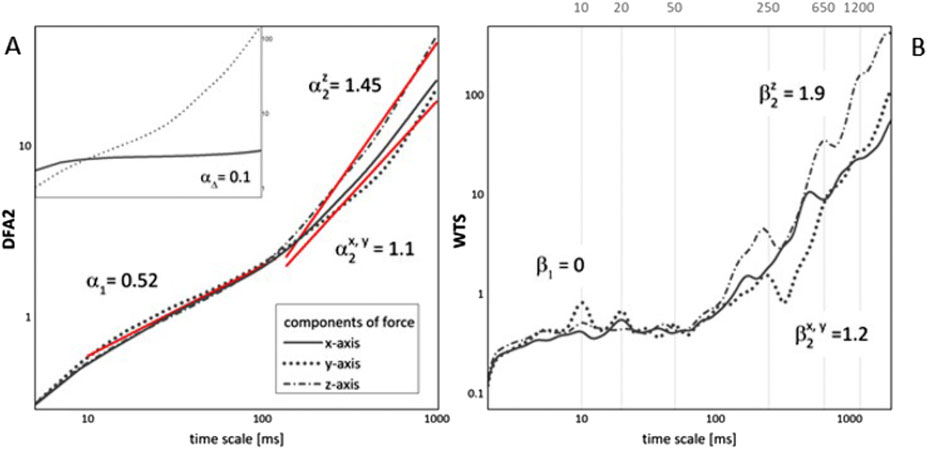
Figure 2. (A) DFA2 and (B) WTS functions of a typical non-injured record in standing, for one (right) leg and all three axes. In (A) slopes of DFA2 functions are given as red lines, with values of corresponding DFA2 exponents. Those are the same for all three axes below the crossover and are different for horizontal and vertical plain above the crossover. In the inset to (A) result of the DFA2 analysis for a series of increments (solid line) for z-axis are given in comparison to DFA2 result of the original series (dotted line), together with DFA2 exponent
The results of the global WTS analysis of a typical non-injured record, given in Figure 2B, show that WTS functions displayed existence of several characteristic peaks, or characteristic times of recorded behaviour, at 10, 20 and 50 ms in time ranges below the crossover point, and at around 250, 650 and 1200 ms, in higher time scales area. The amplitudes of WTS peaks were always more pronounced on z-axis than on the x- and y-axis. In addition, the scaling (DFA2 and WTS slopes) on x- and y-axis was always the same (within the range of error), which prompted us to focus on y- and z-axis only in our further analysis, assuming no loss of insight if we were to represent movements in horizontal plain by y-axis only.
To test how this behaviour changes with the loss of balance due to task or injury, we analysed several recordings of individuals who were not reporting injury and were standing on the force platform with their eyes closed and on one leg only, and of persons who reported injuries before or at the time of recording (data called ‘eyes closed’, ‘only right/left leg’, and ‘injured’ in what follows). Results of these analyses are shown in Figure 3, where the DFA2 and WTS functions for these different cases are given in comparison with the non-injured (and eyes open) record. Typical DFA2 results, presented in Figure 3A1,B1,C1, show clear change in the behaviour in non-injured standing on one leg and in cases of injury to one of the legs, in the higher time scales region, above the crossover point. There it is visible that the slopes of the DFA2 functions increase for both axes on the used-for-standing leg, when standing on one leg only (see Figure 3B1), or in the case of both axes for the uninjured (opposite) leg, and sometimes vertical (z-) axis for the leg with the reported injury (see Figure 3C1). DFA2 curves for the typical case of standing with eyes closed (Figure 3A1) do not show significant (within the range of error) change of slopes in comparison with the ‘eyes open’ case. Nevertheless, corresponding global WTS functions, shown in Figure 3A2,B2,C2, do show that even when DFA2 dynamics is unchanged, in the ‘eyes closed’ cases, the characteristic WTS peaks become more prominent in both small- and higher-time scales, while in cases of standing on one leg only or in cases of injury some of the peaks in the region above the crossover become increasingly prominent, and cause the observed significant change of the DFA2 and WTS slopes. It is also visible from Figure 3B2,C2 that the change of slopes (and thus the scaling) is caused by changes of amplitude of different characteristic temporal modes: for standing on one leg only (see Figure 3B2) significant change stems from increased amplitudes of peaks at around 250 and 650 ms, while in the case of injury given in Figure 3C2 the change is caused by activation of all the higher modes, including those larger than 1200 ms. Finally, it is visible from both DFA2 and WTS results how positions of crossovers shift to smaller time scales in all cases.
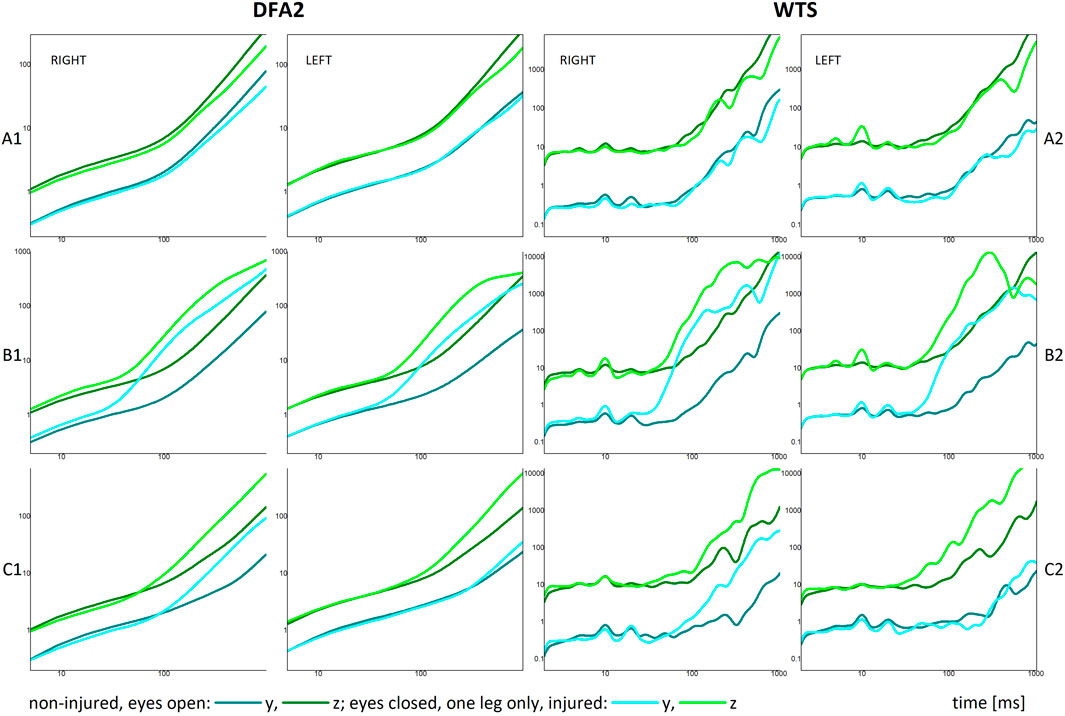
Figure 3. DFA2 and global WTS functions for three test conditions: (A1,A2) represent a non-injured person standing with eyes closed (compared to the eyes-open baseline); (B1,B2) show results for a non-injured person standing on one leg only (right or left leg); and (C1,C2) show results for a person with an injury to the left knee. Panels (A1,B1,C1) display DFA2 functions, while (A2,B2,C2) show the corresponding WTS functions.
Of all the different settings presented in Figure 3, we further investigated how different kinds of injuries affect DFA2 and WTS results for force platform data. To this end, we analysed 29 records of upright standing in preparation for countermovement jump, in individuals who reported recent or current (related to the time of recording) injury to one leg. We compared their DFA2 and WTS results with the average DFA2 and WTS behaviour (that is, values of average slopes
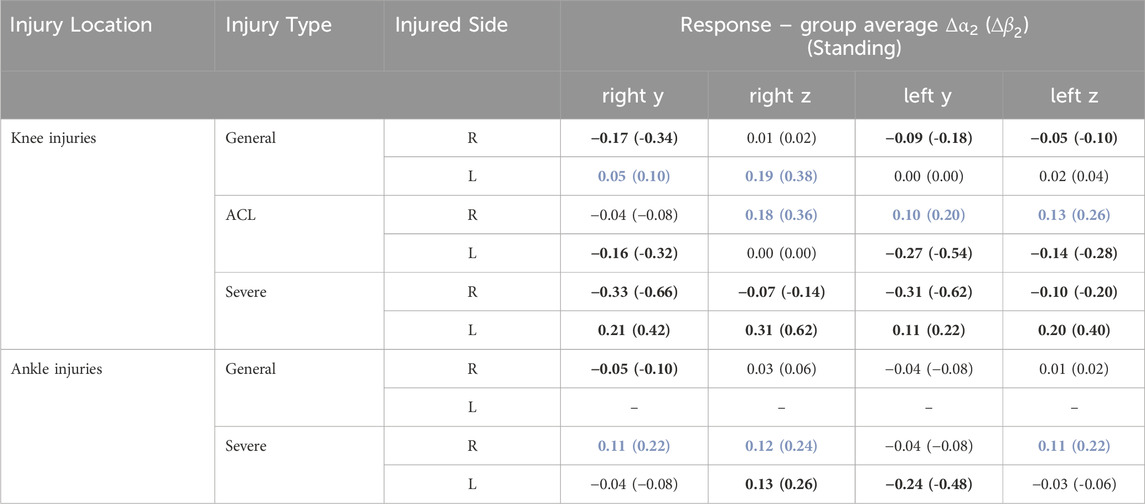
Table 2. Values of the difference Δα2 of the DFA2 slopes above the crossover point averaged over groups of data differentiated by the type of injury, given with the values of
In Table 2 injuries of the knee are differentiated as ‘general’, in cases where we did not have specification of the types of injury, ‘ACL’, and ‘severe’ (such as dislocation or tear). It is important to note here that due to the small sample size all the reported statistics in Table 2 were calculated for 2–5 separate records in any injury groups and is thus generally poor; we present it only as a report, not as an indicator of any causation or statistical significance, and thus we are presenting just values averaged over the groups, without any error measurement. The only error that is presented here is the error to the DFA2 calculation that is due to the size of the data series
All knee injuries in our sample show the similar kind of behaviour as the one depicted in Figure 3C2: the injury of one leg can lead to what we labelled ‘compensation’, or pronounced engagement of muscle groups or movement regimes that results in increased values of scaling exponents
Examples of WTS functions of the ‘compensation’ on the opposite leg and ‘underachievement’ on both legs are given in Figure 4. We chose to use WTS functions for this illustration, for WTS functions are giving us access to not only data scaling (slope of the functions), but also characteristic peaks. The positions and the amplitudes of characteristic peaks of WTS functions may thus be used to understand the observed differences in scaling behavior with injury. To enable comparative assessment, we added the corresponding values of WTS exponents differences
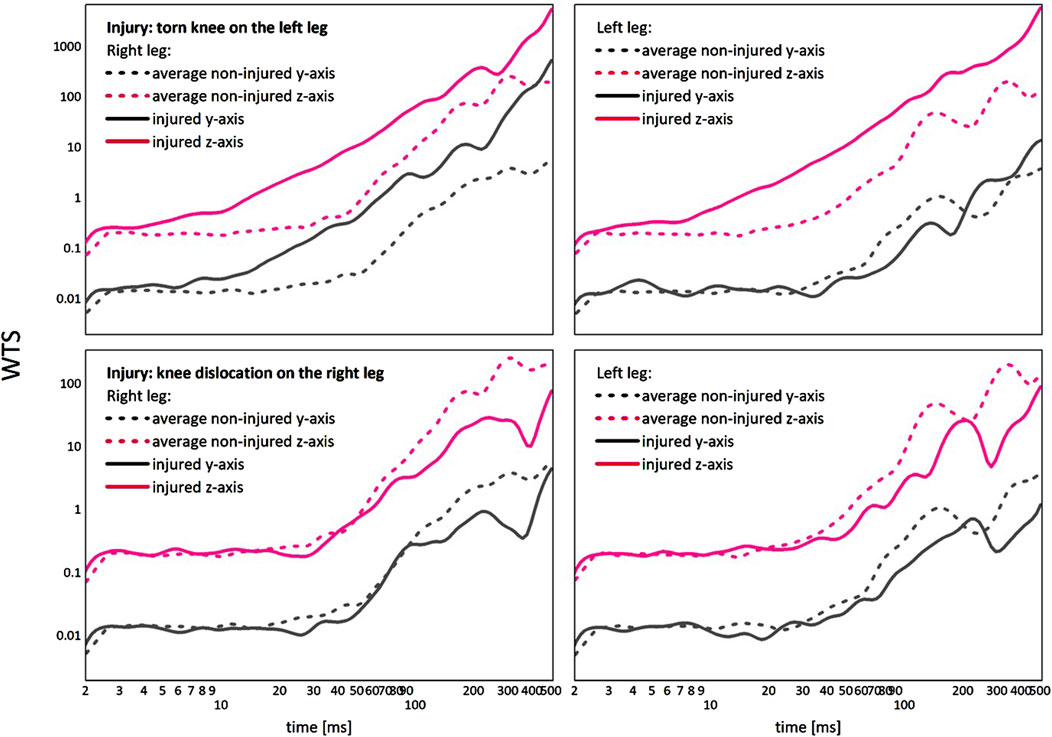
Figure 4. Comparison of “compensation” (upper row) versus the “underachievement” (lower row) behaviour, given as WTS functions in relation to the averaged non-injured WTS dynamics.
4 Discussion
In this paper we analysed time series of force platform recordings of various tasks involving quiet standing, in individuals with or without injury to one leg, using DFA2 and WTS analyses. Our aim was to assess scaling dynamics in our dataset, to identify scaling and characteristic temporal spectral parameters, and to examine how those change in data recorded under different experimental conditions (standing with eyes closed or on one leg only), or with injury. We found scaling behaviour in all our data, with a visible crossover in scaling appearing at about 100 ms in non-injured quiet standing, a random behaviour on small time scales and a distinct non-linearity in long-term autocorrelated behaviour after the crossover area, on time scales in the range of 100 ms to 1 s. This result agrees with previous findings on CoP scaling (Collins and De Luca, 1994; Duarte and Zatsiorsky, 2001; Kirchner et al., 2012), in ranges of time scales where our research overlaps with the other groups. From WTS analysis we identified several characteristic peaks in scaling behaviour, at 10, 20 and 50 ms in the area below the crossover point, and at about 250, 650 and 1,200 ms in the area above the crossover. The characteristic modes that we found on higher time scales align with the frequency bands of the identified major modal scales around 3.03, 1.51 and 0.76 Hz in (Harrison et al., 2021) that were chosen as behaviourally relevant and not obscured by the measurement noise there. We distinguished found DFA2 exponents and WTS characteristic peaks as key parameters of our analysis.
Under the changes in experimental conditions or in injury to one leg, we found that only the scaling above crossover changes, while random behaviour below the crossover remains unchanged. In the case of standing with eyes closed we reported changes in the amplitudes of the characteristic peaks in both small scales and higher scales area that did not however led to change in the DFA2 slopes
Probably the most important finding of this paper is that DFA2 and WTS can distinguish injuries even in quiet standing, which corroborates claims that these and similar techniques may provide new, more sensitive discriminatory analysis framework for human balance assessments (Wayne et al., 2013; Wayne et al., 2014). We found two main types of response to injury: a) ‘compensation’, seen as the increase in the value of
From our results it appears that the change of scaling in the horizontal plane is more discriminative to the injury type than the response in the vertical plane. It is important to note here that we chose to assess postural dynamics of all three axes separately for we showed in our previous work that the process of summation (such as determination of CoP) superposes different scaling and modal characteristics of the added signals, resulting in a DFA2 and WTS outputs dominated by the signals exhibiting higher autocorrelations (Blesić et al., 2019). It is already known that postural stability could be greatly impaired with respect to injury or illness (Błaszczyk, 2016; Staples et al., 2020; Miko et al., 2021); for example, anterior cruciate ligament reconstructed individuals have greater postural instability during the dual-cognitive condition that may indicate unique neural processing deficits remain following ACL reconstruction (Miko et al., 2021). Interestingly, similar patterns of postural stability were found before (Bodkin et al., 2018) in comparisons between individuals following ACL reconstruction and healthy individuals in a straight knee single leg balance task. That study concluded (Bodkin et al., 2018) that single-leg balance in a straight knee position may not be sensitive enough to detect impairments in ACL reconstruction patients at the time of return to sport progression. Although our injured participants had various lower-limb injuries, our study suggest that change of scaling could be sensitive enough to detect altered postural-control patterns.
Recent studies corroborate our findings: wavelet-based and nonlinear metrics capture subtle balance impairments during rehabilitation and sensory manipulations (Jafari et al., 2023; Czaplicki et al., 2017; Kodama et al., 2022; Piri et al., 2025).
Although formal clinical thresholds for DFA or WTS metrics do not yet exist, prior studies (e.g. (Duarte and Zatsiorsky, 2001; Kirchner et al., 2012; Maze et al., 2016)), have demonstrated that scaling exponents (α2) and wavelet power distributions differ systematically between healthy and pathological conditions, aging, and different task demands. This suggests that DFA and WTS have the potential to serve as sensitive, non-invasive tools in clinical settings for detecting subtle impairments in postural control. However, defining normative ranges and pathological cutoffs will require future studies.
Finally, our results do not settle the debate about the nature and origins of non-stationarity in force platform data. This remains to be further examined with access to longer time series (recordings) and/or utilization of various non-linearity tests. In that regard, a test of autocovariance difference (Höll et al., 2016) to assess whether values of
4.1 Limitations
This study has several limitations. First, the duration of some force platform recordings was limited to 1.5 s, which may restrict the detection of lower-frequency sway dynamics and long-range scaling behavior. Studies suggest that shorter trial durations may not provide stable or reliable measurements of postural control, particularly for certain parameters sensitive to low-frequency sway. Longer trials, typically ranging from 60 to 150 s, are recommended to ensure the stability and reliability of posturographic assessments (Richmond et al., 2023; Amoud et al., 2007).
Second, injury data were obtained via self-report, introducing potential recall and classification bias. While this method is commonly used in sports and epidemiological research due to its practicality (Fuller et al., 2006), it may not accurately capture the precise timing, type, or severity of injury. Future studies by us or by other groups should aim to incorporate clinically verified diagnoses and longitudinal tracking to improve the accuracy of injury classification and its relationship with postural control adaptations (Fuller et al., 2006).
Finally, the most critical limitation lies in the small sample sizes within injury subgroups (n = 2–5), which limited the statistical power of group comparisons and precluded formal statistical significance testing or effect size estimation. As a result, we focused on descriptive findings and qualitative distinctions revealed through DFA and WTS methods, which remain sensitive to subtle alterations in balance control. While we fully acknowledge the importance of statistical measures in strengthening the validity of conclusions, reporting them under such constraints could be misleading. We have explicitly noted this limitation in the manuscript and emphasized the need for future studies with larger and clinically validated cohorts. Such research would enable more rigorous statistical evaluation and support broader generalization of our findings.
Data availability statement
The original contributions presented in the study are included in the article/supplementary material, further inquiries can be directed to the corresponding author.
Ethics statement
The studies involving humans were approved by University of Belgrade, Faculty of Sport and Physical Education, Belgrade, Serbia. The studies were conducted in accordance with the local legislation and institutional requirements. The participants provided their written informed consent to participate in this study.
Author contributions
IR: Conceptualization, Data curation, Formal Analysis, Funding acquisition, Investigation, Writing – review and editing. SB: Conceptualization, Formal Analysis, Funding acquisition, Investigation, Methodology, Project administration, Software, Supervision, Validation, Visualization, Writing – original draft, Writing – review and editing. ZA: Data curation, Formal Analysis, Funding acquisition, Writing – review and editing. SM: Funding acquisition, Methodology, Resources, Visualization, Writing – review and editing. DM: Conceptualization, Funding acquisition, Resources, Software, Validation, Writing – review and editing. OK: Conceptualization, Formal Analysis, Funding acquisition, Project administration, Resources, Software, Supervision, Validation, Writing – review and editing.
Funding
The author(s) declare that financial support was received for the research and/or publication of this article. Serbian Scientific Research Fund grants no 451-03-9/2022-14/200015 and 451-03-68/2022-14/200154.
Acknowledgments
This work was funded by the Serbian Scientific Research Fund grants no. 451-03-9/2022-14/200015 (AP, SB, SM) and 451-03-68/2022-14/200154 (ZA, DM, OK). Wavelet software is modified from C. Torrence and G. Compo, available at URL: http://atoc.colorado.edu/research/wavelets/.
Conflict of interest
The authors declare that the research was conducted in the absence of any commercial or financial relationships that could be construed as a potential conflict of interest.
Generative AI statement
The author(s) declare that no Generative AI was used in the creation of this manuscript.
Publisher’s note
All claims expressed in this article are solely those of the authors and do not necessarily represent those of their affiliated organizations, or those of the publisher, the editors and the reviewers. Any product that may be evaluated in this article, or claim that may be made by its manufacturer, is not guaranteed or endorsed by the publisher.
References
Addison, P. S. (2018). Introduction to redundancy rules: the continuous wavelet transform comes of age. Philos. Trans. R. Soc. A Math. Phys. Eng. Sci. 376, 20170258. doi:10.1098/rsta.2017.0258
Amoud, H., Abadi, M., Hewson, D. J., Michel-Pellegrino, V., Doussot, M., and Duchêne, J. (2007). Fractal time series analysis of postural stability in elderly and control subjects. J. Neuroeng Rehabil. 4, 12. doi:10.1186/1743-0003-4-12
Bashan, A., Bartsch, R., Kantelhardt, J. W., and Havlin, S. (2008). Comparison of detrending methods for fluctuation analysis. Phys. A Stat. Mech. its Appl. 387, 5080–5090. doi:10.1016/j.physa.2008.04.023
Behm, D. G., and Anderson, K. G. (2006). The role of instability with resistance training. J. Strength Cond. Res. 20, 716–722. doi:10.1519/R-18475.1
Błaszczyk, J. W. (2016). The use of force-plate posturography in the assessment of postural instability. Gait Posture 44, 1–6. doi:10.1016/j.gaitpost.2015.10.014
Blesić, S. (2020). Applications of statistical physics to study climate phenomena and contribute to overall adaptation efforts(a). Europhys. Lett. 132, 20004. doi:10.1209/0295-5075/132/20004
Blesic, S., Maric, J., Dragasevic, N., Milanovic, S., Kostic, V., and Ljubisavljevic, M. (2011). Scaling analysis of bilateral hand tremor movements in essential tremor patients. J. Neural Transm. 118, 1227–1234. doi:10.1007/s00702-011-0581-1
Blesić, S., Milošević, S., Stratimirović, D. J., and Ljubisavljević, M. (1999). Detrended fluctuation analysis of time series of a firing fusimotor neuron. Phys. A Stat. Mech. its Appl. 268, 275–282. doi:10.1016/S0378-4371(99)00110-7
Blesić, S., Zanchettin, D., and Rubino, A. (2019). Heterogeneity of scaling of the observed global temperature data. J. Clim. 32, 349–367. doi:10.1175/JCLI-D-17-0823.1
Bodkin, S. G., Slater, L. V., Norte, G. E., Goetschius, J., and Hart, J. M. (2018). ACL reconstructed individuals do not demonstrate deficits in postural control as measured by single-leg balance. Gait Posture 66, 296–299. doi:10.1016/j.gaitpost.2018.06.120
Bunde, A., and Lennartz, S. (2012). Long-term correlations in Earth sciences. Acta Geophys. 60, 562–588. doi:10.2478/s11600-012-0034-8
Carbone, A. (2009). “Detrending moving average algorithm: a brief review,” in IEEE Toronto International Conference Science and Technology for Humanity (Toronto, ON. Canada: IEEE). doi:10.1109/TIC-STH.2009.5444412
Chagdes, J. R., Rietdyk, S., Haddad, J. M., Zelaznik, H. N., Raman, A., Rhea, C. K., et al. (2009). Multiple timescales in postural dynamics associated with vision and a secondary task are revealed by wavelet analysis. Exp. Brain Res. 197, 297–310. doi:10.1007/s00221-009-1915-1
Chen, Z., Ivanov, P. C., Hu, K., and Stanley, H. E. (2002). Effect of nonstationarities on detrended fluctuation analysis. Phys. Rev. E 65, 041107. doi:10.1103/PhysRevE.65.041107
Ciobanu, I., Stanculescu (Badea, D. I., Iliescu, A., Popescu, A. M., Seiciu, P. L., Mikolajczyk, T., et al. (2018). The usability pilot study of a mechatronic system for gait rehabilitation. Procedia Manuf. 22, 864–871. doi:10.1016/j.promfg.2018.03.122
Collins, J. J., and De Luca, C. J. (1994). Random walking during quiet standing. Phys. Rev. Lett. 73, 764–767. doi:10.1103/PhysRevLett.73.764
Collins, J. J., De Luca, C. J., Burrows, A., and Lipsitz, L. A. (1995). Age-related changes in open-loop and closed-loop postural control mechanisms. Exp. Brain Res. 104, 480–492. doi:10.1007/BF00231982
Czaplicki, A., Kuniszyk-Jozkowiak, W., Jaszczuk, J., Jarocka, M., and Walawski, J. (2017). Using the discrete wavelet transform in assessing the effectiveness of rehabilitation in patients after ACL reconstruction. Acta Bioeng. Biomech. 19, 139–146. doi:10.5277//ABB-00749-2016-02
Duarte, M., and Zatsiorsky, V. M. (2001). Long-range correlations in human standing. Phys. Lett. Sect. A Gen. A. T. Solid State Phys. 283, 124–128. doi:10.1016/S0375-9601(01)00188-8
Emery, C. A., and Pasanen, K. (2019). Current trends in sport injury prevention. Best. Pract. Res. Clin. Rheumatol. 33, 3–15. doi:10.1016/j.berh.2019.02.009
Fuller, C. W., Ekstrand, J., Junge, A., Andersen, T. E., Bahr, R., Dvorak, J., et al. (2006). Consensus statement on injury definitions and data collection procedures in studies of football (soccer) injuries. Br. J. Sports Med. 40, 193–201. doi:10.1136/bjsm.2005.025270
Gimigliano, F., Resmini, G., Moretti, A., Aulicino, M., Gargiulo, F., Gimigliano, A., et al. (2021). Epidemiology of musculoskeletal injuries in adult athletes: a scoping review. A Scoping Rev. Med. 57, 1118. doi:10.3390/medicina57101118
Harrison, S. J., Kinsella-Shaw, J. M., and Dotov, D. (2021). Effects of footedness and stance asymmetry confirm an inter-leg metastable coordination dynamics of standing posture. J. Mot. Behav. 53, 135–156. doi:10.1080/00222895.2020.1740151
Hausdorff, J. M., Ashkenazy, Y., Peng, C. K., Ivanov, P. C., Stanley, H. E., and Goldberger, A. L. (2001). When human walking becomes random walking: fractal analysis and modeling of gait rhythm fluctuations. Phys. A Stat. Mech. its Appl. 302, 138–147. doi:10.1016/s0378-4371(01)00460-5
Höll, M., and Kantz, H. (2015). The relationship between the detrended fluctuation analysis and the autocorrelation function of a signal. Eur. Phys. J. B (88), 1–7. doi:10.1140/epjb/e2015-60721-1
Höll, M., Kantz, H., and Zhou, Y. (2016). Detrended fluctuation analysis and the difference between external drifts and intrinsic diffusionlike nonstationarity. Phys. Rev. E 94, 042201. doi:10.1103/PhysRevE.94.042201
Hrysomallis, C. (2011). Balance ability and athletic performance. Sport Med. 41, 221–232. doi:10.2165/11538560-000000000-00000
Jafari, H., Gustafsson, T., Nyberg, L., and Röijezon, U. (2023). Predicting balance impairments in older adults: a wavelet-based center of pressure classification approach. Biomed. Eng. Online 22, 83. doi:10.1186/s12938-023-01146-3
Kantelhardt, J. W. (2009). “Fractal and multifractal time series,” in Encyclopedia of complexity and systems science (New York, NY: Springer New York), 3754–3779. doi:10.1007/978-0-387-30440-3_221
Kantelhardt, J. W., Koscielny-Bunde, E., Rego, H. H. A., Havlin, S., and Bunde, A. (2001). Detecting long-range correlations with detrended fluctuation analysis. Phys. A Stat. Mech. its Appl. 295, 441–454. doi:10.1016/S0378-4371(01)00144-3
Kantelhardt, J. W., Koscielny-Bunde, E., Rybski, D., Braun, P., Bunde, A., and Havlin, S. (2006). Long-term persistence and multifractality of precipitation and river runoff records. J Geophys Res Atmos 111, 111. doi:10.1029/2005JD005881
Kirchner, M., Schubert, P., Schmidtbleicher, D., and Haas, C. T. (2012). Evaluation of the temporal structure of postural sway fluctuations based on a comprehensive set of analysis tools. Phys. A Stat. Mech. its Appl. 391, 4692–4703. doi:10.1016/j.physa.2012.05.034
Kodama, K., Yasuda, K., Akatsuka, T., Kuznetsov, N. A., and Iwata, H. (2022). The influence of a vibrotactile biofeedback system on postural dynamics during single-leg standing in healthy older adults. Neurosci. Lett. 786, 136807. doi:10.1016/j.neulet.2022.136807
Livina, V., Ashkenazy, Y., Kizner, Z., Strygin, V., Bunde, A., and Havlin, S. (2003). A stochastic model of river discharge fluctuations. Phys. A Stat. Mech. its Appl. 330, 283–290. doi:10.1016/j.physa.2003.08.012
Mallat, S., and Hwang, W. L. (1992). Singularity detection and processing with wavelets. IEEE Trans. Inf. Theory. 38, 617–643. doi:10.1109/18.119727
Maze, F., Blázquez-Tejada, M., and Rojas Ruiz, F. (2016). Exploring body sway to disclose changes in postural control strategy associated with proprioceptive training. Eur. J. Hum. Mov. 37, 1–20.
Miko, S. C., Simon, J. E., Monfort, S. M., Yom, J. P., Ulloa, S., and Grooms, D. R. (2021). Postural stability during visual-based cognitive and motor dual-tasks after ACLR. J. Sci. Med. Sport 24, 146–151. doi:10.1016/j.jsams.2020.07.008
Milošević, S., Blesić, S., and Stratimirović, D. J. (2002). Beneficial randomness of signals in a neuronal circuit. Phys. A Stat. Mech. its Appl. 314, 43–52. doi:10.1016/S0378-4371(02)01184-6
Panjan, A., and Sarabon, N. (2010). Review of methods for the evaluation of human body balance. Sport Sci. Rev. 19, 19. doi:10.2478/v10237-011-0036-5
Peng, C. K., Buldyrev, S. V., Goldberger, A. L., Havlin, S., Sciortino, F., Simons, M., et al. (1992). Long-range correlations in nucleotide sequences. Nature 356, 168–170. doi:10.1038/356168a0
Peng, C. K., Buldyrev, S. V., Goldberger, A. L., Havlin, S., Simons, M., and Stanley, H. E. (1993). Finite-size effects on long-range correlations: implications for analyzing DNA sequences. Phys. Rev. E 47, 3730–3733. doi:10.1103/physreve.47.3730
Peng, C. K., Buldyrev, S. V., Havlin, S., Simons, M., Stanley, H. E., and Goldberger, A. L. (1994). Mosaic organization of DNA nucleotides. Phys. Rev. E 49, 1685–1689. doi:10.1103/physreve.49.1685
Perrier, V., Philipovitch, T., and Basdevant, C. (1995). Wavelet spectra compared to fourier spectra. J. Math. Phys. 36, 1506–1519. doi:10.1063/1.531340
Piri, M., Malmir, K., Otadi, K., and Shadmehr, A. (2025). Postural stability measures as diagnostic tools for chronic ankle instability: a comprehensive assessment. BMC Sports Sci. Med. Rehabil. 17, 16. doi:10.1186/s13102-025-01064-y
Richmond, S. B., Otto, G., and Dames, K. D. (2023). Characterization of trial duration in traditional and emerging postural control measures. J. Biomech. 147, 111438. doi:10.1016/j.jbiomech.2023.111438
Ricotti, L. (2011). Static and dynamic balance in young athletes. J. Hum. Sport Exerc 6 (6), 616–628. doi:10.4100/jhse.2011.64.05
Shimzu, Y. U., Thurner, S., and Ehrenberger, K. (2002). Multifractal spectra as a measure of complexity in human posture. Fractals 10, 103–116. doi:10.1142/S0218348X02001130
Stanley, H. E. (2000). Exotic statistical physics: applications to biology, medicine, and economics. Phys. A 285, 1–17. doi:10.1016/S0378-4371(00)00341-1
Stanley, H. E., Amaral, L. A. N., Goldberger, A. L., Havlin, S., Ivanov, P., and Peng, C. K. (1999). Statistical physics and physiology: monofractal and multifractal approaches. Phys. A Stat. Mech. its Appl. 270, 309–324. doi:10.1016/s0378-4371(99)00230-7
Staples, J. R., Schafer, K. A., Smith, M. V., Motley, J., Halstead, M., Blackman, A., et al. (2020). Decreased postural control in patients undergoing anterior cruciate ligament reconstruction compared to healthy controls. J. Sport Rehabil. 29 (29), 920–925. doi:10.1123/jsr.2019-0154
Torrence, C., and Compo, G. P. (1998). A practical guide to wavelet analysis. Bull. Am. Meteorol. Soc. 79, 61–78. doi:10.1175/1520-0477(1998)079<0061:apgtwa>2.0.co;2
Wayne, P. M., Gow, B. J., Costa, M. D., Peng, C. K., Lipsitz, L. A., Hausdorff, J. M., et al. (2014). Complexity-based measures inform effects of Tai chi training on standing postural control: cross-Sectional and randomized trial studies. PLoS One 9, e114731. doi:10.1371/journal.pone.0114731
Wayne, P. M., Manor, B., Novak, V., Costa, M. D., Hausdorff, J. M., Goldberger, A. L., et al. (2013). A systems biology approach to studying Tai chi, physiological complexity and healthy aging: design and rationale of a pragmatic randomized controlled trial. Contemp. Clin. Trials 34, 21–34. doi:10.1016/j.cct.2012.09.006
Wilczok, E. (2000). New uncertainty principles for the continuous gabor transform and the continuous wavelet transform. Doc. Math. 5, 207–226. doi:10.4171/dm/79
Winter, D. A. (1995). Human balance and posture control during standing and walking. Gait Posture 3 (3), 193–214. doi:10.1016/0966-6362(96)82849-9
Winter, D. A., Patla, A. E., and Frank, J. S. (1990). Assessment of balance control in humans. Med. Prog. Technol. 16, 31–51.
Winter, D. A., Patla, A. E., Prince, F., Ishac, M., and Gielo-Perczak, K. (1998). Stiffness control of balance in quiet standing. J. Neurophysiol. 80, 1211–1221. doi:10.1152/jn.1998.80.3.1211
Keywords: postural balance, lower extremity injuries, time series analysis, signal processing, scaling analyses
Citation: Radić I, Blesić S, Aničić Z, Milanović S, Mirkov DM and Knežević OM (2025) Quantification of changes in balance control with tasks and injury using detrending methods for time series analysis. Front. Bioeng. Biotechnol. 13:1589072. doi: 10.3389/fbioe.2025.1589072
Received: 07 March 2025; Accepted: 12 June 2025;
Published: 24 June 2025.
Edited by:
Peter A. Federolf, University of Innsbruck, AustriaReviewed by:
James Williamson, Massachusetts Institute of Technology, United StatesLiviu Moldovan, Sciences and Technology of Târgu Mureş, Romania
Copyright © 2025 Radić, Blesić, Aničić, Milanović, Mirkov and Knežević. This is an open-access article distributed under the terms of the Creative Commons Attribution License (CC BY). The use, distribution or reproduction in other forums is permitted, provided the original author(s) and the copyright owner(s) are credited and that the original publication in this journal is cited, in accordance with accepted academic practice. No use, distribution or reproduction is permitted which does not comply with these terms.
*Correspondence: Iva Radić, aXZhLnByY2ljQHlhaG9vLmNvbQ==
† These authors have contributed equally to this work