 Peng Ran1†Xue-biao Wei1,2†Ying-wen Lin1†Guang Li1*Jie-leng Huang1Xu-yu He1Jun-qing Yang1Dan-qing Yu1*
 Ji-yan Chen1*
- 1Guangdong Provincial Key Laboratory of Coronary Heart Disease Prevention, Department of Cardiology, Guangdong Cardiovascular Institute, Guangdong Provincial People's Hospital, Guangdong Academy of Medical Sciences, Guangzhou, China
- 2Department of Critical Care Medicine, Guangdong Provincial Geriatrics Institute, Guangdong Provincial People's Hospital, Guangdong Academy of Medical Sciences, Guangzhou, China
Background: Shock index (heart rate/systolic blood pressure, SI) is a simple scale with prognostic value in patients with ST-segment elevation myocardial infarction (STEMI) undergoing percutaneous coronary intervention (PCI). The present study introduces an updated version of SI that includes renal function.
Methods: A total of 1,851 consecutive patients with STEMI undergoing PCI were retrospectively included at Cardiac Care Unit in Guangdong Provincial People's Hospital and divided into two groups according to their admission time: derivation database (from January 2010 to December 2013, n = 1,145) and validation database (from January 2014 to April 2016, n = 706). Shock Index-C (SIC) was calculated as (SI × 100)–estimated CCr. Calibration was evaluated using the Hosmer-Lemeshow statistic. The predictive power of SIC was evaluated using receiver operating characteristic (ROC) curve analysis.
Results: The predictive value and calibration of SIC for in-hospital death was excellent in derivation [area under the curve (AUC) = 0.877, p < 0.001; Hosmer-Lemeshow chi-square = 3.95, p = 0.861] and validation cohort (AUC = 0.868, p < 0.001; Hosmer-Lemeshow chi-square = 5.01, p = 0.756). SIC exhibited better predictive power for in-hospital events than SI (AUC: 0.874 vs. 0.759 for death; 0.837 vs. 0.651 for major adverse clinical events [MACEs]; 0.707 vs. 0.577 for contrast-induced acute kidney injury [CI-AKI]; and 0.732 vs. 0.590 for bleeding, all p < 0.001). Cumulative 1-year mortality was significantly higher in the upper SIC tertile (log-rank = 131.89, p < 0.001).
Conclusion: SIC was an effective predictor of poor prognosis and may have potential as a novel and simple risk stratification tool for patients with STEMI undergoing PCI.
Introduction
Despite advanced evidence-based medical treatments and the widespread use of percutaneous coronary intervention (PCI), ST-segment elevation myocardial infarction (STEMI) is a leading cause of mortality worldwide (1). The in-hospital mortality rate for STEMI is 3–4% following PCI, and can reach up to 10% in any given year (2, 3). In addition, increased risk of bleeding and acute kidney injury was observed in patients with STEMI, which was associated with poor outcomes (4, 5). Many scales have been developed for early identification of patients with STEMI at high risk for adverse outcomes. Global Registry of Acute Coronary Events (GRACE) and Thrombolysis in Myocardial Infarction (TIMI) risk scales are guideline-recommended risk stratification tools for prediction of STEMI-related mortality (6). Mehran et al. (7) and Can Rapid Risk Stratification of Unstable Angina Patients Suppress Adverse Outcomes With Early Implementation of the American College of Cardiology/American Heart Association Guidelines (CRUSADE) scores are used to predict contrast-induced acute kidney injury (CI-AKI) and bleeding, respectively (8). Each score predicts a different event, and collection of data and calculation of these four scores is time consuming in clinical practice. A simpler scoring system that can simultaneously assess the risk of mortality, bleeding, CI-AKI, and other STEMI-related adverse events is of critical importance.
Shock index (SI), defined as the ratio of heart rate to systolic blood pressure, is a simple risk-stratification tool used to evaluate patients with STEMI (9). However, the discriminatory ability of SI for short- and long-term adverse events is considered insufficient (10). In addition to heart rate and systolic blood pressure, renal function is an essential element of the GRACE, Mehran and CRUSADE scales (7, 11, 12), but the effect of addition of renal function to SI on prediction of poor prognosis has not been characterized. In this study, we developed a new model, Shock Index-C [SIC; (SI × 100)-estimated creatinine clearance rate (CCr)], and validated its predictive ability in patients with STEMI undergoing PCI.
Methods
Patients and Study Design
We retrospectively enrolled 1,907 consecutive patients with acute STEMI undergoing PCI at the Cardiac Care Unit in Guangdong Provincial People's Hospital between January 2010 and April 2016. STEMI was diagnosed according to the American College of Cardiology Foundation/American Heart Association guidelines (6). The exclusion criteria were as follows: (1) Hospital stay <24 h; (2) malignant tumor; (3) concomitant aortic dissection; and (4) missing admission serum creatinine (Scr) data. After screening, 1,851 patients were included (Supplementary Figure 1). This study was approved by the Ethics Committee of our hospital, and the requirement for informed consent was waived due to the retrospective nature of the study.
Clinical Data and SIC
Clinical data were collected from the electronic case report form by one researcher and randomly confirmed by another researcher. Data collected included patient demographics, previous medical history, laboratory results, PCI procedural details, adverse events, and medical treatment. Vital signs including blood pressure and heart rate were obtained from data recorded at admission. SI was calculated using the following formula: heart rate (bpm)/systolic blood pressure (mmHg). Estimated creatinine clearance rate (CCr) was calculated with the published equations for Cockcroft-Gault: man: (140–age)/ Scr, woman:(140–age) /Scr × 0.85 (13). SIC was calculated using the following formula: (SI × 100)–estimated CCr. GRACE, CRUSADE, Mehran, and TIMI risk scores were calculated using initial clinical history, electrocardiograms, laboratory values, and PCI procedural information collected at admission.
Follow-Up and Endpoints
All surviving in-hospital patients were followed-up through telephone interviews. We reviewed hospital readmission records and outpatient clinic interviews for possible events. The primary endpoints were in-hospital and 1-year mortality. In-hospital major adverse clinical events (MACEs) such as stroke, dialysis, acute heart failure, and target vessel revascularization (TVR) during hospitalization were used as a composite end point. In addition, CI-AKI and bleeding were recorded. Contrast-induced acute kidney injury was defined as elevation of Scr by 50%, or 0.3 mg/dL from baseline, within 48 h, according to the Kidney Disease: Improving Global Outcomes criteria (14).
Statistical Analysis
Normally distributed continuous data are presented as the mean ± standard deviation, and non-normally distributed continuous data are presented as the median and interquartile range, which were compared using independent sample t and non-parametric tests, respectively. Categorical variables are displayed as numbers and percentages, were compared using chi-square tests. The Hosmer-Lemeshow goodness-of-fit test was used to assess the goodness of fit of the final regression model. Receiver operating characteristic (ROC) curve analysis was conducted to determine the optimal cut-off levels of SIC for prediction of adverse events. Decision curve analysis was used to compare the predicting performance for in-hospital mortality by quantifying the net benefits. Area under the curve values were compared using the nonparametric approach described by DeLong et al. (15). In addition, net reclassification improvement (NRI) and integrated discrimination improvement (IDI) were calculated. The performance of SIC in subgroups was further assessed using ROC curves. Variables significantly associated with mortality in the univariate analysis were included in the multivariable analysis. Kaplan-Meier curves were generated and compared using the log-rank test. P < 0.05 were considered statistically significant. All analyses were conducted using SPSS software (version 22.0; SPSS Inc, Chicago, IL, USA).
Results
Patient Characteristics
A total of 1,851 patients with STEMI undergoing PCI were included. Baseline characteristics are shown in Table 1. The mean age was 61.4 ± 12.3 years and 1,532 (82.8%) of the included patients were male. They were divided into two groups according to their admission time: derivation database (from January 2010 to December 2013, n = 1,145) and validation database (from January 2014 to April 2016, n = 706). Higher SI, lower CCr and left ventricular ejection fraction (LVEF), less stents implantation and usage of Angiotensin-Converting Enzyme Inhibitors (ACEIs) /Angiotensin Receptor Blockers (ARBs) and β-blocker were found in validation database (Table 1). Except for that, there were no significant differences in the clinical features between two groups.
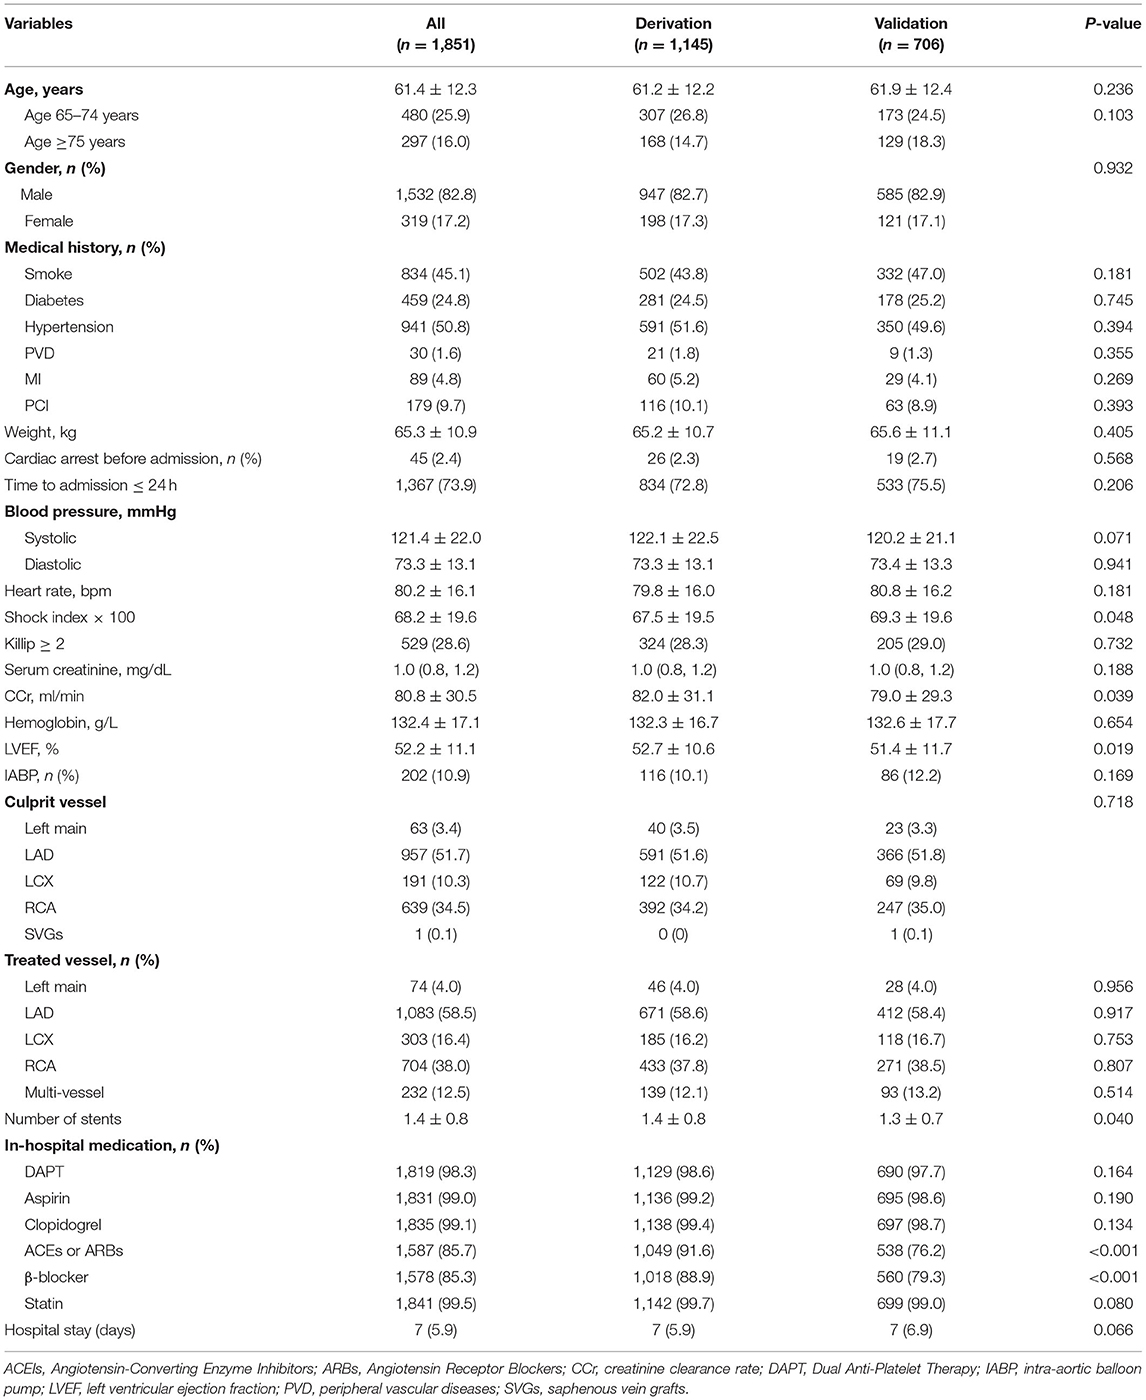
Table 1. Baseline characteristics of patients in the model derivation and validation database.
During hospitalization, 68 patients (3.7%) died, 118 (6.4%) suffered acute heart failure, 70 (3.8%) received hemodialysis treatment, 12 (0.6%) received TVR, and 23 (1.2%) had strokes. The rate of CI-AKI and any bleeding were 10.0% and 10.4%, respectively. There was no statistical difference for in-hospital events between derivation and validation database, except for dialysis (3.0% vs. 5.1%, p = 0.02; Table 2).
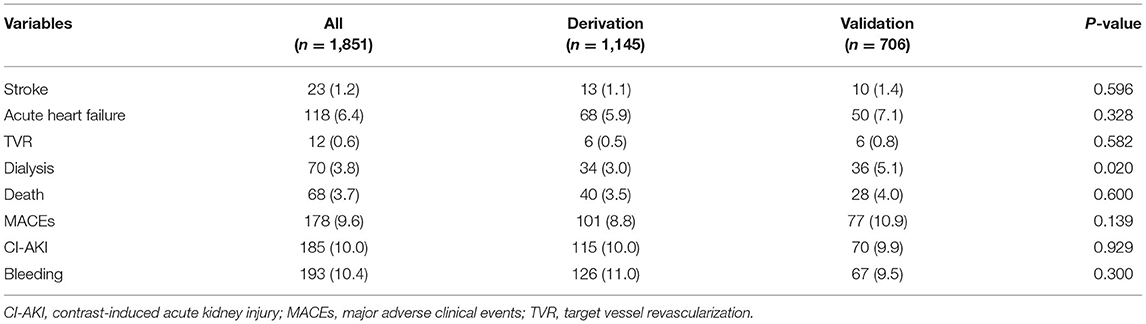
Table 2. In-hospital outcomes in the model derivation and validation database.
Development and Validation of SIC
In derivation database, the significant factors except the elements of SI and CCr in the univariate logistic regression analysis for in-hospital mortality were included into multivariate model (Supplementary Table 1). Cardiac arrest before admission, CCr, LVEF, and IABP were risk factors for in-hospital death independently of SI. Renal function is an essential element of previous scores in STEMI patients. Therefore, we added CCr into SI to create a new variable, SIC. The chi-square statistic for calibration was 3.95 (p = 0.861, Figure 1), indicating good discriminatory power and goodness-of-fit. Receiver operating characteristics curve analysis was performed to determine the predictive power of SI, CCr, the combination of SI and CCr using a logistic model (linear combination predictor), and SIC, for in-hospital death in derivation database. SIC had an excellent predictive value for in-hospital mortality (AUC = 0.877, 95% CI: 0.833–0.921, p < 0.001). In addition, the predictive power was higher than SI (AUC: 0.877 vs. 0.723, p < 0.001; NRI = 37.0%, 95% CI: 17.4–56.6, p < 0.001; IDI = 7.5%, 95% CI: 4.2–10.8, p < 0.001; Figure 2) and relatively higher than CCr (AUC: 0.877 vs. 0.838, p = 0.058; NRI = 21.1%, 95% CI: −3.6–45.7, p = 0.094; IDI = 6.6%, 95% CI: 0.5–12.8, p = 0.034; Figure 2). The decision curves analysis showed that SIC had the highest overall net benefit compared with SI and CCr (Figure 3). The AUC values for SIC and the linear combination predictor were similar (AUC: 0.877 vs. 0.876, p = 0.781, Figure 2). SIC was selected due to ease of clinical use. The AUC of SIC for in-hospital mortality was 0.868 (95% CI: 0.803–0.934) and was calibrated with a Hosmer-Lemeshow chi-square statistic of 5.01 (p = 0.756, Figure 1) in validation database.
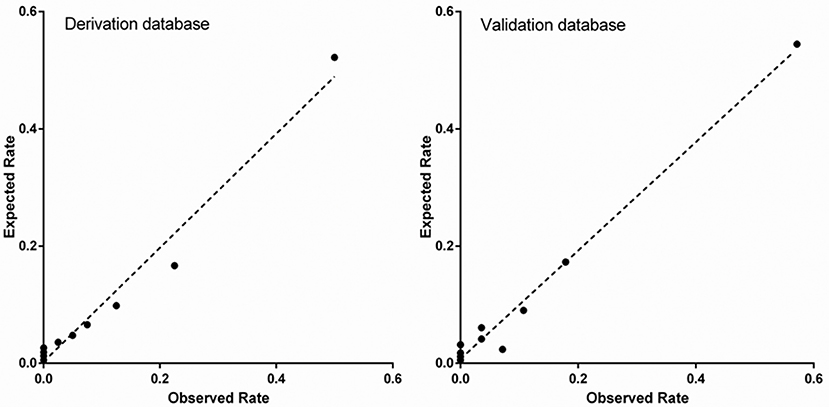
Figure 1. Calibration of shock index-C for in-hospital mortality in the derivation and validation database.
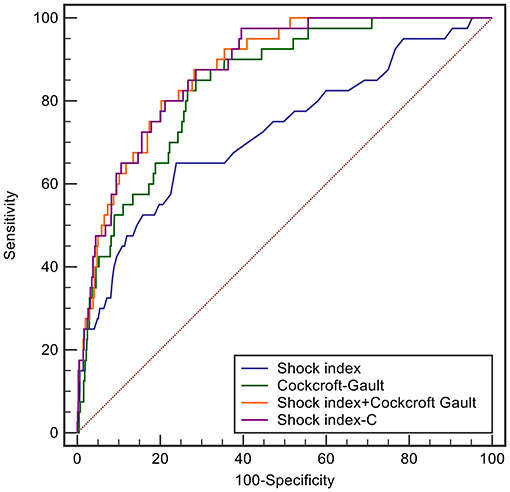
Figure 2. ROC curves of shock index, Cockcroft-Gault, shock index-C, and the prediction score developed by including the shock index and Cockcroft-Gault in the logistic model for in-hospital mortality in the derivation database.
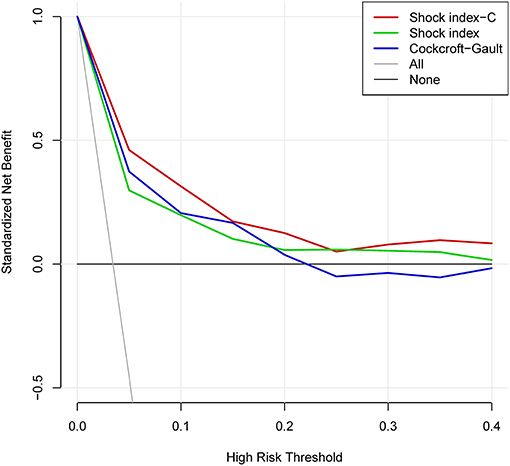
Figure 3. Decision curve analysis of shock index-C and shock index for in-hospital death in the derivation database.
Subgroup Analysis
In addition, the SIC also exhibited good discrimination among subgroups in the overall population (Table 3), such as age, gender, and infarcted area.
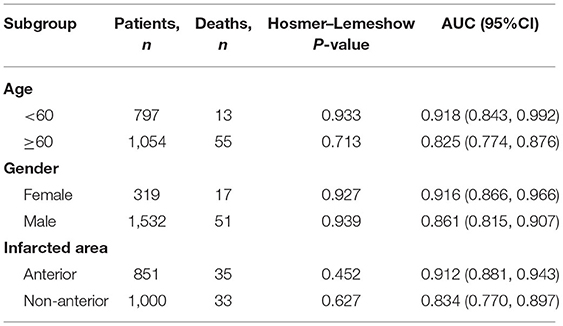
Table 3. Subgroup analysis.
Comparison of SIC With Previous Risk Scores
The discriminatory ability of SIC for in-hospital death, MACEs, CI-AKI, and bleeding was compared with other commonly used scales in the overall population. SIC exhibited similar predictive discrimination as GRACE (AUC: 0.874 vs. 0.859, p = 0.453; NRI = 16.5%, 95% CI: −2.1–35.1, p = 0.082; IDI = 3.6%, 95% CI: −0.3–7.6, p = 0.072; Figure 4; Supplementary Table 2) and higher than TIMI risk score (AUC: 0.874 vs. 0.822, p = 0.006, NRI = 20.1%, 95% CI: 0.7–39.5, p = 0.042; IDI = 7.5%, 95% CI: 2.9–12.1, p = 0.001; Figure 4; Supplementary Table 2) for in-hospital death. SIC was a better predictor of in-hospital MACEs than GRACE (AUC: 0.837 vs. 0.804, p = 0.008, NRI = 17.4%, 95% CI: 5.0–29.8, p = 0.006; IDI=4.4%, 95% CI: 1.6–7.3, p = 0.002; Figure 4; Supplementary Table 2) and TIMI risk score (AUC: 0.837 vs. 0.762, p < 0.001, NRI = 53.6%, 95% CI: 40.7–66.4, p < 0.001; IDI = 11.1%, 95% CI: 8.2–13.9, p < 0.001; Figure 4; Supplementary Table 2). For predicting CI-AKI, SIC did not perform well-compared with Mehran score (AUC: 0.707 vs. 0.749, p = 0.029; NRI = −41.5%, 95% CI: −54.8 to −28.2, p < 0.001; IDI = −4.2%, 95% CI: −6.0 to −2.4, p < 0.001; Figure 4; Supplementary Table 2). No difference was observed for prediction of in-hospital bleeding between SIC and CRUSADE score (AUC: 0.732 vs. 0.743, p = 0.380; NRI = −8.7%, 95% CI: −20.8–3.5, p = 0.161; IDI = 0.3%, 95% CI: −1.3–1.9, p = 0.691; Figure 4; Supplementary Table 2). In addition, SIC was a better predictor than SI for in-hospital death (AUC: 0.874 vs. 0.759, p < 0.001, Figure 4), MACEs (AUC: 0.837 vs. 0.651, p < 0.001, Figure 4), CI-AKI (AUC: 0.707 vs. 0.577, p < 0.001, Figure 4), and bleeding (AUC: 0.732 vs. 0.590, p < 0.001, Figure 4).
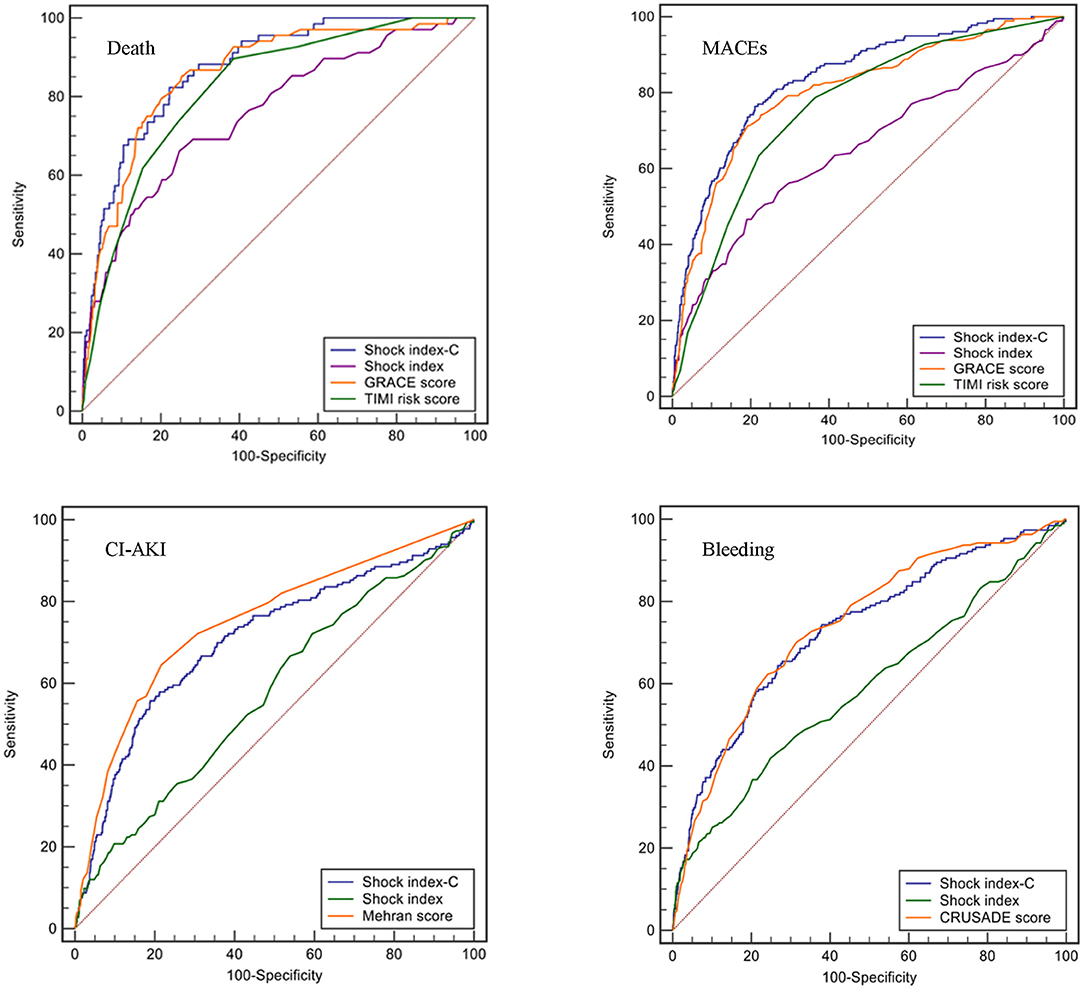
Figure 4. ROC curves of different scores for in-hospital events (death, MACEs, CI-AKI, and bleeding) in the overall population.
Clinical Application of SIC
We categorized SIC into tertiles as follows to enhance its clinical utility: < -30 (n = 584), −30 to −5 (n = 567), and ≥-5 (n = 700). The incidences of in-hospital mortality (0 vs. 1.4 vs. 8.6%, p < 0.001, Supplementary Figure 2), MACEs (1.5 vs. 3.7 vs. 21.1%, p < 0.001, Supplementary Figure 2), CI-AKI (5.0 vs. 5.5 vs. 17.9%, p < 0.001, Supplementary Figure 2), and bleeding (3.8 vs. 6.9 vs. 18.9%, p < 0.001, Supplementary Figure 2) were significantly higher in patients in the upper SIC tertile. The cumulative 1-year mortality risk was significantly higher in the third tertile (log-rank = 131.89, p < 0.001, Supplementary Figure 3). The second (adjusted HR = 2.86, 95% CI: 1.06–7.74, p = 0.038, Supplementary Table 3) and third SIC tertile (adjusted HR = 7.80, 95% CI: 3.08–19.79, p < 0.001, Supplementary Table 3), compared to the first SIC tertile, was an independent risk factor for 1-year mortality.
The included patients were divided into two groups using an SIC cutoff of 10 (sensitivity 82.4%; specificity 77.8%) based on the ROC curve for in-hospital death: >10 (n = 450) and ≤ 10 (n = 1,401). The incidences of in-hospital mortality (1.0 vs. 12.0%, p < 0.001, Supplementary Figure 2), MACEs (3.5 vs. 28.7%, p < 0.001, Supplementary Figure 2), CI-AKI (5.7 vs. 23.3%, p < 0.001, Supplementary Figure 2), and bleeding (6.0 vs. 24.2%, p < 0.001, Supplementary Figure 2) were significantly higher in patients with SIC > 10. Patients with SIC > 10 were at higher risk for one-year mortality than those with SIC ≤ 10 (log-rank = 176.25, P < 0.001, Supplementary Figure 3). Multivariate Cox survival analysis indicated that SIC > 10 was independently associated with one-year mortality (adjusted HR = 3.13, 95% CI: 2.01–4.87, p < 0.001, Supplementary Table 3).
Discussion
This study was the first to combine SI and renal function for determination of prognosis of patients with STEMI undergoing PCI. This novel prognostic scale, termed SIC exhibited a good discriminatory power and goodness-of-fit in derivation and validation database, which had greater predictive accuracy than SI for in-hospital adverse events. The discriminatory capacity of SIC for in-hospital death was non-inferior to the GRACE scale, and SIC was a better predictor than TIMI risk score. In addition, SIC displayed modest discriminatory ability for identification of CI-AKI and bleeding. The cumulative 1-year mortality was significantly higher in patients with a high SIC. Use of SIC could provide prognostic information to aid in early rapid risk assessment of patients with STEMI undergoing PCI.
The mortality rate of patients with STEMI is high despite use of PCI and secondary preventive strategies. Many factors, including tachycardia, hypotension, and renal function have been shown to be independent predictors of early STEMI-related death (6). However, no single biomarker has been identified that can predict adverse events. Therefore, several risk scales have been established as prognostic indicators for STEMI.
The TIMI risk score was first developed for fibrinolytic-eligible patients with STEMI, and its accuracy and clinical applicability were validated in patients with STEMI undergoing PCI (16, 17). This score is recommended by contemporary guidelines for use in patients with STEMI, and is a simple bedside scoring tool that can effectively predict in-hospital mortality (18). However, TIMI is only a modest predictor of 1-year mortality (AUC = 0.73) (19). Current guidelines also recommend use of the GRACE scale as a prognostic indicator for patients with STEMI (6). The GRACE scale exhibits good discriminatory performance for short- and long-term outcomes (AUC ≥ 0.8) (20). In our study, GRACE score had higher predictive value than TIMI risk score, which agreed with the findings in a previous study (21). However, GRACE score is not routinely used in patients with STEMI because it uses a complex formula that requires computer-assisted calculation. Therefore, a simpler risk score with adequate predictive accuracy was needed for patients with STEMI.
SI was initially described in 1967, and is commonly used to assess the severity of shock in the clinical setting (22). SI has also been used for risk assessment of several conditions including trauma, stroke, and sepsis (23–25). In STEMI, sustained obstruction of blood supply results in myocardial necrosis, which can result in cardiac dysfunction (26). Epidemiological data showed that approximately 6% patients with STEMI also had cardiogenic shock (27). Cardiogenic shock was associated with significantly higher short- and long-term risk for mortality, as evidenced by an increase from 25 to 50% (28). Therefore, SI is considered a viable risk projection model for patients with STEMI. However, the predictive accuracy of SI is not adequate. The AUC values for in-hospital and one-year mortality were 0.703 and 0.660, respectively (10, 29). Renal dysfunction is believed to be a risk factor for patients with STEMI (1, 6). Cywinski et al. showed that estimated renal function was a better prognostic indicator than Scr (30). CCr by Cockcroft-Gault has adequate discriminatory ability, with an AUC > 0.8 for prediction of poor outcomes, which was better than other equations for glomerular filtration rate estimation in patients with acute coronary syndrome (31, 32). In addition, renal function is an important element in the GRACE, Mehran, and CRUSADE scales (7, 11, 12). Therefore, we hypothesized that addition of CCr to SI could result in better predictive accuracy in patients with STEMI undergoing PCI. Our results showed that the predictive value of SIC for in-hospital death was equivalent to that of GRACE and better than that of TIMI risk score. In addition, SIC did better in predicting MACEs than these two scales. SIC is calculated using only 3 variables, which may result in greater use by clinicians.
In the present study, we also explored the discriminatory ability of SIC for CI-AKI and bleeding. These complications occur frequently in patients with STEMI undergoing PCI, and are associated with poor prognosis (4, 5). The Mehran score consists of 8 variables and has been validated as an accurate predictor of CI-AKI (7, 33). The procedural variables (contrast media volume) included in this score have limited its early application. In our study, although SIC was similar to Mehran score for prediction of CI-AKI, it could serve as a rapid and effective tool for early prediction of CI-AKI. Given that blood pressure, heart rate, and renal function contribute to bleeding, we compared the predictive abilities of SIC and CRUSADE (12). SIC had equivalent predictive value for bleeding as CRUSADE.
SIC presented in this study has several advantages. First, it included 3 risk factors that were easily collected and calculated. Second, although it has less variables, it has similar discriminatory ability with guidelines recommending risk-stratified score. Third, it shared the same risk factors with previous scores for predicting CI-AKI and bleeding. By using these simple data (heart rate, systolic blood pressure, and CCr), SIC can be used to assess and stratify the risk for multiple events rapidly and precisely, at no additional cost or effort.
Study Limitation
Our study suffered from several limitations. First, this study was retrospective, of moderate-scale, and from a single center, and this score should be externally validated in a large-scale multicenter study. Second, blood pressure was not invasively measured in catheterization room, which is more reliable than sphygmomanometer. However, it could represent the contemporary and real-world clinical practice. Third, the predictive value of SIC was only validated in patients with STEMI undergoing PCI, and caution should be used when using this scale to evaluate patients not undergoing PCI. Fourth, the proportion of female in this study was relatively small, the predictive ability should be validated in another female cohort of STEMI, despite the good discrimination power in the subgroup analysis.
Conclusion
In conclusion, we showed that SI was a good prognostic indicator in patients with STEMI undergoing PCI, but its discriminatory ability was insufficient. Addition of renal function to SI resulted in better predictive power and good calibration. SIC had similar predictive value for in-hospital death as GRACE score, and better discrimination power than TIMI risk scales. In addition, SIC showed modest predictive value for CI-AKI and bleeding. Higher SIC was an independent predictor for 1-year mortality. This indicator might provide prognostic information for early and rapid risk assessment of patients with STEMI undergoing PCI.
Data Availability Statement
The raw data supporting the conclusions of this article will be made available by the authors, without undue reservation.
Ethics Statement
The studies involving human participants were reviewed and approved by Ethics Committee of Guangdong Provincial People's Hospital. Written informed consent for participation was not required for this study in accordance with the national legislation and the institutional requirements.
Author Contributions
J-yC, D-qY, and GL contributed to the conception or design of the study. PR, X-bW, Y-wL, J-lH, X-yH, and J-qY contributed to the acquisition, analysis, or interpretation of data. PR, X-bW, and Y-wL drafted the manuscript. J-yC and D-qY critically revised the manuscript. All the authors gave final approval and agreed to be accountable for all aspects of work ensuring integrity and accuracy.
Funding
This study was supported by grants from National Natural Science Foundation of China (Grant No. 82002014), Natural Science Foundation of Guangdong Province (Grant no. 2021A1515010107), Medical Science and Technology Research Funding of Guangdong (Grant No. A2019409), the Fundamental Research Funds for the Central Universities (Grant No. 2019MS136), Science and Technology Projects of Guangzhou (Grant No. 201903010097), Guangdong Provincial Key Laboratory of Coronary Heart Disease Prevention (Grant No. 2017B030314041), and Sailing Foundation (Grant Nos. LHJJ201611011 and LHJJ201612127). The funders had no role in study design, data collection and analysis, decision to publish, or preparation of the manuscript.
Conflict of Interest
The authors declare that the research was conducted in the absence of any commercial or financial relationships that could be construed as a potential conflict of interest.
Supplementary Material
The Supplementary Material for this article can be found online at: https://www.frontiersin.org/articles/10.3389/fcvm.2021.657817/full#supplementary-material
Abbreviations
AUC, area under the curve; CCr, creatinine clearance rate; CI, confidence interval; CI-AKI, contrast-induced acute kidney injury; CRUSADE, Can Rapid Risk Stratification of Unstable Angina Patients Suppress Adverse Outcomes With Early Implementation of the American College of Cardiology/American Heart Association Guidelines; GRACE, Global Registry of Acute Coronary Events; LMCA, left main coronary artery; HR, hazard ratio; IABP, intra-aortic balloon pump; IDI, integrated discrimination improvement; LVEF, left ventricular ejection fraction; MACEs, major adverse clinical events; NRI, net reclassification improvement; PCI, percutaneous coronary intervention; ROC, receiver operating characteristic; Scr, serum creatinine; SI, shock index; SIC, shock Index-C; STEMI, ST-segment elevation myocardial infarction; TIMI, Thrombolysis in Myocardial Infarction; TVR, target vessel revascularization.
References
1. Ibanez B, James S, Agewall S, Antunes MJ, Bucciarelli-Ducci C, Bueno H, et al. 2017 ESC guidelines for the management of acute myocardial infarction in patients presenting with ST-segment elevation: the task force for the management of acute myocardial infarction in patients presenting with ST-segment elevation of the European society of cardiology (ESC). Eur Heart J. (2018) 39:119–77. doi: 10.5603/KP.2018.0041
2. Krishnan U, Brejt JA, Schulman-Marcus J, Swaminathan RV, Feldman DN, Goyal P, et al. Temporal trends in the clinical acuity of patients with ST-segment elevation myocardial infarction. Am J Med. (2018) 131:100.e9–20. doi: 10.1016/j.amjmed.2017.06.040
3. Pedersen F, Butrymovich V, Kelbaek H, Wachtell K, Helqvist S, Kastrup J, et al. Short- and long-term cause of death in patients treated with primary PCI for STEMI. J Am Coll Cardiol. (2014) 64:2101–8. doi: 10.1016/j.jacc.2014.08.037
4. Matic DM, Asanin MR, Vukcevic VD, Mehmedbegovic ZH, Marinkovic JM, Kocev NI, et al. Impact on long-term mortality of access and non-access site bleeding after primary percutaneous coronary intervention. Heart. (2019) 105:1568–74. doi: 10.1136/heartjnl-2019-314728
5. McCullough PA, Choi JP, Feghali GA, Schussler JM, Stoler RM, Vallabahn RC, et al. Contrast-Induced acute kidney injury. J Am Coll Cardiol. (2016) 68:1465–73. doi: 10.1016/j.jacc.2016.05.099
6. O'Gara PT, Kushner FG, Ascheim DD, Casey DJ, Chung MK, de Lemos JA, et al. 2013 ACCF/AHA guideline for the management of ST-elevation myocardial infarction: a report of the American college of cardiology foundation/American heart association task force on practice guidelines. J Am Coll Cardiol. (2013) 61:e78–140. doi: 10.1161/CIR.0b013e3182742c84
7. Mehran R, Aymong ED, Nikolsky E, Lasic Z, Iakovou I, Fahy M, et al. A simple risk score for prediction of contrast-induced nephropathy after percutaneous coronary intervention: development and initial validation. J Am Coll Cardiol. (2004) 44:1393–9. doi: 10.1016/S0735-1097(04)01445-7
8. Flores-Rios X, Couto-Mallon D, Rodriguez-Garrido J, Garcia-Guimaraes M, Gargallo-Fernandez P, Pinon-Esteban P, et al. Comparison of the performance of the CRUSADE, ACUITY-HORIZONS, and ACTION bleeding risk scores in STEMI undergoing primary PCI: insights from a cohort of 1391 patients. Eur Heart J Acute Cardiovasc Care. (2013) 2:19–26. doi: 10.1177/2048872612469885
9. Bilkova D, Motovska Z, Widimsky P, Dvorak J, Lisa L, Budesinsky T. Shock index: a simple clinical parameter for quick mortality risk assessment in acute myocardial infarction. Can J Cardiol. (2011) 27:739–42. doi: 10.1016/j.cjca.2011.07.008
10. Hemradj VV, Ottervanger JP, de Boer MJ, Suryapranata H. Shock index more sensitive than cardiogenic shock in ST-elevation myocardial infarction treated by primary percutaneous coronary intervention. Circ J. (2017) 81:199–205. doi: 10.1253/circj.CJ-16-0616
11. Granger CB, Goldberg RJ, Dabbous O, Pieper KS, Eagle KA, Cannon CP, et al. Predictors of hospital mortality in the global registry of acute coronary events. Arch Intern Med. (2003) 163:2345–53. doi: 10.1001/archinte.163.19.2345
12. Subherwal S, Bach RG, Chen AY, Gage BF, Rao SV, Newby LK, et al. Baseline risk of major bleeding in non-ST-segment-elevation myocardial infarction: the CRUSADE (can rapid risk stratification of unstable angina patients suppress ADverse outcomes with early implementation of the ACC/AHA guidelines) bleeding score. Circulation. (2009) 119:1873–82. doi: 10.1161/CIRCULATIONAHA.108.828541
13. Booysen HL, Woodiwiss AJ, Raymond A, Sareli P, Hsu HC, Dessein PH, et al. Chronic kidney disease epidemiology collaboration-derived glomerular filtration rate performs better at detecting preclinical end-organ changes than alternative equations in black Africans. J Hypertens. (2016) 34:1178–85. doi: 10.1097/HJH.0000000000000924
14. Kellum JA, Lameire N. Diagnosis, evaluation, and management of acute kidney injury: a KDIGO summary (part 1). Crit Care. (2013) 17:204. doi: 10.1186/cc11454
15. DeLong ER, DeLong DM, Clarke-Pearson DL. Comparing the areas under two or more correlated receiver operating characteristic curves: a nonparametric approach. Biometrics. (1988) 44:837–45. doi: 10.2307/2531595
16. Abelin AP, David RB, Gottschall CA, Quadros AS. Accuracy of dedicated risk scores in patients undergoing primary percutaneous coronary intervention in daily clinical practice. Can J Cardiol. (2014) 30:125–31. doi: 10.1016/j.cjca.2013.07.673
17. Morrow DA, Antman EM, Charlesworth A, Cairns R, Murphy SA, de Lemos JA, et al. TIMI risk score for ST-elevation myocardial infarction: a convenient, bedside, clinical score for risk assessment at presentation: an intravenous nPA for treatment of infarcting myocardium early II trial substudy. Circulation. (2000) 102:2031–7. doi: 10.1161/01.CIR.102.17.2031
18. Gevaert SA, De Bacquer D, Evrard P, Convens C, Dubois P, Boland J, et al. Gender, TIMI risk score and in-hospital mortality in STEMI patients undergoing primary PCI: results from the Belgian STEMI registry. Eurointervention. (2014) 9:1095–101. doi: 10.4244/EIJV9I9A184
19. Littnerova S, Kala P, Jarkovsky J, Kubkova L, Prymusova K, Kubena P, et al. GRACE score among six risk scoring systems (CADILLAC, PAMI, TIMI, Dynamic TIMI, zwolle) demonstrated the best predictive value for prediction of long-term mortality in patients with ST-elevation myocardial infarction. PLoS ONE. (2015) 10:e0123215. doi: 10.1371/journal.pone.0123215
20. Bawamia B, Mehran R, Qiu W, Kunadian V. Risk scores in acute coronary syndrome and percutaneous coronary intervention: a review. Am Heart J. (2013) 165:441–50. doi: 10.1016/j.ahj.2012.12.020
21. D'Ascenzo F, Biondi-Zoccai G, Moretti C, Bollati M, Omede P, Sciuto F, et al. TIMI, GRACE and alternative risk scores in acute coronary syndromes: a meta-analysis of 40 derivation studies on 216,552 patients and of 42 validation studies on 31,625 patients. Contemp Clin Trials. (2012) 33:507–14. doi: 10.1016/j.cct.2012.01.001
22. Allgower M, Burri C. [“Shock index”]. Dtsch Med Wochenschr. (1967) 92:1947–50. doi: 10.1055/s-0028-1106070
23. Middleton DJ, Smith TO, Bedford R, Neilly M, Myint PK. Shock index predicts outcome in patients with suspected sepsis or community-acquired pneumonia: a systematic review. J Clin Med. (2019) 8:1144. doi: 10.3390/jcm8081144
24. Myint PK, Sheng S, Xian Y, Matsouaka RA, Reeves MJ, Saver JL, et al. Shock index predicts patient-related clinical outcomes in stroke. J Am Heart Assoc. (2018) 7:e007581. doi: 10.1161/JAHA.117.007581
25. Pandit V, Rhee P, Hashmi A, Kulvatunyou N, Tang A, Khalil M, et al. Shock index predicts mortality in geriatric trauma patients: an analysis of the national trauma data bank. J Trauma Acute Care Surg. (2014) 76:1111–5. doi: 10.1097/TA.0000000000000160
26. Thygesen K, Alpert JS, Jaffe AS, Chaitman BR, Bax JJ, Morrow DA, et al. Fourth universal definition of myocardial infarction 2018. Circulation. (2018) 138:e618–51. doi: 10.1161/CIR.0000000000000617
27. Helgestad O, Josiassen J, Hassager C, Jensen LO, Holmvang L, Sorensen A, et al. Temporal trends in incidence and patient characteristics in cardiogenic shock following acute myocardial infarction from 2010 to 2017: a Danish cohort study. Eur J Heart Fail. (2019) 21:1370–8. doi: 10.1002/ejhf.1566
28. Kawaji T, Shiomi H, Morimoto T, Furukawa Y, Nakagawa Y, Kadota K, et al. Long-term clinical outcomes in patients with ST-segment elevation acute myocardial infarction complicated by cardiogenic shock due to acute pump failure. Eur Heart J Acute Cardiovasc Care. (2018) 7:743–54. doi: 10.1177/2048872616673535
29. El-Menyar A, Al HK, Zubaid M, Alsheikh-Ali AA, Sulaiman K, Almahmeed W, et al. Utility of shock index in 24,636 patients presenting with acute coronary syndrome. Eur Heart J Acute Cardiovasc Care. (2020) 9:546–56. doi: 10.1177/2048872619886307
30. Cywinski JB, Mascha EJ, Kurz A, Sessler DI. Estimated glomerular filtration rate better predicts 30-day mortality after non-cardiac surgery than serum creatinine: a retrospective analysis of 92,888 patients. Can J Anaesth. (2015) 62:745–52. doi: 10.1007/s12630-015-0398-8
31. Orvin K, Eisen A, Goldenberg I, Farkash A, Shlomo N, Gevrielov-Yusim N, et al. The proxy of renal function that most accurately predicts short- and long-term outcome after acute coronary syndrome. Am Heart J. (2015) 169:702–12.e3. doi: 10.1016/j.ahj.2015.01.012
32. Rivera-Caravaca JM, Ruiz-Nodar JM, Tello-Montoliu A, Esteve-Pastor MA, Quintana-Giner M, Veliz-Martinez A, et al. Disparities in the estimation of glomerular filtration rate according to cockcroft-gault, modification of diet in renal disease-4, and chronic kidney disease epidemiology collaboration equations and relation with outcomes in patients with acute coronary syndrome. J Am Heart Assoc. (2018) 7:e008725. doi: 10.1161/JAHA.118.008725
Keywords: shock index, renal function, ST-segment elevation myocardial infarction, percutaneous coronary intervention, major adverse clinical events
Citation: Ran P, Wei X-b, Lin Y-w, Li G, Huang J-l, He X-y, Yang J-q, Yu D-q and Chen J-y (2021) Shock Index-C: An Updated and Simple Risk-Stratifying Tool in ST-Segment Elevation Myocardial Infarction. Front. Cardiovasc. Med. 8:657817. doi: 10.3389/fcvm.2021.657817
Received: 24 January 2021; Accepted: 29 March 2021;
Published: 15 June 2021.
Edited by:
Diego Arroyo, Fribourg Cantonal Hospital, SwitzerlandReviewed by:
Rajiv Rampat, William Harvey Hospital, United KingdomMatthias Bossard, Luzerner Kantonsspital, Switzerland
Copyright © 2021 Ran, Wei, Lin, Li, Huang, He, Yang, Yu and Chen. This is an open-access article distributed under the terms of the Creative Commons Attribution License (CC BY). The use, distribution or reproduction in other forums is permitted, provided the original author(s) and the copyright owner(s) are credited and that the original publication in this journal is cited, in accordance with accepted academic practice. No use, distribution or reproduction is permitted which does not comply with these terms.
*Correspondence: Ji-yan Chen, Z2RwaG9zcGl0YWxAMTYzLmNvbQ==; Dan-qing Yu, eXVkYW5xaW5nMjAxN0AxMjYuY29t; Guang Li, ZHJsaWd1YW5nMTAwQDEyNi5jb20=
†These authors share first authorship