 Narges Ashraf Ganjooei1Tannaz Jamialahmadi2,3Mohsen Nematy2Ali Jangjoo4Ladan Goshayeshi5,6Majid Khadem-Rezaiyan7
 Željko Reiner8Mona Alidadi2
 Alexander M. Markin9
 Amirhossein Sahebkar1,10,11*
- 1Biotechnology Research Center, Pharmaceutical Technology Institute, Mashhad University of Medical Sciences, Mashhad, Iran
- 2Department of Nutrition, Faculty of Medicine, Mashhad University of Medical Sciences, Mashhad, Iran
- 3Department of Food Science and Technology, Quchan Branch, Islamic Azad University, Quchan, Iran
- 4Faculty of Medicine, Surgical Oncology Research Center, Imam Reza Hospital, Mashhad University of Medical Sciences, Mashhad, Iran
- 5Department of Gastroenterology and Hepatology, Faculty of Medicine, Mashhad University of Medical Sciences, Mashhad, Iran
- 6Gastroenterology and Hepatology Research Center, Mashhad University of Medical Sciences, Mashhad, Iran
- 7Department of Community Medicine and Public Health, Faculty of Medicine, Mashhad University of Medical Sciences, Mashhad, Iran
- 8Department of Internal Medicine, School of Medicine, University Hospital Centre Zagreb, University of Zagreb, Zagreb, Croatia
- 9Laboratory of Cellular and Molecular Pathology of Cardiovascular System, Institute of Human Morphology, Moscow, Russia
- 10Applied Biomedical Research Center, Mashhad University of Medical Sciences, Mashhad, Iran
- 11School of Pharmacy, Mashhad University of Medical Sciences, Mashhad, Iran
Background and Aims: Obesity is one of the major health problems worldwide. Morbid obesity (body mass index >40 kg/m2 or over 35 with a comorbidity) is associated, apart from other diseases, with an increased risk of non-alcoholic fatty liver disease (NAFLD). Moreover, dyslipidemia is an important comorbidity that is frequently found in NAFLD patients. The aim of this study was to analyze whether serum lipids in morbidly obese patients are associated with the spectrum of NAFLD.
Methods: Total serum cholesterol, LDL cholesterol, HDL cholesterol, non-HDL cholesterol, VLDL, and triglycerides were analyzed in 90 morbidly obese patients. The association of lipid profile parameters with histopathological, elastographic, and sonographic indices of NAFLD, non-alcoholic steatohepatitis (NASH), and liver fibrosis were explored.
Results: The mean levels of serum total cholesterol, LDL-C, and non-HDL cholesterol in patients with positive histology for liver steatosis and NASH were significantly higher than those in patients with negative histology. None of the indices showed a strong association with NAFLD, NASH, or liver fibrosis after adjustment for potential confounders.
Conclusion: A slight predictive value of lipid profile is not sufficiently enough to use solely as a non-invasive test in predicting NASH or liver fibrosis.
Introduction
Non-alcoholic fatty liver disease (NAFLD)—the most common cause of liver disease—is described as the presence of hepatic fat accumulation exceeding 5% of liver weight in the absence of excessive alcohol use. It can progress to non-alcoholic steatohepatitis (NASH), cirrhosis, and even hepatocellular carcinoma (1–4). Moreover, NAFLD increases the risk of incident chronic diseases including cardiovascular disease, type 2 diabetes, and chronic kidney disease (2, 5–7). The overall worldwide NAFLD prevalence is 25.2%, but the prevalence varies between nations (8). Although about 3–30% of NAFLD patients have a relatively normal body mass index (BMI), NAFLD is strongly associated with obesity and hyperlipidemia, and it seems to be the hepatic manifestation of metabolic syndrome (4, 9–12).
Several methods, both invasive and non-invasive, have been suggested to evaluate liver fat content, NASH and fibrosis. Though liver biopsy is still regarded as the gold standard for diagnosing NAFLD, due to its various limitations, finding a safe, non-invasive, and accurate method is needed (13, 14). Dyslipidemia, which is characterized by hypertriglyceridemia, reductions in high-density lipoprotein cholesterol (HDL-c), and increase in very low-density lipoprotein (VLDL) and low-density lipoprotein cholesterol (LDL-c), is an important comorbidity that is frequently found in NAFLD patients (15, 16). Emerging data suggest that lipid profile parameters may be associated with NAFLD severity and the development of NASH and liver fibrosis (17–20).
In the present study, we performed a prospective cohort study to determine whether lipid profile components are an independent predictor of NAFLD in a morbidly obese population. Moreover, their optimal cutoff point for detecting NAFLD was also determined.
Materials and Methods
Morbidly obese patients with BMI higher than 40 kg/m2 or over 35 with one or more comorbidity were recruited from the outpatient clinic between December 2016 and September 2017. Psychological assessment and medical examination was done before surgery to exclude patients with absolute contraindication to bariatric surgery. Each participant fulfilled the informed consent. Males and females who met the following criteria were included: alcohol drinking not more than 30 and 20 g/day, respectively, no consumption or just temporary consumption of hepatotoxic medications, and negative HBV and HCV antibodies. Eventually, 90 patients were selected. All procedures performed in this study were in accordance with the ethical standards of the institutional and/or national research committee and with the 1964 Helsinki Declaration and its later amendments or comparable ethical standards.
Two-Dimensional Shear Wave Elastography
Liver stiffness was assessed by two-dimensional shear wave elastography (2D-SWE) in real time using B-mode ultrasound imaging with potential to select the region of interest. During the 2-week preoperative period, liver stiffness (2D-SWE) was measured. Aixplorer ultrasound system (Supersonic Imagine, France) and a convex broadband probe (SC6-1, 1–6 MHz) were used based on instructions provided by manufacturer. The ideal position—hold the arm completely abducted in the right dorsal decubitus—was proposed after 6-h fasting. An acceptable liver stiffness measurement was based on 10 acquisitions measured in each participant. The mean (M) of valid measurements in kilopascals (kPa) was considered as a result of liver stiffness evaluation for each subject. The single operator was blinded to the study data.
Histologic Analysis of the Hepatic Tissue
Liver tissue biopsies were obtained during the bariatric procedure from the left lobe with 16-gauge Tru-cut needle. Patients with abnormal liver function tests and liver steatosis as confirmed by ultrasound or direct view during surgery were eligible for biopsy. The specimens were stained with hematoxylin–eosin–saffron, Masson's trichrome, and picrosirius red after embedding in paraffin for histologic assessment. The expert pathologist who studied the biopsy samples was also blinded to the patients' data and disease. NASH Clinical Research Network Modified Brunt methodology and NASH Activity Score (NAS) were used for staging and grading of NASH, respectively (21). Scores were given according to a scoring system based on 2D-SWE results as follows: five stages of hepatic fibrosis (scored from 0 to 4), percentage of involved portions for hepatic steatosis [scored from 0 to 3 (0, <5%; 1, 5–33%; 2, 34–66%; 3, >66%)], number of diagnosed foci in a ×20 magnitude for lobular inflammation (scored from 0 to 3; 0: none, 1: 1–2, 2: 2–4, 3: >4), and number of ballooned hepatocytes in hepatocellular ballooning (scored from 0 to 2; 0: none, 1: few, 2: many). The total sum of all the above-mentioned scores was reported individually as NAS score for each patient. Based on this, the patients were classified in two groups as follows: no NASH (0–2 points) and definite NASH (21, 22).
Statistical Analysis
Demographic variables were described by descriptive statistics. Mean (standard deviation, SD) and median (interquartile range, IQR) were reported using parametric and non-parametric values, respectively. Spearman's rank correlation coefficient was used to determine the correlation between ordinal variables. To demonstrate the diagnostic accuracy of lipoproteins and define the optimal cutoff point, receiver operating characteristic (ROC) curves were plotted. Sensitivity, specificity, and areas under the ROC curves (AUC) for the corresponding data were also determined by DeLong's method for correlated data. SPSS (version 25) was used for statistical analysis. Subsequently, the predicted lipoprotein cutoffs were constructed, and AUC was calculated. The p-value for all tests, if applicable, was considered significant at the level of 5%.
Results
Patients' Characteristics
Ninety patients were included in the study. Their mean age was 38.5 ± 11.1 years, and the mean BMI was 45.46 ± 6.26 kg/m2. More than half of them (51.9%) had metabolic syndrome, 38 had no fibrosis (F < 1), and 52 had fibrosis (F ≥ 1). Severe steatosis (>66%) was detected in 8.9% patients, and NASH was found in more than half of the patients (Table 1).
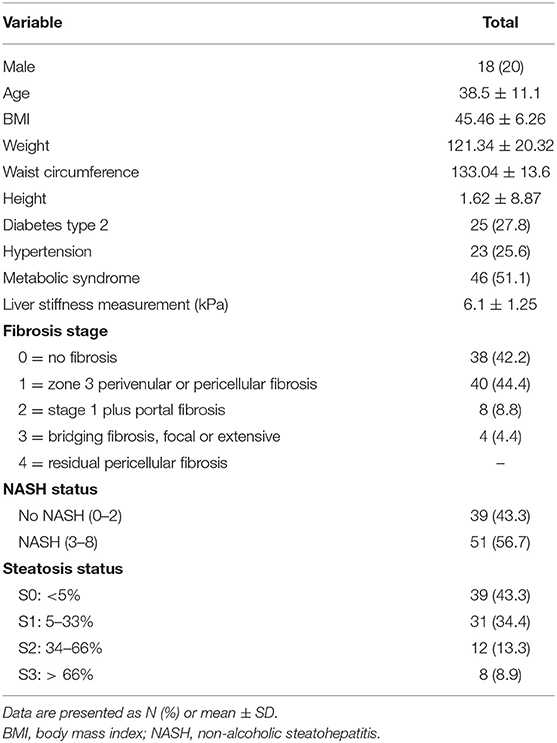
Table 1. Patients' characteristics.
Lipid Profile Parameter Concentration Based on Fatty Liver Disease
A comparison of serum lipids between study groups is presented in Table 2. The mean levels of serum total cholesterol and non-HDL cholesterol in patients with positive histology for liver steatosis and NASH were significantly higher than in patients with negative histology. In patients with positive histology for liver fibrosis, steatosis, and NASH, the mean level of LDL-C was also significantly higher when compared with patients who had negative histology.
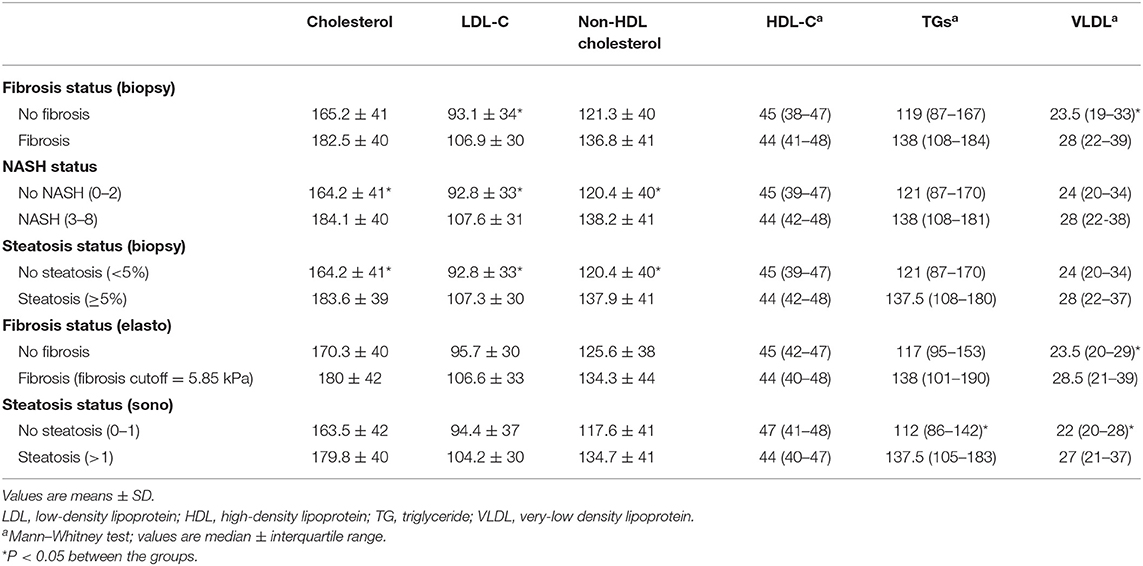
Table 2. The comparison of serum parameter concentration between study groups.
The median serum concentration of HDL-C was not significantly different between the groups, but based on ultrasonography, the median serum triglyceride (TG) level in patients with steatosis was significantly higher than in patients without steatosis. VLDL was also higher in patients who had been diagnosed with steatosis (ultrasonography) and fibrosis (based on histology and elastography).
The Relationship Between Serum Lipids and Liver Status
The relationships between lipid profile and liver fibrosis, NASH, liver steatosis, liver elastography, and ultrasonography are presented in Table 3.
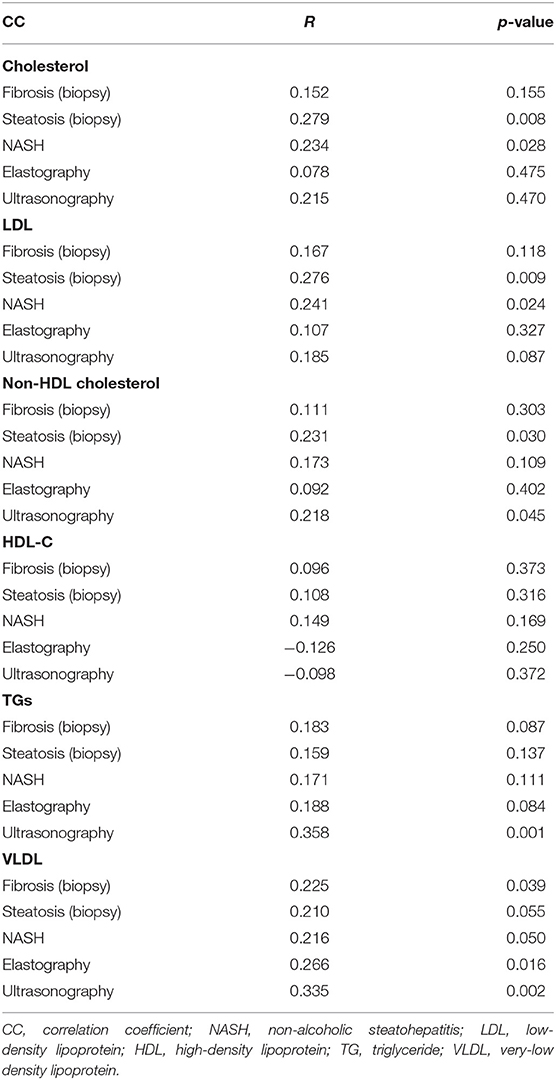
Table 3. Correlation coefficient between parameters.
As seen in Table 3, cholesterol and LDL levels were positively correlated with NASH and steatosis (biopsy). The serum levels of non-HDL cholesterol, TG, and VLDL were positively correlated with steatosis (ultrasonography) (p = 0.045, p = 0.001, and p = 0.002, respectively). Moreover, aside from steatosis (ultrasonography), VLDL was also positively correlated with fibrosis (biopsy) and elastography (p = 0.039 and p = 0.016, respectively).
Diagnostic Importance of Serum Lipids in Assessing Liver Disease
The values were determined using the ROC curves as optimal cutoff points. The sensitivity and specificity for each NASH CRN-modified BRUNT methodology stage are summarized in Table 4 and Figures 1–6.
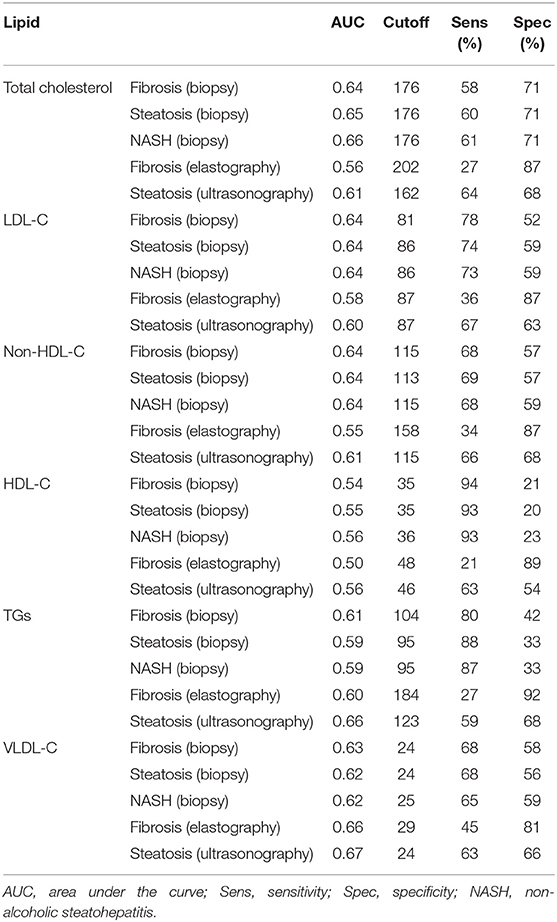
Table 4. Diagnostic accuracy of serum lipids in liver disease.
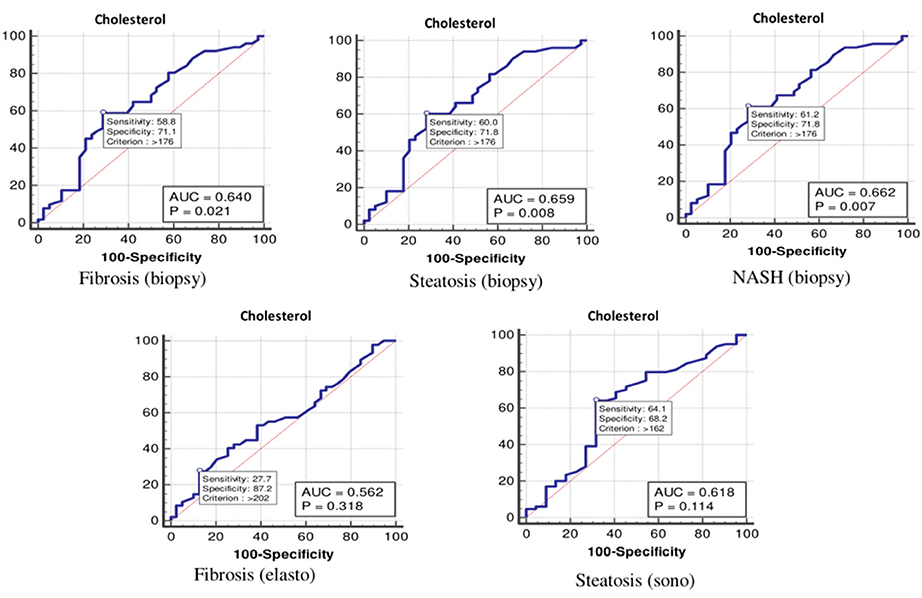
Figure 1. The receiver operating characteristics curve for cholesterol in the detection of liver disease.
Based on the ROC curve, the optimal cutoff values for the total cholesterol level for detecting fibrosis (biopsy), steatosis (biopsy), NASH, fibrosis (elastography), and steatosis (ultrasonography) were 176, 176, 176, 202, and 162 mg/dl, respectively (Table 4 and Figure 1).
As shown in Table 4 and Figure 2, the optimal cutoff values for the LDL-C level for detecting fibrosis (biopsy), steatosis (biopsy), NASH, fibrosis (elastography), and steatosis (ultrasonography) were 81, 86, 86, 87, and 87 mg/dl, and the P-values were 0.022, 0.016, 0.016, 0.157, and 0.188, respectively.
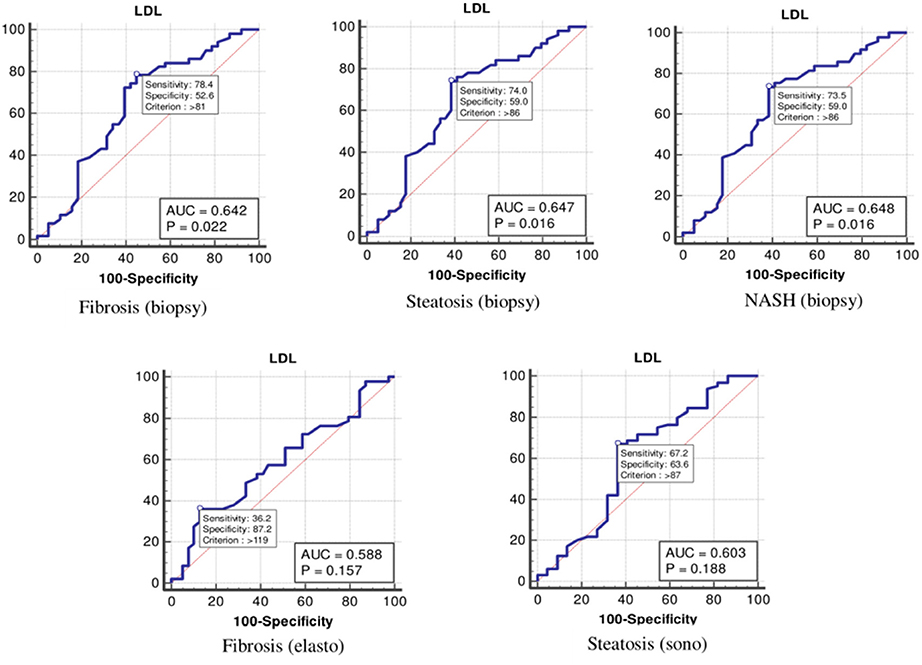
Figure 2. The receiver operating characteristics curve for low-density lipoprotein cholesterol in the detection of liver disease.
According to the ROC curve analysis (Table 4 and Figure 3), the optimal cutoff values of non-HDL cholesterol for liver fibrosis (biopsy), liver steatosis (biopsy), NASH score, liver fibrosis (elastography), and liver steatosis (ultrasonography) were also 115 (p = 0.062), 113 (p = 0.030), 115 (p = 0.030), 158 (p = 0.419), and 115 (p = 0.112) mg/dl, respectively.
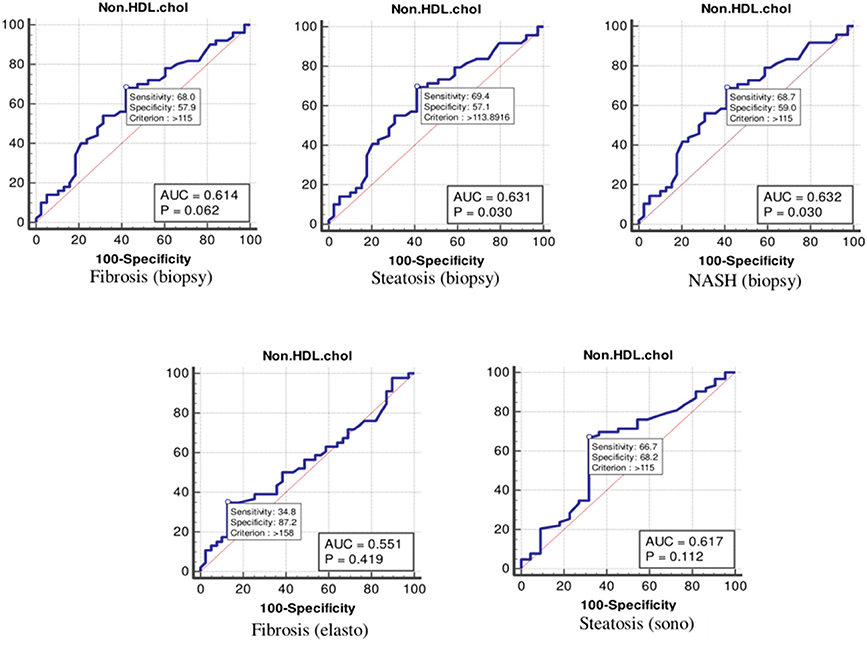
Figure 3. The receiver operating characteristics curve for non-high-density lipoprotein cholesterol in the detection of liver disease.
As Table 4 and Figure 4 show, the optimal cutoff values for the HDL-C level for liver fibrosis (biopsy), liver steatosis (biopsy), NASH score, liver fibrosis (elastography), and liver steatosis (ultrasonography) were 35, 35, 36, 48, and 46 mg/dl, respectively.
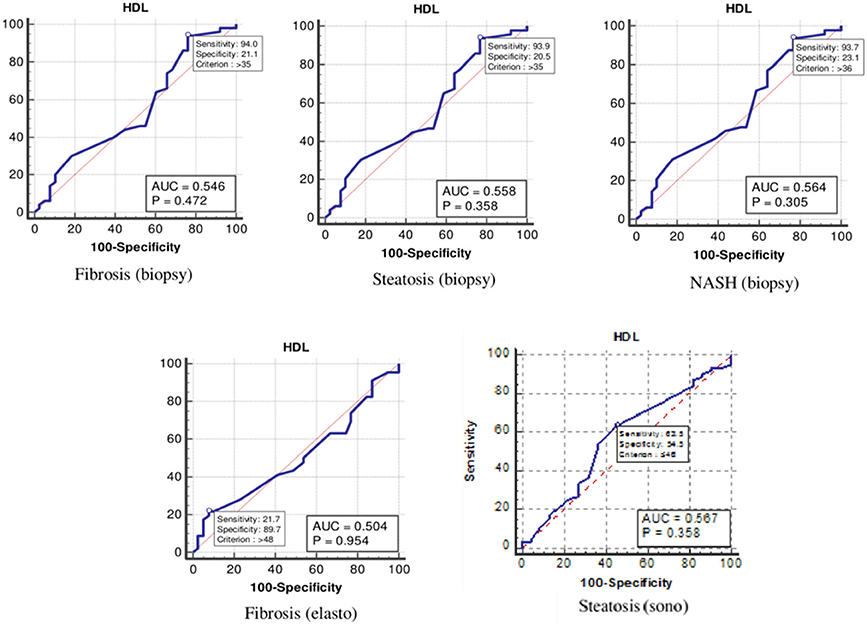
Figure 4. The receiver operating characteristics curve for low-density lipoprotein cholesterol in the detection of liver disease.
Moreover, the ROC curve (Table 4 and Figure 5) indicated that the optimal cutoff values for TGs for liver fibrosis (biopsy), liver steatosis (biopsy), NASH score, liver fibrosis (elastography), and liver steatosis (ultrasonography) were 104 (p = 0.070), 95 (p = 0.127), 95 (p = 0.122), 184 (p = 0.081), and 123 (p = 0.013) mg/dl, respectively.
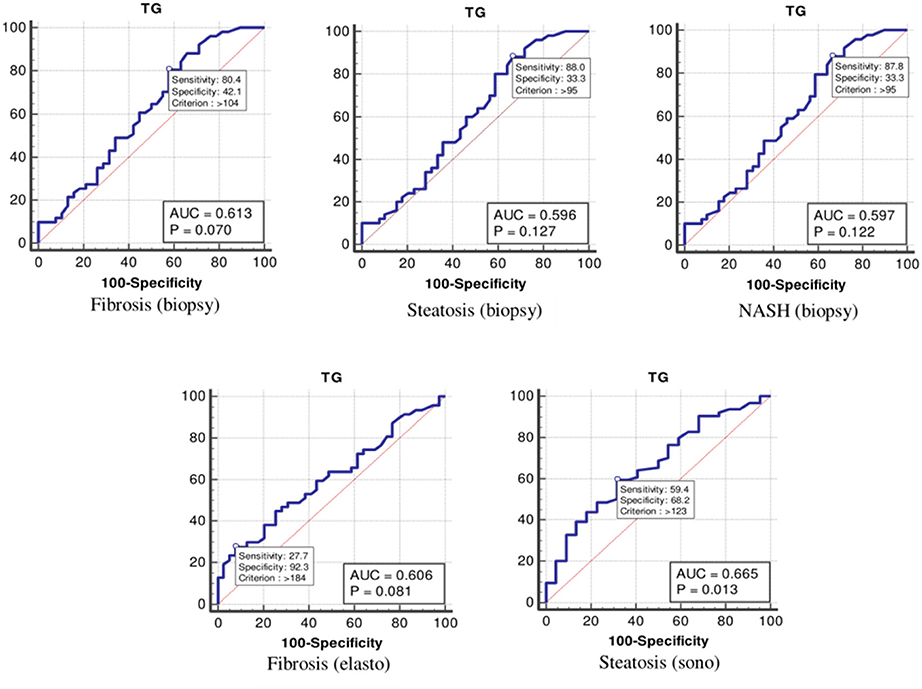
Figure 5. The receiver operating characteristics curve for triglycerides in the detection of liver disease.
Finally, the optimal cutoff values for the VLDL level for liver fibrosis (biopsy), liver steatosis (biopsy), NASH score, liver fibrosis (elastography), and liver steatosis (ultrasonography) were 24, 24, 25, 29, and 24 mg/dl, respectively (Table 4 and Figure 6).
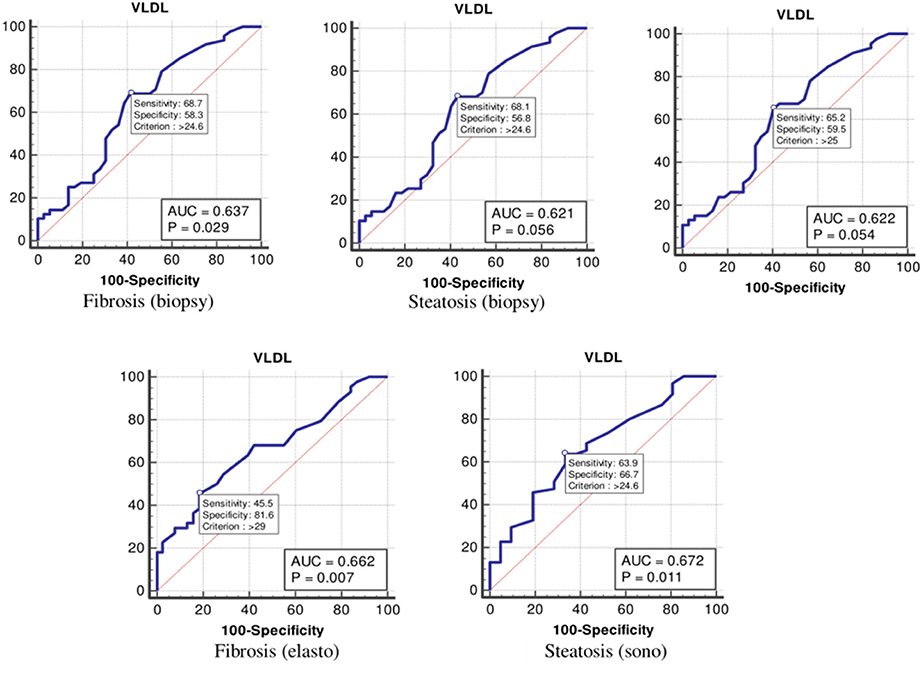
Figure 6. The receiver operating characteristics curve for very low-density lipoprotein in the detection of liver disease.
The Binary Logistic Regression Analysis Between Lipids and Study Parameters
Binary logistic regression analysis for each liver parameter was analyzed after adjusting for age, sex, waist circumference, aspartate aminotransferase, alanine aminotransferase, gamma glutamil transferase, alkaline phosphatase, lipids, and homeostatic model assessment for insulin resistance (Table 5). The binary logistic regression analysis showed that, although some serum lipids were predictive for liver histology in unadjusted models, none of them was a predictive factor in adjusted models.
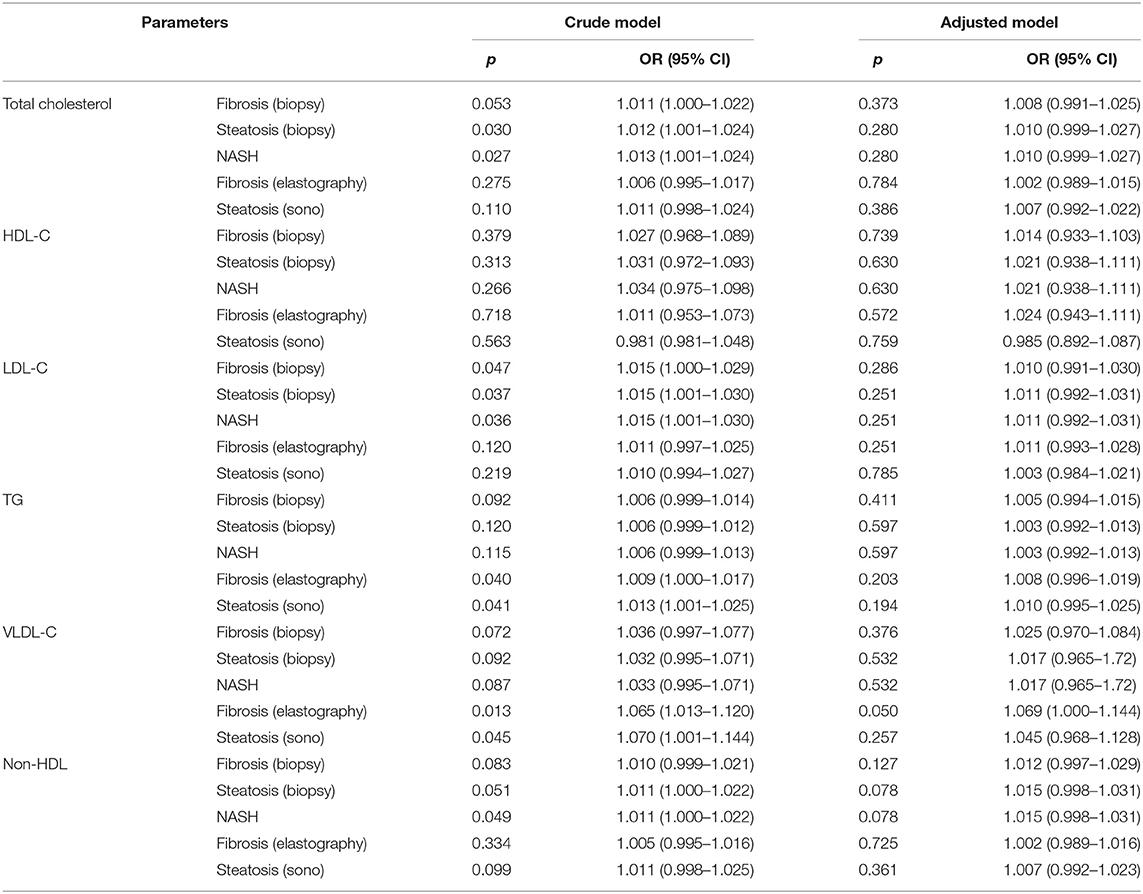
Table 5. The binary logistic regression analysis between lipid profile and liver study parameters.
Discussion
In several studies, obesity is indicated as one of the most crucial risk factors of metabolic disorders. Similarly, in this study, we have identified that about 60% of our morbidly obese population have positive histology of steatosis, NASH, or fibrosis. The results indicated that liver injury and fibrosis could be related to markers of atherogenic risk, especially VLDL serum level. There is also a link between cholesterol and LDL and NASH in this population. On the contrary, there were not any association between HDL level and degree of liver injury. Our findings identified a potential relationship between severity of liver damage and atherogenic lipid profile in morbidly obese patients with biopsy-proven NAFLD, although it was not a prominent correlation. This study principally focuses on association between liver disease severity and dyslipidemia in morbidly obese patients with NAFLD.
The recent broad use of non-invasive techniques in routine clinical practice gradually replaces biopsy due to its limitations. Since NAFLD as well as metabolic syndrome is highly prevalent in Hispanic population, NAFLD and NASH progression will be more predictable within the foreseeable future in this population (23). Due to the high visceral fat distribution in Hispanic population, the risk of NAFLD deterioration will also be increased (23). Consequently, it could be a great development to find a non-invasive screening method for such a high-risk group to reduce more adverse complications (24).
As previously reported, majority of obese patients exhibited a dyslipidemic profile (7, 25). Abnormal lipid panel is more frequent in NAFLD patients, especially with other risk factors such as obesity. It was described that VLDL levels can indicate the severity of liver injury in NAFLD patients (26, 27). Männistö et al. revealed a significant association between serum LDL and VLDL subclasses with inflammation and liver damage. Méndez-Sánchez et al. also showed that steatohepatitis and liver fibrosis are more likely to have high VLDL and LDL serum concentration than simple steatosis (24). Similarly, we investigated the relationship of VLDL cholesterol level to liver fibrosis. Both cholesterol metabolism and inflammation in the liver are potentially linked together.
Atherogenic dyslipidemia, which is described as hypertriglyceridemia, low HDL-C levels, and high LDL-C levels, is the most frequent type of lipid abnormality in NAFLD. Previous studies demonstrated that decreased serum HDL- C levels were associated with an occurrence of NAFLD, which agreed with NAFLD (28, 29). However, in this study, there was no significant association between HDL-C level and stages of NAFLD.
It is becoming increasingly evident that NAFLD is a multifactorial disease strongly related to genetic and metabolic disorders including obesity, dyslipidemia, insulin resistance, and cardiovascular diseases (30, 31). Non-invasive techniques such as in routine NAFLD screening, even in patients with risk factors, have some limitations for the assessment of NASH and liver fibrosis (32). In the same token, abnormal lipid profile is not an acceptable predictor of NAFLD in our obese patients. It has less diagnostic performance than liver biopsy as a gold-standard diagnostic modality. Accordingly, a combination of non-invasive approaches tend to have a higher accuracy in predicting liver damage than using the sole method.
It should be noted that our population was not uniform in terms of the stage of liver injury. Considering that liver damage tends to be in the lower grade, the presentation of dyslipidemia may be mild or not significant. Furthermore, there is a mix of comorbidities in this morbidly obese population, which makes it difficult to discriminate each comorbidity as a single risk factor.
Conclusion
Although we showed that evaluating lipid profile could help in NAFLD evaluation in morbidly obese patients for disease progression, their slight predictive value is not sufficiently enough for it to be used solely as a non-invasive test in NASH or NAFLD fibrosis. Therefore, early diagnosis of NAFLD using a cost-effective diagnostic approach is needed.
Data Availability Statement
The raw data associated with this study will be available from the corresponding author upon a reasonable request.
Ethics Statement
All procedures performed in this study were in accordance with the ethical standards of the institutional and/or national research committee and with the 1964 Helsinki Declaration and its later amendments or comparable ethical standards. The patients/participants provided their written informed consent to participate in this study.
Author Contributions
AS and MN conceived the study. NG, TJ, MK-R, MA, and ŽR wrote the manuscript. AS, AM, AJ, and LG revised the manuscript draft. All authors approved the final version and agreed with submission.
Funding
This study was supported by the Russian Science Foundation (Grant #20-15-00264).
Conflict of Interest
The authors declare that the research was conducted in the absence of any commercial or financial relationships that could be construed as a potential conflict of interest.
Acknowledgments
The authors would like to thank the Research Deputy at the Mashhad University of Medical Sciences.
Abbreviations
AST, aspartate aminotransferase; ALT, alanine aminotransferase; ALP, alkaline phosphatase; AUROCs, areas under the ROC curves; BMI, body mass index; GGT, gamma glutamil transferase; HOMA-IR, homeostatic model assessment for insulin resistance; HDL-c, high-density lipoprotein cholesterol; HBV, hepatitis B virus; HCV, hepatitis C virus; IQR, interquartile range; LSM, liver stiffness measurement; LSE, liver stiffness evaluation; LDL-c, low-density lipoprotein cholesterol; kPa, kilopascals; NAFLD, non-alcoholic fatty liver disease; NASH, non-alcoholic steatohepatitis; NAS, NASH Activity Score; ROC, receiver operating characteristic; TG, triglycerides; 2D-SWE, two-dimensional shear wave elastography; VLDL, very low-density lipoprotein; WC, waist circumference.
References
1. Michelotti GA, Machado MV, Diehl AM. NAFLD, NASH and liver cancer. Nat Rev Gastroenterol Hepatol. (2013) 10:656–65. doi: 10.1038/nrgastro.2013.183
2. Orešič M, Hyötyläinen T, Kotronen A, Gopalacharyulu P, Nygren H, Arola J, et al. Prediction of non-alcoholic fatty-liver disease and liver fat content by serum molecular lipids. Diabetologia. (2013) 56:2266–74. doi: 10.1007/s00125-013-2981-2
3. Byrne CD, Targher G. NAFLD: a multisystem disease. J Hepatol. (2015) 62:S47–64. doi: 10.1016/j.jhep.2014.12.012
4. Le MH, Devaki P, Ha NB, Jun DW, Te HS, Cheung RC, et al. Prevalence of non-alcoholic fatty liver disease and risk factors for advanced fibrosis and mortality in the United States. PLoS ONE. (2017) 12:e0173499. doi: 10.1371/journal.pone.0173499
5. Targher G, Day CP, Bonora E. Risk of cardiovascular disease in patients with nonalcoholic fatty liver disease. N Engl J Med. (2010) 363:1341–50. doi: 10.1056/NEJMra0912063
6. Marcuccilli M, Chonchol M. NAFLD and chronic kidney disease. Int J Mol Sci. (2016) 17:562. doi: 10.3390/ijms17040562
7. Chen Z, Qin H, Qiu S, Chen G, Chen Y. Correlation of triglyceride to high-density lipoprotein cholesterol ratio with nonalcoholic fatty liver disease among the non-obese Chinese population with normal blood lipid levels: a retrospective cohort research. Lipids Health Dis. (2019) 18:1–7. doi: 10.1186/s12944-019-1104-6
8. Cotter TG, Rinella M. Nonalcoholic fatty liver disease 2020: the state of the disease. Gastroenterology. (2020) 158:1851–64. doi: 10.1053/j.gastro.2020.01.052
9. Kim CH, Younossi ZM. Nonalcoholic fatty liver disease: a manifestation of the metabolic syndrome. Cleve Clin J Med. (2008) 75:721–8. doi: 10.3949/ccjm.75.10.721
10. Paschos P, Paletas K. Non alcoholic fatty liver disease and metabolic syndrome. Hippokratia. (2009) 13:9–19.
11. Kim D, Kim WR. Nonobese fatty liver disease. Clin Gastroenterol Hepatol. (2017) 15:474–85. doi: 10.1016/j.cgh.2016.08.028
12. Wong VWS, Wong GLH, Chan RSM, Shu SST, Cheung BHK, Li LS, et al. Beneficial effects of lifestyle intervention in non-obese patients with non-alcoholic fatty liver disease. J Hepatol. (2018) 69:1349–56. doi: 10.1016/j.jhep.2018.08.011
13. Sumida Y, Nakajima A, Itoh Y. Limitations of liver biopsy and non-invasive diagnostic tests for the diagnosis of nonalcoholic fatty liver disease/nonalcoholic steatohepatitis. World J Gastroenterol. (2014) 20:475–85. doi: 10.3748/wjg.v20.i2.475
14. Burt AD, Lackner C, Tiniakos DG. Diagnosis and assessment of NAFLD: definitions and histopathological classification. Semin Liver Dis. (2015) 35:207–20. doi: 10.1055/s-0035-1562942
15. Fierabracci P, Tamberi A, Santini F. Obesity-related comorbidities. In: Lucchese M, Scopinaro N, editors. Minimally Invasive Bariatric and Metabolic Surgery: Principles and Technical Aspects. Cham: Springer International Publishing (2015). p. 25–34.
16. Shahab O, Biswas R, Paik J, Bush H, Golabi P, Younossi ZM. Among patients with NAFLD. Treatment of dyslipidemia does not reduce cardiovascular mortality. Hepatol Commun. (2018) 2:1227–34. doi: 10.1002/hep4.1241
17. Imajo K, Hyogo H, Yoneda M, Honda Y, Kessoku T, Tomeno W, et al. LDL-migration index (LDL-MI), an indicator of small dense low-density lipoprotein (sdLDL), is higher in non-alcoholic steatohepatitis than in non-alcoholic fatty liver: a multicenter cross-sectional study. PLoS ONE. (2014) 9:e115403. doi: 10.1371/journal.pone.0115403
18. Sun DQ, Liu WY, Wu SJ, Zhu GQ, Braddock M, Zhang DC, et al. Increased levels of low-density lipoprotein cholesterol within the normal range as a risk factor for nonalcoholic fatty liver disease. Oncotarget. (2016) 7:5728–37. doi: 10.18632/oncotarget.6799
19. Sun DQ, Wu SJ, Liu WY, Wang LR, Chen YR, Zhang DC, et al. Association of low-density lipoprotein cholesterol within the normal range and NAFLD in the non-obese Chinese population: a cross-sectional and longitudinal study. BMJ Open. (2016) 6:e013781. doi: 10.1136/bmjopen-2016-013781
20. Fan N, Peng L, Xia Z, Zhang L, Song Z, Wang Y, et al. Triglycerides to high-density lipoprotein cholesterol ratio as a surrogate for nonalcoholic fatty liver disease: a cross-sectional study. Lipids Health Dis. (2019) 18:39. doi: 10.1186/s12944-019-0986-7
21. Jo V. Cytopathology, An Issue of Surgical Pathology Clinics. Amsterdam: Elsevier Health Sciences (2018).
22. Park CC, Nguyen P, Hernandez C, Bettencourt R, Ramirez K, Fortney L, et al. Magnetic resonance elastography vs transient elastography in detection of fibrosis and noninvasive measurement of steatosis in patients with biopsy-proven nonalcoholic fatty liver disease. Gastroenterology. (2017) 152:598–607.e592. doi: 10.1053/j.gastro.2016.10.026
23. Pan JJ, Fallon MB. Gender and racial differences in nonalcoholic fatty liver disease. World J Hepatol. (2014) 6:274. doi: 10.4254/wjh.v6.i5.274
24. Méndez-Sánchez N, Cerda-Reyes E, Higuera-De-La-Tijera F, Salas-García AK, Cabrera-Palma S, Cabrera-Álvarez G, et al. Dyslipidemia as a risk factor for liver fibrosis progression in a multicentric population with non-alcoholic steatohepatitis. F1000Res. (2020) 9:56. doi: 10.12688/f1000research.21918.1
25. Godoy-Matos AF, Júnior WSS, Valerio CM. NAFLD as a continuum: from obesity to metabolic syndrome and diabetes. Diabetol Metab Syndr. (2020) 12:1–20. doi: 10.1186/s13098-020-00570-y
26. Fujita K, Nozaki Y, Wada K, Yoneda M, Fujimoto Y, Fujitake M, et al. Dysfunctional very-low-density lipoprotein synthesis and release is a key factor in nonalcoholic steatohepatitis pathogenesis. Hepatology. (2009) 50:772–80. doi: 10.1002/hep.23094
27. Jiang ZG, Tapper EB, Connelly MA, Pimentel CF, Feldbrügge L, Kim M, et al. Steatohepatitis and liver fibrosis are predicted by the characteristics of very low density lipoprotein in nonalcoholic fatty liver disease. Liver Int. (2016) 36:1213–20. doi: 10.1111/liv.13076
28. Souza MR, Diniz MD, Medeiros-Filho JE, Araújo MS. Metabolic syndrome and risk factors for non-alcoholic fatty liver disease. Arquivos Gastroenterol. (2012) 49:89–96. doi: 10.1590/S0004-28032012000100015
29. Peng K, Mo Z, Tian G. Serum lipid abnormalities and nonalcoholic fatty liver disease in adult males. Am J Med Sci. (2017) 353:236–41. doi: 10.1016/j.amjms.2017.01.002
30. Zhang QQ, Lu LG. Nonalcoholic Fatty liver disease: dyslipidemia, risk for cardiovascular complications, treatment strategy. J Clin Transl Hepatol. (2015) 3:78–84. doi: 10.14218/JCTH.2014.00037
31. Deprince A, Haas JT, Staels B. Dysregulated lipid metabolism links NAFLD to cardiovascular disease. Mol Metab. (2020) 42:101092. doi: 10.1016/j.molmet.2020.101092
Keywords: morbid obesity, non-alcoholic fatty liver disease, two-dimensional shear wave elastography, dyslipidemia, non-alcohol based steatohepatitis
Citation: Ganjooei NA, Jamialahmadi T, Nematy M, Jangjoo A, Goshayeshi L, Khadem-Rezaiyan M, Reiner Ž, Alidadi M, Markin AM and Sahebkar A (2021) The Role of Lipid Profile as an Independent Predictor of Non-alcoholic Steatosis and Steatohepatitis in Morbidly Obese Patients. Front. Cardiovasc. Med. 8:682352. doi: 10.3389/fcvm.2021.682352
Received: 18 March 2021; Accepted: 12 April 2021;
Published: 31 May 2021.
Edited by:
Michael Bukrinsky, George Washington University, United StatesReviewed by:
Evgeny Bezsonov, Russian Academy of Medical Sciences, RussiaМаргарита Сазонова, Institute of General Pathology and Pathophysiology and National Medical Research Center of Cardiology, Russia
Copyright © 2021 Ganjooei, Jamialahmadi, Nematy, Jangjoo, Goshayeshi, Khadem-Rezaiyan, Reiner, Alidadi, Markin and Sahebkar. This is an open-access article distributed under the terms of the Creative Commons Attribution License (CC BY). The use, distribution or reproduction in other forums is permitted, provided the original author(s) and the copyright owner(s) are credited and that the original publication in this journal is cited, in accordance with accepted academic practice. No use, distribution or reproduction is permitted which does not comply with these terms.
*Correspondence: Amirhossein Sahebkar, c2FoZWJrYXJhQG11bXMuYWMuaXI=; YW1pcl9zYWhlYjIwMDBAeWFob28uY29t