 Zhi-qiang Liu1†
 Zhi-wen Huang1†
 Shu-ling Kang2,3†
 Chan-chan Hu1
 Fa Chen1
 Fei He1
 Zheng Lin1
 Feng Yang4*
 Zhi-jian Hu1*
- 1Department of Epidemiology and Health Statistics, School of Public Health, Fujian Medical University, Fuzhou, China
- 2Fuzhou Center for Disease Control and Prevention, Fuzhou, China
- 3Department of Preventive Medicine, School of Public Health, Fujian Medical University, Fuzhou, China
- 4Department of Nephrology, Affiliated Fuzhou First Hospital of Fujian Medical University, Fuzhou, China
Background: Studies have shown inconsistent associations between serum uric acid (SUA) levels and mortality in peritoneal dialysis (PD) patients. We conducted this meta-analysis to determine whether SUA levels were associated with cardiovascular or all-cause mortality in PD patients.
Methods: PubMed, Embase, Web of Science, the Cochrane Library, CNKI, VIP, Wanfang Database, and trial registry databases were systematically searched up to April 11, 2021. Cohort studies of SUA levels and cardiovascular or all-cause mortality in PD patients were obtained. Random effect models were used to calculate the pooled adjusted hazard ratio (HR) and corresponding 95% confidence interval (CI). Sensitivity analyses were conducted to assess the robustness of the pooled results. Subgroup analyses and meta-regression analyses were performed to explore the sources of heterogeneity. Funnel plots, Begg's tests, and Egger's tests were conducted to evaluate potential publication bias. The GRADE approach was used to rate the certainty of evidence. This study was registered with PROSPERO, CRD42021268739.
Results: Seven studies covering 18,113 PD patients were included. Compared with the middle SUA levels, high SUA levels increased the risk of all-cause mortality (HR = 1.74, 95%CI: 1.26–2.40, I2 = 34.8%, τ2 = 0.03), low SUA levels were not statistically significant with the risk of all-cause or cardiovascular mortality (HR = 1.04, 95%CI: 0.84–1.29, I2 = 43.8%, τ2 = 0.03; HR = 0.89, 95%CI: 0.65–1.23, I2 = 36.3%, τ2 = 0.04; respectively). Compared with the low SUA levels, high SUA levels were not statistically associated with an increased risk of all-cause or cardiovascular mortality (HR = 1.19, 95%CI: 0.59–2.40, I2 = 88.2%, τ2 = 0.44; HR = 1.22, 95%CI: 0.39–3.85, I2 = 89.3%, τ2 = 0.92; respectively).
Conclusion: Compared with middle SUA levels, high SUA levels are associated with an increased risk of all-cause mortality in PD patients. SUA levels may not be associated with cardiovascular mortality. More high-level studies, especially randomized controlled trials, are needed to determine the association between SUA levels and cardiovascular or all-cause mortality in PD patients.
Systematic Review Registration: https://www.crd.york.ac.uk/prospero/display_record.php?ID=CRD42021268739, identifier: CRD42021268739.
Introduction
Chronic kidney disease (CKD) has become one of the most critical public health problems globally. The global prevalence of CKD is estimated at 13.4%, which is likely to rise further as the population ages and diabetes increases (1). In 2017, about 1.2 million people died of CKD worldwide, with a 41.5% increase in global mortality between 1990 and 2017 (2). End-stage renal disease (ESRD) is a critical aspect of the severe burden of CKD. The treatment of ESRD includes supportive care and renal replacement therapy, including hemodialysis (HD), peritoneal dialysis (PD), and renal transplantation (3). Liyanage et al. (4) reported ESRD renal replacement therapy data in 123 countries or regions, and the results showed that about 2.62 million patients received renal replacement therapy in 2010, including about 2.05 million dialysis patients. In the world, PD is not as extensive as HD. In a survey of 125 countries, PD and HD can be implemented in 95 (76%) and 119 (95%) countries, respectively (5). However, compared with HD, PD has characteristics of the lower cost, the convenience of home therapy, and a flexible schedule (6). Recent studies have consistently shown that PD patients have higher early survival than HD patients (7–9).
Uric acid is the ultimate oxidation product of purine catabolism in humans, including exogenous and endogenous purine metabolism (10, 11). Hyperuricemia is one of the risk factors for kidney disease, diabetes, and hypertension (12, 13). High uric acid levels can also lead to increased all-cause mortality of obesity (14) and chronic heart failure (15). Two-thirds of uric acid is excreted in the urine (16). Uric acid levels are often elevated in patients with CKD due to decreased renal function. Meta-analyses of CKD patients have shown a U-shaped trend between SUA and all-cause mortality (17), and higher SUA levels are significantly associated with increased risk of cardiovascular mortality (18). Another meta-analysis of HD patients has shown that high SUA levels are a protective factor for cardiovascular mortality (19). However, there is no meta-analysis about the association between SUA levels and mortality in PD patients.
The association between SUA levels and all-cause mortality in PD patients is inconsistent. Feng et al. (20) found that high SUA was associated with increased all-cause mortality; Lai et al. (21) found that high SUA was associated with low risk of all-cause mortality; while Sugano et al. (22) found a U-shaped relationship between SUA levels and all-cause mortality. Similarly, the association between SUA levels and cardiovascular mortality in PD patients is controversial. Lai et al. (21) found that high SUA levels were associated with low risk of cardiovascular mortality; Xia et al. (23) found that the higher the SUA levels, the higher the cardiovascular mortality; while Xiang et al. (24) found that there was no significant relationship between SUA levels and cardiovascular mortality. Therefore, we performed a systematic review and meta-analysis to summarize the relevant studies and clarify the association between SUA levels and cardiovascular or all-cause mortality in PD patients. The objective of the meta-analysis can be described in the form of a PI(E)CO statement as follows: in peritoneal dialysis patients (population), how do different baseline serum uric acid levels (low vs. middle, high vs. middle, high vs. low) (exposure vs. comparator) influence the cardiovascular or all-cause mortality (outcomes)?
Materials and Methods
This study was conducted following the Preferred Reporting Items for Systematic reviews and Meta-Analyses (PRISMA) statement (25). The protocol was registered at PROSPERO (CRD42021268739, https://www.crd.york.ac.uk/prospero/display_record.php?ID=CRD42021268739).
Literature Search
We systematically searched PubMed, Embase, Web of Science, the Cochrane Library, Chinese National Knowledge Infrastructure (CNKI), Chinese Scientific Journal Database (VIP), and Wanfang Database to identify relevant studies up to April 11, 2021. We used the following search strategies to retrieve articles: (“uric acid” OR hyperuricemia OR urate) AND (peritoneal dialysis OR dialysis) AND (mortality OR death OR survival OR prognosis OR outcome OR cardiovascular disease OR cardiovascular events OR stroke). Besides, we searched the clinical trial registries (https://www.clinicaltrials.gov/) using the keywords of “uric acid” and “peritoneal dialysis” to identify the relevant unpublished studies. We also manually checked the reference lists of retrieved studies to identify potentially missing relevant studies.
Inclusion and Exclusion Criteria
Inclusion criteria: (1) cohort study design; (2) patients with chronic kidney disease receiving peritoneal dialysis (which uses the peritoneum as a dialysis membrane by means of dispersion and ultrafiltration) (26); (3) available baseline data of SUA levels; (4) determining the effect of baseline SUA on prognosis, with an effect size of HR; (5) outcome included cardiovascular or all-cause mortality.
Exclusion criteria: (1) letters, animal studies, reviews, conference reports, meta-analyses; (2) when the same population appeared in different studies, only the one with the longest follow-up period or the most information was included.
SUA levels were used as a categorical variable divided into low, middle, and high levels. The classification of SUA levels was based on the definition in each original study. The lowest uric acid group was defined as low level, the highest uric acid group was defined as high level, and the middle uric acid group was defined as middle level.
Data Extraction
Two reviewers independently screened each record and extracted data from eligible studies, and any discrepancies were resolved by a comprehensive discussion and reviewed by a third investigator. Extraction of information included the first author, publication year, country, sample size, age, male proportion, the proportions of hypertension and diabetes, baseline uric acid, follow-up period, all-cause and cardiovascular death, comparison, adjusted HR and 95%CI (the most fully adjusted), and adjusted factors.
Quality Assessment
The Newcastle-Ottawa Scale (NOS) criteria for cohort studies were used to assess the quality of each included study. The following eight items were evaluated: (1) representativeness of the exposed cohort; (2) selection of the non-exposed cohort; (3) ascertainment of exposure; (4) demonstration that outcome of interest was not present at start of study; (5) comparability of cohorts on the basis of the design or analysis; (6) assessment of outcome; (7) was follow-up long enough for outcomes to occur; (8) adequacy of follow up of cohorts. Selection, comparability, and outcome are three aspects of the NOS criteria. Nine points are the highest score, and the overall quality scores can be divided into good (7–9 points), average (4–6 points), and poor (0–3 points).
The rating of the overall quality of the evidence was undertaken using the Grades of Recommendation, Assessment, Development, and Evaluation (GRADE) approach applied to prognostic studies (27).
The appraisals were processed independently by two reviewers, and the final results were obtained by consensus.
Statistical Analysis
We used Stata 15.0 (Stata Corp, College Station, TX, USA) for statistical analysis, and all tests were two-tailed. We calculated the significance of the pooled HR by Z-test, and P < 0.05 was considered statistically significant. We used the Q-test, I2 statistics, and Tau-squared (τ2) to judge the magnitude of heterogeneity among studies. We applied the random-effects model to calculate pooled HR and further used the meta-regression to explore the sources of heterogeneity. Subgroup analyses were performed by male proportion, sample size, hypertension proportion, and diabetes mellitus proportion. Sensitivity analyses were conducted by omitting each study to assess the robustness of the pooled results. The potential publication bias was qualitatively evaluated by funnel plots and further quantitatively evaluated by Begg's test (28) and Egger's test (29). If publication bias was present, results were adjusted using the trim and fill method (30).
Results
Summary of the Included Studies
Two thousand six hundred forty-four and 6 records were originally identified through databases and registers searching. After removing duplicates, 1,713 records were further reviewed. Based on the eligibility criteria, 1,700 records were excluded after screening titles and abstracts, 13 full-text articles were further assessed for eligibility, 6 articles were excluded with reasons. Finally, 7 eligible studies were included in the meta-analysis (20–24, 31, 32), including 7 for all-cause mortality (20–24, 31, 32) and 4 for cardiovascular mortality (21, 23, 24, 31) (Figure 1).
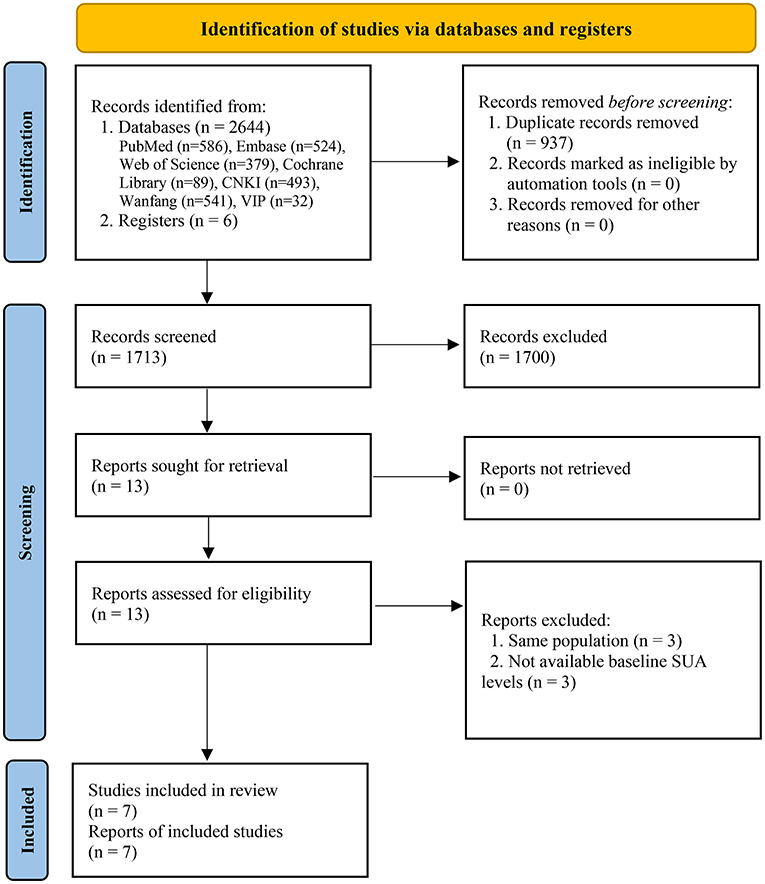
Figure 1. Flow diagram of systematic literature search.
The included studies encompassed 18,113 patients with all-cause mortality data and 13,075 patients with cardiovascular mortality data. All seven studies reported sample size, mean age, baseline SUA, and follow-up period. The sample size of studies ranged from 140 to 9,405. The proportion of males, hypertension, and diabetes ranged from 45 to 63%, 65.7 to 94.3%, and 12.2 to 37.9%, respectively. All studies provided adjusted HR (95%CI) and adjusted factors (Table 1).
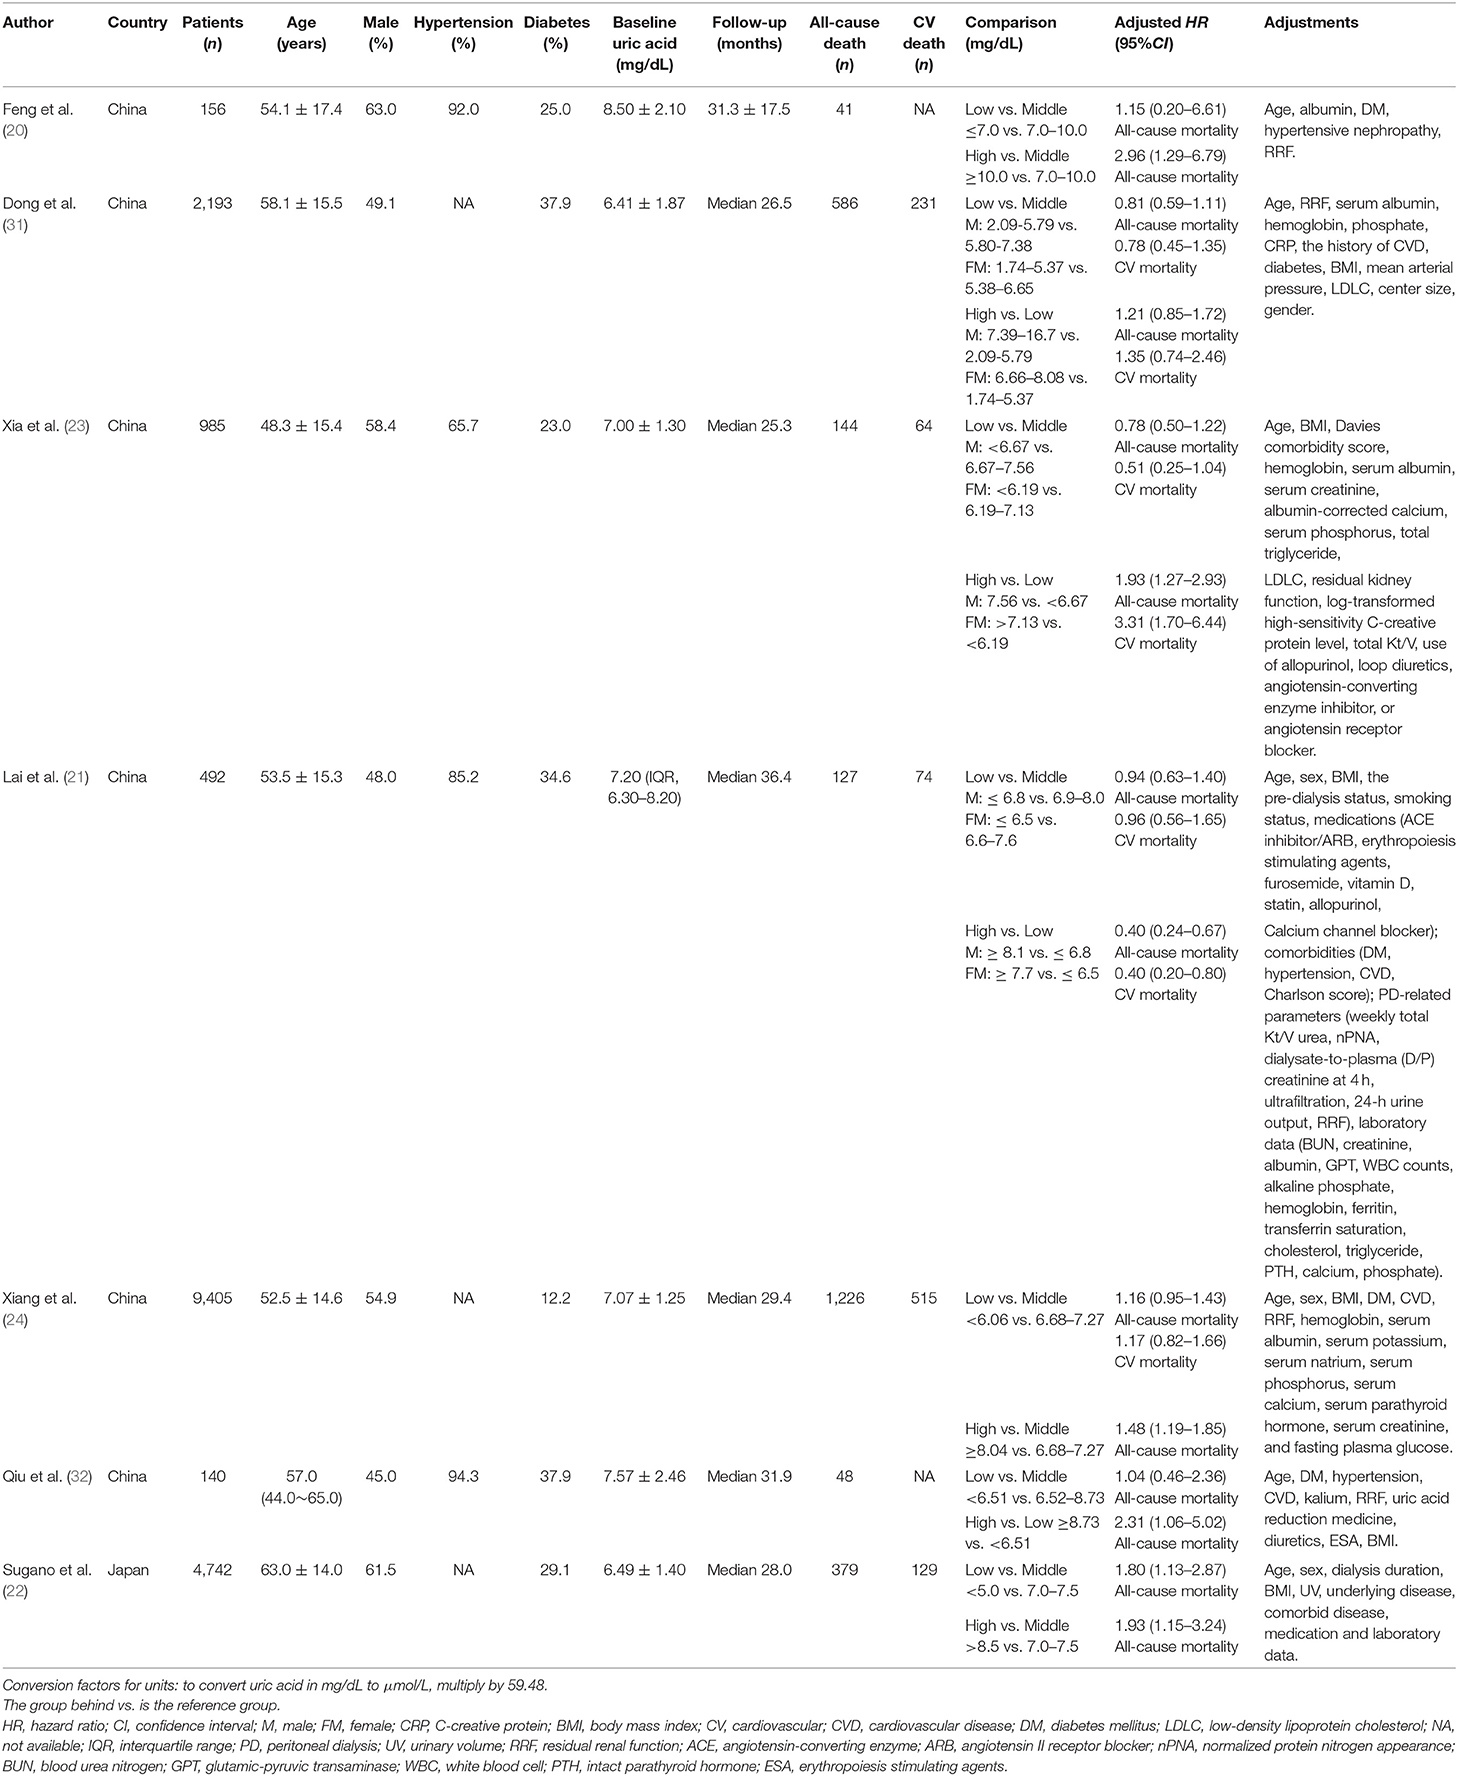
Table 1. Characteristics of 7 studies included in the meta-analysis.
Quality Assessment
All original studies included in this meta-analysis were cohort study designs, and their quality was assessed according to the NOS criteria. All studies were evaluated seven scores or above and rated as good. The details of the NOS scores were summarized in Table 2.
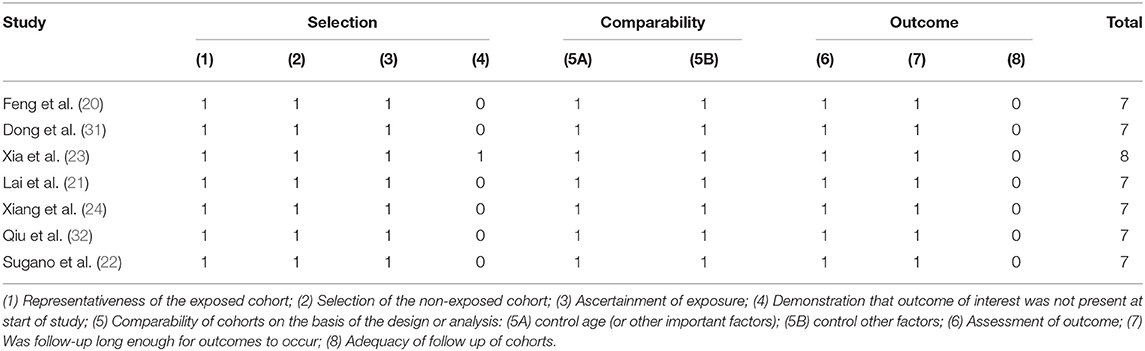
Table 2. Newcastle-Ottawa Scale of included studies.
Serum Uric Acid Levels and All-Cause Mortality
All seven studies reported the association between SUA levels and all-cause mortality in PD patients. The pooled results showed that compared with middle SUA levels, low SUA levels were not statistically significant in the increased risk of all-cause mortality (HR = 1.04, 95%CI: 0.84–1.29, I2 = 43.8%, τ2 = 0.03), but the high SUA levels increased the risk of all-cause mortality (HR = 1.74, 95%CI: 1.26–2.40, I2 = 34.8%, τ2 = 0.03). Compared with low SUA levels, high SUA levels were not statistically significant with an increased risk of all-cause mortality (HR = 1.19, 95%CI: 0.59–2.40, I2 = 88.2%, τ2 = 0.44) (Figures 2A–C).
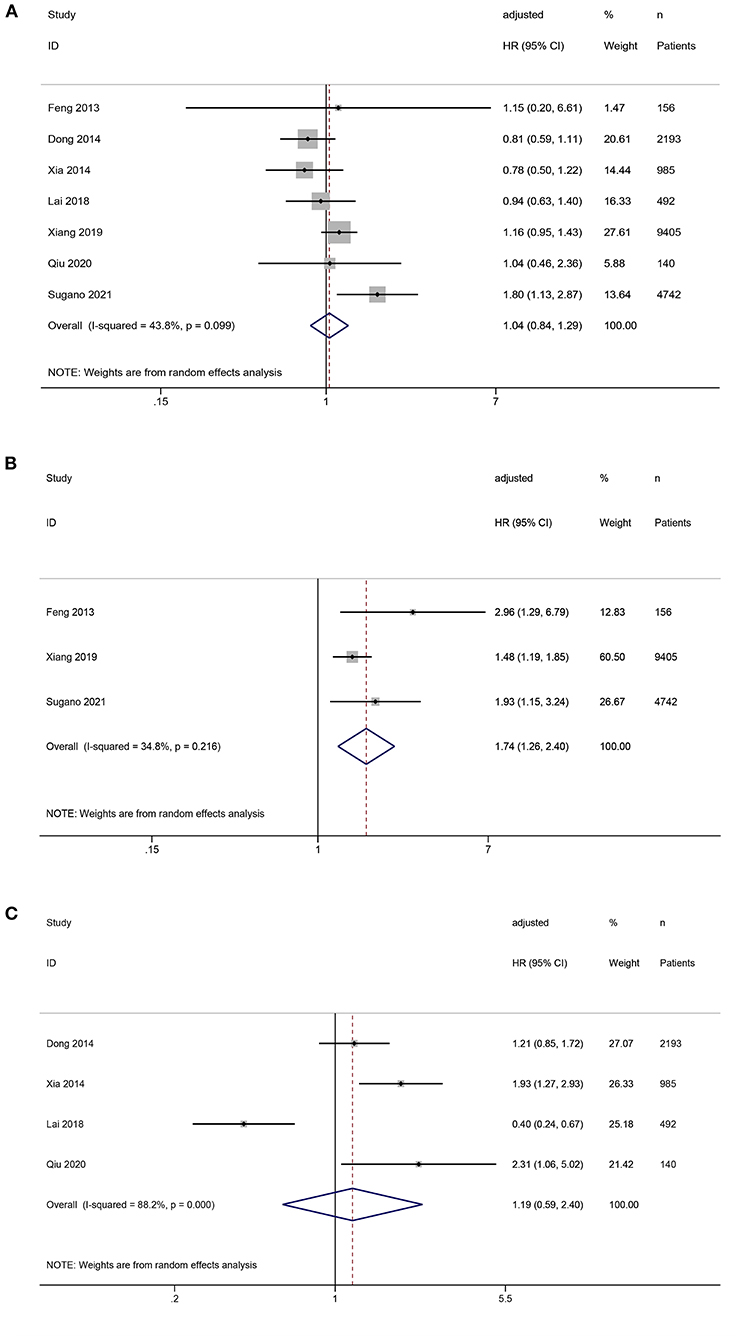
Figure 2. Forest plot of the association between serum uric acid levels and all-cause mortality in PD patients. (A) low vs. middle; (B) high vs. middle; (C) high vs. low.
Serum Uric Acid Levels and Cardiovascular Mortality
Four studies reported the association between SUA levels and cardiovascular mortality in PD patients. Compared with middle SUA levels, low SUA levels were not associated with a statistically significant risk of cardiovascular mortality (HR = 0.89, 95%CI: 0.65–1.23, I2 = 36.3%, τ2 = 0.04). Compared with the low SUA levels, high SUA levels were not statistically associated with an increased risk of cardiovascular mortality (HR = 1.22, 95%CI: 0.39–3.85, I2 = 89.3%, τ2 = 0.92) (Figures 3A,B).
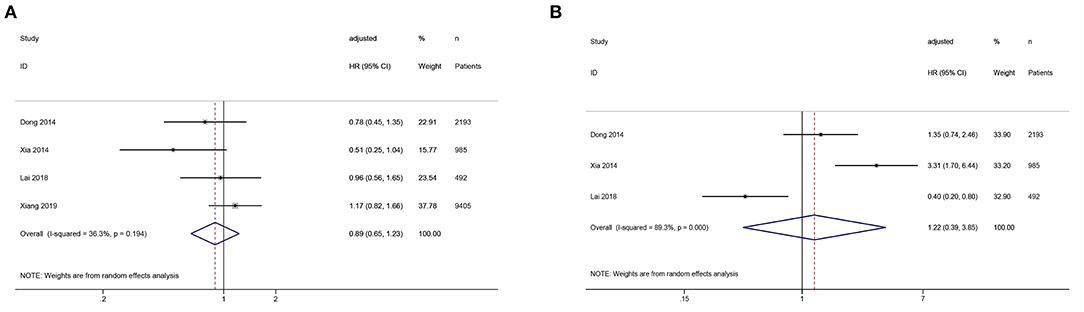
Figure 3. Forest plot of the association between serum uric acid levels and cardiovascular mortality in PD patients. (A) low vs. middle; (B) high vs. low.
Sensitivity Analysis
Sensitivity analyses of the association between SUA levels (low vs. middle) and all-cause or cardiovascular mortality showed that omitting individual studies had no significant effect on the pooled results, suggesting good stability of the results (Figures 4A,C). Sensitivity analysis of the association between SUA levels (high vs. low) and all-cause mortality showed that the pooled result was significantly influenced by omitting Lai's study (21), indicating the stability of the result was relatively poor (Figure 4B).
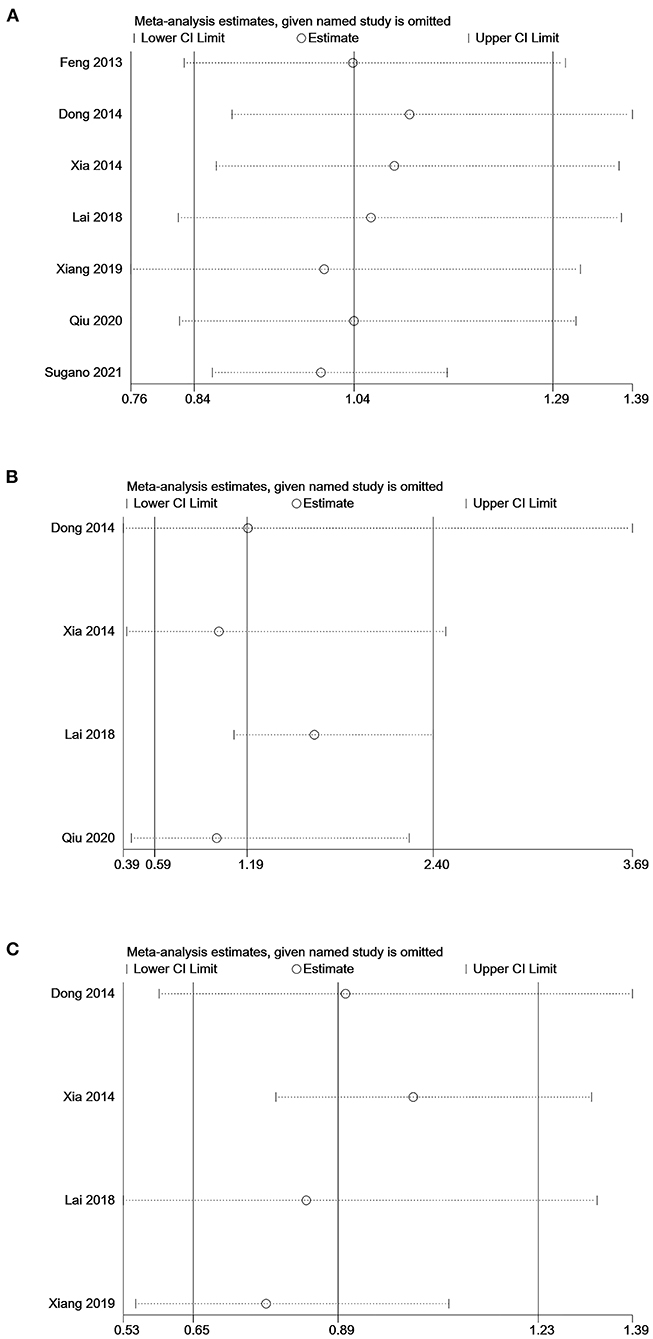
Figure 4. Sensitivity analysis of the association between serum uric acid levels and mortality in PD patients. (A) comparison: low vs. middle, outcome: all-cause mortality; (B) comparison: high vs. low, outcome: all-cause mortality; (C) comparison: low vs. middle, outcome: cardiovascular mortality.
Subgroup Analysis
We conducted the subgroup analysis of the association between SUA levels (low vs. middle) and all-cause mortality. Subgroup analyses by male proportion (50% as the cut-off value), sample size (1,000 as the cut-off value), hypertension proportion (90% as the cut-off value), and diabetes mellitus proportion (30% as the cut-off value) were not statistically significant (P > 0.05) (Figures 5A–D).
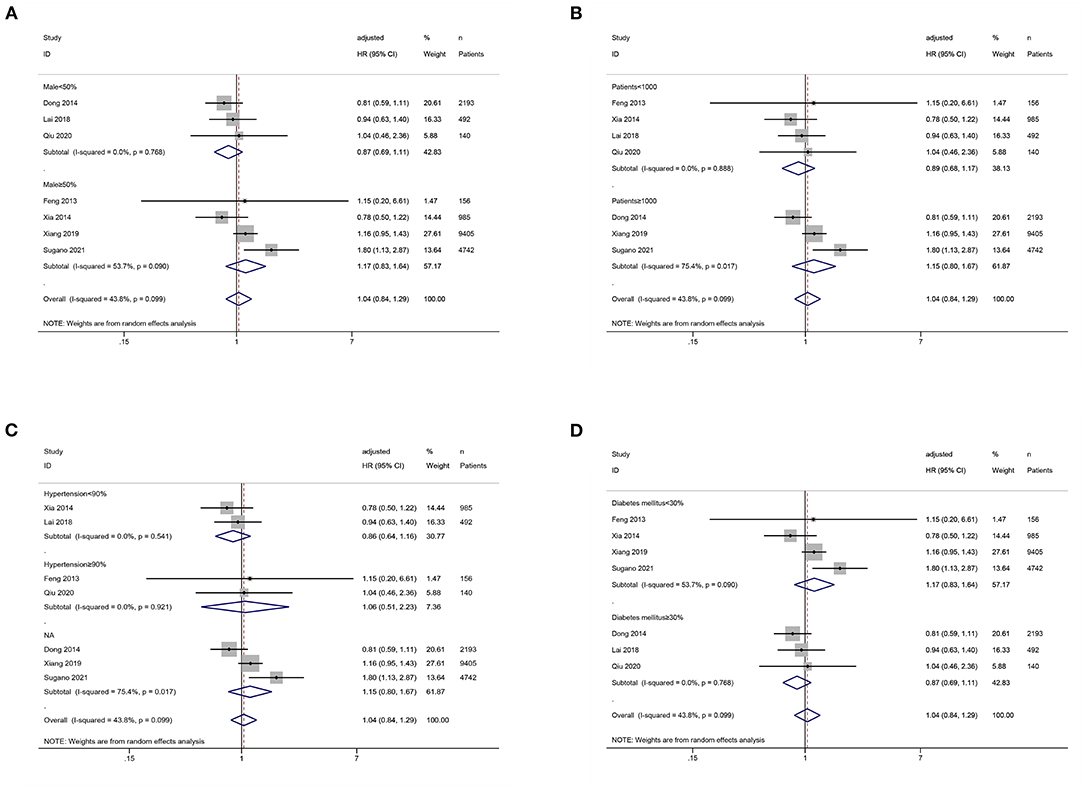
Figure 5. Subgroup analysis of the association between serum uric acid levels (low vs. middle) and all-cause mortality in PD patients. (A) by male proportion (50% as the cut-off value); (B) by sample size (1,000 as the cut-off value); (C) by hypertension proportion (90% as the cut-off value); (D) by diabetes mellitus proportion (30% as the cut-off value).
Meta-Regression Analysis
We used meta-regression to further explore the potential sources of heterogeneity, including male proportion (50% as the cut-off value), sample size (1,000 as the cut-off value), hypertension proportion (90% as the cut-off value), and diabetes mellitus proportion (30% as the cut-off value). Both univariate and multivariate analyses showed that the above factors were not the source of heterogeneity (P > 0.05) (Table 3).
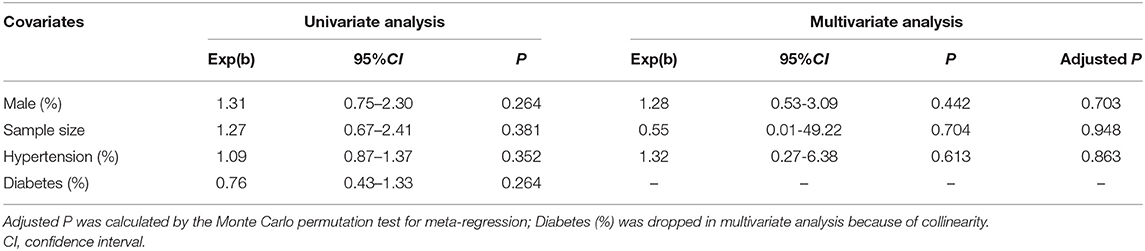
Table 3. The results of meta-regression analysis.
Publication Bias
Neither Begg's test nor Egger's test detected significant publication bias (P > 0.05) (Table 4). The shape of the funnel plot (low vs. middle, all-cause mortality) did not show visual evidence of asymmetry (Figure 6).
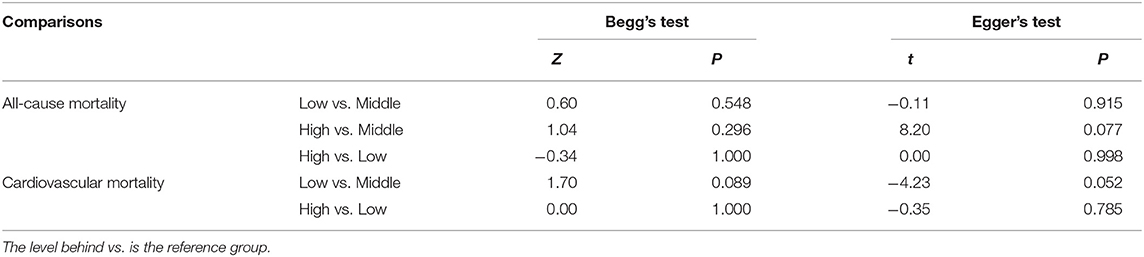
Table 4. Publication bias: Begg's test and Egger's test.
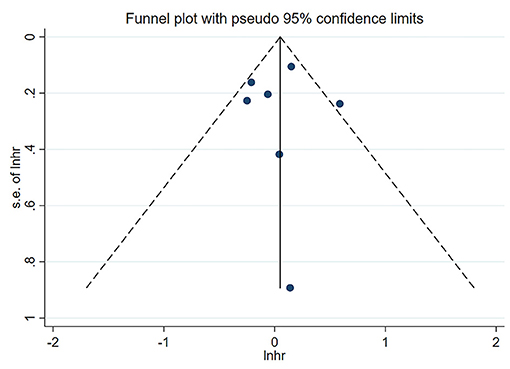
Figure 6. Funnel plot of the association between serum uric acid levels (low vs. middle) and all-cause mortality in PD patients.
GRADE Framework for Evidence Quality
Based on the GRADE approach about prognosis (27), a body of observational evidence begins as high-quality evidence. The quality of evidence was moderate for all-cause mortality (low vs. middle; high vs. middle) and cardiovascular mortality (low vs. middle) due to inconsistency (different cut-off values for SUA classification). The quality of evidence for all-cause mortality (high vs. low) and cardiovascular mortality (high vs. low) was judged to be low due to the inconsistency (different cut-off values for SUA classification) and imprecision (wide 95% confidence interval) (Table 5).
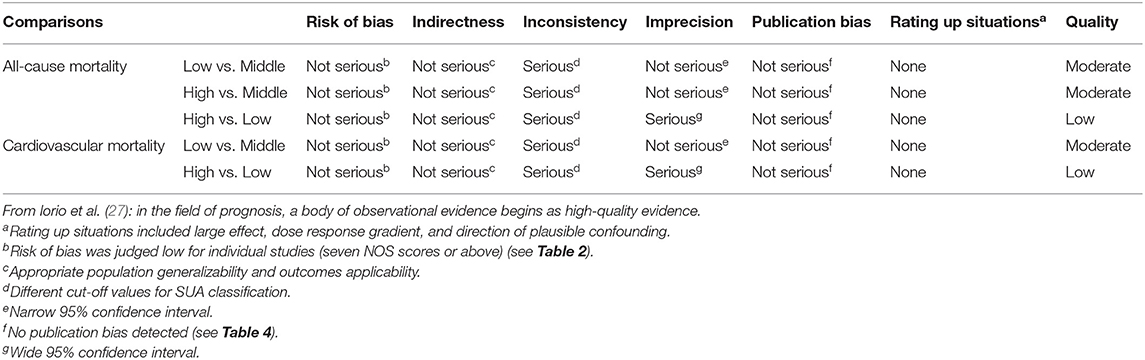
Table 5. GRADE assessment of the quality of evidence.
Discussion
To our knowledge, this is the first meta-analysis of the association between SUA levels and cardiovascular or all-cause mortality in PD patients. The pooled results showed that compared with middle SUA levels, high SUA levels were associated with increased all-cause mortality, while low SUA levels were not significantly associated with all-cause mortality. Besides, SUA levels might not be associated with cardiovascular mortality. The quality of evidence of this meta-analysis was judged to be moderate or low by the GRADE approach, which helps guide future research and clinical practice. Because current meta-analysis includes a relatively small number of studies, thus more large-sample and high-level studies are needed to determine the association between SUA levels and cardiovascular or all-cause mortality in PD patients. With the publication of relevant studies, this meta-analysis can be further updated in the future.
Our results showed that compared with middle SUA levels, high SUA levels were associated with an increased risk of all-cause mortality in PD patients. The possible reasons may be as follows: First, uric acid may induce oxidative stress by activating NADPH oxidase, stimulating the renin-angiotensin system (RAS), and disturbing mitochondrial function (33–35). Second, SUA can regulate inflammatory responses through a variety of cytokines (36). The pathophysiological mechanisms underlying the inflammatory state in CKD are complex and involve maladaptive cellular responses to injury, leading to sustained activation of proinflammatory and profibrotic signals (37, 38). Mouse models of CKD suggest that uric acid contributes to the pathophysiological processes described above. In the remnant kidney model, hyperuricemic rats exhibited higher blood pressure and proteinuria levels than normouricemic rats, which were histologically associated with greater glomerulosclerosis, interstitial fibrosis, and vascular lesions (39, 40). Third, hyperuricemia is associated with endothelial dysfunction. Uptake of uric acid into endothelial cells causes inflammation, oxidative stress, and eNOS dephosphorylation, leading to endothelial dysfunction by reducing NO bioavailability (41). Finally, high uric acid levels may reduce residual renal function in PD patients, leading to increased all-cause mortality (42, 43).
The pooled results indicated no significant association between SUA levels and cardiovascular mortality in PD patients, which might be due to the dual effects of SUA on the cardiovascular system. On the one hand, redundant SUA can cause inflammation, oxidative stress, endothelial dysfunction, and activation of the renin-angiotensin system, leading to cardiovascular disease (33–36, 41–45). On the other hand, many experiments have shown that uric acid is a potent free radical scavenger beneficial to the cardiovascular system (46, 47). Therefore, the association between SUA levels and cardiovascular mortality in PD patients may be balanced between protective and toxic effects. However, because only four related studies are included in this meta-analysis, and the individual study results are different, which may induce heterogeneity. Hence, the association between SUA levels and cardiovascular mortality in PD patients needs more high-level studies to validate.
Sensitivity analysis showed that compared with low SUA levels, high SUA levels were associated with an increased risk of all-cause mortality after excluding Lai's study (21). The results of Lai's study were significantly different from others, possibly because Lai's study had a longer median follow-up period (>3 years), while uric acid might have a more remarkable ability to predict mortality in PD patients within 3 years (32). Based on Lai's findings, the beneficial effect of UA on all-cause mortality seems to outweigh its harmful effect, and thus may have a protective effect in PD patients. This may be explained by the association between low SUA levels and malnutrition and may increase oxidative stress. Besides, different studies adjust for different confounders, the residual confounding bias may remain, which may contribute to the heterogeneity of results.
This meta-analysis has the following limitations: First, all the included studies were cohort studies, the potential confounders could not be adjusted entirely. Second, heterogeneity was observed among the included studies. Each study was adjusted for inconsistent confounding factors, with different cut-off values for SUA classification. Third, as a result of the limited number of relevant studies published, the number of studies included in this meta-analysis was insufficient and led to inadequate power to conduct subgroup and meta-regression analysis. Fourth, only few of the included studies reported SUA as a continuous variable and had different units, so we only considered SUA as a categorical variable.
Conclusion
In conclusion, compared with middle SUA levels, high SUA levels are associated with an increased risk of all-cause mortality in PD patients. SUA levels may not be associated with cardiovascular mortality. More high-level studies, especially randomized controlled trials, are needed to determine the association between SUA levels and cardiovascular or all-cause mortality in PD patients.
Data Availability Statement
Publicly available datasets were analyzed in this study. This data can be found at: PubMed, Embase, Web of Science, the Cochrane Library, CNKI, VIP, and Wanfang databases.
Author Contributions
Z-qL, Z-wH, S-lK, FY, and Z-jH designed the study and drafted the manuscript. Z-qL, Z-wH, and S-lK extracted the data and evaluated the quality. C-cH, FC, and FH verified the data. Z-qL, Z-wH, and ZL analyzed the data. Z-qL, S-lK, FY, and Z-jH revised the manuscript. Z-qL, ZL, FY, and Z-jH interpreted the results. Z-qL, Z-jH, C-cH, FC, and FH incorporated comments for the co-authors and finalized the manuscript. All authors approved the final version of the paper.
Funding
This study was supported by the key Clinical Specialty Discipline Construction Program of Fuzhou, Fujian, P.R.C, the Startup Fund for scientific research, Fujian Medical University (Grant number: 2019QH1297), and the Scientific Foundation of Fuzhou City (Grant number: 2020-WS-57).
Conflict of Interest
The authors declare that the research was conducted in the absence of any commercial or financial relationships that could be construed as a potential conflict of interest.
Publisher's Note
All claims expressed in this article are solely those of the authors and do not necessarily represent those of their affiliated organizations, or those of the publisher, the editors and the reviewers. Any product that may be evaluated in this article, or claim that may be made by its manufacturer, is not guaranteed or endorsed by the publisher.
References
1. Hill NR, Fatoba ST, Oke JL, Hirst JA, O'Callaghan CA, Lasserson DS, et al. Global prevalence of chronic kidney disease - a systematic review and meta-analysis. PLoS One. (2016) 11:e0158765. doi: 10.1371/journal.pone.0158765
2. GBD Chronic Kidney Disease Collaboration. Global, regional, and national burden of chronic kidney disease, 1990-2017: a systematic analysis for the Global Burden of Disease Study 2017. Lancet. (2020) 395:709–33. doi: 10.1016/s0140-6736(20)30045-3
3. Hole B, Hemmelgarn B, Brown E, Brown M, McCulloch MI, Zuniga C, et al. Supportive care for end-stage kidney disease: an integral part of kidney services across a range of income settings around the world. Kidney Int Suppl. (2020) 10:e86–94. doi: 10.1016/j.kisu.2019.11.008
4. Liyanage T, Ninomiya T, Jha V, Neal B, Patrice HM, Okpechi I, et al. Worldwide access to treatment for end-stage kidney disease: a systematic review. Lancet. (2015) 385:1975–82. doi: 10.1016/S0140-6736(14)61601-9
5. Bello AK, Levin A, Tonelli M, Okpechi IG, Feehally J, Harris D, et al. Assessment of global kidney health care status. JAMA. (2017) 317:1864–81. doi: 10.1001/jama.2017.4046
6. Chaudhary K, Sangha H, Khanna R. Peritoneal dialysis first: rationale. Clin J Am Soc Nephrol. (2011) 6:447–56. doi: 10.2215/CJN.07920910
7. Heaf JG, Wehberg S. Relative survival of peritoneal dialysis and haemodialysis patients: effect of cohort and mode of dialysis initiation. PLoS One. (2014) 9:e90119. doi: 10.1371/journal.pone.0090119
8. Lukowsky LR, Mehrotra R, Kheifets L, Arah OA, Nissenson AR, Kalantar-Zadeh K. Comparing mortality of peritoneal and hemodialysis patients in the first 2 years of dialysis therapy: a marginal structural model analysis. Clin J Am Soc Nephrol. (2013) 8:619–28. doi: 10.2215/CJN.04810512
9. Yeates K, Zhu N, Vonesh E, Trpeski L, Blake P, Fenton S. Hemodialysis and peritoneal dialysis are associated with similar outcomes for end-stage renal disease treatment in Canada. Nephrol Dial Transplant. (2012) 27:3568–75. doi: 10.1093/ndt/gfr674
10. Tedeschi A, Agostoni P, Pezzuto B, Corra U, Scrutinio D, La Gioia R, et al. Role of comorbidities in heart failure prognosis Part 2: chronic kidney disease, elevated serum uric acid. Eur J Prev Cardiol. (2020) 27:35–45. doi: 10.1177/2047487320957793
11. Maiuolo J, Oppedisano F, Gratteri S, Muscoli C, Mollace V. Regulation of uric acid metabolism and excretion. Int J Cardiol. (2016) 213:8–14. doi: 10.1016/j.ijcard.2015.08.109
12. Johnson RJ, Bakris GL, Borghi C, Chonchol MB, Feldman D, Lanaspa MA, et al. Hyperuricemia, acute and chronic kidney disease, hypertension, and cardiovascular disease: report of a scientific workshop organized by the national kidney foundation. Am J Kidney Dis. (2018) 71:851–65. doi: 10.1053/j.ajkd.2017.12.009
13. Wang J, Qin T, Chen J, Li Y, Wang L, Huang H, et al. Hyperuricemia and risk of incident hypertension: a systematic review and meta-analysis of observational studies. PLoS One. (2014) 9:e114259. doi: 10.1371/journal.pone.0114259
14. Li J, Huang JY, Liu L, Lo K, Sun S, Chen CL, et al. Relationship between serum uric acid level and all-cause and cardiovascular mortality in population with obesity. Postgrad Med J. (2020) 96:660–5. doi: 10.1136/postgradmedj-2019-137236
15. Stubnova V, Os I, Høieggen A, Solbu MD, Grundtvig M, Westheim AS, et al. Gender differences in association between uric acid and all-cause mortality in patients with chronic heart failure. BMC Cardiovasc Disord. (2019) 19:4. doi: 10.1186/s12872-018-0989-8
16. Jalal DI, Chonchol M, Chen W, Targher G. Uric acid as a target of therapy in CKD. Am J Kidney Dis. (2013) 61:134–46. doi: 10.1053/j.ajkd.2012.07.021
17. Zhang J, Lu X, Li H, Wang S. Serum uric acid and mortality in patients with chronic kidney disease: a systematic review and meta-analysis. Blood Purif. (2021) 50:758–66. doi: 10.1159/000513944
18. Luo Q, Xia X, Li B, Lin Z, Yu X, Huang F. Serum uric acid and cardiovascular mortality in chronic kidney disease: a meta-analysis. BMC Nephrol. (2019) 20:18. doi: 10.1186/s12882-018-1143-7
19. Wang H, Liu J, Xie D, Liu H, Zhen L, Guo D, et al. Elevated serum uric acid and risk of cardiovascular or all-cause mortality in maintenance hemodialysis patients: a meta-analysis. Nutr Metab Cardiovasc Dis. (2021) 31:372–81. doi: 10.1016/j.numecd.2020.11.017
20. Feng S, Jiang L, Shi Y, Shen H, Shi X, Jin D, et al. Uric acid levels and all-cause mortality in peritoneal dialysis patients. Kidney Blood Press Res. (2013) 37:181–9. doi: 10.1159/000350143
21. Lai KJ, Kor CT, Hsieh YP. An inverse relationship between hyperuricemia and mortality in patients undergoing continuous ambulatory peritoneal dialysis. J Clin Med. (2018) 7:416. doi: 10.3390/jcm7110416
22. Sugano N, Maruyama Y, Ohno I, Wada A, Shigematsu T, Masakane I, et al. Effect of uric acid levels on mortality in Japanese peritoneal dialysis patients. Perit Dial Int. (2021) 41:320–7. doi: 10.1177/0896860820929476
23. Xia X, He F, Wu X, Peng F, Huang F, Yu X. Relationship between serum uric acid and all-cause and cardiovascular mortality in patients treated with peritoneal dialysis. Am J Kidney Dis. (2014) 64:257–64. doi: 10.1053/j.ajkd.2013.08.027
24. Xiang S, Zhang X, Xie X, Wang J, Zhou Q, Chen Z, et al. High serum uric acid level is a mortality risk factor in peritoneal dialysis patients: a retrospective cohort study. Nutr Metab. (2019) 16:52. doi: 10.1186/s12986-019-0379-y
25. Page MJ, McKenzie JE, Bossuyt PM, Boutron I, Hoffmann TC, Mulrow CD, et al. The PRISMA 2020 statement: an updated guideline for reporting systematic reviews. BMJ. (2021) 372:n71. doi: 10.1136/bmj.n71
26. Liu L, Zhang L, Liu GJ, Fu P. Peritoneal dialysis for acute kidney injury. Cochrane Database Syst Rev. (2017) 12:Cd011457. doi: 10.1002/14651858.CD011457.pub2
27. Iorio A, Spencer FA, Falavigna M, Alba C, Lang E, Burnand B, et al. Use of GRADE for assessment of evidence about prognosis: rating confidence in estimates of event rates in broad categories of patients. BMJ. (2015) 350:h870. doi: 10.1136/bmj.h870
28. Begg CB, Mazumdar M. Operating characteristics of a rank correlation test for publication bias. Biometrics. (1994) 50:1088–101. doi: 10.2307/2533446
29. Egger M, Davey Smith G, Schneider M, Minder C. Bias in meta-analysis detected by a simple, graphical test. BMJ. (1997) 315:629–34. doi: 10.1136/bmj.315.7109.629
30. Duval S, Tweedie R. Trim and fill: a simple funnel-plot-based method of testing and adjusting for publication bias in meta-analysis. Biometrics. (2000) 56:455–63. doi: 10.1111/j.0006-341X.2000.00455.x
31. Dong J, Han QF, Zhu TY, Ren YP, Chen JH, Zhao HP, et al. The associations of uric acid, cardiovascular and all-cause mortality in peritoneal dialysis patients. PLoS One. (2014) 9:e82342. doi: 10.1371/journal.pone.0082342
32. Qiu S, Teng J, Shen B, Pei J, Cai Q, Zhang Y. Correlation of serum uric acid before dialysis and all-cause mortality in peritoneal dialysis patients. Chinese J Clin Med. (2020) 27:815–21. doi: 10.12025/j.issn.1008-6358.2020.20192078
33. Sanchez-Lozada LG, Andres-Hernando A, Garcia-Arroyo FE, Cicerchi C, Li N, Kuwabara M, et al. Uric acid activates aldose reductase and the polyol pathway for endogenous fructose and fat production causing development of fatty liver in rats. J Biol Chem. (2019) 294:4272–81. doi: 10.1074/jbc.RA118.006158
34. Corry DB, Eslami P, Yamamoto K, Nyby MD, Makino H, Tuck ML. Uric acid stimulates vascular smooth muscle cell proliferation and oxidative stress via the vascular renin-angiotensin system. J Hypertens. (2008) 26:269–75. doi: 10.1097/HJH.0b013e3282f240bf
35. Kim SM, Lee SH, Kim YG, Kim SY, Seo JW, Choi YW, et al. Hyperuricemia-induced NLRP3 activation of macrophages contributes to the progression of diabetic nephropathy. Am J Physiol Renal Physiol. (2015) 308:F993–1003. doi: 10.1152/ajprenal.00637.2014
36. Xiao J, Zhang XL, Fu C, Han R, Chen W, Lu Y, et al. Soluble uric acid increases NALP3 inflammasome and interleukin-1β expression in human primary renal proximal tubule epithelial cells through the Toll-like receptor 4-mediated pathway. Int J Mol Med. (2015) 35:1347–54. doi: 10.3892/ijmm.2015.2148
37. Chawla LS, Eggers PW, Star RA, Kimmel PL. Acute kidney injury and chronic kidney disease as interconnected syndromes. N Engl J Med. (2014) 371:58–66. doi: 10.1056/NEJMra1214243
38. Strausser SA, Nakano D, Souma T. Acute kidney injury to chronic kidney disease transition: insufficient cellular stress response. Curr Opin Nephrol Hypertens. (2018) 27:314–22. doi: 10.1097/MNH.0000000000000424
39. Kang DH, Nakagawa T, Feng L, Watanabe S, Han L, Mazzali M, et al. A role for uric acid in the progression of renal disease. J Am Soc Nephrol. (2002) 13:2888–97. doi: 10.1097/01.ASN.0000034910.58454.FD
40. Sánchez-Lozada LG, Tapia E, Santamaría J, Avila-Casado C, Soto V, Nepomuceno T, et al. Mild hyperuricemia induces vasoconstriction and maintains glomerular hypertension in normal and remnant kidney rats. Kidney Int. (2005) 67:237–47. doi: 10.1111/j.1523-1755.2005.00074.x
41. Maruhashi T, Hisatome I, Kihara Y, Higashi Y. Hyperuricemia and endothelial function: from molecular background to clinical perspectives. Atherosclerosis. (2018) 278:226–31. doi: 10.1016/j.atherosclerosis.2018.10.007
42. Hsieh YP, Yang Y, Chang CC, Kor CT, Wen YK, Chiu PF, et al. U-shaped relationship between uric acid and residual renal function decline in continuous ambulatory peritoneal dialysis patients. Nephrology. (2017) 22:427–35. doi: 10.1111/nep.12613
43. Yang C, Ma X, Zhao W, Chen Y, Lin H, Luo D, et al. A longitudinal analysis of the relationship between serum uric acid and residual renal function loss in peritoneal dialysis patients. Ren Fail. (2020) 42:447–54. doi: 10.1080/0886022X.2020.1761387
44. Braga TT, Forni MF, Correa-Costa M, Ramos RN, Barbuto JA, Branco P, et al. Soluble uric acid activates the NLRP3 inflammasome. Sci Rep. (2017) 7:39884. doi: 10.1038/srep39884
45. Mishima M, Hamada T, Maharani N, Ikeda N, Onohara T, Notsu T, et al. Effects of uric acid on the NO production of HUVECs and its restoration by urate lowering agents. Drug Res. (2016) 66:270–4. doi: 10.1055/s-0035-1569405
46. Nieto FJ, Iribarren C, Gross MD, Comstock GW, Cutler RG. Uric acid and serum antioxidant capacity: a reaction to atherosclerosis? Atherosclerosis. (2000) 148:131–9. doi: 10.1016/S0021-9150(99)00214-2
Keywords: serum uric acid, cardiovascular mortality, all-cause mortality, peritoneal dialysis, meta-analysis
Citation: Liu Z-q, Huang Z-w, Kang S-l, Hu C-c, Chen F, He F, Lin Z, Yang F and Hu Z-j (2021) Serum Uric Acid and Cardiovascular or All-Cause Mortality in Peritoneal Dialysis Patients: A Systematic Review and Meta-Analysis. Front. Cardiovasc. Med. 8:751182. doi: 10.3389/fcvm.2021.751182
Received: 31 July 2021; Accepted: 11 October 2021;
Published: 03 November 2021.
Edited by:
Gen-Min Lin, Hualien Armed Forces General Hospital, TaiwanReviewed by:
Jun Lyu, First Affiliated Hospital of Jinan University, ChinaSukrit Kanchanasurakit, University of Phayao, Thailand
Copyright © 2021 Liu, Huang, Kang, Hu, Chen, He, Lin, Yang and Hu. This is an open-access article distributed under the terms of the Creative Commons Attribution License (CC BY). The use, distribution or reproduction in other forums is permitted, provided the original author(s) and the copyright owner(s) are credited and that the original publication in this journal is cited, in accordance with accepted academic practice. No use, distribution or reproduction is permitted which does not comply with these terms.
*Correspondence: Zhi-jian Hu, aHV6aGlqaWFuQGZqbXUuZWR1LmNu; Feng Yang, eWY1MDY3NTA1QDE2My5jb20=
†These authors have contributed equally to this work