Abstract
Introduction: This study aims to assess the changes in cardiovascular remodeling attributable to bodyweight gain in a middle-aged abdominal obesity cohort. A remodeling worsening might explain the increase in cardiovascular risk associated with a dynamic of weight gain.
Methods: Seventy-five middle-aged subjects (56 ± 5 years, 38 women) with abdominal obesity and no known cardiovascular disease underwent MRI-based examinations at baseline and at a 6.1 ± 1.2-year follow-up to monitor cardiovascular remodeling and hemodynamic variables, most notably the effective arterial elastance (Ea). Ea is a proxy of the arterial load that must be overcome during left ventricular (LV) ejection, with increased EA resulting in concentric LV remodeling.
Results: Sixteen obese subjects had significant weight gain (>7%) during follow-up (WG+), whereas the 59 other individuals did not (WG–). WG+ and WG– exhibited significant differences in the baseline to follow-up evolutions of several hemodynamic parameters, notably diastolic and mean blood pressures (for mean blood pressure, WG+: +9.3 ± 10.9 mmHg vs. WG–: +1.7 ± 11.8 mmHg, p = 0.022), heart rate (WG+: +0.6 ± 9.4 min−1 vs. −8.9 ± 11.5 min−1, p = 0.003), LV concentric remodeling index (WG: +0.08 ± 0.16 g.mL−1 vs. WG−: −0.02 ± 0.13 g.mL−1, p = 0.018) and Ea (WG+: +0.20 ± 0.28 mL mmHg−1 vs. WG−: +0.01 ± 0.30 mL mmHg−1, p = 0.021). The evolution of the LV concentric remodeling index and Ea were also strongly correlated in the overall obese population (p < 0.001, R2 = 0.31).
Conclusions: A weight gain dynamic is accompanied by increases in arterial load and load-related concentric LV remodeling in an isolated abdominal obesity cohort. This remodeling could have a significant impact on cardiovascular risk.
Introduction
Obese subjects exhibit an unequivocal increase in cardiovascular risk (1). Unfortunately, one-half of these subjects are not even attempting to lose weight, and many succumb to even further weight gains (2). Such weight gains lead to body mass indexes associated with higher cardiovascular risks (1), with the prognosis being further deteriorated by a longitudinal weight gain dynamic, independently of the attained bodyweight level (3–5).
A weight gain dynamic was also found to be associated with the onset or exacerbation of a phenotype involving concentric left ventricular (LV) remodeling, with an increase in LV mass relative to the LV cavity size, in large cohorts of obese as well as non-obese subjects (6, 7). The specific prognostic impact of this concentric remodeling, as well as its associations with concomitant obesity-related arterial remodeling and increasing blood pressure (BP), need to be specifically determined in obese subjects. In more general populations, concentric LV remodeling was previously shown to be a strong prognostic indicator (8–12), developing in response to increases in myocardial wall stress (13) and arterial load (i.e., the artery-related opposition that must be overcome by the LV during ejection) (14).
Magnetic resonance imaging (MRI) measures cardiac and vascular function in a more precise and reproducible way than echography (15). This may involve measurements of LV mass and cavity volumes, as well as compliance, elastance, and resistance of the systemic arterial tree (14–17). In previous cross-sectional MRI studies, middle-aged subjects with isolated abdominal obesity exhibited significant deterioration in large vessel compliance and an increase in the vascular resistance of small resistive vessels, as compared with non-obese subjects, and this was accompanied by an LV concentric remodeling (17). However, longitudinal studies assessing the interrelated cardiac and vascular changes attributable to the additional weight gain over time are still lacking in obese subjects.
This MRI-based longitudinal study assesses the cardiovascular changes and remodeling attributable to significant additional weight gain over time in a middle-aged isolated abdominal obesity cohort.
Materials and Methods
Study Populations
As already detailed elsewhere (17), isolated abdominal obesity subjects were prospectively recruited through an advertising campaign and ultimately included subjects ranging from 40 to 65 years of age, with obvious abdominal obesity defined by a waist circumference >102 cm for men and >88 cm for women (18), and excluding any of the following: (1) morbid obesity [i.e., body mass index (BMI) > 40 Kg.m−2], (2) a history of any cardiovascular disease or of any medical treatment with cardiovascular effects, (3) a history of medically-treated hypertension or diabetes, (4) inflammatory disease, (5) renal, hepatic or pulmonary insufficiency, (6) an MRI contraindication, (7) absence of cardiac sinus rhythm and (8) any women of childbearing potential. An additional control group of non-obese healthy volunteers with a similar sex ratio and age range (40–65 years), had also been prospectively recruited through an unrelated concurrent advertising campaign (17). These included waist circumferences < 94 cm for men and < 80 cm for women in order to exclude any central obesity cases (17).
The transversal part of this exploratory study, involving a cardiovascular MRI investigation, was approved by the local Ethics Committee, with all study participants providing their signed informed consent. We have previously published the baseline results for the isolated abdominal obesity cohort elsewhere (17).
The same obese subjects were subsequently asked to participate in an additional >4 years longitudinal study, which included a follow-up using the same cardiovascular MRI protocol applied in the baseline study. The Ethics Committee also approved this longitudinal part of the study, which is released on the ClinicalTrials.gov site under the identifier NCT01716819. All study subjects additionally gave their signed informed consent to participate in this longitudinal part of the study.
Significant weight gain during follow-up was defined by the standard criterion of a > 7% increase relative to baseline (19–22).
Cardiovascular MRI
As previously detailed elsewhere (17), MRIs were performed on a 1.5-T magnet (Signa Excite, GE Medical Systems, Milwaukee, WI, USA). During MRI examinations, an automated sphygmomanometer (Maglife C, Schiller Medical, Wissembourg, France) was used to measure brachial blood pressure (BP) as systolic, diastolic, and mean pressures. Averaged values were archived and extracted at a later date to perform analyses presented below.
A conventional steady-state free precession pulse sequence was used to assess LV function and mass in contiguous short-axis 8-mm slices, with 30 phases per cardiac cycle, a 32 to 38-cm field-of-view, and a 224x224 matrix (17). LV end-diastolic volume, end-diastolic mass, and ejection fraction were obtained using dedicated software (MASS™, Medis, The Netherlands), with papillary muscles and trabeculations being excluded from LV mass. The concentric remodeling (CR) index was defined as LV mass/end-diastolic volume ratio (17). The intra-observer reproducibility of these remodeling LV parameters had been previously assessed in 31 Cardiovascular Magnetic Resonance (CMR) exams that were analyzed twice. Absolute values of the differences between the first and second measurements were on average 5.81 ± 4.17 g for LV mass, 4.68 ± 3.64 ml for end-diastolic volume, and 0.060 ± 0.046 for the CR index.
The cardiac flow was determined using a conventional velocity-encoded phase-contrast gradient-echo sequence on a single 10-mm slice positioned perpendicularly to the ascending aorta, 32 phases per cardiac cycle, and a unidirectional velocity with a maximum set to 1.50 m sec−1 (17). The stroke volume (SV) was obtained using the “CV flow” software (Medis, The Netherlands) and automatic contour detection. Velocities were only corrected using an ROI-based method in instances of obvious offset error.
The values of cardiac flow and stroke volume were used to estimate the systemic vascular resistances (SVR: mean pressure/cardiac flow) (14–17), as well as two additional vascular parameters: (1) effective arterial elastance (Ea), a proxy for the arterial load, which needs to be overcome during left ventricular (LV) ejection (Ea = 0.9 x systolic BP (mmHg) / stroke volume (mL) (23–28), and (2) the total arterial compliance index (TAC = stroke volume (mmHg) / pulse pressure (mmHg) (14, 16, 17, 27, 28). These cardiovascular MRI-derived parameters were not indexed to anthropometric parameters except for transversal unpaired comparisons between the obese and non-obese groups (Table 1) where several variables were indexed to body surface area and LV mass to body weight to the 2.7 power [weight2.7 (29)].
Table 1
| Obese | Non-obese | P value | |
|---|---|---|---|
| (n = 75) | (n = 58) | ||
| Age (years) | 55 ± 6 | 54 ± 5 | 0.245 |
| Female gender | 38 (51%) | 31 (53%) | 0.861 |
| Body weight (kg) | 89.1 ± 11.8 | 63.8 ± 8.3 | <0.001 |
| Body mass index (kg m−2) | 31.7 ± 3.3 | 22.4 ± 1.9 | <0.001 |
| Heart rate (bpm) | 72 ± 11 | 69 ± 11 | 0.081 |
| Systolic BP (mmHg) | 121.4 ± 14.7 | 118.6 ± 15.2 | 0.283 |
| Diastolic BP (mmHg) | 72.0 ± 10.3 | 76.9 ± 9.3 | 0.005 |
| Mean BP (mmHg) | 88.5 ± 10.8 | 90.8 ± 11.1 | 0.222 |
| Pulse BP (mmHg) | 49.4 ± 10.5 | 41.7 ± 7.3 | <0.001 |
| Indexed stroke volume (mL m−2) | 41.5 ± 6.8 | 47.4 ± 8.5 | <0.001 |
| Cardiac index (L.min−1 m−2) | 2.90 ± 0.61 | 3.23 ± 0.69 | 0.004 |
| Indexed SVR (mmHg min m2 L−1) | 31.7 ± 7.3 | 29.1 ± 5.8 | 0.024 |
| Indexed TAC (mL mmHg−1 m−2) | 0.85 ± 0.19 | 1.16 ± 0.25 | <0.001 |
| Indexed Ea (mmHg mL−1 m2) | 2.50 ± 0.54 | 2.08 ± 0.43 | 0.001 |
| Indexed EDV (mL m−2) | 69.8 ± 10.7 | 81.2 ± 10.0 | <0.001 |
| EF (%) | 59.5 ± 6.1 | 59.9 ± 5.8 | 0.692 |
| Indexed LV mass (g m−2.7) | 24.0 ± 4.7 | 21.8 ± 3.8 | <0.001 |
| CR index (g mL−1) | 0.69 ± 0.15 | 0.63 ± 0.12 | 0.005 |
Comparison of the main baseline data between obese subjects and non-obese healthy controls.
BP, blood pressure; CR, concentric remodeling; Ea, effective arterial elastance; EDV, end-diastolic volume; EF, ejection fraction; LV, left ventricle; TAC, total arterial compliance; SVR, systemic vascular resistances.
Note that all MRI parameters are indexed to body surface area here, except for EF and CR index.
Statistical Analysis
Analyses were performed using the commercially available SAS software, version 9.4 (SAS Institute Inc. Cary, NC, USA). Continuous variables were expressed as means (± standard deviation) and categorical variables as numbers and percentages. Unpaired comparisons for categorical variables were performed with Fisher's exact test, and unpaired comparisons of continuous variables were evaluated with Student's t-test or the Mann–Whitney U test, depending on their normal or non-normal distributions. Comparisons between baseline and follow-up within each group (WG+, WG–) were also evaluated using the signed rank test or the paired t-test for continuous variables and the Mc Nemar test for categorical variables. Linear regression analyses were additionally carried out to investigate and assess the relationships between certain variables. Additional predictions provided by the blood pressure data were analyzed using an ascending stepwise multivariate regression model. Linear model assumptions were checked, and p < 0.05 were considered to indicate a significant difference.
Results
Baseline Characteristics of Obese Subjects Compared to Non-obese Subjects
Seventy-five subjects with abdominal obesity (56 ± 5 years, 38 women), who underwent the MRI protocol at baseline and follow-up, were ultimately considered in the analysis. Of this group, 50 (67%) also had general obesity, as defined by a body mass index > 30 kg m−2. As detailed in Table 2, eight individuals (11%) were taking hypolipidemic medication, and none were on anti-hypertensive treatments.
Table 2
| Overall obese population ( n = 75) | WG+ ( n = 16) | WG– ( n = 59) | |||||||
|---|---|---|---|---|---|---|---|---|---|
| Baseline | Follow-up | P value | Baseline | Follow-up | P value | Baseline | Follow-up | P value | |
| Body weight (kg) | 89 ± 12 | 91 ± 14 | 0.034 | 87 ± 14 | 99 ± 15* | <0.0001 | 90 ± 11 | 89 ± 13 | 0.64 |
| Antihypertensive drugs | 0 (0.0 %) | 21 (28.0 %) | <0.0001 | 0 (0.0 %) | 4 (25.0 %) | 0.12 | 0 (0.0 %) | 17 (28.8 %) | <0.0001 |
| Beta-blockers | 0 (0.0 %) | 8 (10.7 %) | 0.0078 | 0 (0.0 %) | 2 (12.5 %) | 0.50 | 0 (0.0 %) | 6 (10.2 %) | 0.0313 |
| ACEI or ARA-II drugs | 0 (0.0 %) | 14 (18.7 %) | 0.0001 | 0 (0.0 %) | 3 (18.8 %) | 0.25 | 0 (0.0 %) | 11 (18.6 %) | 0.001 |
| Antidiabetic drugs | 0 (0.0 %) | 2 (2.7 %) | 0.50 | 0 (0.0 %) | 0 (0.0 %) | —— | 0 (0.0 %) | 2 (3.4 %) | 0.50 |
| Hypolipidemic drugs | 8 (10.7 %) | 16 (21.3 %) | 0.0215 | 6 (37.5 %)** | 7 (43.8 %)* | 1.00 | 2 (3.4 %) | 9 (15.3 %) | 0.0156 |
| Statins | 6 (8.0 %) | 12 (16.0 %) | 0.0339 | 4 (25.0 %)* | 7 (43.8 %)** | 0.0833 | 2 (3.4 %) | 5 (8.5 %) | 0.18 |
| CRP (g L−1) | 3.25 ± 3.03 | 4.26 ± 6.21 | 0.17 | 3.29 ± 2.49 | 4.62 ± 4.57 | 0.21 | 3.24 ± 3.20 | 4.16 ± 6.62 | 0.37 |
| Blood creatinine (mmol L−1) | 84.0 ± 12.4 | 84.9 ± 17.5 | 0.63 | 85.4 ± 11.5 | 84.3 ± 15.8 | 0.73 | 83.6 ± 12.7 | 85.1 ± 18.0 | 0.43 |
| HbA1c (%) | 5.63 ± 0.33 | 5.78 ± 0.57 | 0.0002 | 5.66 ± 0.38 | 5.85 ± 0.42 | 0.023 | 5.62 ± 0.31 | 5.76 ± 0.61 | 0.005 |
| LDL (mmol L−1) | 3.58 ± 0.91 | 3.34 ± 0.80 | 0.27 | 3.36 ± 0.58 | 3.20 ± 0.64 | 0.43 | 3.65 ± 0.98 | 3.38 ± 0.84 | 0.43 |
| HDL (mmol L−1) | 1.41 ± 0.36 | 1.26 ± 0.30 | <0.0001 | 1.48 ± 0.41 | 1.24 ± 0.28 | 0.0006 | 1.39 ± 0.34 | 1.27 ± 0.31 | <0.0001 |
| Triglycerides (mmol L−1) | 1.56 ± 0.92 | 1.67 ± 1.14 | 0.18 | 1.59 ± 1.03 | 2.02 ± 1.15 | 0.009 | 1.55 ± 0.89 | 1.57 ± 1.12 | 0.97 |
| Heart rate (bpm) | 72 ± 11 | 65 ± 12 | <0.0001 | 71 ± 11 | 72 ± 12** | 0.82 | 72 ± 11 | 63 ± 11 | <0.0001 |
| Systolic BP (mmHg) | 121 ± 15 | 124 ± 13 | 0.018 | 119 ± 12 | 128 ± 12 | 0.009 | 122 ± 15 | 123 ± 13 | 0.18 |
| Diastolic BP (mmHg) | 72 ± 10 | 76 ± 10 | 0.0001 | 69 ± 13 | 80 ± 11 | 0.006 | 73 ± 10 | 75 ± 10 | 0.005 |
| Mean BP (mmHg) | 88 ± 11 | 92 ± 10 | 0.001 | 86 ± 12 | 95 ± 11 | 0.009 | 89 ± 11 | 91 ± 9 | 0.025 |
| Pulse BP (mmHg) | 49 ± 10 | 48 ± 9 | 0.16 | 50 ± 8 | 48 ± 10 | 0.5 | 49 ± 11 | 48 ± 9 | 0.28 |
| Stroke volume (mL) | 82 ± 15 | 83 ± 19 | 0.78 | 84 ± 12 | 79 ± 18 | 0.21 | 82 ± 16 | 84 ± 19 | 0.37 |
| Cardiac output (L min−1) | 5.88 ± 1.24 | 5.26 ± 1.10 | <0.0001 | 5.93 ± 1.07 | 5.59 ± 1.29 | 0.19 | 5.87 ± 1.30 | 5.17 ± 1.04 | <0.0001 |
| SVR (mmHg min L−1) | 15.7 ± 3.7 | 18.1 ± 3.7 | <0.0001 | 15.0 ± 3.4 | 17.8 ± 4.0 | 0.003 | 15.9 ± 3.7 | 18.2 ± 3.6 | <0.0001 |
| TAC index (mL mmHg−1) | 1.72 ± 0.42 | 1.78 ± 0.49 | 0.25 | 1.70 ± 0.30 | 1.70 ± 0.43 | 0.94 | 1.73 ± 0.45 | 1.80 ± 0.51 | 0.22 |
| Ea (mmHg mL−1) | 1.23 ± 0.27 | 1.28 ± 0.33 | 0.16 | 1.18 ± 0.22 | 1.38 ± 0.35 | 0.013 | 1.25 ± 0.28 | 1.26 ± 0.33 | 0.81 |
| EDV (mL) | 142 ± 26 | 140 ± 32 | 0.16 | 144 ± 21 | 138 ± 29 | 0.27 | 141 ± 27 | 140 ± 32 | 0.32 |
| EF (%) | 60 ± 6 | 59 ± 5 | 0.29 | 60 ± 7 | 58 ± 7 | 0.13 | 59 ± 6 | 59 ± 5 | 0.64 |
| LV mass (g) | 98 ± 25 | 96 ± 26 | 0.061 | 97 ± 28 | 103 ± 30 | 0.43 | 98 ± 25 | 94 ± 24 | 0.013 |
| CR index (g.mL−1) | 0.69 ± 0.15 | 0.70 ± 0.14 | 0.89 | 0.67 ± 0.16 | 0.75 ± 0.18 | 0.13 | 0.70 ± 0.14 | 0.68 ± 0.13 | 0.25 |
Main data collected at baseline and follow-up in the overall obese population, as well as in obese subjects exhibiting significant weight gain (WG+) or not (WG-), with p values for paired comparisons between baseline and follow-up.
Significant results for unpaired comparisons between WG+ and WG− at baseline or follow-up are also indicated in the WG+ columns (*p <0.05 and **p <0.005 for comparison with WG−).
BP, blood pressure; CR, concentric remodeling; CRP, c reactive protein; Ea, effective arterial elastance; EDV, end-diastolic volume; EF, ejection fraction; HbA1c, hemoglobin A1c; HDL, high density lipoprotein; LDL, low density lipoprotein; LV, left ventricular; TAC, total arterial compliance; SVR, systemic vascular resistances.
Although obese subjects had a similar age range and sex ratio than the non-obese group at baseline, the obese group exhibited higher diastolic and pulse BP, with a trend toward higher heart rates (Table 1). The obese group also showed signs of LV concentric hypertrophy (i.e., higher CR indexes and indexed LV mass compared to the non-obese controls), and arterial dysfunction with lower arterial compliance and higher levels of vascular resistance as well as arterial load [i.e., with indexed TAC, SVR and Ea values being significantly different from the corresponding values in non-obese controls (Table 1)].
Six-Year Follow-Up of Obese Subjects
The follow-up investigation was performed at a mean of 6.1 ± 1.2 years from baseline. Several variables significantly deteriorated over time in the overall obese population, notably body weight, BP, SVR, HbA1c and HDL cholesterol (Table 2). However, only 16 obese subjects experienced significant weight gain, as defined by the standard criterion of a > 7% increase relative to baseline (19–22) (WG+ group: from 87 ± 14 kg to 99 ± 15 kg, p < 0.001), whereas the 59 other individuals had no significant bodyweight changes (WG– group: from 90 ± 11 kg to 89 ± 13 kg, p = 0.64).
The WG+ and WG– subgroups were comparable with respect to age (at baseline: 54.0 ± 6.2 vs. 55.3 ± 5.5 years, p = 0.41), gender (women: 9 (56%) vs. 29 (49%), p = 0.78), baseline body mass index (31.5 ± 3.5 vs. 31.8 ± 3.3 kg.m−2, p = 0.75) and time between baseline and follow-up (6.1 ± 1.2 vs. 6.1 ± 1.2 years, p = 0.98). However, as detailed in Table 2, the WG+ group exhibited higher rates of hypolipidemic treatments, particularly of statins compared to the WG- group (for statins at follow-up: 7 (43.8 %) vs. 5 (8.5 %), p = 0.0024).
These two groups also exhibited significant differences in the baseline to follow-up evolutions of several hemodynamic parameters (Tables 2, 3), notably for mean and diastolic BP (for mean BP, WG+: +9.3 ± 10.9 mmHg vs. WG-: 1.7 ± 11.8 mmHg, p = 0.022), heart rate (WG+: +0.6 ± 9.4 min−1 vs. −8.9 ± 11.5 min−1, p = 0.003), LV concentric remodeling index (WG: +0.080 ± 0.16 g mL−1 vs. WG-: −0.02 ± 0.13 g mL−1, p = 0.018) and Ea (WG+: +0.20 ± 0.28 mL.mmHg−1 vs. WG-: +0.01 ± 0.30 mL mmHg−1, p = 0.021). In addition, the evolutions of the LV concentric remodeling index and the Ea were found to be strongly correlated in the overall obese population [p < 0.001, R2 = 0.31 (Figure 1)]. In contrast, evolution of the LV concentric remodeling index was unrelated to the concomitant changes in brachial blood pressure in the univariate, as well as the multivariate analysis (-i.e., after Ea was entered in a linear regression model).
Table 3
| WG+ (n = 16) | WG– (n = 59) | P value | |
|---|---|---|---|
| Body weight (kg) | 11.73 ± 7.55 | −0.98 ± 5.45 | <0.0001 |
| CRP (g L−1) | 1.32 ± 4.16 | 0.27 ± 2.92 | 0.26 |
| Blood creatinine (mmol L−1) | −1.1 ± 11.4 | 1.8 ± 10.3 | 0.33 |
| HbA1c (%) | 0.19 ± 0.32 | 0.18 ± 0.51 | 0.28 |
| LDL (mmol L−1) | −0.16 ± 0.71 | −0.23 ± 1.02 | 0.73 |
| HDL (mmol L−1) | −0.24 ± 0.22 | −0.12 ± 0.19 | 0.086 |
| Triglycerides (mmol L−1) | 0.42 ± 0.66 | 0.05 ± 0.69 | 0.058 |
| Heart rate (bpm) | 0.6 ± 9.4 | −8.9 ± 11.5 | 0.003 |
| Systolic BP (mmHg) | 8.4 ± 11.2 | 1.4 ± 15.4 | 0.097 |
| Diastolic BP (mmHg) | 10.6 ± 12.0 | 2.8 ± 11.0 | 0.027 |
| Mean BP (mmHg) | 9.3 ± 10.9 | 1.7 ± 11.8 | 0.022 |
| Pulse BP (mmHg) | −2.2 ± 6.7 | −1.4 ± 10.0 | 0.95 |
| Stroke volume (mL) | −4.8 ± 14.2 | 1.6 ± 15.6 | 0.15 |
| Cardiac output (L min−1) | −0.3 ± 1.0 | −0.7 ± 1.0 | 0.19 |
| SVR (mmHg min L−1) | 2.86 ± 3.57 | 2.27 ± 3.49 | 0.66 |
| TAC (mL mmHg−1) | −0.00 ± 0.28 | 0.07 ± 0.43 | 0.52 |
| Ea (mmHg mL−1) | 0.20 ± 0.28 | 0.01 ± 0.30 | 0.021 |
| EDV (mL) | −5.14 ± 22.59 | −1.40 ± 21.10 | 0.537 |
| EF (%) | −1.73 ± 4.47 | −0.24 ± 5.49 | 0.27 |
| LV mass (g) | 6.24 ± 18.91 | −3.60 ± 13.56 | 0.1 |
| CR index (g mL−1) | 0.08 ± 0.16 | −0.02 ± 0.13 | 0.018 |
Comparison between the obese subjects exhibiting significant weight gain (WG+) and those without weight gain (WG–), of the parameter differences calculated between follow-up and baseline.
BP, blood pressure; CR, concentric remodeling; CRP, c reactive protein; Ea, effective arterial elastance; EDV, end-diastolic volume; EF, ejection fraction; HbA1c, hemoglobin A1c; HDL, high density lipoprotein; LDL, low density lipoprotein; LV, left ventricular; TAC, total arterial compliance; SVR, systemic vascular resistances.
Figure 1
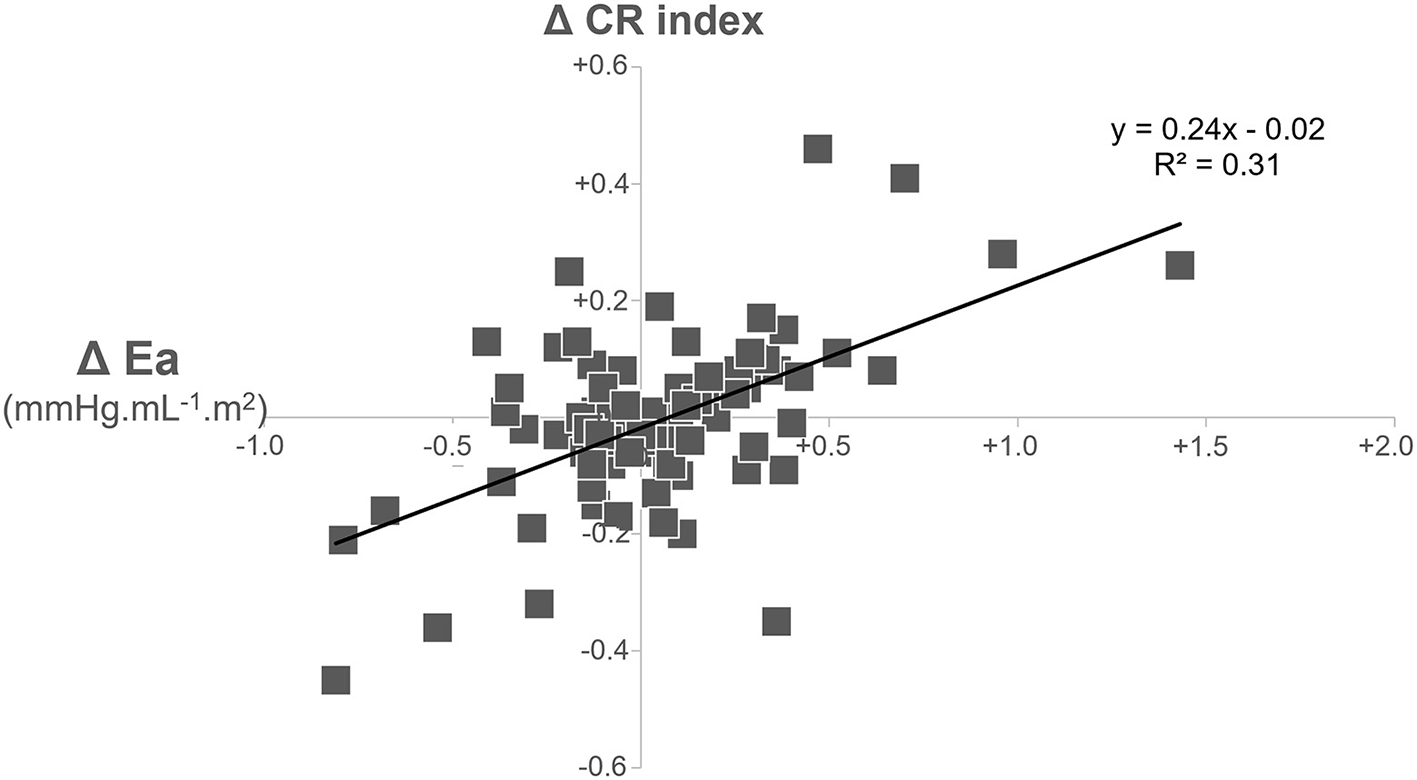
Correlation between baseline to follow-up changes in effective arterial elastance (Ea) and in the left ventricular concentric remodeling (CR) index in the overall population of obese subjects.
Finally, no other differences were observed between the WG+ and WG– groups over the 6-year follow-up period in terms of the evolution of any of the other clinical, biological and MRI parameters monitored (Tables 2, 3).
Discussion
The increased cardiovascular risk of obese subjects has been well established, in line with various metabolic disorders and in association with cardiac remodeling, which has been extensively analyzed in previous transversal studies. However, to the best of our knowledge, the current MRI study is the first to assess cardiac remodeling in obese subjects along with its dependence on concomitant vascular function and with or without significant weight gain over time. Such weight gain was associated with additional increases in arterial load and load-related cardiac remodeling, and these changes are indicative of a real impact on cardiovascular function and on cardiovascular risk.
The current study analyzed arterial remodeling by measuring MRI-based parameters, more specifically: (i) the compliance attributable to great arteries [TAC index (14, 16, 17, 27, 28)], (ii) the resistance attributable to microcirculation [SVR (14–17), and (iii) a global arterial load, which is impacted by both arterial compliance and arterial resistance [Ea (23–28)]. All these parameters were markedly different between our subjects with isolated abdominal obesity and a non-obese reference population at baseline (Table 1).
Moreover, SVR and BP exhibited additional deteriorations after a mean 6-year follow-up in our obese subjects (Table 2), confirming the central function of the microvasculature in obesity-related vascular remodeling (30). Over time, these deteriorations were associated with increased use of hypertensive and hypolipidemic medications and a worsening of several other metabolic parameters (namely, HbA1c and HDL cholesterol) (see Table 2). Although the aging process may partially explain these deteriorations, they were likely accelerated by obesity in this instance.
The aggravation of obesity, characterized by significant weight gain over a 6-year time frame, affected 21% of our obese population, and its only significant predictive factor was a higher prescription rate of hypolipidemic drugs, particularly of statins (Table 2). Statins have previously been reported to be associated with weight gain, but a mechanism to substantiate this effect is still a matter of much debate (31).
We also noted time-related increases in Ea and in the LV concentric remodeling index in our obese subjects with weight gain but not in those without weight gain. Ea is a steady-state arterial parameter that provides a comprehensive measure of the vascular load impacting the LV contraction (23–28). That is why this parameter is commonly associated with an LV concentric remodeling in both transversal and longitudinal studies in men (14) as well as in animal models (32). In our study this consideration is strengthened by the strong correlation observed between the 6-year changes in Ea and the LV concentric remodeling index (see Figure 1).
This LV concentric remodeling index is an established independent prognostic parameter (8–12). It reflects the LV adaptation to an excessive LV afterload, such as in hypertensive or pre-hypertensive states (14, 33) and in patients with aortic stenoses, and contributes to prevent excess systolic LV wall stress (34). A high LV concentric remodeling index also reflects an inappropriate LV mass relative to the LV cavitary volume. In support of this consideration, an index of the appropriateness of LV mass was additionally computed relative to the normal reference values using an echography method (35–37). In the present study, this appropriateness index provided equivalent results than our concentric remodeling index - i.e., higher values in obese than in non-obese subjects, and follow-up increases correlated with weight gain in obese subjects (results not shown).
A sympathetic overactivity has also been previously found to occur during time periods characterized by weight gain in animal models (38) and in non-obese subjects (39). This may potentially play a role in the weight gain-related hemodynamic alterations documented in our study, including changes in heart rate.
Indeed, the aging-related decrease in heart rate, which is usually documented in the decade ranging from 50 to 60 years of age (6, 40), was clearly observed in our obese subjects without weight gain but not in those with weight gain. This observation strengthens the hypothesis of a difference in the activity of the sympathetic nervous system between these two groups. However, future studies which include more direct measurements of this sympathetic activity will be required to confirm the nature of this correlation. If this were to be confirmed, drugs which lower sympathetic activation could be tested to lower this weight gain-related increase in arterial load and concentric LV remodeling. Beta-blockers with additional vasodilating properties and with neutral or beneficial effects on insulin sensitivity and lipid metabolism (41), may be particularly interesting for this purpose.
The current study has several limitations, the first being its small sample size and, consequently, the necessity to confirm the results in a larger cohort. A second limitation is that cardiovascular remodeling may be impacted by variables that could only be poorly or not at all taken into account here -i.e., changes in comorbidities, drug therapies and physical activity throughout the long follow-up period; and the impact of aging compared to that observed in a non-obese population of the same age range. Another limitation is the uncertainty regarding the actual clinical impact of the cardiovascular changes specifically related to additional weight gain. Indeed, several vascular and blood metabolic parameters have been observed to deteriorate over time in the absence of weight gain (Table 2), and these parameters may at least have an equivalent prognostic importance than the weight gain-related parameters (i.e., concentric remodeling index and effective arterial elastance).
CMR is not a widely available worldwide, and although our study measured LV concentric remodeling and Ea by CMR, these parameters may also be assessed using echography-Doppler techniques (25, 26). However the accuracy of these measurements is likely to be lower for echography-Doppler compared to CMR. Echography-Doppler nevertheless has the advantage of an easier evaluation of the LV diastolic function, an additional prognostic indicator (41), which is frequently affected in obese subjects (42). Unfortunately, the LV diastolic function could not be assessed in the present CMR study, which constitutes an additional limitation.
A final limitation is the absence of quantification of epicardial adipose tissue, a parameter that might significantly impact cardiovascular hemodynamics (43).
Conclusion
This MRI study shows that time periods characterized by significant weight gain are associated with additional increases in arterial load and load-related concentric LV remodeling in subjects with isolated abdominal obesity. Such changes indicate a real increase in cardiovascular risk, particularly for concentric LV remodeling, a recognized strong prognostic indicator (8–12).
Funding
This study was funded by a National Health Ministry (Programme Hospitalier de Recherche Clinique) and the 6th framework program of the European Commission (Ingenious HyperCare Network of Excellence; contract number LSHM-CT-2006-037093).
Publisher's Note
All claims expressed in this article are solely those of the authors and do not necessarily represent those of their affiliated organizations, or those of the publisher, the editors and the reviewers. Any product that may be evaluated in this article, or claim that may be made by its manufacturer, is not guaranteed or endorsed by the publisher.
Statements
Data availability statement
The raw data supporting the conclusions of this article will be made available by the authors, without undue reservation.
Ethics statement
The studies involving human participants were reviewed and approved by Comité de Protection des Personnes Nancy Est. The patients/participants provided their written informed consent to participate in this study.
Author contributions
DM, NG, ZL, and P-YM contributed significantly to the analysis and interpretation of the data. DM, DC, FZ, PR, and P-YM contributed to the writing of the manuscript and revision of the manuscript. OH, LF, EM, MN, and PB collaborated in the study implementation, and/or management of the included subjects. All authors contributed to the article and approved the submitted version.
Acknowledgments
The authors wish to thank Dr. Petra Neufing for critical review of the manuscript and Dr. Takeshi Otsuki for advice on the interpretation of the results.
Conflict of interest
NG, ZL, EM, FZ, and PR were employed by company CHRU-Nancy, INSERM, CIC. The remaining authors declare that the research was conducted in the absence of any commercial or financial relationships that could be construed as a potential conflict of interest.
References
1.
Bhaskaran K Dos-Santos-Silva I Leon DA Douglas IJ Smeeth L . Association of BMI with overall and cause-specific mortality: a population-based cohort study of 3·6 million adults in the UK. Lancet Diabetes Endocrinol. (2018) 6:944–53. 10.1016/S2213-8587(18)30288-2
2.
Saboor Aftab SA Reddy N Smith E Barber TM . Obesity and type 2 diabetes mellitus. Intern Med. (2014). S6:002. 10.4172/2165-8048.S6-002
3.
Mikkelsen KL Heitmann BL Keiding N Sørensen TI . Independent effects of stable and changing body weight on total mortality. Epidemiology. (1999) 10:671–8. 10.1097/00001648-199911000-00005
4.
Karahalios A English DR Simpson JA . Change in body size and mortality: a systematic review and meta-analysis. Int J Epidemiol. (2017) 46:526–46. 10.1093/ije/dyw246
5.
Pan XF Yuan JM Koh WP Pan A . Weight change in relation to mortality in middle-aged and elderly Chinese: the Singapore Chinese Health Study. Int J Obes (Lond). (2019) 43:1590–600. 10.1038/s41366-018-0259-y
6.
Wilner B Garg S Ayers CR Maroules CD McColl R Matulevicius SA et al . Dynamic relation of changes in weight and indices of fat distribution with cardiac structure and function: the dallas heart study. J Am Heart Assoc. (2017) 6:e005897. 10.1161/JAHA.117.005897
7.
Shah RV Murthy VL Abbasi SA Eng J Wu C Ouyang P et al . Weight loss and progressive left ventricular remodeling: the Multi-Ethnic Study of Atherosclerosis (MESA). Eur J Prev Cardiol. (2015) 11:1408–18. 10.1177/2047487314541731
8.
Tsao CW Gona PN Salton CJ Chuang ML Levy D Manning WJ et al . Left ventricular structure and risk of cardiovascular events: a framingham heart study cardiac magnetic resonance study. J Am Heart Assoc. (2015) 4:e002188. 10.1161/JAHA.115.002188
9.
Le TT Lim V Ibrahim R Teo MT Bryant J Ang B et al . The remodelling index risk stratifies patients with hypertensive left ventricular hypertrophy. Eur Heart J Cardiovasc Imaging. (2021) 22:670–9. 10.1093/ehjci/jeaa040
10.
Moazzami K Ostovaneh MR Ambale Venkatesh B Habibi M Yoneyama K Wu C et al . Left ventricular hypertrophy and remodeling and risk of cognitive impairment and dementia: MESA (Multi-Ethnic Study of Atherosclerosis). Hypertension. (2018) 71:429–6. 10.1161/HYPERTENSIONAHA.117.10289
11.
Fabiani I Pugliese NR La Carrubba S Conte L Antonini-Canterin F Colonna P et al . Incremental prognostic value of a complex left ventricular remodeling classification in asymptomatic for heart failure hypertensive patients. J Am Soc Hypertens. (2017) 11:412–9. 10.1016/j.jash.2017.05.005
12.
Pugliese NR Fabiani I La Carrubba S Conte L Antonini-Canterin F Colonna P et al . Classification and prognostic evaluation of left ventricular remodeling in patients with asymptomatic heart failure. Am J Cardiol. (2017) 119:71–7. 10.1016/j.amjcard.2016.09.018
13.
Phua AIH Le TT Tara SW De Marvao A Duan J Toh DF et al . Paradoxical higher myocardial wall stress and increased cardiac remodeling despite lower mass in femalesJ Am Heart Assoc. (2020) 9:e014781. 10.1161/JAHA.119.014781
14.
Marie PY Mandry D Huttin O Micard E Bonnemains L Girerd N et al . Comprehensive monitoring of cardiac remodeling with aortic stroke volume values provided by a phase-contrast MRI sequence. J Hypertens. (2016) 34:967–73. 10.1097/HJH.0000000000000889
15.
Mavrogeni S Katsi V Vartela V Noutsias M Markousis-Mavrogenis G Kolovou G et al . The emerging role of Cardiovascular Magnetic Resonance in the evaluation of hypertensive heart disease. BMC Cardiovasc Disord. (2017) 17:132. 10.1186/s12872-017-0556-8
16.
Huttin O Mandry D Eschalier R Zhang L Micard E Odille F et al . Cardiac remodeling following reperfused acute myocardial infarction is linked to the concomitant evolution of vascular function as assessed by cardiovascular magnetic resonance. J Cardiovasc Magn Reson. (2017) 19:2. 10.1186/s12968-016-0314-6
17.
Mandry D Eschalier R Kearney-Schwartz A Rossignol P Joly L Djaballah W et al . Comprehensive MRI analysis of early cardiac and vascular remodeling in middle-aged patients with abdominal obesity. J Hypertens. (2012) 30:567–73. 10.1097/HJH.0b013e32834f6f3f
18.
Poirier P Giles TD Bray GA Hong Y Stern JS Pi-Sunyer FX et al . Obesity and cardiovascular disease: pathophysiology, evaluation, and effect of weight loss: an update of the 1997 American Heart Association Scientific Statement on Obesity and Heart Disease from the Obesity Committee of the Council on Nutrition, Physical Activity, and Metabolism. Circulation. (2006) 113:898–918. 10.1161/CIRCULATIONAHA.106.171016
19.
Chadid S Singer MR Kreger BE Bradlee ML Moore LL . Midlife weight gain is a risk factor for obesity-related cancer. Br J Cancer. (2018) 118:1665–71. 10.1038/s41416-018-0106-x
20.
Spertus J Horvitz-Lennon M Abing H Normand SL . Risk of weight gain for specific antipsychotic drugs: a meta-analysis. NPJ Schizophr. (2018) 4:12. 10.1038/s41537-018-0053-9
21.
Keeney BJ Fulton-Kehoe D Wickizer TM Turner JA Chan KC Franklin GM . Clinically significant weight gain 1 year after occupational back injury. J Occup Environ Med. (2013) 55:318–24. 10.1097/JOM.0b013e31827943c6
22.
Treuer T Pendlebury J Lockman H Bushe C Karagianis J Raskin J et al . Weight Gain Risk Factor assessment checklist: overview and recommendation for use. Neuro Endocrinol Lett. (2011) 32:199–205.
23.
Monge García MI Saludes Orduña P Cecconi M . Understanding arterial load. Intensive Care Med. (2016) 42:1625–7. 10.1007/s00134-016-4212-z
24.
Kelly RP Ting CT Yang TM Liu CP Maughan WL Chang MS et al . Effective arterial elastance as index of arterial vascular load in humans. Circulation. (1992) 86:513–21. 10.1161/01.CIR.86.2.513
25.
Segers P Stergiopulos N Westerhof N . Relation of effective arterial elastance to arterial system properties. Am J Physiol Heart Circ Physiol. (2002) 282:H1041–46. 10.1152/ajpheart.00764.2001
26.
Chemla D Antony I Lecarpentier Y Nitenberg A . Contribution of systemic vascular resistance and total arterial compliance to effective arterial elastance in humans. Am J Physiol Heart Circ Physiol. (2003) 285:H614–20. 10.1152/ajpheart.00823.2002
27.
Otsuki T Maeda S Iemitsu M Saito Y Tanimura Y Ajisaka R et al . Contribution of systemic arterial compliance and systemic vascular resistance to effective arterial elastance changes during exercise in humans. Acta Physiol (Oxf). (2006) 188:15–20. 10.1111/j.1748-1716.2006.01596.x
28.
Otsuki T Maeda S Iemitsu M Saito Y Tanimura Y Ajisaka R et al . Systemic arterial compliance, systemic vascular resistance, and effective arterial elastance during exercise in endurance-trained men. Am J Physiol Regul Integr Comp Physiol. (2008) 295:R228–35. 10.1152/ajpregu.00009.2008
29.
de Simone G Daniels SR Devereux RB Meyer RA Roman MJ de Divitiis O et al . Left ventricular mass and body size in normotensive children and adults: assessment of allometric relations and impact of overweight. J Am Coll Cardiol. (1992) 20:1251–60. 10.1016/0735-1097(92)90385-Z
30.
Sorop O Olver TD van de Wouw J Heinonen I van Duin RW Duncker DJ et al . The microcirculation: a key player in obesity-associated cardiovascular disease. Cardiovasc Res. (2017) 113:1035–45. 10.1093/cvr/cvx093
31.
Sugiyama T Tsugawa Y Tseng CH Kobayashi Y Shapiro MF . Different time trends of caloric and fat intake between statin users and nonusers among US adults: gluttony in the time of statins?JAMA Intern Med. (2014) 174:1038–45. 10.1001/jamainternmed.2014.1927
32.
Belcik JT Qi Y Kaufmann BA Xie A Bullens S Morgan TK et al . Cardiovascular and systemic microvascular effects of anti-vascular endothelial growth factor therapy for cancer. J Am Coll Cardiol. (2012) 60:618–25. 10.1016/j.jacc.2012.02.053
33.
Jiang L Ren Y Yu H Guo YK Liu X Deng MY et al . Additive effect of hypertension on left ventricular structure and function in patients with asymptomatic type 2 diabetes mellitus. J Hypertens. (2021) 39:538–47. 10.1097/HJH.0000000000002643
34.
Grossman W Paulus WJ . Myocardial stress and hypertrophy: a complex interface between biophysics and cardiac remodeling. J Clin Invest. (2013) 123:3701–3. 10.1172/JCI69830
35.
de Simone G Palmieri V Koren MJ Mensah GA Roman MJ Devereux RB . Prognostic implications of the compensatory nature of left ventricular mass in arterial hypertension. J Hypertens. (2001) 19:119–25. 10.1097/00004872-200101000-00016
36.
de Simone G Kitzman DW Palmieri V Liu JE Oberman A Hopkins PN et al . association of inappropriate left ventricular mass with systolic and diastolic dysfunction: the HyperGEN study. Am J Hypertens. (2004) 17:828–33. 10.1016/S0895-7061(04)00818-0
37.
Muiesan ML de Simone G Ganau A Longhini C Verdecchia P Mancia G et al . Inappropriate left ventricular mass: Reliability and limitations of echocardiographic measurement for risk stratification and follow-up in single patients Working Group on Heart and Hypertension of Italian Society of Hypertension. J Hypertens. (2006) 24:2293–8. 10.1097/01.hjh.0000249709.44016.15
38.
Muntzel Martin S Al-Naimi Omar Ali S Barclay A Ajasin D . Cafeteria diet increases fat mass and chronically elevates lumbar sympathetic nerve activity in rats. Hypertension. (2019) 60:1498–502. 10.1161/HYPERTENSIONAHA.112.194886
39.
Davy KP Orr JS . Sympathetic nervous system behavior in human obesity. Neurosci Biobehav Rev. (2009) 33:116–24. 10.1016/j.neubiorev.2008.05.024
40.
Yashin AI Arbeev KG Wu D Arbeeva L Kulminski A Kulminskaya I et al . How genes modulate patterns of aging-related changes on the way to 100: biodemographic models and methods in genetic analyses of longitudinal data. N Am Actuar J. (2016) 20:201–32. 10.1080/10920277.2016.1178588
41.
Russo C Jin Z Homma S Rundek T Elkind MS Sacco RL et al . Effect of obesity and overweight on left ventricular diastolic function: a community-based study in an elderly cohort. J Am Coll Cardiol. (2011) 57:1368–74. 10.1016/j.jacc.2010.10.042
42.
Dini FL Fabiani I Miccoli M Galeotti GG Pugliese NR D'Agostino A et al . Prevalence and determinants of left ventricular diastolic dysfunction in obese subjects and the role of left ventricular global longitudinal strain and mass normalized to height. Echocardiography. (2018) 35:1124–31. 10.1111/echo.13890
43.
Pugliese NR Paneni F Mazzola M De Biase N Del Punta L Gargani L et al . Impact of epicardial adipose tissue on cardiovascular haemodynamics, metabolic profile, and prognosis in heart failure. Eur J Heart Fail. (2021). 10.1002/ejhf.2337PMID:34427016 [Epub ahead of print].
Summary
Keywords
obesity, weight gain, arterial load, cardiac remodeling, MRI
Citation
Mandry D, Girerd N, Lamiral Z, Huttin O, Filippetti L, Micard E, Ncho Mottoh M-PB, Böhme P, Chemla D, Zannad F, Rossignol P and Marie P-Y (2021) Arterial and Cardiac Remodeling Associated With Extra Weight Gain in an Isolated Abdominal Obesity Cohort. Front. Cardiovasc. Med. 8:771022. doi: 10.3389/fcvm.2021.771022
Received
05 September 2021
Accepted
18 October 2021
Published
05 November 2021
Volume
8 - 2021
Edited by
Giulia Elena Mandoli, University of Siena, Italy
Reviewed by
Dike Ojji, University of Abuja, Nigeria; Nicola Riccardo Pugliese, University of Pisa, Italy
Updates
Copyright
© 2021 Mandry, Girerd, Lamiral, Huttin, Filippetti, Micard, Ncho Mottoh, Böhme, Chemla, Zannad, Rossignol and Marie.
This is an open-access article distributed under the terms of the Creative Commons Attribution License (CC BY). The use, distribution or reproduction in other forums is permitted, provided the original author(s) and the copyright owner(s) are credited and that the original publication in this journal is cited, in accordance with accepted academic practice. No use, distribution or reproduction is permitted which does not comply with these terms.
*Correspondence: Pierre-Yves Mariepy.marie@chru-nancy.fr
This article was submitted to Cardiovascular Imaging, a section of the journal Frontiers in Cardiovascular Medicine
Disclaimer
All claims expressed in this article are solely those of the authors and do not necessarily represent those of their affiliated organizations, or those of the publisher, the editors and the reviewers. Any product that may be evaluated in this article or claim that may be made by its manufacturer is not guaranteed or endorsed by the publisher.