Abstract
Aims:
To explore the relationship between the severity of coronary artery disease (CAD) and the occurrence of ventricular tachycardia/ventricular fibrillation (VT/VF) in patients with acute myocardial infarction (AMI).
Methods:
We retrospectively enrolled 705 patients with AMI, who were hospitalized and underwent percutaneous coronary intervention (PCI), in Nanfang Hospital from July 2017 to July 2020. Logistic regression analysis and backward stepwise approach were taken to select the correlation factors. The left and the receiver operating characteristic curves (ROC) analysis were plotted to observe the discriminative power of the SYNTAX score (SS)/caFFR-guided functional SS (FSScaFFR) on the incident VT/VF.
Results:
About 58 (8.2%) patients experienced life-threatening VT/VF. The FSScaFFR (OR: 1.155; 95% CI: 1.047 to 1.273; p = 0.004) was an independent predictor of VT/VF after AMI. The ROC analysis showed that the discriminative power of FSScaFFR on the incident VT/VF was significantly better than SS (0.759 vs.0.695, p < 0.0001). Patients with VT/VF were categorized into 2 groups according to the interval between the onset of AMI and the VT/VF. The logistic regression analysis revealed that FSScaFFR was a significant independent correlation of early- and late-VT/VF.
Conclusion:
The incident VT/VF in patients with AMI is closely associated with the severity of CAD evaluated by SS and FSScaFFR. Compared to SS, FSScaFFR has a higher correlation with VT/VF, and FSScaFFR was demonstrated to be an independent correlation factor of incident VT/VF after AMI.
Introduction
Ventricular tachycardia/ventricular fibrillation (VT/VF) is one of the most severe complications in patients with acute myocardial infarction (AMI). Patients with AMI who develop VT/VF often show long-term hospitalization and a poor prognosis (1). Early identification of individuals at high risk of VT/VF may improve the prognosis of patients with AMI. Although many recent studies have described the risk factors for VT/VF after AMI, the relationship between the severity of coronary artery disease (CAD) and the occurrence of VT/VF in patients with AMI remains unclear.
The SYNTAX score (SS) is an anatomical scoring system that indicates the severity of coronary artery lesions according to the number of lesions, their functional role, location, and complexity (2). However, in many cases, the anatomic lesion severity does not match the coronary physiology using fractional flow reserve (FFR). Therefore, SS, based solely on anatomical information, may lead to an erroneous assessment of lesion complexity, limiting the discriminant ability of the SS. Thus, in 2011, the concept of the functional SS (FSS) was developed (SS is only calculated in vessels with low FFR) by Nam et al., and they demonstrated that the FSS has a better prognostic implication compared to classic SS (3).
Computational pressure-flow dynamics-derived FFR (caFFR) is derived without using a pressure wire or hyperemia induction. A recent study has validated that caFFR has high accuracy, sensitivity, and specificity, with FFR as the reference standard (4). Considering that caFFR is more economical and safer than traditional FFR, FSS guided by caFFR (FSScaFFR) is a faster and more accurate indicator to assess the severity of the patient's coronary artery. To our best knowledge, no literature report has evaluated the relationship between FSScaFFR and VT/VF.
Therefore, this study is aimed to investigate the impact of CAD severity on the incident VT/VF by using SS and FSScaFFR to evaluate the coronary conditions in patients with AMI. It also aimed to explore which index could better guide the clinical practice to reduce the occurrence of VT/VF and improve the prognosis of patients with AMI.
Methods
Study Population
We retrospectively enrolled 759 patients with AMI, who were hospitalized and had undergone percutaneous coronary intervention (PCI) at Nanfang Hospital of Southern Medical University from July 2017 to July 2020. Patients who met any of the following conditions were excluded: received thrombolysis or stent implantation or coronary artery bypass grafting (CABG) treatment in the past; developed AMI that was not caused by coronary stenosis or occlusion (such as myocardial infarction with no obstructive coronary atherosclerosis (MINOCA), acute myocarditis, aortic dissection); diagnosed with atrial or ventricular arrhythmia before admission; had severe valvular heart disease or congenital heart disease; had a severe infection or advanced cancer, malignant tumors, and other diseases at the time of admission; or had missed or incomplete clinical data. The study protocol was reviewed and approved by the Local Ethics Committee of the Southern Medical University in accordance with the Declaration of Helsinki.
The acute myocardial infarction was defined as cardiomyocyte necrosis in a clinical setting, consistent with acute myocardial ischemia. A combination of criteria is required to meet the diagnosis of AMI—i.e., the detection of an increase and/or decrease in a cardiac biomarker, preferably high-sensitivity cardiac troponin (hs-cTn) T or I, with at least one value above the 99th percentile of the upper reference limit and at least one of the following: symptoms of myocardial ischemia; new ischemic ECG changes; development of pathological Q waves on ECG; imaging evidence of loss of viable myocardium or new regional wall motion abnormality in a pattern consistent with an ischemic etiology; intracoronary thrombus detected on angiography or autopsy (5). The VT/VF was defined as a fatal ventricular tachycardia or fibrillation that lasted longer than 30 s or required electrical cardioversion and/or antiarrhythmic drugs. The observation time was the period from the onset of AMI to hospitalization. Additionally, to study the related factors affecting the onset time of VT/VF, we divided the patients with VT/VF into two groups according to the interval between the onset of AMI and the VT/VF: within 0–48 h after the onset of AMI (the early-VT/VF group) and 48 h after the onset of AMI (the late-VT/VF group). The clinical features were compared with those of the patients with non-VT/VF for each group to clarify the independent correlation factors of VT/VF.
Data Collection
In this study, the baseline characteristics, medical history data, and treatment strategy of patients were acquired through hospitalized medical records. Venous blood samples were collected from all the patients within 2 h after admission, and complete blood counts and blood biochemical parameters were measured. The peak N-terminal precursor brain natriuretic peptide (NT-proBNP), peak creatine kinase myocardial band (CK-MB), and peak cTnI of the patient were determined according to the blood biochemical results monitored during hospitalization. The estimated glomerular filtration rate (eGFR) was calculated by using the modification of diet in renal disease (MDRD) equation (6).
All the patients had completed echocardiographic testing within 48 h after admission and had undergone coronary angiography using the femoral or radial approaches. The procedure was performed by interventional cardiologists according to published guidelines, institutional policy, and routine practice.
Off-line caFFR assessment was performed by blinded experienced analysts certified in using the software with the FlashAngio system (including the FlashAngio console, FlashAngio software, and Flash Pressure transducer; Rainmed Ltd., Suzhou, China). The details of caFFR measurement were the same as those of the previously reported method (4). Fluoroscopic visualizations were analyzed by 2 independent and experienced interventional cardiologists who were blinded to all the data. In the case of disagreement on visual evaluation, the final decision was made by consensus. Each coronary (including the infarct-related artery) lesion that constituted luminal obstruction ≥ 1.5 mm in diameter and ≥ 50% stenosis was scored to count the SS using the online calculator version of 2.28 (www.syntaxscore.com). The FSScaFFR was defined as modified SS measured only in lesions with a caFFR of ≤0.8.
Statistical Analysis
The normal distribution of the data was tested using the one-sample Kolmogorov–Smirnov test. Continuous variables conforming to a normal distribution were expressed as means ± SD; otherwise, they were expressed as medians with an interquartile range. Categorical variables were summarized using proportions. Characteristics between the patients with and without VT/VF were analyzed using the chi-squared test for categorical variables and the t-test or the Mann–Whitney U test for continuous variables.
Variables that were statistically significant in the univariable logistic analysis were included in the multivariable logistic analysis. Stepwise backward likelihood ratio regression was performed to screen the variables by successively removing non-significant (p > 0.05) covariates until all the remaining variables were statistically significant. Notably, variables such as intra-aortic balloon pump (IABP), mechanical ventilation, temporary pacing, hemodialysis, and continuous renal replacement therapy (HD/CRRT) were not included in this analysis because they were more likely to be caused by VT/VF. Receiver operating characteristic curves (ROC) were plotted to show the power of SS and FSScaFFR to predict incident VT/VF. In all analyses, p < 0.05 was considered statistically significant. All analyses were conducted using SPSS (V.22.0) and MedCalc (V.15).
Results
Population Characteristics
Among the 705 included patients with AMI, 58 (8.2%) patients developed VT/VF (Figure 1). The details of these patients are listed in Table 1 and Supplementary Table 1.
Figure 1
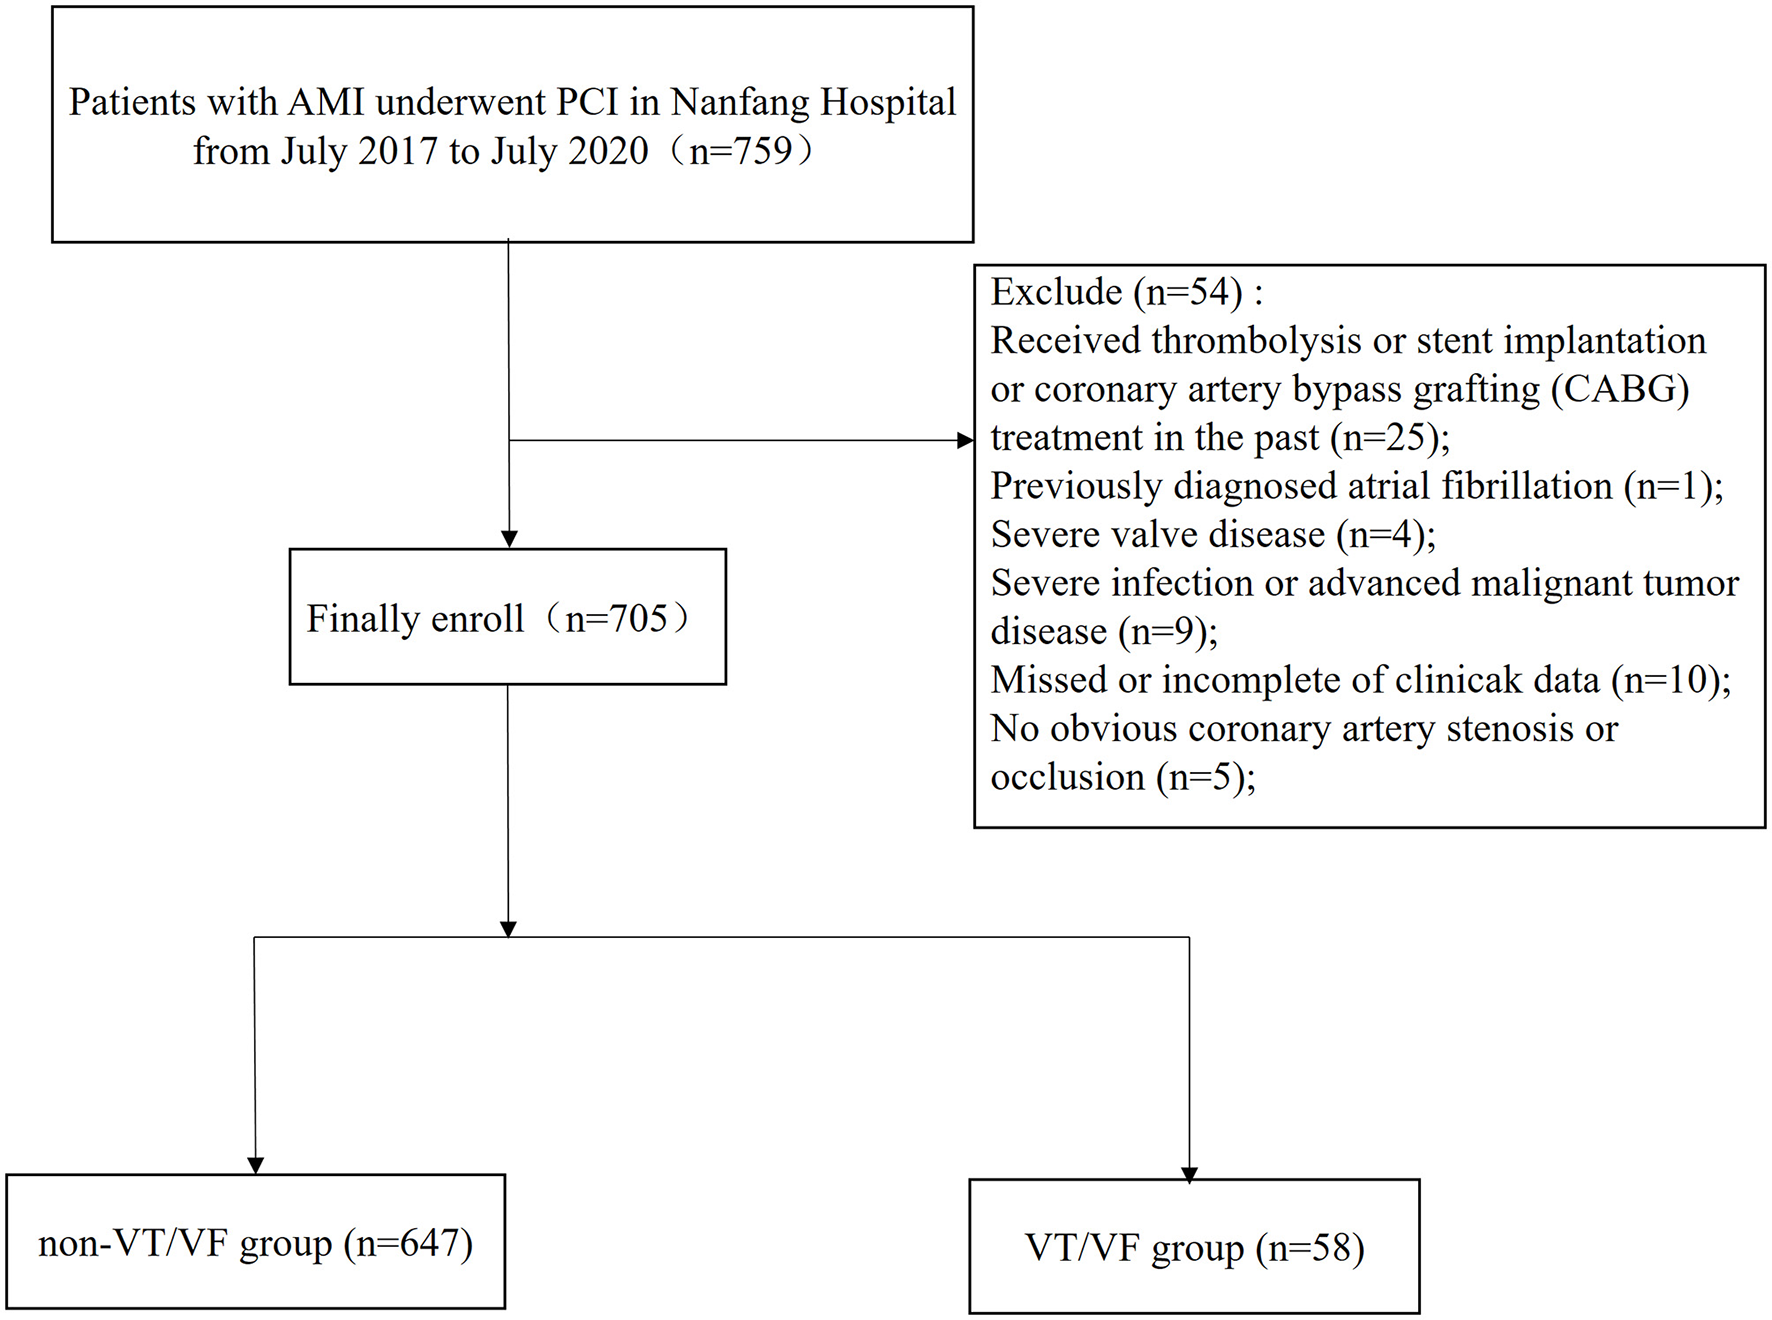
A flow chart of study design and participants.
Table 1
| Variables | Non–VT/VF group (n = 647) |
VT/VF group
(n = 58) |
p |
|---|---|---|---|
| Age (years) | 58 ± 13 | 62 ± 14 | 0.046 |
| Male (%) | 546 (82.8) | 43 (71.4) | 0.097 |
| SBP (mmHg) | 128 ± 20 | 114 ± 22 | <0.001 |
| DBP (mmHg) | 80 ± 14 | 71 ± 16 | <0.001 |
| Heartrate (bpm) | 80 ± 15 | 92 ± 23 | <0.001 |
| BMI (kg/m2) | 24.4 ± 3.0 | 24.5 ± 2.7 | 0.790 |
| Diabetes mellitus (%) | 195 (30.1) | 27 (46.6) | 0.010 |
| Hypertension (%) | 368 (56.9) | 28 (48.3) | 0.206 |
| Dyslipidemia (%) | 295 (45.6) | 29 (50.0) | 0.519 |
| COPD (%) | 20 (3.1) | 1 (1.7) | 0.557 |
| PAD (%) | 61 (9.4) | 8 (13.8) | 0.284 |
| Smoking (%) | 380 (58.7) | 33 (56.9) | 0.786 |
| STEMI (%) | 391 (60.4) | 49 (84.5) | <0.001 |
| Killip class>I (%) | 137 (21.2) | 39 (67.2) | <0.001 |
| Peak CK-MB (U/L) | 27.695 (5.445–121.880) | 84.180 (21.455–245.700) |
<0.001 |
| Peak CTnI (ng/ml) | 19.378 (3.526–50.000) | 50.000 (12.001–50.000) | 0.002 |
| Peak NT-ProBNP (pg/ml) | 864 (230–2520) | 3546 (976–8220) | <0.001 |
| WBC (×109/L) | 10.59 ± 3.49 | 13.89 ± 5.83 | <0.001 |
| Hemoglobin (g/L) | 141 ± 50 | 136 ± 22 | 0.517 |
| LDL-c (mmol/L) | 3.32 ± 1.06 | 3.48 ± 1.45 | 0.292 |
| HDL-c (mmol/L) | 1.05 ± 0.27 | 1.05 ± 0.29 | 0.967 |
| Cholesterol (mmol/L) | 4.97 ± 1.31 | 5.05 ± 1.69 | 0.692 |
| CRP (mg/L) | 4.185 (1.605–12.340) | 6.835 (2.318–15.233) | 0.050 |
| Uric acid (μmol/L) | 381 ± 112 | 452 ± 143 | <0.001 |
| HbAlc (%) | 6.0 (5.7–6.8) | 6.2 (5.8–7.1) | 0.140 |
| K+ (mmol/L) | 4.01 ± 0.47 | 4.16 ± 0.56 | 0.018 |
| Mg2+ (mmol/L) | 0.84 ± 0.10 | 0.90 ± 0.20 | <0.001 |
| SCr (μmol/L) | 100 ± 87 | 109 ± 36 | 0.437 |
| eGFR (ml/min/1.73 m2) | 83 ± 27 | 67 ± 24 | <0.001 |
| LVEF (%) | 57.7 ± 7.8 | 48.3 ± 10.0 | <0.001 |
| LVEDD (mm) | 45 ± 4 | 46 ± 6 | 0.124 |
| LVA (%) | 59 (9.1) | 11 (19.0) | 0.030 |
| β-blocker (%) | 446 (68.9) | 30 (51.7) | 0.007 |
| CCB (%) | 57 (8.8) | 3 (5.2) | 0.342 |
| ACEIs/ARBs (%) | 289 (44.7) | 15 (25.9) | 0.006 |
| Diuretics (%) | 123 (19.0) | 32 (55.2) | <0.001 |
| IABP (%) | 28 (4.3) | 24 (41.4) | <0.001 |
| Mechanical ventilation (%) | 7 (1.1) | 24 (41.4) | <0.001 |
| Temporary pacing (%) | 11 (1.7) | 10 (17.2) | <0.001 |
| HD/CRRT (%) | 9 (1.4) | 5 (8.6) | <0.001 |
| MI-PCI TIME interval (%) | 0.314 | ||
| <3 h | 82 (12.7) | 11 (19.0) | |
| 3–12 h | 246 (38.0) | 26 (44.8) | |
| 12–24 h | 93 (14.4) | 7 (12.1) | |
| 24–72 h | 88 (13.6) | 7 (12.1) | |
| >72 h | 138 (21.3) | 7 (12.1) | |
| Infarct related artery (%) | |||
| LAD | 328 (50.7) | 32 (55.2) | 0.514 |
| LCX | 100 (15.5) | 8 (13.8) | 0.736 |
| RCA | 201 (31.1) | 17 (29.3) | 0.782 |
| Other | 22 (3.4) | 2 (3.4) | 0.985 |
| LMCA disease (%) | 59 (9.1) | 15 (25.9) | <0.001 |
| Post-TIMI grade <3 (%) | 26 (4.0) | 8 (13.8) | <0.001 |
| Rentrop grade>1 (%) | 87 (13.4) | 12 (20.7) | 0.186 |
| Multivessel CAD (%) | 479 (74.0) | 45 (77.6) | 0.678 |
| Multivessel PCI (%) | 79 (12.2) | 7 (12.1) | 0.904 |
| Stents used per patient | 1.09 ± 0.51 | 1.27 ± 0.64 | 0.039 |
| SS | 24.4 ± 11.7 | 32.6 ± 13.5 | <0.001 |
| FSScaFFR | 18.0 ± 7.6 | 31.8 ± 9.1 | <0.001 |
Baseline characteristics of patients in the non–VT/VT group and the VT/VF group.
SBP, systolic blood pressure; DBP, diastolic blood pressure; BMI, body mass index; COPD, chronic obstructive pulmonary disease; PAD, peripheral artery disease; STEMI, ST-segment elevation myocardial infarction; eGFR, estimated glomerular filtration rate; WBC, white blood cell; CK-MB, creatine kinase-myocardial band; cTnI, cardiac troponin I; NT-proBNP, N-terminal precursor brain natriuretic peptide; WBC, white blood cell; LDL-C, low-density lipoprotein cholesterol; HDL-C, high-density lipoprotein cholesterol; CRP, C-reactive protein; HbAlc, glycated hemoglobin; K+, potassium; Mg2+, magnesium; SCr, serum creatinine; eGFR, estimated glomerular filtration rate; LVEF, left ventricular ejection fraction; LVEDD, left ventricular end-diastolic dimension; LVA, left ventricular aneurysm; CCB, calcium channel blocker; ACEIs/ARBs, angiotensin-converting enzyme inhibitors/angiotensin receptor blockers; IABP, intra-aortic balloon pump; HD/CRRT, hemodialysis/continuous renal replacement therapy; LAD, left anterior descending; LCX, circumflex; RCA, right coronary artery; LMCA, left main coronary artery; TIMI, thrombolysis in myocardial infarction; CAD, coronary artery disease; PCI, percutaneous coronary intervention; SS, SYNTAX score; FSScaFFR, functional SYNTAX score guided by computational pressure-flow dynamics-derived fractional flow reserve.
Compared with the non-VT/VF group, the patients with VT/VF had a higher Killip class and heart rate on admission and lower systolic blood pressure (SBP) and diastolic blood pressure (DBP). Patients with ST-elevation myocardial infarction (STEMI) and patients with diabetes were more likely to develop VT/VF. Regarding laboratory examinations, higher peak CK-MB, peak cTnI, peak NT-proBNP, white blood cell (WBC), C-reactive protein (CRP), uric acid, potassium (K+), magnesium (Mg2+), and lower eGFR values were found among patients who had developed VT/VF. Additionally, the patients with VT/VF had a lower LVEF and a higher incidence of the left ventricular aneurysm.
Regarding the therapies conducted in these patients, β-blockers and angiotensin-converting enzyme inhibitors/angiotensin receptor blockers (ACEIs/ARBs) were used less frequently among the patients with VT/VF. By contrast, the use of diuretics, IABP, mechanical ventilation, temporary pacing, and HD/CRRTwas higher in the patients with VT/VF.
Concerning coronary angiographic characteristics, the incidence of left main coronary artery (LMCA) disease and post-PCI TIMI Grade <3 was significantly higher in the VT/VF group. The patients who developed VT/VF had more coronary artery lesions and received more stents during the procedure. Notably, SS and FSScaFFR were significantly higher in the patients with VT/VF than those without VT/VF [32.6 ± 13.5 vs. 24.4 ± 11.7 (p < 0.001) and 31.8 ± 9.1 vs. 18. ± 7.6 (p < 0.001), respectively].
Correlation Factors of Incident VT/VF
The univariable logistic analysis date is detailed in Table 2. Using multivariable logistic analysis and the backward stepwise approach, SBP (OR: 0.969; 95% CI: 0.950 to.987; p = 0.001), STEMI (OR: 2.597; 95% CI: 1.048 to 6.452; p = 0.039), WBC (OR: 1.146; 95% CI: 1.064 to 1.234; p < 0.001), LVEF (OR: 0.952; 95% CI: 0.917 to.989; p = 0.011), diuretic (OR: 2.262; 95% CI: 1.074 to 4.785; p = 0.032), and FSScaFFR (OR: 1.155; 95% CI: 1.047 to 1.273; p = 0.004) were independent correlation factors of incident VT/VF after AMI (Table 3).
Table 2
| OR | 95%Cl | p | |
|---|---|---|---|
| Age (years) | 1.022 | 1.000–1.044 | 0.047 |
| Male (%) | 0.594 | 0.319–1.106 | 0.100 |
| SBP (every increase 10 mmHg) | 0.668 | 0.572–0.779 | <0.001 |
| DBP (every increase 10 mmHg) | 0.640 | 0.518–0.791 | <0.001 |
| Heartrate (bpm) | 1.040 | 1.025–1.055 | <0.001 |
| BMI (kg/m2) | 1.012 | 0.925–1.108 | 0.789 |
| Diabetes mellitus (%) | 2.019 | 1.173–3.473 | 0.011 |
| Hypertension (%) | 0.708 | 0.413–1.212 | 0.208 |
| Dyslipidemia (%) | 1.193 | 0.697–2.042 | 0.519 |
| COPD (%) | 0.550 | 0.072–4.173 | 0.563 |
| PAD (%) | 1.537 | 0.697–3.392 | 0.287 |
| Smoking (%) | 0.927 | 0.539–1.596 | 0.786 |
| Killipclass>I on admission (%) | 7.641 | 4.279–13.646 | <0.001 |
| STEMI (%) | 3.565 | 1.721–7.383 | 0.001 |
| Peak CK-MB (U/L) | 1.004 | 1.002–1.007 | <0.001 |
| Peak CTnI (ng/ml) | 1.022 | 1.008–1.036 | 0.002 |
| Peak NT-proBNP (every increase 100 pg/ml) |
1.004 | 1.001–1.007 | 0.014 |
| WBC (×109/L) | 1.200 | 1.128–1.276 | <0.001 |
| HGB (g/L) | 0.994 | 0.981–1.007 | 0.360 |
| LDL-c (mmol/L) | 1.133 | 0.898–1.428 | 0.292 |
| HDL-c (mmol/L) | 0.980 | 0.365–2.632 | 0.967 |
| Cholesterol (mmol/L) | 1.040 | 0.856–1.263 | 0.692 |
| CRP (mg/L) | 1.005 | 0.999–1.011 | 0.127 |
| Uric acid (μmol/L) | 1.005 | 1.003–1.007 | <0.001 |
| HbAlc (%) | 1.009 | 0.961–1.059 | 0.730 |
| K+ (every increase 0.1 mmol/l) | 1.067 | 1.012–1.126 | 0.017 |
| Mg2+ (every increase 0.1 mmol/l) | 1.393 | 1.157–1.678 | <0.001 |
| SCr (μmol/L) | 1.001 | 0.998–1.003 | 0.444 |
| eGFR (ml/min/1.73 m2) | 0.978 | 0.968–0.988 | <0.001 |
| LVEDD (mm) | 1.060 | 0.998–1.123 | 0.054 |
| LVEF (%) | 0.896 | 0.870–0.923 | <0.001 |
| LVA (%) | 2.332 | 1.148–4.739 | 0.019 |
| MI-PCI TIME | 0.798 | 0.645–1.314 | 0.127 |
| β-blocker (%) | 0.483 | 0.281–0.830 | 0.008 |
| CCB (%) | 0.565 | 0.171–1.862 | 0.348 |
| ACEIs/ARBs (%) | 0.432 | 0.235–0.794 | 0.007 |
| Diuretics (%) | 5.243 | 3.015–9.120 | <0.001 |
| Infarct related artery (%) | |||
| LAD | 1.197 | 0.698–2.054 | 0.514 |
| LCX | 0.875 | 0.403–1.902 | 0.736 |
| RCA | 0.920 | 0.510–1.659 | 0.782 |
| Other | 1.015 | 0.233–4.427 | 0.985 |
| LMCA disease (%) | 3.477 | 1.823–6.632 | <0.001 |
| PostTIMI grade <3 (%) | 3.822 | 1.645–8.880 | 0.002 |
| Rentrop grade>1 (%) | 1.679 | 0.856–3.296 | 0.132 |
| Multivessel CAD (%) | 0.869 | 0.448–1.686 | 0.678 |
| Multivessel PCI (%) | 0.950 | 0.417–2.167 | 0.904 |
| Stents used per patient | 1.653 | 1.027–2.660 | 0.039 |
| SS | 1.052 | 1.030–1.074 | <0.001 |
| FSScaFFR | 1.073 | 1.051–1.086 | <0.001 |
Univariable logistic regression analysis for relevant factors of VT/VF after acute myocardial infarction (AMI).
SBP, systolic blood pressure; DBP, diastolic blood pressure; BMI, body mass index; COPD, chronic obstructive pulmonary disease; PAD, peripheral artery disease; STEMI, ST-segment elevation myocardial infarction; eGFR, estimated glomerular filtration rate; WBC, white blood cell; CK-MB, creatine kinase-myocardial band; cTnI, cardiac troponin I; NT-proBNP, N-terminal precursor brain natriuretic peptide; WBC, white blood cell; LDL-C, low-density lipoprotein cholesterol; HDL-C, high-density lipoprotein cholesterol; CRP, C-reactive protein; HbAlc, glycated hemoglobin; K+, potassium; Mg2+, magnesium; SCr, serum creatinine; eGFR, estimated glomerular filtration rate; LVEF, left ventricular ejection fraction; LVEDD, left ventricular end-diastolic dimension; LVA, left ventricular aneurysm; CCB, calcium channel blocker; ACEIs/ARBs, angiotensin-converting enzyme inhibitors/angiotensin receptor blockers; IABP, intra-aortic balloon pump; HD/CRRT, hemodialysis/continuous renal replacement therapy; LAD, left anterior descending; LCX, circumflex; RCA, right coronary artery; LMCA, left main coronary artery; TIMI, thrombolysis in myocardial infarction; CAD, coronary artery disease; PCI, percutaneous coronary intervention; SS, SYNTAX score; FSScaFFR, functional SYNTAX score guided by computational pressure-flow dynamics-derived fractional flow reserve.
Table 3
| OR | 95%Cl | p | |
|---|---|---|---|
| SBP (every increase 10 mmHg) | 0.969 | 0.950–0.987 | 0.001 |
| STEMI (%) | 2.597 | 1.048–6.452 | 0.039 |
| WBC (×109/L) | 1.146 | 1.064–1.234 | <0.001 |
| LVEF (%) | 0.952 | 0.917–0.989 | 0.011 |
| Diuretics (%) | 2.262 | 1.074–4.785 | 0.032 |
| FSScaFFR | 1.155 | 1.047–1.273 | 0.004 |
Multivariable logistic regression analysis for independent predictors of VT/VF after AMI.
SBP, systolic blood pressure; STEMI, ST-segment elevation myocardial infarction; WBC, white blood cell; LVEF, left ventricular ejection fraction; FSScaFFR, functional SYNTAX score guided by computational pressure-flow dynamics-derived fractional flow reserve.
The Discriminative Power of SS/FSScaFFR and Risk Stratification of VT/VF
To further explore the relationship between SS/FSScaFFR and VT/VF, 705 patients were divided into tertiles (intertertile range: 19 to 28.5) of risk based on SS, i.e., low, medium, and high SS (33.6%, n = 237; 32.8%, n = 231; 33.6%, n = 237, respectively), and were analyzed. After calculating FSScaFFR, 22.4% of the high-risk SS group moved to the medium-risk FSScaFFR group and 13.1% moved to the low-risk FSScaFFR group, whereas 37.6% of the medium-risk SS group moved to the low-risk FSScaFFR group (Supplementary Figure 1).
The VT/VF occurred in 3.4, 6.9, and 14.3% of patients with low, medium, and high SS, respectively (p < 0.0001). A similar trend was observed in the FSScaFFR group (2.3, 10.2, and 19.6% in the low-, medium-, and high-FSScaFFR groups, respectively) (p < 0.0001) (Supplementary Figure 2).
The area under the curve (AUCs) of SS and FSScaFFR were 0.695 and 0.759, respectively, and both showed statistically significant differences (p < 0.001). Additionally, FSScaFFR demonstrated better discriminative power than SS, with a z-statistic of 6.349 (p < 0.0001) (Figure 2). Furthermore, we divided the participants into two score categories: the low-risk group (scores <25, risk = 4.20%) and the high-risk group (scores ≥ 25, risk = 19.70%) according to the cutoff value of FSScaFFR (Figure 3). The sensitivity and specificity were 67.2% and 74.2%, respectively (Table 4).
Figure 2
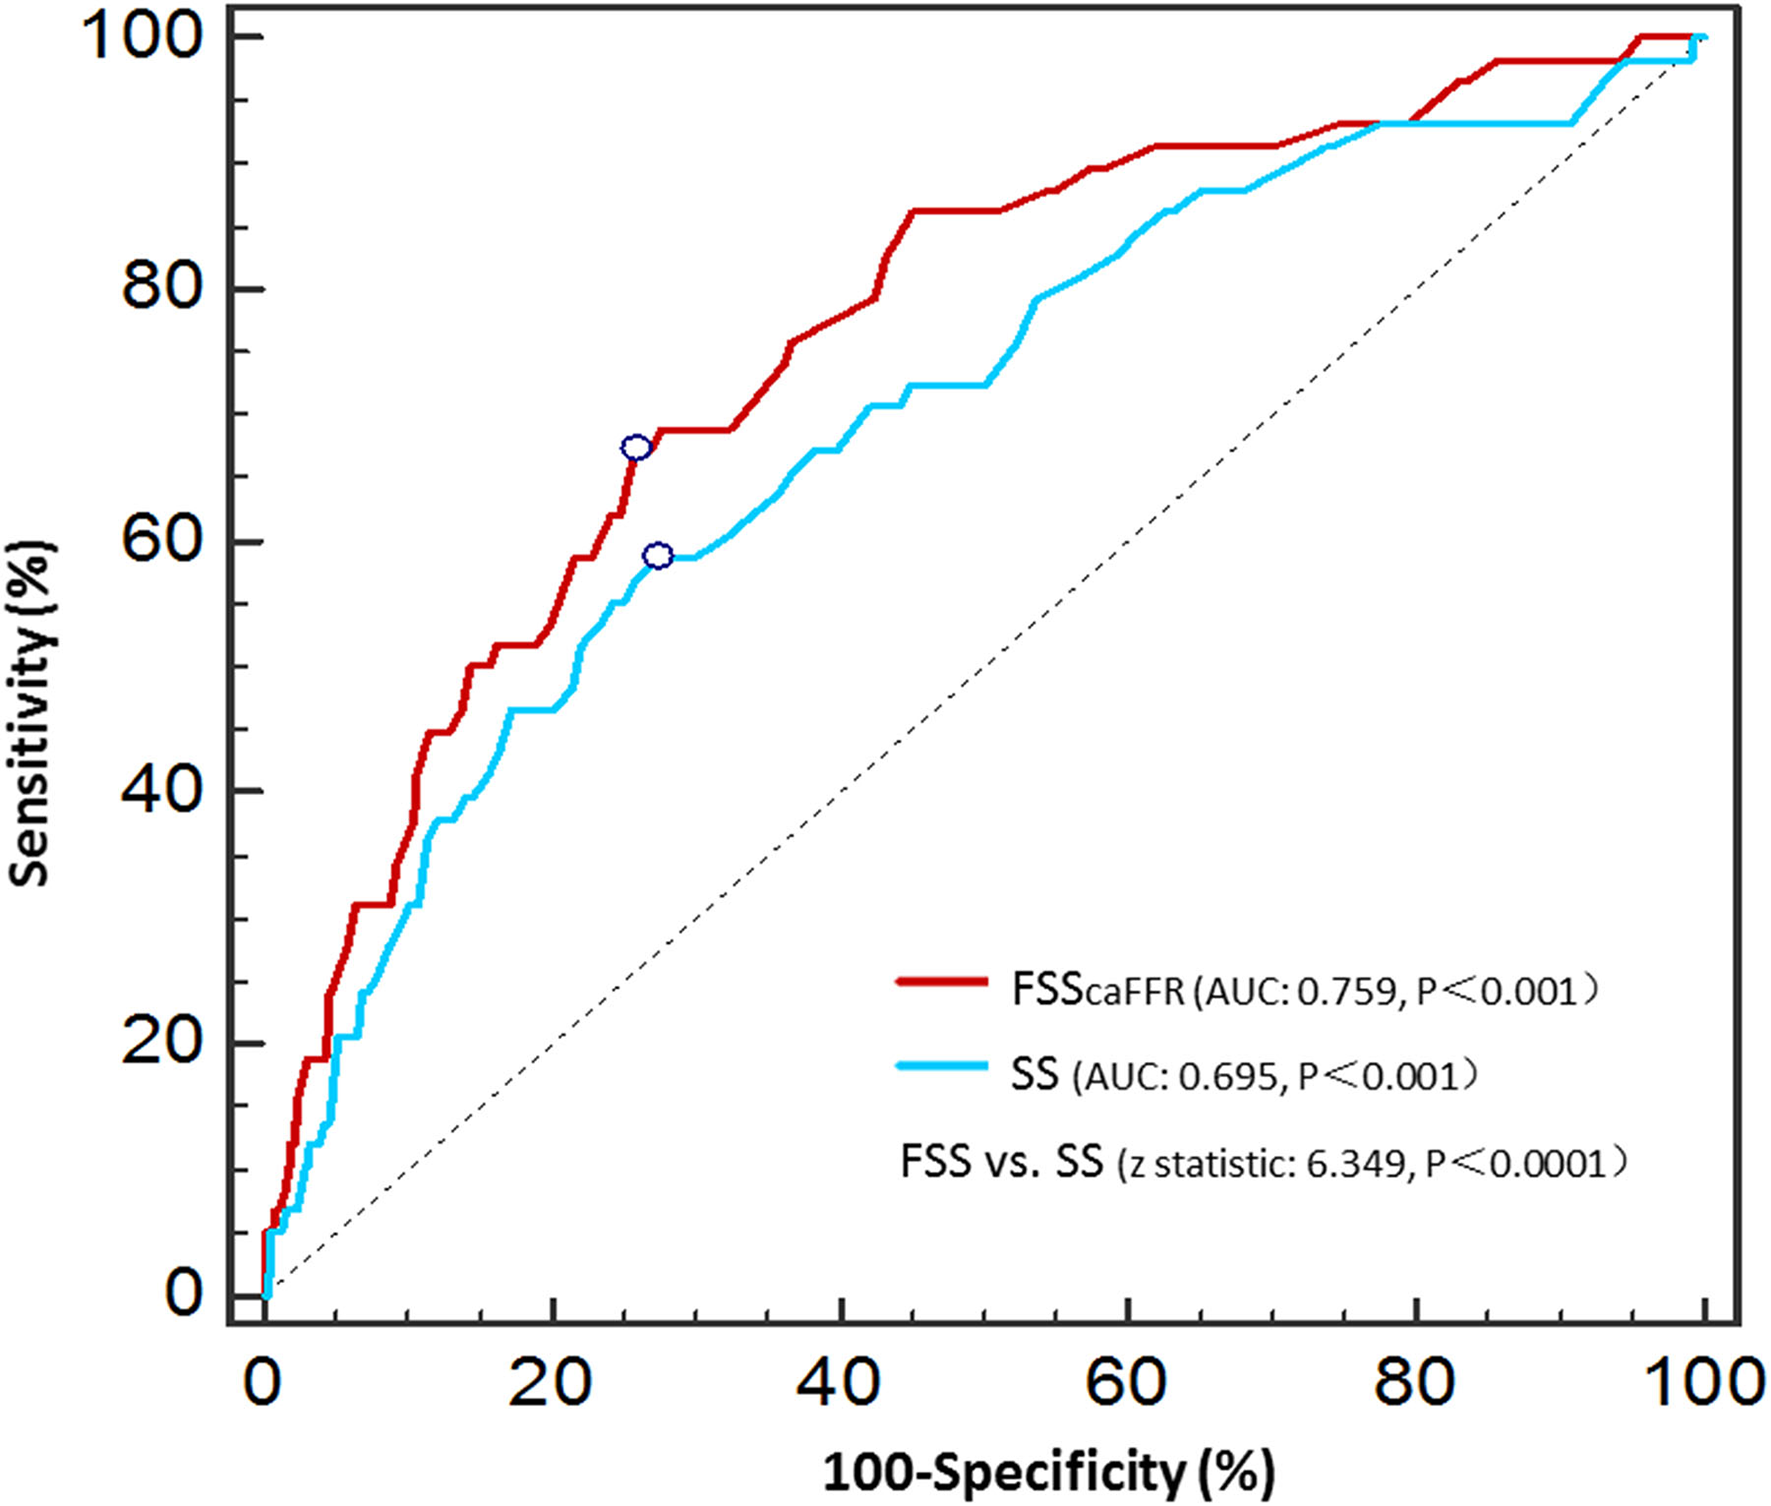
Receiver operator characteristic curves of the SS and FSScaFFR.
Figure 3
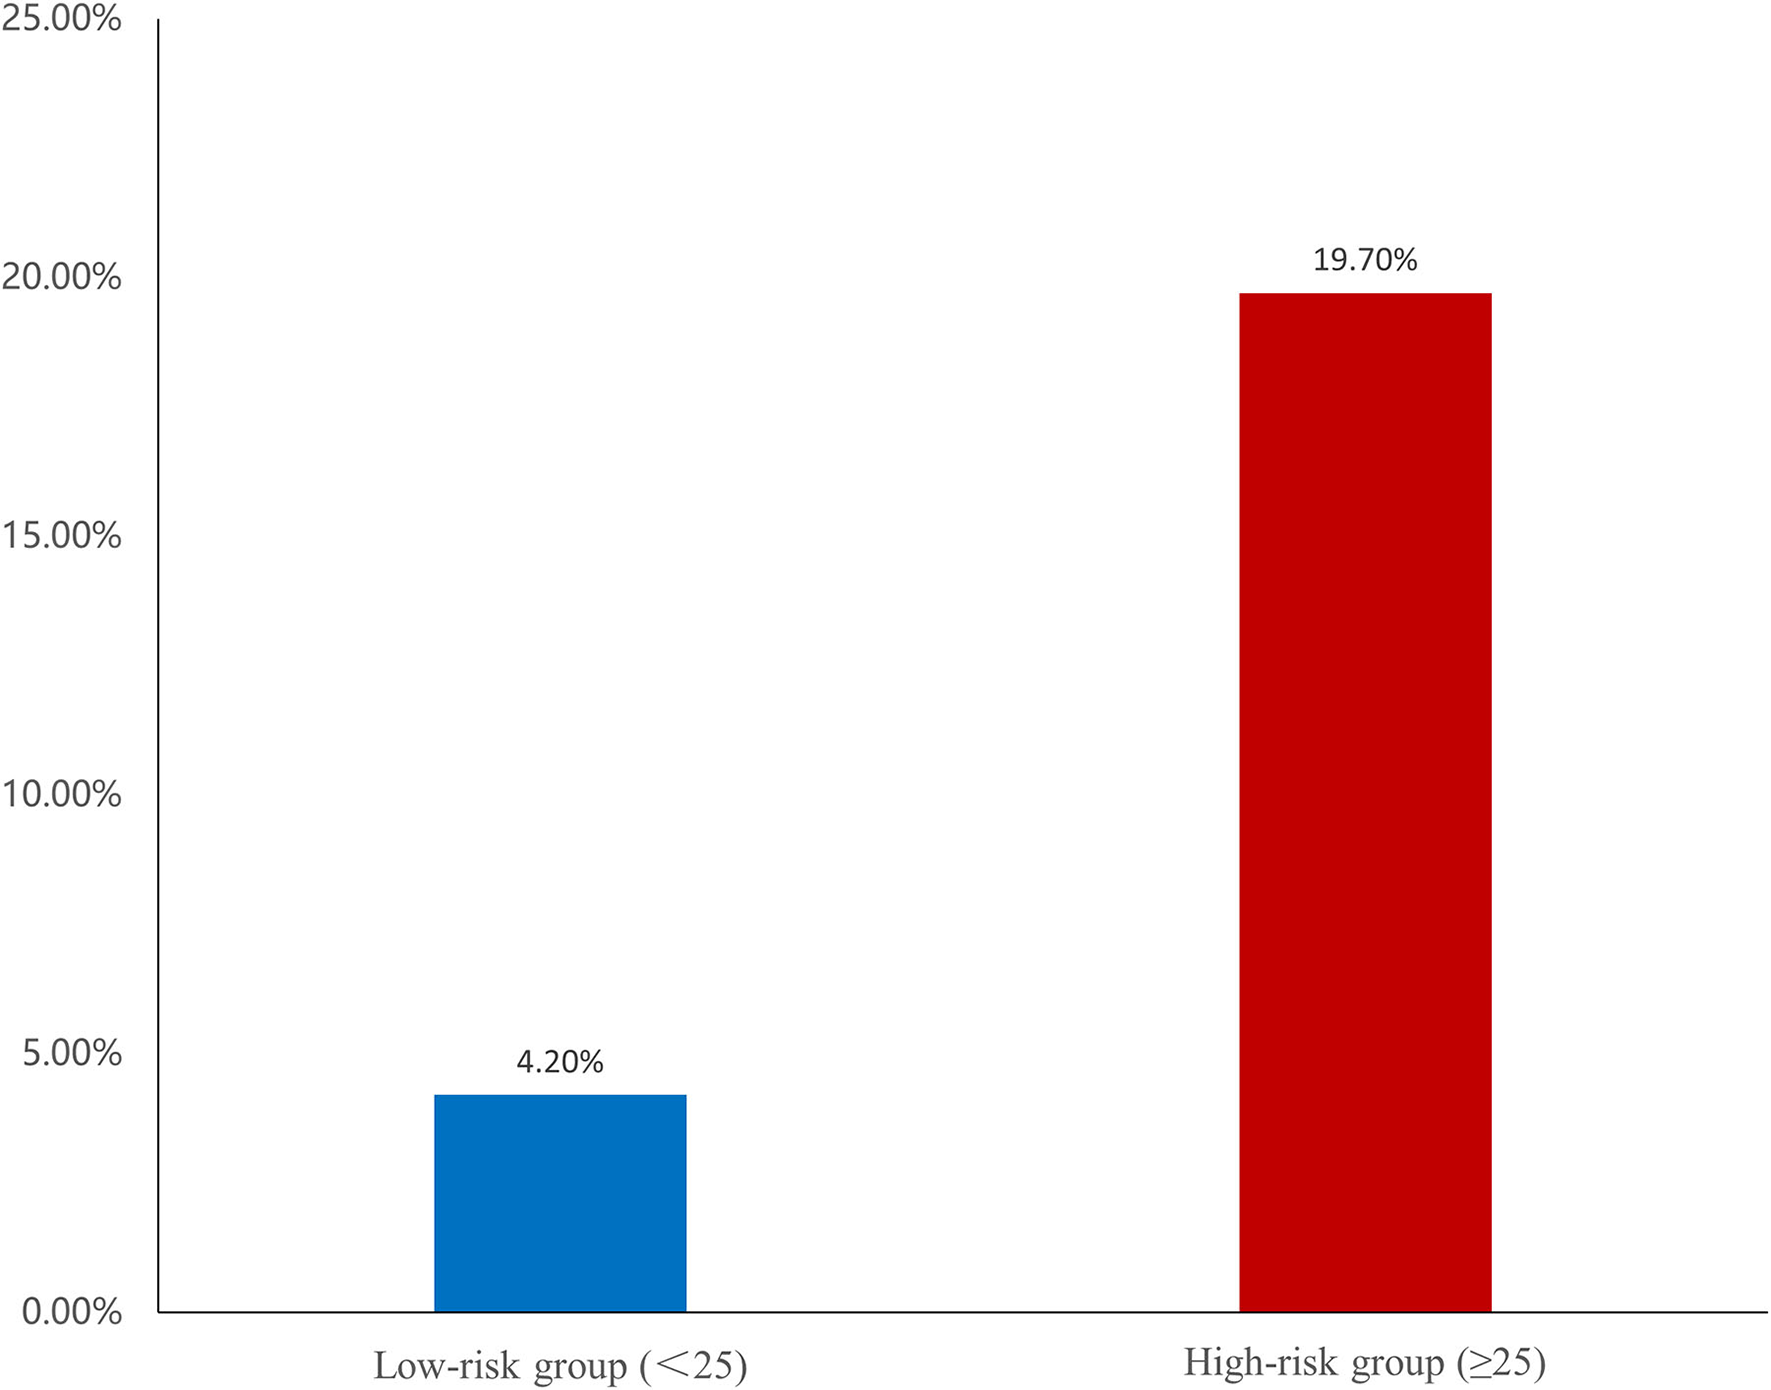
Risk of ventricular tachycardia/ventricular fibrillation (VT/VF) among two groups. The risk classes were categorized based on the cut-off value of FSScaFFR.
Table 4
| Cut-off | Sensitivity (%) | Specificity (%) | PPV (%) | NPV (%) | PLR | NLR | |
|---|---|---|---|---|---|---|---|
| SS | 30 | 58.6 | 72.6 | 17.3 | 94.7 | 2.139 | 0.570 |
| FSScaFFR | 25 | 67.2 | 74.2 | 20.3 | 95.9 | 2.605 | 0.442 |
The best cut-off value, sensitivity, specificity, positive predict value, negative predict value, positive likelihood ratio, negative likelihood ratio of SS and FSScaFFR.
SS, SYNTAX score; FSScaFFR, functional SYNTAX score guided by computational pressure-flow dynamics-derived fractional flow reserve; PPV, positive predict value; NPV, negative predict value; PLR, positive likelihood ratio; NLR, negative likelihood ratio.
Relationship Between FSScaFFR and Malignant Arrhythmia in Different Periods of AMI
Of the 58 patients with VT/VF, 39 developed VT/VF within 0–48 h after the onset of AMI, while 19 patients were assigned to the late-VT/VF group. Table 5 shows the univariate and multivariate logistic regression analysis results for the correlation factors of both categories of VT/VF. The significant correlation factors of early-VT/VF were STEMI and SBP, whereas those of late-VT/VF were worse Killip class, low LVEF, and long MI-PCI time interval. Finally, FSScaFFR and WBC were significant correlation factors in both the early- and late-VT/VF groups.
Table 5
| Non-VT/VF (n = 647) | Early-VT/VF (n = 39) | Univariate analysis | Multivariate analysis | Late-VT/VF (n = 19) | Univariate analysis | Multivariate analysis | |||||
|---|---|---|---|---|---|---|---|---|---|---|---|
| p | Or | 95%CI | p | p | Or | 95%CI | p | ||||
| Age (years) | 58 ± 13 | 62 ± 14 | 0.108 | 62 ± 14 | 0.213 | ||||||
| Male (%) | 546 (82.8) | 29 (74.4) | 0.181 | 14 (73.7) | 0.305 | ||||||
| SBP (every increase 10 mmHg) | 128 ± 20 | 111 ± 24 | <0.001 | 0.957 | 0.938–0.977 | <0.001 | 119 ± 18 | 0.045 | |||
| DBP (every increase 10 mmHg) | 80 ± 14 | 70 ± 19 | <0.001 | 73 ± 9 | <0.001 | ||||||
| Heartrate (bpm) | 80 ± 15 | 89 ± 21 | <0.001 | 98 ± 26 | <0.001 | ||||||
| BMI (kg/m2) | 24.4 ± 3.0 | 24.1 ± 2.6 | 0.521 | 25.4 ± 2.8 | 0.160 | ||||||
| Diabetes mellitus (%) | 195 (30.1) | 14 (35.9) | 0.449 | 13 (68.4) | 0.001 | ||||||
| Hypertension (%) | 368 (56.9) | 19 (48.7) | 0.320 | 9 (47.4) | 0.412 | ||||||
| Dyslipidemia (%) | 295 (45.6) | 20 (51.3) | 0.490 | 9 (47.4) | 0.878 | ||||||
| COPD (%) | 20 (3.1) | 1 (2.6) | 0.853 | 0 (0) | 0.998 | ||||||
| PAD (%) | 61 (9.4) | 7 (17.9) | 0.090 | 1 (5.3) | 0.545 | ||||||
| Smoking (%) | 380 (58.7) | 23 (59.0) | 0.976 | 10 (52.6) | 0.596 | ||||||
| Killipclass>I on admission (%) | 137 (21.2) | 22 (56.4) | <0.001 | 17 (89.5) | <0.001 | 8.621 | 1.613–45.455 | 0.012 | |||
| STEMI (%) | 391 (60.4) | 36 (92.3) | 0.001 | 6.369 | 1.751–23.255 | 0.005 | 13 (68.4) | 0.484 | |||
| Peak CK-MB (U/L) | 27.695 (5.445–121.880) | 155.920 (50.690–273.000) | <0.001 | 33.710 (18.170–131.820) | 0.927 | ||||||
| Peak CTnI (ng/ml) | 19.378 (3.526–50.000) | 50.000 (17.067–50.000) | 0.001 | 37.451 (1.516–50.000) | 0.479 | ||||||
| Peak NT-proBNP (every increase 100 pg/ml) |
864 (230–2520) | 1822 (787–4231) | 0.290 | 81.050 (48.780–195.680) | 0.021 | ||||||
| WBC (×109/L) | 10.59 ± 3.49 | 14.36 ± 6.56 | <0.001 | 1.176 | 1.088–1.271 | <0.001 | 12.92 ± 3.92 | 0.005 | 1.347 | 1.130–1.606 | 0.001 |
| Hemoglobin (g/L) | 141 ± 50 | 138 ± 20 | 0.760 | 132 ± 25 | 0.175 | ||||||
| LDL-c (mmol/L) | 3.32 ± 1.06 | 3.35 ± 1.05 | 0.873 | 3.75 ± 2.05 | 0.094 | ||||||
| HDL-c (mmol/L) | 1.05 ± 0.27 | 1.04 ± 0.25 | 0.694 | 1.08 ± 0.35 | 0.623 | ||||||
| Cholesterol (mmol/L) | 4.97 ± 1.31 | 4.88 ± 1.26 | 0.670 | 5.39 ± 2.36 | 0.189 | ||||||
| CRP (mg/L) | 4.185 (1.605–12.340) | 3.580 (1.600–12.210) | 0.831 | 14.160 (8.650–26.340) | 0.020 | ||||||
| Uric acid (μmol/L) | 381 ± 112 | 445 ± 153 | 0.001 | 466 ± 122 | 0.001 | ||||||
| HbAlc (%) | 6.0 (5.7–6.8) | 6.0 (5.8–6.6) | 0.942 | 6.9 (6.0–8.4) | 0.512 | ||||||
| K+ (every increase 0.1 mmol/l) | 4.01 ± 0.47 | 4.11 ± 0.59 | 0.199 | 4.28 ± 0.49 | 0.013 | ||||||
| Mg2+ (every increase 0.1 mmol/l) | 0.84 ± 0.10 | 0.91 ± 0.23 | 0.001 | 0.88 ± 0.11 | 0.077 | ||||||
| SCr (μmol/L) | 100 ± 87 | 103 ± 35 | 0.829 | 122 ± 36 | 0.315 | ||||||
| eGFR (ml/min/1.73 m2) | 83 ± 27 | 71 ± 25 | 0.012 | 58 ± 21 | <0.001 | ||||||
| LVEDD (mm) | 45 ± 4 | 45 ± 5 | 0.921 | 49 ± 7 | <0.001 | ||||||
| LVEF (%) | 57.7 ± 7.8 | 51.8 ± 8.1 | <0.001 | 41.0 ± 9.7 | <0.001 | 0.862 | 0.800–0.929 | <0.001 | |||
| LVA (%) | 59 (9.1) | 5 (12.8) | 6 (31.6) | 0.003 | |||||||
| MI-PCI TIME | <0.001 | 0.010 | 2.248 | 1.278–3.955 | 0.005 | ||||||
| <3 h | 82 (12.7) | 11 (28.2) | 0 (0) | ||||||||
| 3–12 h | 246 (38.0) | 23 (59.0) | 3 (15.8) | ||||||||
| 12–24 h | 93 (14.4) | 2 (5.1) | 5 (26.3) | ||||||||
| 24–72 h | 88 (13.6) | 3 (7.7) | 4 (21.1) | ||||||||
| >72 h | 138 (21.3) | 0 (0) | 7 (36.8) | ||||||||
| β-blocker (%) | 446 (68.9) | 22 (56.4) | 0.106 | 8 (42.1) | 0.018 | ||||||
| CCB (%) | 57 (8.8) | 2 (5.1) | 0.432 | 1 (5.3) | 0.594 | ||||||
| ACEIs/ARBs (%) | 289 (44.7) | 12 (30.8) | 0.094 | 3 (15.8) | 0.021 | ||||||
| Diuretics (%) | 123 (19.0) | 17 (43.6) | <0.001 | 15 (78.9) | <0.001 | ||||||
| Infarct related artery (%) | |||||||||||
| LAD | 328 (50.7) | 22 (56.4) | 0.489 | 10 (52.6) | 0.868 | ||||||
| LCX | 100 (15.5) | 4 (10.3) | 0.383 | 4 (21.1) | 0.510 | ||||||
| RCA | 201 (31.1) | 12 (30.8) | 0.969 | 5 (26.3) | 0.659 | ||||||
| Other | 22 (3.4) | 2 (5.1) | 0.571 | 0 (0) | 0.998 | ||||||
| LMCA disease (%) | 59 (9.1) | 6 (15.4) | 0.200 | 9 (47.4) | <0.001 | ||||||
| PostTIMI grade <3 (%) | 26 (4.0) | 4 (10.3) | 0.075 | 4 (21.1) | 0.002 | ||||||
| Rentrop grade>1 (%) | 87 (13.4) | 6 (15.4) | 0.732 | 6 (31.6) | 0.032 | ||||||
| Multivessel CAD (%) | 479 (74.0) | 27 (71.1) | 0.444 | 18 (94.7) | 0.098 | ||||||
| Multivessel PCI (%) | 79 (12.2) | 4 (10.3) | 0.665 | 3 (15.8) | 0.684 | ||||||
| Stents used per patient | 1.09 ± 0.51 | 1.08 ± 0.42 | 0.070 | 1.11 ± 0.66 | 0.649 | ||||||
| SS | 24.4 ± 11.7 | 29.2 ± 11.1 | 0.014 | 40.3 ± 15.3 | <0.001 | ||||||
| FSScaFFR | 18.0 ± 7.6 | 28.0 ± 11.2 | <0.001 | 1.055 | 1.024–1.087 | <0.001 | 39.7 ± 15.0 | <0.001 | 1.052 | 1.007–1.099 | 0.023 |
Characteristics of patients with early-VT/VF or late-VT/VF: univariate and multivariate analyses of the predictors in both groups.
SBP, systolic blood pressure; DBP, diastolic blood pressure; BMI, body mass index; COPD, chronic obstructive pulmonary disease; PAD, peripheral artery disease; STEMI, ST-segment elevation myocardial infarction; eGFR, estimated glomerular filtration rate; WBC, white blood cell; CK-MB, creatine kinase-myocardial band; cTnI, cardiac troponin I; NT-proBNP, N-terminal precursor brain natriuretic peptide; WBC, white blood cell; LDL-C, low-density lipoprotein cholesterol; HDL-C, high-density lipoprotein cholesterol; CRP, C-reactive protein; HbAlc, glycated hemoglobin; K+, potassium; Mg2+, magnesium; SCr, serum creatinine; eGFR, estimated glomerular filtration rate; LVEF, left ventricular ejection fraction; LVEDD, left ventricular end-diastolic dimension; LVA, left ventricular aneurysm; CCB, calcium channel blocker; ACEIs/ARBs, angiotensin-converting enzyme inhibitors/angiotensin receptor blockers; IABP, intra-aortic balloon pump; HD/CRRT, hemodialysis/continuous renal replacement therapy; LAD, left anterior descending; LCX, circumflex; RCA, right coronary artery; LMCA, left main coronary artery; TIMI, thrombolysis in myocardial infarction; CAD, coronary artery disease; PCI, percutaneous coronary intervention; SS, SYNTAX score; FSScaFFR, functional SYNTAX score guided by computational pressure-flow dynamics–derived fractional flow reserve.
Discussion
The present study is the first to show the correlation between FSS based on caFFR and incident VT/VF in patients with AMI. FSScaFFR was an independent relevant factor of incident VT/VF after AMI. The patients with a higher FSScaFFR of more than 25 showed a higher risk of VT/VF. We also found a significant independent correlation between FSScaFFR and early- and late-onset VT/VF. Overall, our study indicated that patients with AMI with higher FSScaFFR should be alerted to the incident VT/VF, and timely intervention measures should be conducted to prevent VT/VF in clinical practice.
In our study, 8.2% of patients with AMI developed life-threatening VT/VF, a value approximately similar to that reported in the previous studies (1, 7). Some clinical indices associated with incident VT/VF have been recognized in patients with AMI. Consistent with the results of previous studies, patients with STEMI (8–10), patients with lower SBP (1, 11, 12), and patients with reduced LVEF (13) showed an increased risk of incident VT/VF. We found that a higher WBC value showed a higher occurrence rate of VT/VF. Early studies have indicated that, in the acute phase of AMI, neutrophils begin to gather, denature, and infiltrate in the infarcted area under the action of cytokines and chemokines while releasing many inflammatory mediators, reactive oxygen species, and leukotrienes. These events cause the disturbance of local microcirculation and the disorder of cardiac electrophysiological activity, leading to the occurrence of VT/VF (14–16). The positive correlation between ventricular arrhythmias and diuretic use in patients with AMI is also described in the present study (17).
To date, no studies have elaborated on the relationship between SS and VT/VF in patients with AMI. Although SS in the present study was correlated with VT/VF, no statistical significance was found after adjusting for various confounding factors. The AUC value of SS is lower than 0.7, which might be explained by previous studies reporting that many significantly anatomic lesions had no significant functional stenosis (18, 19).
In 2010, the Fractional Flow Reserve vs. Angiography for Multivessel Evaluation (FAME) study demonstrated that FFR-guided PCI could improve the long-term prognosis of patients with multivessel CAD (20). Additionally, FSS as a combination concept of FFR and SS was introduced by Nam et al. (3). The FSS is not only concerned with the anatomic severity but also provided information on coronary physiology. According to the literature, FSS is more instructive in assessing coronary artery conditions and has better prognostic prediction power than SS (21, 22). The caFFR is a new FFR evaluation method. Its assessment is primarily based on angiography images and does not require a pressure wire or hyperemia induction. A recent study has shown that caFFR with FFR as the reference standard has good diagnostic accuracy and consistency (4). Therefore, caFFR has more comprehensive applicable indications than FFR, and it has good clinical application prospects.
Our study is the first to demonstrate that FSS based on caFFR is an independent predictor for VT/VF after AMI. According to the current theory, the occurrence of VT/VF after AMI is not only related to sympathetic excitatory factors caused by acute myocardial ischemia but also associated with abnormal myocardial metabolism, abnormal automaticity, and reentrant formation caused by reperfusion injury in the ischemic area (13). Early studies have shown that the degree of coronary atherosclerosis is more severe in patients with complex coronary artery disease, leading to a weakening of the coronary response to vasodilator factors such as nitric oxide, prostacyclin, and adenosine (23). This finding might explain why patients with AMI with higher FSScaFFR are more likely to develop VT/VF. We showed that the average of FSScaFFR was similar to the SS among the patients with VT/VF, but FSScaFFR was significantly lower than SS among the patients without VT/VF. Grouping patients according to their SS/FSScaFFR can explain this phenomenon more clearly. After calculating FSScaFFR, patients whose coronary disease severity was overestimated were reassigned to the lower risk group. Although both SS and FSScaFFR had significant differences in the incidence of VT/VF between the low-risk, medium-risk, and high-risk groups, the difference in the incidence of VT/VF was greater in the FSScaFFR group than in the SS group (Supplementary Figure 2), which indicated that FSScaFFR can better distinguish patients with different levels of severity of CAD. Additionally, ROC analysis showed that FSScaFFR has better discriminative power concerning the incident VT/VF than SS. Thus, SS combining anatomic and functional information is more relevant to incident VT/VF in patients with AMI than anatomic assessments alone.
Early studies have found that the mechanism and clinical characteristics of lethal VT/VF vary at different stages after AMI. The occurrence of VT/VF within 48 h after the onset of AMI may be more related to cardiac electrical and hemodynamic instability (24), while the occurrence of late VT/VF may be more related to overactivated inflammation and cardiac scar formation (25, 26). This finding indicates that the long-term prognosis of patients with early VT/VF may be different from that of patients with late VT/VF. To further investigate the relationship between FSScaFFR and the two types of VT/VF, the patients with VT/VF were categorized into two groups. Our results revealed that high FSScaFFR is an independent risk factor for both early and late VT/VF. Thus, the more severe the functional ischemia of the coronary artery, the more likely it is to cause electrical disturbances, thereby inducing early VT/VF. Similarly, the degree of functional ischemia of the coronary artery will also affect inflammation and the formation of cardiac scars, increasing the incidence of late VT/VF. Therefore, high FSScaFFR indicates that the incidence of VT/VF will increase in both early and late stages after myocardial infarction and extending monitoring time and early intervention may benefit patients with high FSScaFFR.
Limitations
Our study had several limitations. First, this study is a single-center retrospective study, and the study population was relatively small. Therefore, some bias may exist in the study population. Second, because of the limitation of retrospective data, our study did not consider the factor of microcirculation dysfunction during the period of AMI that might temporarily increase FFR of the coronary artery slightly (27, 28), thereby affecting the calculation of FSScaFFR. However, notably, the current mainstream condition to determine coronary ischemia in patients with AMI is still FFR ≤0.8 (29). Therefore, we believe that the results of this study are still reasonable and reliable. Third, the aortic root pressure was not measured in real-time, and it was obtained from the interventional database. Additionally, the hemodynamics of patients with AMI were very unstable. Therefore, it might slightly influence the results of caFFR because a real-time measured aortic root blood pressure can help obtain a more accurate result of caFFR (30). We believe that more prospective studies are needed to verify these findings in the future.
Conclusion
The present study is the first to comprehensively examine the relationship between the VT/VF and the severity of CAD using SS and FSScaFFR in patients with AMI. Our results showed that FSScaFFR has a higher correlation with VT/VF than SS. Additionally, FSScaFFR was an independent correlation factor of VT/VF, regardless of whether VT/VF occurred in the early or late stage after AMI.
Funding
This work was supported by the National Key R&D Program of China (No. 2018YFC1312803), National Natural Science Foundation (No. 81974266), and the Key Program of Zhengcheng Branch of Nanfang Hospital.
Publisher's Note
All claims expressed in this article are solely those of the authors and do not necessarily represent those of their affiliated organizations, or those of the publisher, the editors and the reviewers. Any product that may be evaluated in this article, or claim that may be made by its manufacturer, is not guaranteed or endorsed by the publisher.
Statements
Data availability statement
The original contributions presented in the study are included in the article/Supplementary Material, further inquiries can be directed to the corresponding author/s.
Ethics statement
The studies involving human participants were reviewed and approved by the Ethics Committee of the Southern Medical University. Written informed consent for participation was not required for this study in accordance with the national legislation and the institutional requirements.
Author contributions
JP and JX contributed to the conception or design of the work. JP, QZ, LL, YC, GL, HL, JL, XZ, YT, JP, YY, and DM contributed to the acquisition, analysis, or interpretation of data for the work. JP drafted the manuscript. JP, QZ, LL, and JX critically revised the manuscript. All authors take responsibility for all aspects of the reliability and freedom from bias of the data presented and their discussed interpretation, gave final approval and agreed to be accountable for all aspects of work, ensuring integrity, and accuracy.
Acknowledgments
All authors thank to Suzhou Rainmed, LTD, for measuring and providing the date of caFFR free of charge for research purposes.
Conflict of interest
The authors declare that the research was conducted in the absence of any commercial or financial relationships that could be construed as a potential conflict of interest.
Supplementary material
The Supplementary Material for this article can be found online at: https://www.frontiersin.org/articles/10.3389/fcvm.2022.807805/full#supplementary-material
Supplementary Figure 1Proportions of the study population according to the tertiles of the SS.
Supplementary Figure 2Incidence of VT/VF between low-risk, medium-risk, and high-risk groups of SS and FSScaFFR.
Supplementary Table 1Angiographic date of patients in the non-VT/VT group and the VT/VF group.
- AMI
acute myocardial infarction
- ACEIs/ARBs
angiotensin-converting enzyme inhibitors/angiotensin receptor blockers
- BMI
body mass index
- CABG
coronary artery bypass surgery
- CAD
coronary artery disease
- caFFR
coronary angiography-derived FFR
- CCB
calcium channel blocker
- CK-MB
myocardial creatine kinase
- COPD
chronic obstructive pulmonary diseases
- CRP
C-reactive protein
- CTnI
cardica troponin I
- DBP
diastolic blood pressure
- eGFR
estimated glomerular filtration rate
- FFR
fractional flow reserve
- FSS
functional SYNTAX score
- FSScaFFR
functional SYNTAX score guided by computational pressure-flow dynamics derived fractional flow reserve
- HD/CRRT
hemodialysis/continuous renal replacement therapy
- HDL-c
High-density lipoprotein cholesterol
- IABP
intra-aortic balloon pump
- LDL-c
low-density lipoprotein cholesterol
- LMCA
left main stem disease
- LVA
left ventricular aneurysm
- LVEDD
left ventricular end-diastolic dimension
- LVEF
left ventricular ejection fraction
- NT-proBNP
N-terminal precursor brain natriuretic peptide
- PAD
peripheral arterial disease
- PCI
percutaneous coronary intervention
- ROC
receiver operator characteristic curves
- SBP
systolic blood pressure
- SCr
creatinine
- STEMI
ST-segment elevation myocardial infarction
- SS
SYNTAX score
- SYNTAX
synergy between percutaneous coronary intervention with taxus and cardiac surgery
- TIMI
thrombolysis in myocardial infarction
- VT/VF
ventricular tachycardia/ventricular fibrillation
- WBC
white blood cell.
Abbreviations
References
1.
Mehta RH Starr AZ Lopes RD Hochman JS Widimsky P Pieper KS et al . Incidence of and outcomes associated with ventricular tachycardia or fibrillation in patients undergoing primary percutaneous coronary intervention. Jama. (2009) 301: 1779–89. 10.1001/jama.2009.600
2.
Sianos G Morel MA Kappetein AP Morice MC Colombo A Dawkins K et al . The SYNTAX Score: an angiographic tool grading the complexity of coronary artery disease. EuroIntervention. (2005) 1: 219–27. doi. Published 2005/08/01.
3.
Nam CW Mangiacapra F Entjes R Chung IS Sels JW Tonino PA et al . Functional SYNTAX score for risk assessment in multivessel coronary artery disease. J Am Coll Cardiol. (2011) 58: 1211–8. 10.1016/j.jacc.2011.06.020
4.
Li J Gong Y Wang W Yang Q Liu B Lu Y et al . Accuracy of computational pressure-fluid dynamics applied to coronary angiography to derive fractional flow reserve: FLASH FFR. Cardiovasc Res. (2020) 116: 1349–56. 10.1093/cvr/cvz289
5.
Collet JP Thiele H Barbato E Barthélémy O Bauersachs J Bhatt DL et al . (2020). ESC Guidelines for the management of acute coronary syndromes in patients presenting without persistent ST-segment elevation. Eur Heart J. (2020) 20: 125. 10.1093/eurheartj/ehaa909
6.
Levey AS Coresh J Greene T Stevens LA Zhang YL Hendriksen S et al . Using standardized serum creatinine values in the modification of diet in renal disease study equation for estimating glomerular filtration rate. Ann Intern Med. (2006) 145: 247–54. 10.7326/0003-4819-145-4-200608150-00004
7.
Gupta S Pressman GS Figueredo VM . Incidence of, predictors for, and mortality associated with malignant ventricular arrhythmias in non-ST elevation myocardial infarction patients. Coron Artery Dis. (2010) 21: 460–5. 10.1097/MCA.0b013e32834022fa
8.
Hasdai D Behar S Wallentin L Danchin N Gitt AK Boersma E et al . A prospective survey of the characteristics, treatments and outcomes of patients with acute coronary syndromes in Europe and the mediterranean basin; the euro heart survey of acute coronary syndromes (Euro Heart Survey ACS). Eur Heart J. (2002) 23: 1190–201. 10.1053/euhj.2002.3193
9.
Al-Khatib SM Granger CB Huang Y Lee KL Califf RM Simoons ML et al . Sustained ventricular arrhythmias among patients with acute coronary syndromes with no ST-segment elevation: incidence, predictors, and outcomes. Circulation. (2002) 106: 309–12. 10.1161/01.CIR.0000022692.49934.E3
10.
Newby LK Hasselblad V Armstrong PW Van de Werf F Mark DB White HD et al . Time-based risk assessment after myocardial infarction. implications for timing of discharge and applications to medical decision-making. Eur Heart J. (2003) 24: 182–9. 10.1016/S0195-668X(02)00301-9
11.
De Ferrari GM Dusi V Ruffinazzi M Masiello LC Ruffino E Cacciavillani L et al . Risk factors for primary ventricular fibrillation during a first myocardial infarction: Clinical findings from PREDESTINATION (PRimary vEntricular fibrillation and suDden dEath during firST myocardIal iNfArcTION). Int J Cardiol. (2020) 302: 164–70. 10.1016/j.ijcard.2019.10.060
12.
Kang DG Jeong MH Ahn Y Chae SC Hur SH Hong TJ et al . Clinical effects of hypertension on the mortality of patients with acute myocardial infarction. J Korean Med Sci. (2009) 24: 800–6. 10.3346/jkms.2009.24.5.800
13.
Kobayashi Y Tanno K Ueno A Fukamizu S Murata H Watanabe N et al . In-hospital electrical storm in acute myocardial infarction- clinical background and mechanism of the electrical instability. Circ J. (2018) 83: 91–100. 10.1253/circj.CJ-18-0785
14.
Botto N Sbrana S Trianni G Andreassi MG Ravani M Rizza A et al . An increased platelet-leukocytes interaction at the culprit site of coronary artery occlusion in acute myocardial infarction: a pathogenic role for “no-reflow” phenomenon?Int J Cardiol. (2007) 117: 123–30. 10.1016/j.ijcard.2006.04.060
15.
Ghaffari S Nadiri M Pourafkari L Sepehrvand N Movasagpoor A Rahmatvand N et al . The predictive value of total neutrophil count and neutrophil/lymphocyte ratio in predicting in-hospital mortality and complications after STEMI. J Cardiovasc Thorac Res. (2014) 6: 35–41. 10.5681/jcvtr.2014.007
16.
Grzybowski M Welch RD Parsons L Ndumele CE Chen E Zalenski R et al . The association between white blood cell count and acute myocardial infarction in-hospital mortality: findings from the National Registry of Myocardial Infarction. Acad Emerg Med. (2004) 11: 1049–60. 10.1197/j.aem.2004.06.005
17.
Laslett DB Cooper JM Greenberg RM Yesenosky GA Basil A Gangireddy C et al . Electrolyte abnormalities in patients presenting with ventricular arrhythmia (from the LYTE-VT Study). Am J Cardiol. (2020) 129: 36–41. 10.1016/j.amjcard.2020.04.051
18.
Tonino PA Fearon WF De Bruyne B Oldroyd KG Leesar MA Ver Lee PN et al . Angiographic versus functional severity of coronary artery stenoses in the FAME study fractional flow reserve versus angiography in multivessel evaluation. J Am Coll Cardiol. (2010) 55: 2816–21. 10.1016/j.jacc.2009.11.096
19.
Nakamura M Yamagishi M Ueno T Hara K Ishiwata S Itoh T et al . Prevalence of visual-functional mismatch regarding coronary artery stenosis in the CVIT-DEFER registry. Cardiovasc Interv Ther. (2014) 29: 300–8. 10.1007/s12928-014-0259-3
20.
Pijls NH Fearon WF Tonino PA Siebert U Ikeno F Bornschein B et al . Fractional flow reserve versus angiography for guiding percutaneous coronary intervention in patients with multivessel coronary artery disease: 2-year follow-up of the FAME (Fractional Flow Reserve Versus Angiography for Multivessel Evaluation) study. J Am Coll Cardiol. (2010) 56: 177–84. 10.1016/j.jacc.2010.04.012
21.
Asano T Katagiri Y Chang CC Kogame N Chichareon P Takahashi K et al . Angiography-derived fractional flow reserve in the SYNTAX II Trial: feasibility, diagnostic performance of quantitative flow ratio, and clinical prognostic value of functional SYNTAX score derived from quantitative flow ratio in patients with 3-vessel disease. JACC Cardiovasc Interv. (2019) 12: 259–70. 10.1016/j.jcin.2018.09.023
22.
Collet C Onuma Y Andreini D Sonck J Pompilio G Mushtaq S et al . Coronary computed tomography angiography for heart team decision-making in multivessel coronary artery disease. Eur Heart J. (2018) 39: 3689–98. 10.1093/eurheartj/ehy581
23.
Demirbag R Yilmaz R Gur M Kocyigit A Celik H Guzel S et al . Lymphocyte DNA damage in patients with acute coronary syndrome and its relationship with severity of acute coronary syndrome. Mutat Res. (2005) 578: 298–307. 10.1016/j.mrfmmm.2005.05.005
24.
Cinca J Warren M Carreño A Tresànchez M Armadans L Gómez P et al . Changes in myocardial electrical impedance induced by coronary artery occlusion in pigs with and without preconditioning: correlation with local ST-segment potential and ventricular arrhythmias. Circulation. (1997) 96: 3079–86. 10.1161/01.CIR.96.9.3079
25.
Doi M Nosaka K Miyoshi T Iwamoto M Kajiya M Okawa K et al . Early eicosapentaenoic acid treatment after percutaneous coronary intervention reduces acute inflammatory responses and ventricular arrhythmias in patients with acute myocardial infarction: a randomized, controlled study. Int J Cardiol. (2014) 176: 577–82. 10.1016/j.ijcard.2014.08.055
26.
Cronin EM Bogun FM Maury P Peichl P Chen M Namboodiri N et al . (2019). HRS/EHRA/APHRS/LAHRS expert consensus statement on catheter ablation of ventricular arrhythmias. Heart Rhythm. (2020) 17: e2–e154. 10.1016/j.hrthm.2019.03.002
27.
Severino P D'Amato A Pucci M Infusino F Adamo F Birtolo LI et al . Ischemic heart disease pathophysiology paradigms overview: from plaque activation to microvascular dysfunction. Int J Mol Sci. (2020) 21: 118. 10.3390/ijms21218118
28.
Xu H Liu J Zhou D Jin Y . Influence of microcirculation load on FFR in coronary artery stenosis model. BMC Cardiovasc Disord. (2020) 20: 144. 10.1186/s12872-020-01437-w
29.
Puymirat E Simon T de Bruyne B Montalescot G Steg G Cayla G et al . Rationale and design of the flow evaluation to guide revascularization in multivessel st-elevation myocardial infarction (FLOWER-MI) trial. Am Heart J. (2020) 222: 1–7. 10.1016/j.ahj.2019.12.015
30.
Huo Y Svendsen M Choy JS Zhang ZD Kassab GS . A validated predictive model of coronary fractional flow reserve. J R Soc Interface. (2012) 9:1325–38. 10.1098/rsif.2011.0605
Summary
Keywords
acute myocardial infarction, ventricular tachycardia, ventricular fibrillation, functional SYNTAX score, caFFR
Citation
Pan J, Zhang Q, Lei L, Chen Y, Li G, Liang H, Lu J, Zhang X, Tang Y, Pu J, Yang Y, Mo D and Xiu J (2022) Impact of the caFFR-Guided Functional SYNTAX Score on Ventricular Tachycardia/Fibrillation Development in Patients With Acute Myocardial Infarction. Front. Cardiovasc. Med. 9:807805. doi: 10.3389/fcvm.2022.807805
Received
02 November 2021
Accepted
09 March 2022
Published
12 April 2022
Volume
9 - 2022
Edited by
Antonios Karanasos, Hippokration General Hospital, Greece
Reviewed by
Jose Di Diego, Main Line Health, United States; Jinwei Tian, The Second Affiliated Hospital of Harbin Medical University, China
Updates
Copyright
© 2022 Pan, Zhang, Lei, Chen, Li, Liang, Lu, Zhang, Tang, Pu, Yang, Mo and Xiu.
This is an open-access article distributed under the terms of the Creative Commons Attribution License (CC BY). The use, distribution or reproduction in other forums is permitted, provided the original author(s) and the copyright owner(s) are credited and that the original publication in this journal is cited, in accordance with accepted academic practice. No use, distribution or reproduction is permitted which does not comply with these terms.
*Correspondence: Jiancheng Xiu xiujch@163.com
†These authors have contributed equally to this work and share first authorship
This article was submitted to Coronary Artery Disease, a section of the journal Frontiers in Cardiovascular Medicine
Disclaimer
All claims expressed in this article are solely those of the authors and do not necessarily represent those of their affiliated organizations, or those of the publisher, the editors and the reviewers. Any product that may be evaluated in this article or claim that may be made by its manufacturer is not guaranteed or endorsed by the publisher.