Abstract
Although the prevalence of heart failure with preserved ejection fraction (HFpEF) is increasing, evidence-based therapies for HFpEF remain limited, likely due to an incomplete understanding of this disease. This study sought to identify the cardiac-specific features of protein and phosphoprotein changes in a murine model of HFpEF using mass spectrometry. HFpEF mice demonstrated moderate hypertension, left ventricle (LV) hypertrophy, lung congestion and diastolic dysfunction. Proteomics analysis of the LV tissue showed that 897 proteins were differentially expressed between HFpEF and Sham mice. We observed abundant changes in sarcomeric proteins, mitochondrial-related proteins, and NAD-dependent protein deacetylase sirtuin-3 (SIRT3). Upregulated pathways by GSEA analysis were related to immune modulation and muscle contraction, while downregulated pathways were predominantly related to mitochondrial metabolism. Western blot analysis validated SIRT3 downregulated cardiac expression in HFpEF vs. Sham (0.8 ± 0.0 vs. 1.0 ± 0.0; P < 0.001). Phosphoproteomics analysis showed that 72 phosphosites were differentially regulated between HFpEF and Sham LV. Aberrant phosphorylation patterns mostly occurred in sarcomere proteins and nuclear-localized proteins associated with contractile dysfunction and cardiac hypertrophy. Seven aberrant phosphosites were observed at the z-disk binding region of titin. Additional agarose gel analysis showed that while total titin cardiac expression remained unaltered, its stiffer N2B isoform was significantly increased in HFpEF vs. Sham (0.144 ± 0.01 vs. 0.127 ± 0.01; P < 0.05). In summary, this study demonstrates marked changes in proteins related to mitochondrial metabolism and the cardiac contractile apparatus in HFpEF. We propose that SIRT3 may play a role in perpetuating these changes and may be a target for drug development in HFpEF.
Introduction
Heart failure (HF) is a clinical syndrome caused by abnormalities in the heart that limit its ability to fill or eject blood (1). Heart failure with preserved ejection fraction (HFpEF) is symptomatic clinical HF where left ventricular (LV) ejection fraction (EF) is preserved (LVEF ≥ 50%), and presently accounts for about 50% all HF clinical presentations. However, unlike HF with reduced EF (HFrEF), where LVEF is < 50%, there are limited evidence-based therapies for HFpEF (2–4). In addition to its escalating prevalence, HFpEF morbidity (5) and mortality (6) continues to increase. Central to HFpEF is the involvement of both cardiac and extra-cardiac abnormalities (7, 8). In contrast to HFrEF, HFpEF is highly associated with comorbidities and as such is a heterogenous multisystem disorder involving the heart, pulmonary, renal, adipose tissue, skeletal muscle, immune/inflammatory signaling and the vascular system (9, 10). Patients with HFpEF are generally older, more often female and have a predominance of comorbidities, such as hypertension, obesity, type 2 diabetes, atrial fibrillation, renal dysfunction, etc. (11, 12). However, the specific etiologies by which patients develop HFpEF are variable. Thus, a precision-based approach is needed to identify pathogenic mechanisms in HFpEF (10, 13).
Proteomic studies are powerful tools that allow for large-scale characterization of the entire protein phenotype in a biological system (14). Alterations in proteome patterns, such as global changes in protein expression and post-translational modifications (PTMs), are often indicative of marked changes in functional stages in health and disease (15). Thus, investigating the varying patterns of the proteome may provide insights into pathogenic pathways (16) and these protein signatures may facilitate rapid screening of the efficacy of novel treatments and aid in drug development (17, 18).
Previous proteomic studies have identified protein changes in dilated cardiomyopathy, atherosclerosis, and atrial fibrillation (19–23) and these types of studies likely provided a deeper mechanistic understanding of the molecular pathways in HF. For example, cardiac tissue from patients with HFrEF demonstrated protein modifications associated with cardiac metabolism, cardiac remodeling, and impaired cardiac contractility (24–27). Additionally, differentially regulated pathways by proteomic signatures were observed in HFrEF vs. HFpEF patients, which is consistent with the predominant view that the underlying pathophysiology in these two diseases are largely different, and thus the variable response to therapies. This difference is exemplified by Adamo et al., where blood samples from both HFrEF and HFpEF patients demonstrated increased growth factor signaling and increased angiogenesis markers, while proteomic signatures from only HFpEF patients showed increased humoral immunity and those from HFrEF patients showed increased extracellular matrix remodeling markers, consistent with active cardiac remodeling (28). These findings underscore the potential that high-performance proteomics, in combination with clinical assessment, may identify unique targets in specific groups of HF patients.
Although HFpEF is greatly impacted by the obesity and diabetes pandemic, hypertension remains the most prevalent and modifiable risk factor in HFpEF and is implicated in both its pathogenesis and prognosis (12, 29). Hypertensive HFpEF pathophysiology extends beyond the emphasis on LV hypertrophy development and diastolic dysfunction to impaired myocardial contractility, left atrial myopathy, cardiomyocyte remodeling, macro- and microvascular dysfunction, to systemic inflammation, fibrosis, and collagen deposition. However, despite this knowledge a paucity of therapies exists for HFpEF. Here, we applied a deep quantitative proteomics and phosphoproteomic profiling approach to identify molecular protein signatures that are altered in HFpEF in a well characterized murine model of hypertension-associated HFpEF, the SAUNA model (SAlty drinking water/Unilateral Nephrectomy/Aldosterone), which recapitulates the human HFpEF phenotype (30–37) (Supplementary Figure 1). Using an unbiased and comprehensive analysis, we report a systematic, large-scale study of pathway, metabolic and organelle level changes that occur in the left ventricle of this HFpEF murine model.
Material and methods
All procedures related to the handling and surgery of the mice conformed to the Guide for the Care and Use of Laboratory Animals published by the United States National Institutes of Health and were approved by the Institutional Animal Care and Use Committee at Boston University School of Medicine.
SAUNA model of HFpEF
As previously described (30–33, 35–37), eight-week-old male C57BL/6J mice (Jackson Laboratories) were anesthetized with 80–100 mg/Kg ketamine and 5–10 mg/Kg xylazine intraperitoneally. Mice (20–25 g) then underwent uninephrectomy, received either a continuous infusion of saline (Sham) or d-aldosterone (0.30 μg/h, Sigma-Aldrich, St. Louis, MO, United States; HFpEF) for 4 weeks via osmotic minipumps (Alzet, Durect Corp., Cupertino, CA, United States) and were maintained on 1% sodium chloride drinking water.
Physiological measurements
Blood pressure and echocardiographic measurements were performed at the end of the 4 weeks. Systolic blood pressure was measured using a non-invasive tail-cuff blood pressure analyzer (BP-2000 Blood Pressure Analysis System; Visitech Systems Inc., Apex, NC, United States). Transthoracic echocardiography was performed using a Vevo770 High-Resolution in vivo Micro-Imaging System and a Real-Time Micro Visualization 707B Scanhead (VisualSonic Inc., Toronto, ON, Canada) as previously described (33). Briefly, interventricular septum wall thickness (IVST), left ventricle (LV) posterior wall thickness (LVPWT), LV end-diastolic diameter (LVEDD), LV end-systolic diameter (LVESD), and LV ejection fraction (LVEF) were measured. As a measure of systolic function and cardiac contractility fractional shortening (FS) was calculated as follows (LVEDD-LVESD/LVEDD) × 100. Total wall thickness (TWT) was derived from an average of the IVST and LVPWT. Relative wall thickness (RWT) was calculated as 2× LVPWT/LVEDD. LV mass was calculated using the formula described by Kiatchoosakun et al. (38). As diastolic function is sensitive to heart rate (HR) and loading conditions, HR was maintained at ∼350 bpm during these measurements (39). Pulse wave measurements were then recorded and analyzed blinded to group.
Histopathological analyses
Paraffin-embedded sections (5 μm) of the mid-LV were stained with hematoxylin and eosin (H&E, Sigma-Aldrich) to measure LV cardiac myocyte cross-sectional area. Microscopy images (BZ-9000 BioRevo microscope, Keyence Corp. of America, Itasca, IL, United States) were analyzed blinded to group identity using ImageJ measuring software (National Institutes of Health, Bethesda, MD, United States).
Tissue sample preparation for proteomics and phosphoproteomics
Left ventricle samples from 4 mice/group were processed as previously described (22, 40–42). Briefly, freshly thawed samples were homogenized on ice in with a mixer mill MM 400 (Retsch USA Verder Scientific Inc., Newtown, PA, United States) in 10 volumes of 8 M urea, 50 mM ammonium bicarbonate, 2 mM dithiothreitol, and protease and phosphatase inhibitor cocktails (Roche Applied Science, Indianapolis, IN, United States). Tissue homogenate was then sonicated with a probe sonicator (Branson Ultrasonics Corporation, North Billerica, MA, United States) and centrifuged. After centrifugation, supernatant was decanted and total protein in each sample was determined using a modified “microtiter plate” version of the Bradford assay (Sigma-Aldrich). For phosphoproteomics experiments, aliquots containing 300 μg of protein were alkylated with 5 mM iodoacetamide for additional 45 min at room temperature in the dark. Samples were then diluted eight-fold with 50 mM ammonium bicarbonate and digested overnight with sequencing-grade trypsin (#90057, Thermo Fisher Scientific Inc., Waltham, MA, United States). Digestion was stopped by acidification to a final concentration of 1% (v/v) formic acid and the peptide solutions were desalted using disposable C18 Sep-Pak syringes (Waters Corporation, Milford, MA, United States) and lyophilized to dryness following manufacturer’s instructions.
Tandem mass tag (TMT) labeling
Peptide concentrations were determined by a colorimetric peptide assay kit (Thermo Fisher Scientific Inc., Waltham, MA, United States) and an aliquot of 100 μg was placed in 100 μl of 100 mM triethylammonium bicarbonate. Peptides were labeled with 0.4 mg of TMT label (TMT10plex™ Isobaric Label Reagent Set, Thermo Fisher Scientific Inc., Waltham, MA, United States). All samples were labeled in the same TMT-batch, representing reporter tags 126C, 127N, 127C, 128C, 129N, 129C, 130N, and 131N. Labeled samples were pooled, and 95% was set aside for phosphopeptide enrichment. The remaining 5% of labeled peptides and the phosphopeptide enriched samples were analyzed separately by mass spectrometry.
Phosphopeptide enrichment
Phosphopeptides were selectively enriched by binding to titanium dioxide (TiO2) beads (Titansphere Phos-TiO Bulk 10 μm, GL Sciences, Tokyo, Japan) (43). Briefly, peptides were resuspended in 200 μl 80% acetontirile, 6% trifluoroacetic acid and incubated for 10 min with 10 μl of slurry containing TiO2 beads. Unbound peptides and supernatant were decanted, and the beads were washed three times with a wash buffer containing 50% acetonitrile and 1% trifluoroacetic acid. After final decanting, the beads were incubated for 10 min with elution solution containing 25% ammonium hydroxide and 50% acetonitrile and the eluate was carefully removed and dried prior to mass spectrometry analysis.
Mass spectrometry analysis
Tryptic peptide mixtures and enriched phosphopeptides were analyzed by nano-scale high-performance liquid chromatography (Proxeon EASY-Nano system, Thermo Fisher Scientific Inc., Waltham, MA, United States) and online nano electrospray ionization tandem mass spectrometry (Q-Exactive HF-X mass spectrometer; Thermo Fisher Scientific Inc., Waltham, MA, United States). Briefly, samples were loaded in aqueous 0.1% (v/v) formic acid via a trap column (75 μm i.d. × 2 cm, Acclaim PepMap100 C18 3 μm, 100 Å, Thermo Fisher Scientific) and peptides were resolved over an Easy-Spray analytical column (50 cm × 75 μm ID, PepMap RSLC C18, Thermo Fisher Scientific) by an increasing mobile phase B. Mobile phase A consisted of 2% acetonitrile and 0.1% formic acid, and organic phase B contained 80% acetonitrile and 0.1% formic acid. Reverse phase separation was performed over 120 min at a flow rate of 300 nl/min. Eluted peptides were ionized directly into the mass spectrometer using a nanospray ion source. The mass spectrometer was operated in positive ion mode with a capillary temperature of 300 C, and with a potential of 2,100 V applied to the frit. Tandem mass spectrometry (MS/MS) was performed using high-energy collision-induced disassociation and 10 MS/MS data-dependent scans (45,000 resolution) were acquired in profile mode alongside each profile mode full-scan mass spectra (120,000 resolution) as reported previously (44). The automatic gain control (AGC) for MS scans was 1 × 10⁶ ions with a maximum fill time of 60 ms. The AGC for MS/MS scans was 3 × 10⁴, with 80 ms maximum injection time, 0.1 ms activation time, and 33% normalized collision energy. To avoid repeated selection of peptides for MS/MS a dynamic exclusion list was enabled to exclude all fragmented ions for 60 s.
Protein identification
Data files (RAW format) were searched using the standard workflow of MaxQuant (version 1.3.0.5)1 under standard settings using the entire Swiss-Prot mouse database2 downloaded January 24, 2019, allowing for two missed trypsin cleavage sites, carbamidomethylation of cysteine (fixed) and variable oxidation of methionine, protein N-terminal acetylation and phosphorylation of STY residues. Precursor ion tolerances were 20 ppm for first search and 4.5 ppm for a second search. The MS/MS peaks were de-isotoped and searched using a 20-ppm mass tolerance. A stringent false discovery rate threshold of 1% was used to filter candidate peptide, protein, and phosphosite identifications. The datasets generated for this study have been deposited and publicly available at the PRIDE Archive, proteomics data repository (European Bioinformatics Institute, European Molecular Biology Laboratory) with the data set identifier PXD033501.
Bioinformatics analysis
The searched intensity data were filtered, normalized, and clustered using Omics Notebook (45). Filtering was performed to remove any proteins or phosphopeptides not quantified in at least 70 percent of samples, with 2,905 and 281 proteins and phosphopeptides passing the filter, respectively. After filtering, both datasets showed low levels of sparsity and no missing value imputation was performed. The LIMMA R package was used for LOESS normalization and differential expression analysis (46). A combined ranked list for both sets was generated where duplicate gene entries were removed to keep the entry with the highest absolute rank value.
GSEA analysis
Gene Set Enrichment analysis (GSEA) software from the fgsea R package was used to compute gene set enrichment after ranking proteins by differential expression in HFpEF vs. Sham (45, 47, 48). Briefly, GSEA was used in rank mode along with gene sets downloaded from the Bader Lab (Mouse_GOBP_AllPathways_no_GO_iea_October_01_2018_ symbol.gmt)3 (49, 50). GSEA results were visualized using the Enrichment Map app (Version 3.1) in Cytoscape (Version 3.6.1) and highly related pathways were grouped into a theme and labeled by AutoAnnotate (version 1.2). For the merged gene set analyses, we applied an enrichment P < 0.01 and FDR ≤ 0.1 cutoffs and calculated overlap between gene set annotations using a combination of Jaccard and overlap coefficients with a cutoff of 0.375.
Titin isoform analysis
Additional studies were performed to investigate changes in titin isoforms in HFpEF. Briefly, LV protein lysates from Sham (N = 7) and HFpEF (N = 11) mice were extracted and electrophoresed in 1% agarose gels using a SE600X vertical gel system (Hoefer Inc., Holliston, MA, United States) as previously described (51). Gels were run at 15 mA constant current, stained with Neuhoff’s Coomassie (52), and then scanned using Epson Perfection V750 PRO scanner (Epson America Inc., Los Alamitos, CA, United States) and analyzed using One-D scan EX analysis software (Scanalytics Inc., Rockville, MD, United States). The integrated optical density of titin and total myosin heavy chain (MHC) was determined as a function of the slope of the linear range between integrated optical density and loaded volume (53). The expression of compliant N2BA titin, stiffer N2B titin and total titin (TT) was normalized to the expression of total MHC. The expression of titin degraded product (T2) was normalized to the TT expression.
SIRT3 immunoblotting analysis
Protein lysates were extracted from LV tissue using in ice-cold RIPA buffer as previously described (54). Equal amounts of protein were then subjected to electrophoresis in SDS-polyacrylamide gel under reducing conditions and blotted to polyvinylidene difluoride (PVDF) membranes using the Bio-Rad Transblot Turbo Transfer System (Hercules, CA, United States). The membranes were blocked in 5% BSA, 0.1% Tween-20 in tris-buffered saline for 1 h at room temperature and then incubated overnight at 4°C with rabbit anti-SIRT3 antibody (Cell Signaling Technology, Inc., Danvers, MA, United States, #5490; 1:1.000). Membranes were then washed with tris-buffered saline and incubated with respective horseradish peroxidase (HRP)-conjugated secondary antibodies for 1 h in room temperature: anti-rabbit antibody (R&D system, HAF008; 1:5,000). Immune complexes were detected with the enhanced chemiluminescence ECL detection system (Bio-Rad, #1705060) in the ImageQuant LAS 4000 biomolecular imaging system (GE Healthcare, Pittsburgh, PA, United States). The intensity of bands for each protein was normalized to the loading control mouse anti-GAPDH (Abcam, Ab8245; 1:10.000).
Statistical analysis
Proteomics and phosphoproteomics differential analysis were based on a moderated t-test and performed using R: A language and environment for statistical computing (R Foundation for Statistical Computing, Vienna, Austria) (45, 55). For histology analysis, titin isoform studies and SIRT3 expression, data are shown as mean ± SEM and statistical significance of differences was assessed using the Student’s t-test (two sided). In those cases when data were not sampled as a normal distribution, non-parametric Mann–Whitney U test was used. P ≤ 0.05 values were considered significant. These statistical tests were performed using GraphPad Prism software (GraphPad Software Inc., La Jolla, CA, United States).
Results
Mouse model of HFpEF
As previously described (30–33, 35–37), salty drinking water, unilateral nephrectomy, and chronic exposure to aldosterone (SAUNA) induced hypertension associated HFpEF in mice. Compared to Sham, HFpEF mice demonstrated a moderate increase in systolic blood pressure (137.8 ± 7.0 mmHg vs. 115.4 ± 6.0 mmHg; P < 0.05), lung congestion (4.5 ± 0.1 vs. 4.0 ± 0.1 P < 0.01), and LV hypertrophy, measured by the LV weight-to-total body weight ratio (3.7 ± 0.1 mg/g vs. 3.3 ± 0.1 mg/g; P < 0.05). Additionally, cardiomyocyte size was increased 1.2-fold in HFpEF mice vs. Sham; P < 0.05 (Supplementary Figure 2).
Echocardiography demonstrated preserved LVEF and increased LV mass (107.5 ± 4.9 mg vs. 78.2 ± 7.9 mg in Sham; P < 0.05; Table 1). Wall thickness was significantly increased in HFpEF and there was evidence of concentric hypertrophy, as demonstrated by the increased relative wall thickness (0.7 ± 0.1 vs. 0.5 ± 0.0 in Sham; P < 0.005). As previously shown (33), LV end-systolic dimensions and end-diastolic dimensions were also decreased in HFpEF (Table 1). HFpEF mice had impaired diastolic function, characterized by an increase in isovolumetric relaxation time (24.3 ± 2.6 ms vs. 14.4 ± 1.6 ms in Sham; P < 0.05).
TABLE 1
| HFpEF | Sham | |
| Systolic blood pressure (mmHg) | 137.8 ± 7.0* | 115.4 ± 6.0 |
| Wet-to-dry lung ratio | 4.5 ± 0.1** | 4.0 ± 0.1 |
| Heart weight-to-body weight (mg/g) | 3.7 ± 0.1* | 3.3 ± 0.1 |
| Left ventricle structure and function | ||
| LV mass (mg) | 107.5 ± 4.9* | 78.6 ± 7.9 |
| Total wall thickness (mm) | 1.0 ± 0.0*** | 0.8 ± 0.1 |
| Posterior wall thickness (mm) | 1.0 ± 0.1* | 0.8 ± 0.1 |
| Relative wall thickness | 0.7 ± 0.1*** | 0.5 ± 0.0 |
| LV end-systolic diameter (mm) | 1.1 ± 0.2* | 1.6 ± 0.1 |
| LV end-diastolic diameter (mm) | 3.0 ± 0.2 | 3.3 ± 0.1 |
| LV ejection fraction (%) | 91.1 ± 1.3 | 83.1 ± 3.0 |
| LV fractional shortening | 62.1 ± 2.3 | 52.0 ± 3.5 |
| E/A | 1.9 ± 0.2 | 1.7 ± 0.2 |
| Early filling deceleration time (ms) | 21.0 ± 3.0 | 17.6 ± 2.6 |
| Isovolumetric relaxation time (ms) | 24.3 ± 2.6* | 14.4 ± 1.6 |
Characteristics and echocardiographic parameters of HFpEF (SAUNA) mice 4 weeks after d-Aldosterone or saline (Sham) infusion.
Data are expressed as mean ± SEM. A, peak late transmitral flow velocity; E, peak early transmitral flow velocity; LV, left ventricular (N = 5 mice/group), *P < 0.05 vs. Sham; **P < 0.01 vs. Sham; ***P < 0.005 vs. Sham. Statistical analysis by two-tailed Student’s t-test.
Comparison to human HFpEF: Recently, two clinical scores (HFA-PEFF and H2FPEF) were developed to standardize the clinical diagnosis of human HFpEF. However, a discrepancy exists between these scores (56). The H2FPEF score largely includes clinical parameters whereas the HFA-PEFF score includes predominantly echocardiographic measures and natriuretic peptides. The HFA-PEFF score can rule in human HFpEF with high specificity (93%) and positive predictive value (98%) when the score is high (5–6 points) (57). As such, the translational utility of the HFpEF SAUNA mouse model was demonstrated in the context of this HFpEF score with a HFA-PEFF score of ≥ 6 as described by Withaar et al. (58), where a score of ≥ 5 is a high probability of clinical HFpEF.
Proteome profile of the left ventricle in HFpEF
To achieve comprehensive evaluation of the cardiac signaling that is seen in HFpEF, a global quantitative proteome and phosphoproteome profile was performed in LV cardiac tissue obtained from HFpEF mice and their respective Shams (N = 4 mice/group; Figure 1).
FIGURE 1
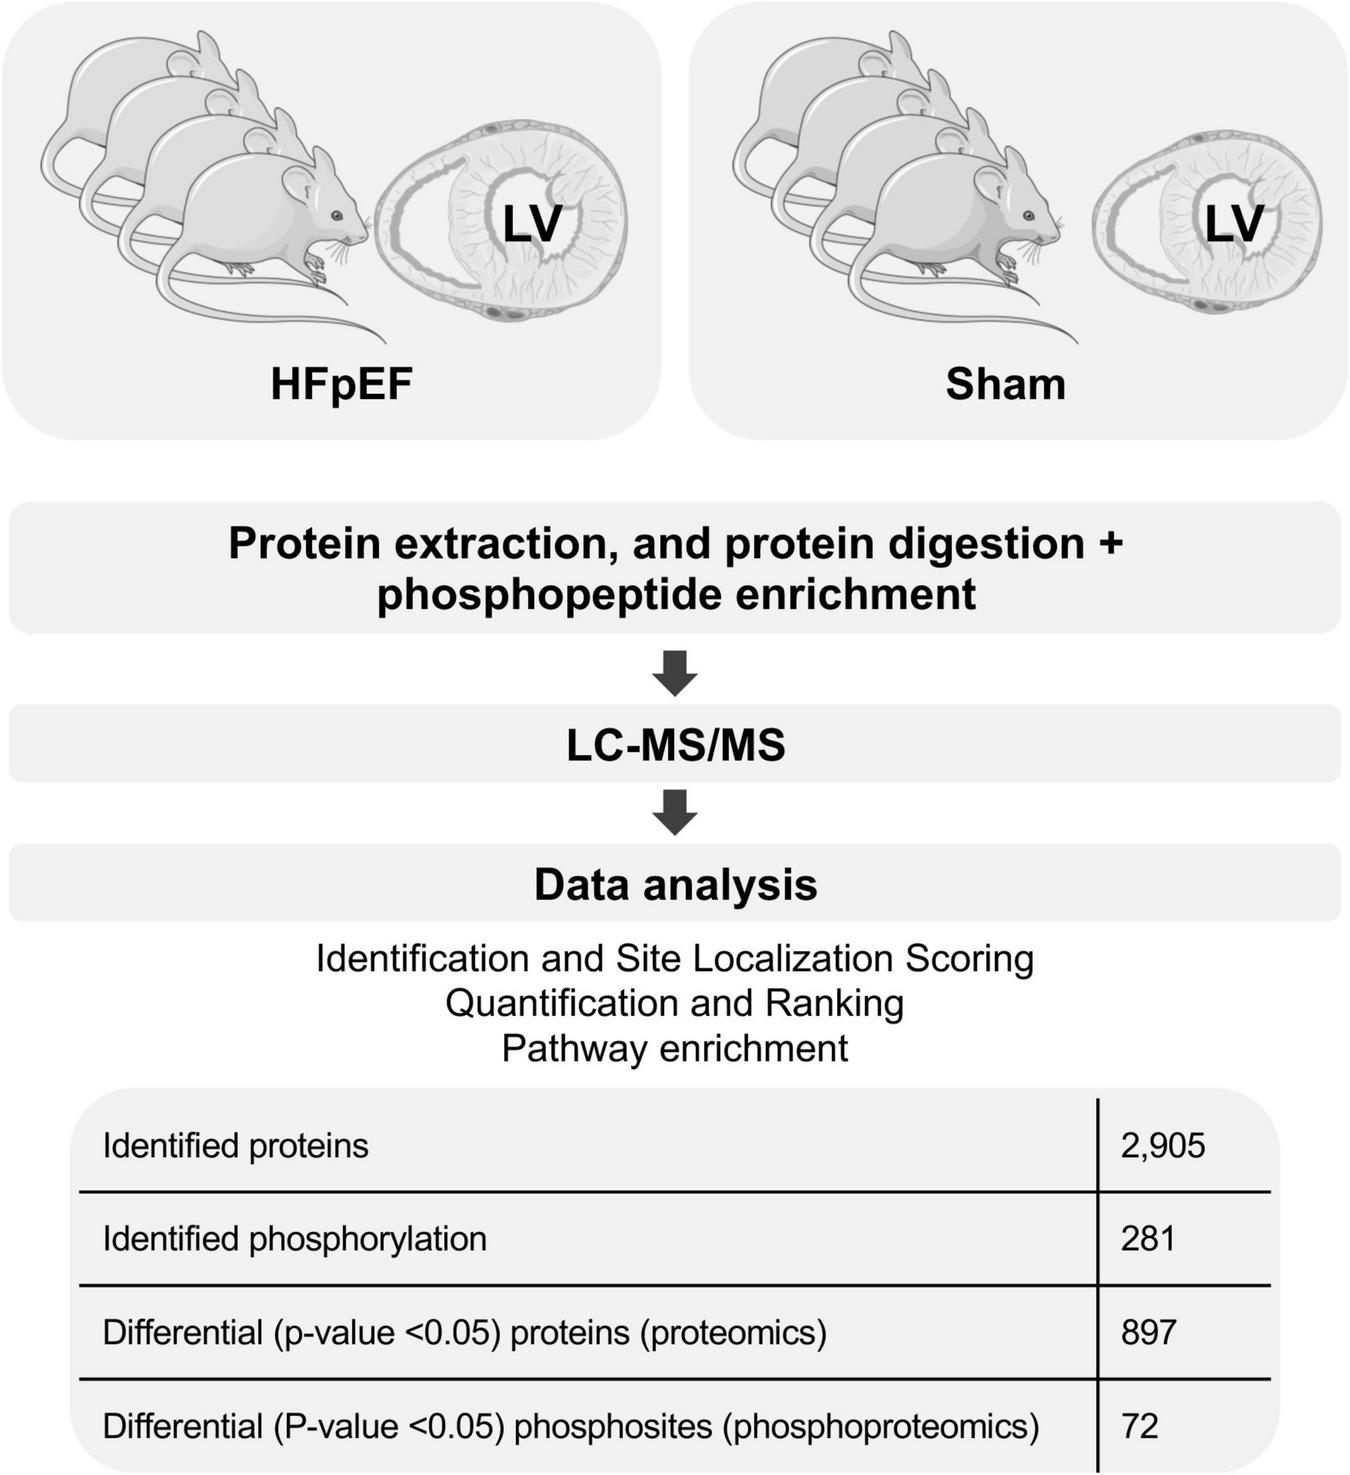
General proteomics and phosphoproteomics workflow. The figure was partly generated using Servier Medical Art, provided by Servier, licensed under a Creative Commons Attribution 3.0 unported license.
Proteomics analysis found a total of 2,905 identified proteins that were then used for comparative analysis (Supplementary Table 1). Among them, 897 proteins were differentially expressed between HFpEF and Sham LV, with 19% of these being predominantly higher in HFpEF than in Sham (P < 0.05; Figures 2A,B).
FIGURE 2
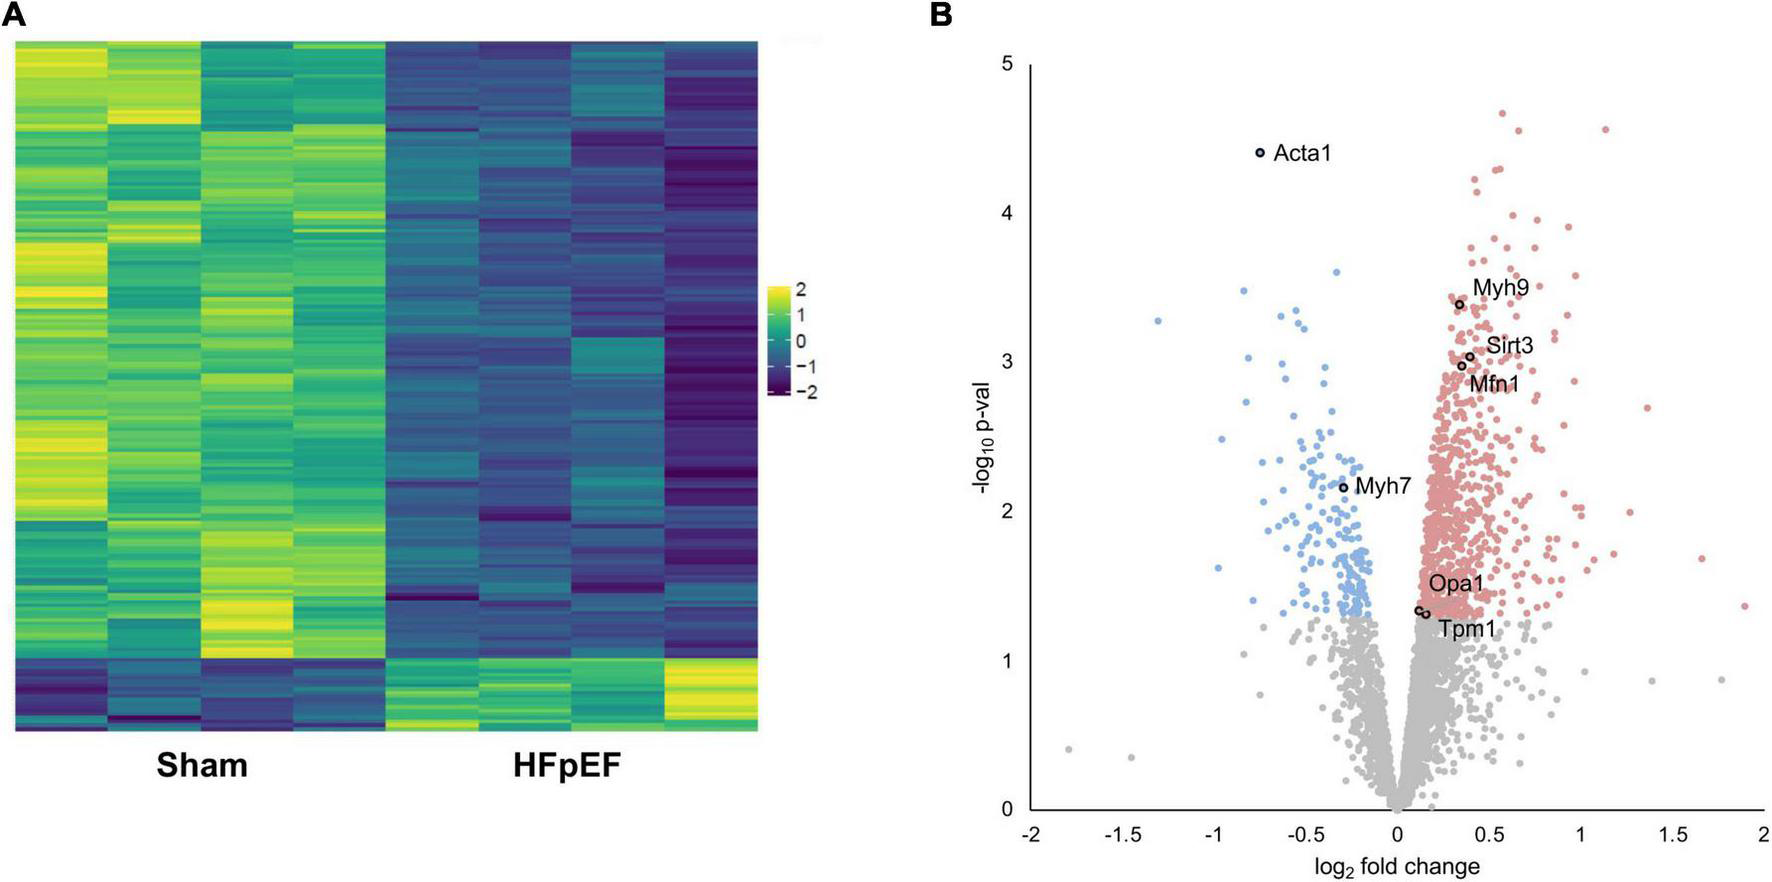
Proteomics analysis. (A) Heatmap of the differentially expressed proteins. (B) Volcano plot presenting log-transformed p-values (t-test) associated with individual significantly altered proteins plotted against log-transformed fold change in abundance between the left ventricles in Sham and HFpEF mice. Blue and red dots represent up-regulation and down-regulation in HFpEF (N = 4) vs. Sham (N = 4), respectively.
Systematic evaluation of the datasets revealed abundant changes in sarcomeric proteins, namely skeletal alpha (α)-actin (ACTA1; P = 0.000039), beta (β)-myosin heavy chain (MYH7; P = 0.006963), myosin heavy chain 9 (MYH9; P = 0.000408), tropomyosin alpha (α)-1 chain (TPM1; P = 0.048698); the mitochondria-related proteins mitofusin 1 (MFN1; P = 0.001059), mitochondrial dynamin like GTPase (aka optic atrophy protein 1, OPA1; P = 0.046441) and transcription factor A mitochondrial (TFAM; P = 0.005837); and the NAD-dependent protein deacetylase sirtuin-3 (SIRT3; P = 0.000914), recently implicated in cardiac function and cardiac stress responsiveness in HFpEF (59, 60) (Figure 2B and Supplementary Table 1).
Impaired mitochondrial function and oxidative metabolism of energy substrates in HFpEF
There was an extensive reduction in the abundance of proteins involved in cardiac metabolism in the LV of HFpEF mice, including the oxidation of free fatty acid (FFA), pyruvate, and ketone bodies. Significant changes are summarized in Figure 3. These include:
FIGURE 3
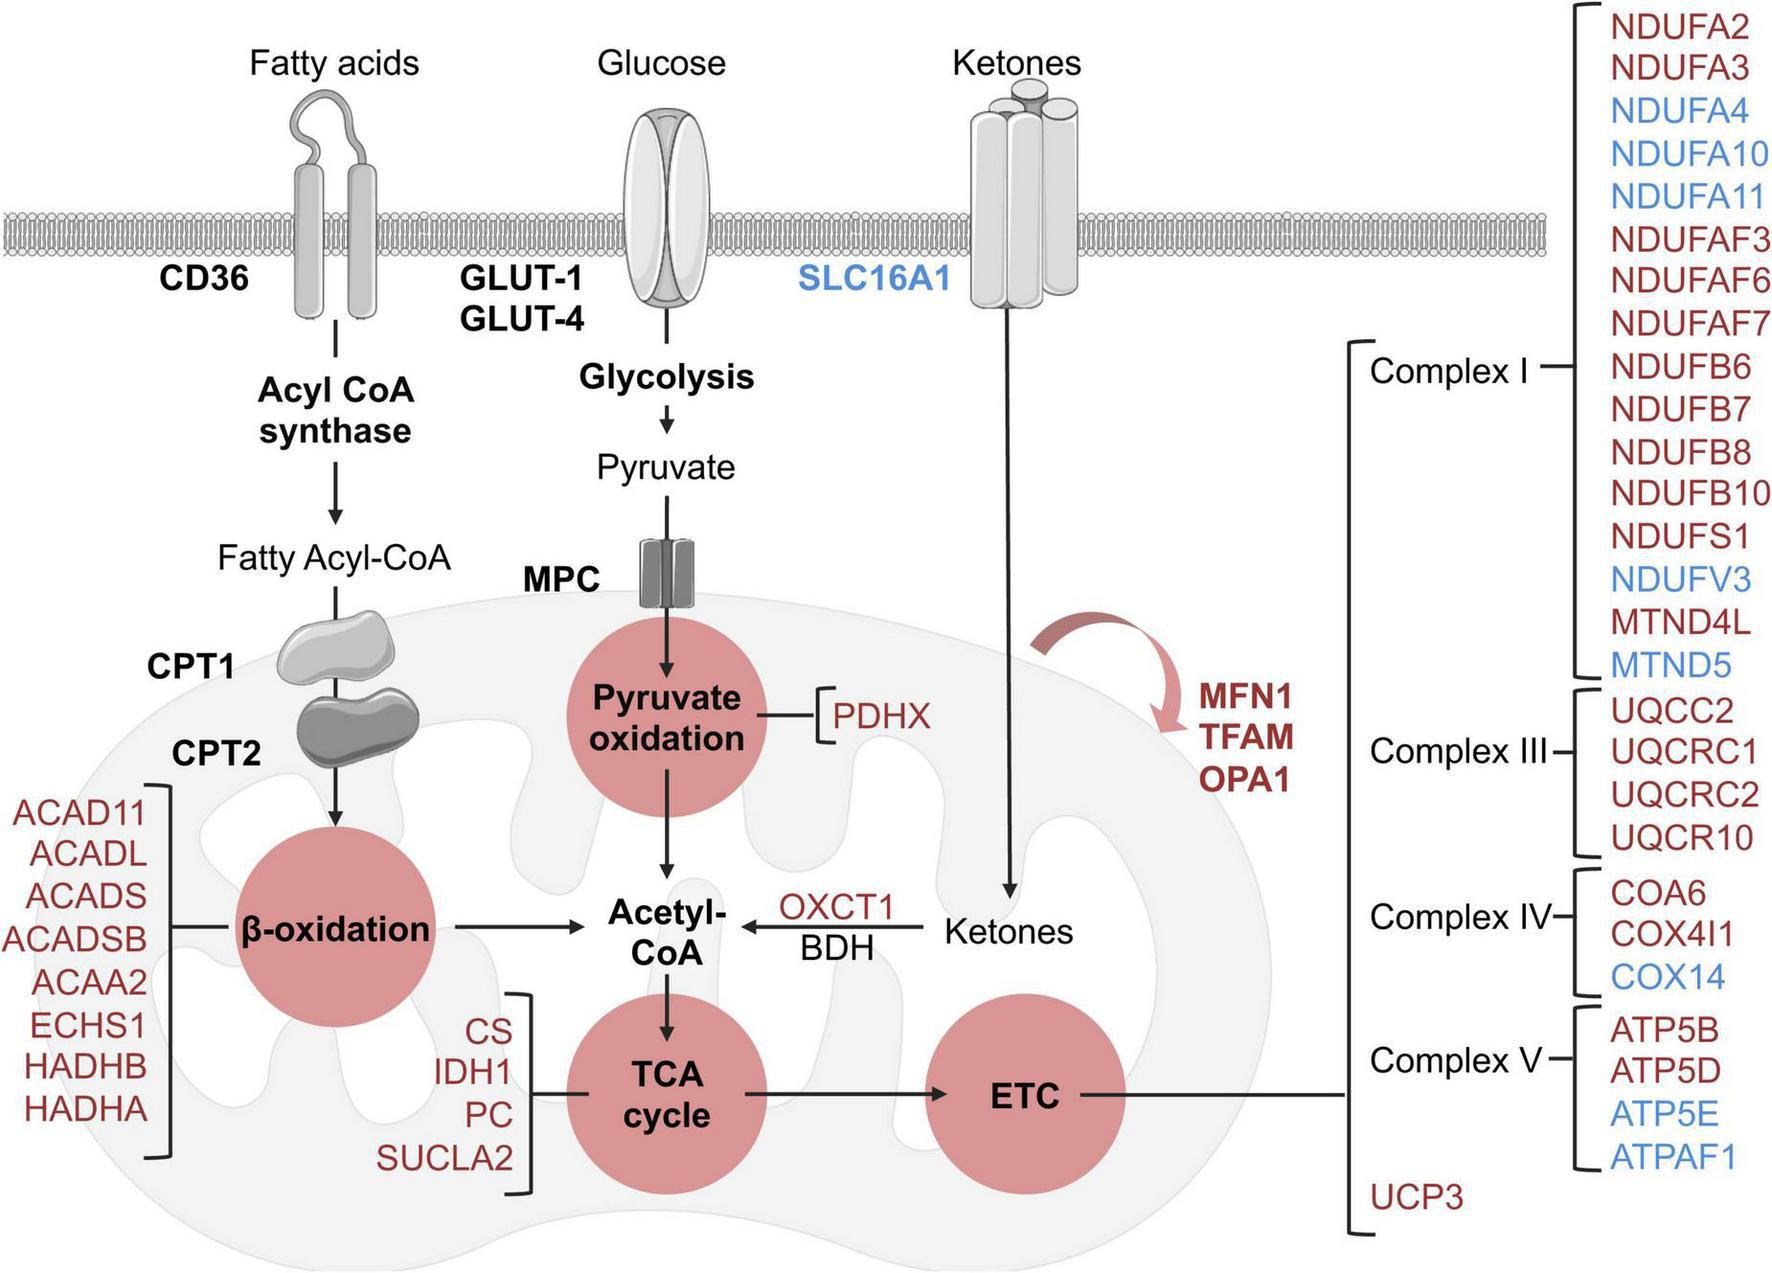
Schematic overview of identified metabolic and mitochondrial related targets in HFpEF mice in the proteome dataset. Blue and red represent significant (P < 0.05) up-regulation and down-regulation in HFpEF vs. Sham, respectively. Black targets are unchanged.
(I) β-oxidation related enzymes, implicated in FFA metabolism to acetyl-CoA, such as acyl-CoA dehydrogenase (ACAD) family member 11 (ACAD11; P = 0.00002), long-chain specific ACAD (ACADL; P = 0.00449), short-chain specific ACAD (ACADS; P = 0.00896), short-branched chain specific ACAD (ACADSB; P = 0.011317), 3-ketoacyl-CoA thiolase (ACAA2, P = 0.00609), enoyl-CoA hydratase (ECHS1, P = 0.02647), hydroxyacyl-CoA dehydrogenase trifunctional multienzyme complex (HADH) beta (β)-subunit (HADHB, P = 0.00729) and HADH alpha (α)-subunit (HADHA, P = 0.03235).
(II) the pyruvate oxidation enzyme pyruvate dehydrogenase X component (PDHX, P = 0.00961), which is part of the pyruvate dehydrogenase complex that catalyzes pyruvate to acetyl-CoA; and
(III) the ketone metabolism enzyme succinyl-CoA:3-keto- acid coenzyme A transferase 1 (OXCT1, P = 0.01237), which catalyzes ketone bodies and produces acetyl-CoA for the tricarboxylic acid (TCA) cycle.
These cumulative results suggest that the energy substrates for mitochondrial oxidative metabolism may be inefficient in HFpEF. Interestingly, although there were no significant alterations in the protein signature of fatty acid and glucose transporters (CD36 and GLUT1 and 4, respectively) in HFpEF, there was an upregulation of the ketone bodies transporter monocarboxylate transporter 1 (SLC16A1, P = 0.00376) in the LV of HFpEF.
Additional analysis revealed that the mitochondrial proteins involved in the TCA cycle were also significantly decreased in the LV of HFpEF mice. These mitochondrial enzymes, namely citrate synthase (CS, P = 0.008068), succinyl-CoA ligase beta subunit (SUCLA2, P = 0.02523), isocitrate dehydrogenase (IDH1, P = 0.00105) and pyruvate carboxylase (PC, P = 0.00206), are required to catalyze acetyl-CoA and produce essential intermediates for the biosynthesis process, and most importantly, high energy molecules such as nicotinamide adenine dinucleotide (NADH) and flavin adenine dinucleotide (FADH2) for the electron transport chain (ETC). Subsequent analysis then showed that 27 proteins involved in the ETC (namely the respiratory complex I, III, IV, and V) were also differentially expressed between HFpEF and Sham. Of these 27 proteins, 19 proteins were significantly reduced in the HFpEF, suggesting impaired ETC, which was consistent with an additional reduction of the uncoupling protein 3 (UCP3, P = 0.02765).
Lastly, additional proteins involved in mitochondrial biogenesis (transcription factor A, TFAM, P = 0.00584) and fusion (mitofusin-1, MFN1, P = 0.001056 and dynamin-like 120 kDa protein, OPA1, P = 0.04644) were similarly decreased in the LV tissue from HFpEF mice.
These findings (Figure 3) suggest that mitochondrial dysfunction may lead to inefficient metabolism of energy substrates, possibly contributing to an energy deficit and thus affecting cardiac function in HFpEF.
Pathway enrichment analysis
Pathway enrichment analyses of the proteomics and phosphoproteomics combined datasets were performed by means of GSEA, which detects biology-driven gene sets of canonical pathways from databases of molecular signatures (61). These analyses revealed that the most relevant and over-represented (enriched) biological annotations in the LV from HFpEF to be: (I) processes involving immune system modulation, (II) cardiac muscle cell development and differentiation, and (III) muscle contraction (Table 2). These processes included positive regulation of cytokine production (GO:0001819; P = 0.0000), striated muscle contraction (Wikipathway; P = 0.0000), positive regulation of adaptive immune response (GO:0002821; P = 0.00578), cardiac muscle cell development (GO:0055013; P = 0.03158) and cardiac muscle cell differentiation (GO: 0055007; P = 0.03571). In contrast, the downregulated pathways were related to a multitude of GO terms associated with cellular metabolism (Table 3). This is consistent with the earlier data from Figure 3, where pathways and processes involving acetyl-CoA metabolic process (GO:0006084, P = 0.00000), fatty acid metabolic process (GO:0006631, P = 0.00000), acyl-CoA biosynthesis process (GO:0071616, P = 0.0000), fatty acid oxidation (GO:0019395, P = 0.00111), coenzyme metabolic process (GO:0006732, P = 0.01015) were significantly reduced in HFpEF.
TABLE 2
| Name | Group | P-value | Size | ES |
| Positive regulation of cytokine production | GO:0001819 | 0.00000 | 57 | −0.34 |
| Pallium development | GO:0021543 | 0.00000 | 32 | −0.38 |
| Platelet degranulation | Reactome pathway | 0.00000 | 56 | −0.33 |
| Response to elevated platelet cytosolic ca2 + | Reactome pathway | 0.00000 | 58 | −0.33 |
| Signaling by ROBO receptors | Reactome pathway | 0.00000 | 98 | −0.26 |
| Striated muscle contraction | Wikipathway | 0.00000 | 30 | −0.42 |
| Positive regulation of adaptive immune response | GO:0002821 | 0.00578 | 18 | −0.47 |
| Regulation of adaptive immune response based on somatic recombination of immune receptors built from immunoglobulin superfamily domains | GO:0002822 | 0.00585 | 18 | −0.47 |
| Positive regulation of wound healing | GO:0090303 | 0.00595 | 16 | −0.51 |
| Intrinsic pathway for apoptosis | Reactome pathway | 0.00633 | 15 | −0.54 |
| Positive regulation of response to wounding | GO:1903036 | 0.00671 | 20 | −0.44 |
| Integrin pathway | Biocarta pathway | 0.00690 | 23 | −0.39 |
| Nucleus organization | GO:0006997 | 0.00893 | 31 | −0.36 |
| Foxo pathway | PID pathway | 0.01500 | 16 | −0.48 |
| G2 m checkpoints | Reactome pathway | 0.01754 | 52 | −0.28 |
| Coagulation | Hallmark Pathway | 0.01818 | 54 | −0.29 |
| Complement and coagulation cascades | Wikipathway | 0.01829 | 21 | −0.45 |
| Cerebral cortex development | GO:0021987 | 0.02143 | 27 | −0.39 |
| Rho GTPases activate PKNs | Reactome pathway | 0.02158 | 25 | −0.40 |
| Positive regulation of adaptive immune response based on somatic recombination of immune receptors built from immunoglobulin superfamily domains | GO:0002824 | 0.02222 | 17 | −0.47 |
| Regulation of adaptive immune response | GO:0002819 | 0.02367 | 19 | −0.46 |
| Spermatid development | GO:0007286 | 0.02717 | 16 | −0.44 |
| Spermatid differentiation | GO:0048515 | 0.02924 | 16 | −0.44 |
| Fc epsilon receptor signaling | Reactome pathway | 0.02985 | 50 | −0.27 |
| Cardiac muscle cell development | GO:0055013 | 0.03158 | 38 | −0.31 |
| Regulation of production of molecular mediator of immune response | GO:0002700 | 0.03550 | 17 | −0.42 |
| Cardiac muscle cell differentiation | GO:0055007 | 0.03571 | 41 | −0.30 |
| Activation of MAPK activity | GO:0000187 | 0.03593 | 21 | −0.38 |
| Cardiac cell development | GO:0055006 | 0.03659 | 38 | −0.31 |
| Regulation of blood coagulation | GO:0030193 | 0.04380 | 25 | −0.35 |
| Regulation of expression of SLITS and ROBOS | Reactome pathway | 0.04762 | 82 | −0.25 |
Biological annotations terms enriched in significantly up-regulated proteins of the proteome dataset.
ES, enrichment score. Results are sorted by the nominal P-value in an ascending order.
TABLE 3
| Name | Group | P-value | Size | ES |
| Regulation of tp53 activity | Reactome pathway | 0.00000 | 23 | 0.60 |
| Purine nucleoside bisphosphate metabolic process | GO:0034032 | 0.00000 | 43 | 0.51 |
| Acetyl-coA metabolic process | GO:0006084 | 0.00000 | 16 | 0.64 |
| Negative regulation of lipid metabolic process | GO:0045833 | 0.00000 | 17 | 0.63 |
| Ribonucleoside bisphosphate metabolic process | GO:0033875 | 0.00000 | 43 | 0.51 |
| Monocarboxylic acid catabolic process | GO:0072329 | 0.00000 | 46 | 0.53 |
| Nucleoside bisphosphate metabolic process | GO:0033865 | 0.00000 | 43 | 0.51 |
| Fatty acid metabolic process | GO:0006631 | 0.00000 | 91 | 0.48 |
| Carboxylic acid catabolic process | GO:0046395 | 0.00000 | 78 | 0.46 |
| Monocarboxylic acid metabolic process | GO:0032787 | 0.00000 | 138 | 0.45 |
| Organic acid catabolic process | GO:0016054 | 0.00000 | 78 | 0.46 |
| Acyl-CoA biosynthetic process | GO:0071616 | 0.00000 | 15 | 0.67 |
| Thioester biosynthetic process | GO:0035384 | 0.00000 | 15 | 0.67 |
| Sulfur compound metabolic process | GO:0006790 | 0.00000 | 99 | 0.44 |
| Carboxylic acid metabolic process | GO:0019752 | 0.00000 | 259 | 0.41 |
| Oxoacid metabolic process | GO:0043436 | 0.00000 | 264 | 0.41 |
| Organic acid metabolic process | GO:0006082 | 0.00000 | 268 | 0.41 |
| Cellular monovalent inorganic cation homeostasis | GO:0030004 | 0.00000 | 17 | 0.66 |
| Response to nitrogen compound | GO:1901698 | 0.00000 | 196 | 0.39 |
| Small molecule metabolic process | GO:0044281 | 0.00100 | 463 | 0.34 |
| Thioester metabolic process | GO:0035383 | 0.00109 | 39 | 0.53 |
| Fatty acid oxidation | GO:0019395 | 0.00111 | 38 | 0.52 |
| Positive regulation of ion transmembrane transporter activity | GO:0032414 | 0.00111 | 34 | 0.51 |
| Cilium assembly | GO:0060271 | 0.00115 | 22 | 0.59 |
| Protein trimerization | GO:0070206 | 0.00121 | 17 | 0.66 |
| Sulfur compound biosynthetic process | GO:0044272 | 0.00229 | 26 | 0.58 |
| Protein dephosphorylation | GO:0006470 | 0.00231 | 25 | 0.59 |
| Protein localization | Reactome pathway | 0.00310 | 84 | 0.42 |
| Acyl-CoA metabolic process | GO:0006637 | 0.00327 | 39 | 0.53 |
| Fatty acid catabolic process | GO:0009062 | 0.00328 | 39 | 0.51 |
| Activation of GTPase activity | GO:0090630 | 0.00362 | 16 | 0.61 |
| Response to oxygen-containing compound | GO:1901700 | 0.00400 | 256 | 0.35 |
| Fatty acid beta-oxidation | GO:0006635 | 0.00439 | 31 | 0.54 |
| Lipid oxidation | GO:0034440 | 0.00443 | 38 | 0.52 |
| Monovalent inorganic cation homeostasis | GO:0055067 | 0.00473 | 20 | 0.62 |
| Laminin interactions | Reactome pathway | 0.00486 | 15 | 0.63 |
| Small molecule catabolic process | GO:0044282 | 0.00509 | 110 | 0.40 |
| Lipid modification | GO:0030258 | 0.00536 | 45 | 0.50 |
| Dephosphorylation | GO:0016311 | 0.00553 | 34 | 0.52 |
| Ion channel transport | Reactome pathway | 0.00553 | 34 | 0.51 |
| Metabolism of water-soluble vitamins and cofactors | Reactome pathway | 0.00559 | 32 | 0.54 |
| Response to organonitrogen compound | GO:0010243 | 0.00604 | 178 | 0.38 |
| Cellular amino acid metabolic process | GO:0006520 | 0.00609 | 98 | 0.41 |
| Positive regulation of transporter activity | GO:0032411 | 0.00661 | 37 | 0.51 |
| Cilium organization | GO:0044782 | 0.00685 | 23 | 0.58 |
| Nucleoside bisphosphate biosynthetic process | GO:0033866 | 0.00823 | 19 | 0.56 |
| Neurotransmitter transport | GO:0006836 | 0.00894 | 27 | 0.54 |
| Positive regulation of ion transmembrane transport | GO:0034767 | 0.00966 | 49 | 0.46 |
| Cell projection assembly | GO:0030031 | 0.00968 | 49 | 0.46 |
| Long-chain fatty acid metabolic process | GO:0001676 | 0.00980 | 17 | 0.60 |
| Response to drug | GO:0042493 | 0.01006 | 137 | 0.38 |
| Cell projection organization | GO:0030030 | 0.01006 | 155 | 0.37 |
| Coenzyme metabolic process | GO:0006732 | 0.01015 | 126 | 0.38 |
| Fatty acid metabolism | Reactome pathway | 0.01053 | 72 | 0.42 |
| Mitochondrial fatty acid beta-oxidation | Reactome pathway | 0.01114 | 28 | 0.52 |
| Cellular response to hormone stimulus | GO:0032870 | 0.01148 | 75 | 0.43 |
| Pyrimidine-containing compound metabolic process | GO:0072527 | 0.01214 | 17 | 0.59 |
| Cellular response to oxygen levels | GO:0071453 | 0.01350 | 26 | 0.52 |
| Plasma membrane bounded cell projection assembly | GO:0120031 | 0.01609 | 47 | 0.46 |
| Purine nucleoside bisphosphate biosynthetic process | GO:0034033 | 0.01667 | 19 | 0.56 |
| Negative regulation of cellular response to TGFbeta stimulus | GO:1903845 | 0.01914 | 15 | 0.58 |
| Ribonucleoside bisphosphate biosynthetic process | GO:0034030 | 0.01932 | 19 | 0.56 |
| Transmission across chemical synapses | Reactome pathway | 0.01967 | 45 | 0.45 |
| Nephron development | GO:0072006 | 0.01975 | 15 | 0.59 |
| Cellular response to endogenous stimulus | GO:0071495 | 0.02018 | 163 | 0.35 |
| Positive regulation of transmembrane transport | GO:0034764 | 0.02030 | 62 | 0.42 |
| Plasma membrane bounded cell projection organization | GO:0120036 | 0.02113 | 149 | 0.36 |
| Cellular response to organic substance | GO:0071310 | 0.02200 | 323 | 0.33 |
| Response to organic substance | GO:0010033 | 0.02200 | 448 | 0.32 |
| Branched-chain amino acid catabolism | Reactome pathway | 0.02241 | 21 | 0.54 |
| Regulation of coenzyme metabolic process | GO:0051196 | 0.02281 | 18 | 0.56 |
| Neuronal system | Reactome pathway | 0.02318 | 59 | 0.42 |
| Cellular response to inorganic substance | GO:0071241 | 0.02341 | 34 | 0.48 |
| Negative regulation of transmembrane receptor protein serine/threonine kinase signaling pathway | GO:0090101 | 0.02392 | 19 | 0.55 |
| FCgamma receptor dependent phagocytosis | Reactome pathway | 0.02540 | 25 | 0.51 |
| Fatty acid biosynthetic process | GO:0006633 | 0.02549 | 23 | 0.52 |
| Cellular response to nitrogen compound | GO:1901699 | 0.02554 | 108 | 0.38 |
| Negative regulation of TGFbeta receptor signaling pathway | GO:0030512 | 0.02599 | 15 | 0.58 |
| Positive regulation of cation transmembrane transport | GO:1904064 | 0.02612 | 46 | 0.45 |
| Negative regulation of organelle organization | GO:0010639 | 0.02764 | 87 | 0.39 |
| Regulation of muscle organ development | GO:0048634 | 0.02772 | 34 | 0.46 |
| Dicarboxylic acid metabolic process | GO:0043648 | 0.02793 | 42 | 0.46 |
| Positive regulation of striated muscle tissue development | GO:0045844 | 0.02818 | 21 | 0.52 |
| Positive regulation of muscle tissue development | GO:1901863 | 0.02904 | 21 | 0.52 |
| Cellular amino acid biosynthetic process | GO:0008652 | 0.03012 | 17 | 0.56 |
| Positive regulation of muscle organ development | GO:0048636 | 0.03030 | 21 | 0.52 |
| Signal release | GO:0023061 | 0.03111 | 26 | 0.49 |
| Heterotrimeric G-protein signaling pathway-GI alpha and GS alpha mediated pathway | Panther pathway | 0.03222 | 22 | 0.50 |
| Response to endogenous stimulus | GO:0009719 | 0.03307 | 215 | 0.33 |
| Protein complex oligomerization | GO:0051259 | 0.03313 | 163 | 0.36 |
| Neurotransmitter secretion | GO:0007269 | 0.03410 | 16 | 0.57 |
| Signal release from synapse | GO:0099643 | 0.03431 | 16 | 0.57 |
| Regulation of transporter activity | GO:0032409 | 0.03434 | 71 | 0.40 |
| Regulation of transmembrane transporter activity | GO:0022898 | 0.03441 | 68 | 0.40 |
| Cellular response to lipid | GO:0071396 | 0.03470 | 67 | 0.40 |
| Regulation of TGFbeta receptor signaling pathway | GO:0017015 | 0.03477 | 21 | 0.52 |
| Regulation of transmembrane receptor protein serine/threonine kinase signaling pathway | GO:0090092 | 0.03528 | 35 | 0.46 |
| NABA basement membranes | MSIGDB | 0.03534 | 19 | 0.53 |
| Coenzyme biosynthetic process | GO:0009108 | 0.03560 | 67 | 0.40 |
| Cellular response to chemical stimulus | GO:0070887 | 0.03600 | 417 | 0.31 |
| Response to organic cyclic compound | GO:0014070 | 0.03858 | 123 | 0.36 |
| Transition metal ion transport | GO:0000041 | 0.03943 | 19 | 0.54 |
| Regulation of striated muscle tissue development | GO:0016202 | 0.04013 | 34 | 0.46 |
| Response to ammonium ion | GO:0060359 | 0.04152 | 23 | 0.49 |
| Positive regulation of ion transport | GO:0043270 | 0.04280 | 73 | 0.39 |
| Opioid signaling | Reactome pathway | 0.04282 | 22 | 0.52 |
| Cell-cell adhesion | GO:0098609 | 0.04366 | 66 | 0.40 |
| Positive regulation of sodium ion transport | GO:0010765 | 0.04380 | 16 | 0.55 |
| Regulation of muscle tissue development | GO:1901861 | 0.04402 | 34 | 0.46 |
| Blood vessel morphogenesis | GO:0048514 | 0.04516 | 48 | 0.42 |
| Regulation of NIK/NF-kappaB signaling | GO:1901222 | 0.04535 | 19 | 0.52 |
| Regulation of response to drug | GO:2001023 | 0.04642 | 15 | 0.55 |
| Alpha-amino acid metabolic process | GO:1901605 | 0.04674 | 55 | 0.41 |
| Negative regulation of cell proliferation | GO:0008285 | 0.04689 | 84 | 0.37 |
| Activation of cysteine-type endopeptidase activity involved in apoptotic process | GO:0006919 | 0.04711 | 20 | 0.50 |
| Integrin signaling pathway | MSIGDB | 0.04718 | 26 | 0.48 |
| Cooperation of PDCL (PHLP1) and TRIC CCT in G-protein beta folding | Reactome pathway | 0.04785 | 15 | 0.54 |
| Response to peptide | GO:1901652 | 0.04876 | 84 | 0.37 |
| Glutamine family amino acid metabolic process | GO:0009064 | 0.04901 | 20 | 0.50 |
Biological annotations terms significantly enriched in down-regulated proteins of the proteome dataset.
ES, enrichment score. Results are sorted by the nominal P-value in an ascending order.
Phospho-proteome profile of the left ventricle in HFpEF
We next investigated the phosphoproteomics dataset. Phosphoproteomics analysis profiled 281 mouse reference protein sequences, of which 240 mapped to serine, 37 mapped to threonine and 3 mapped to tyrosine residues, consistent with the expected 90:9:1 cellular distribution ratio (22). The abundance of 72 phosphosites was differentially altered (elevated or reduced) between HFpEF and Sham (P < 0.05; Figures 4A,B).
FIGURE 4
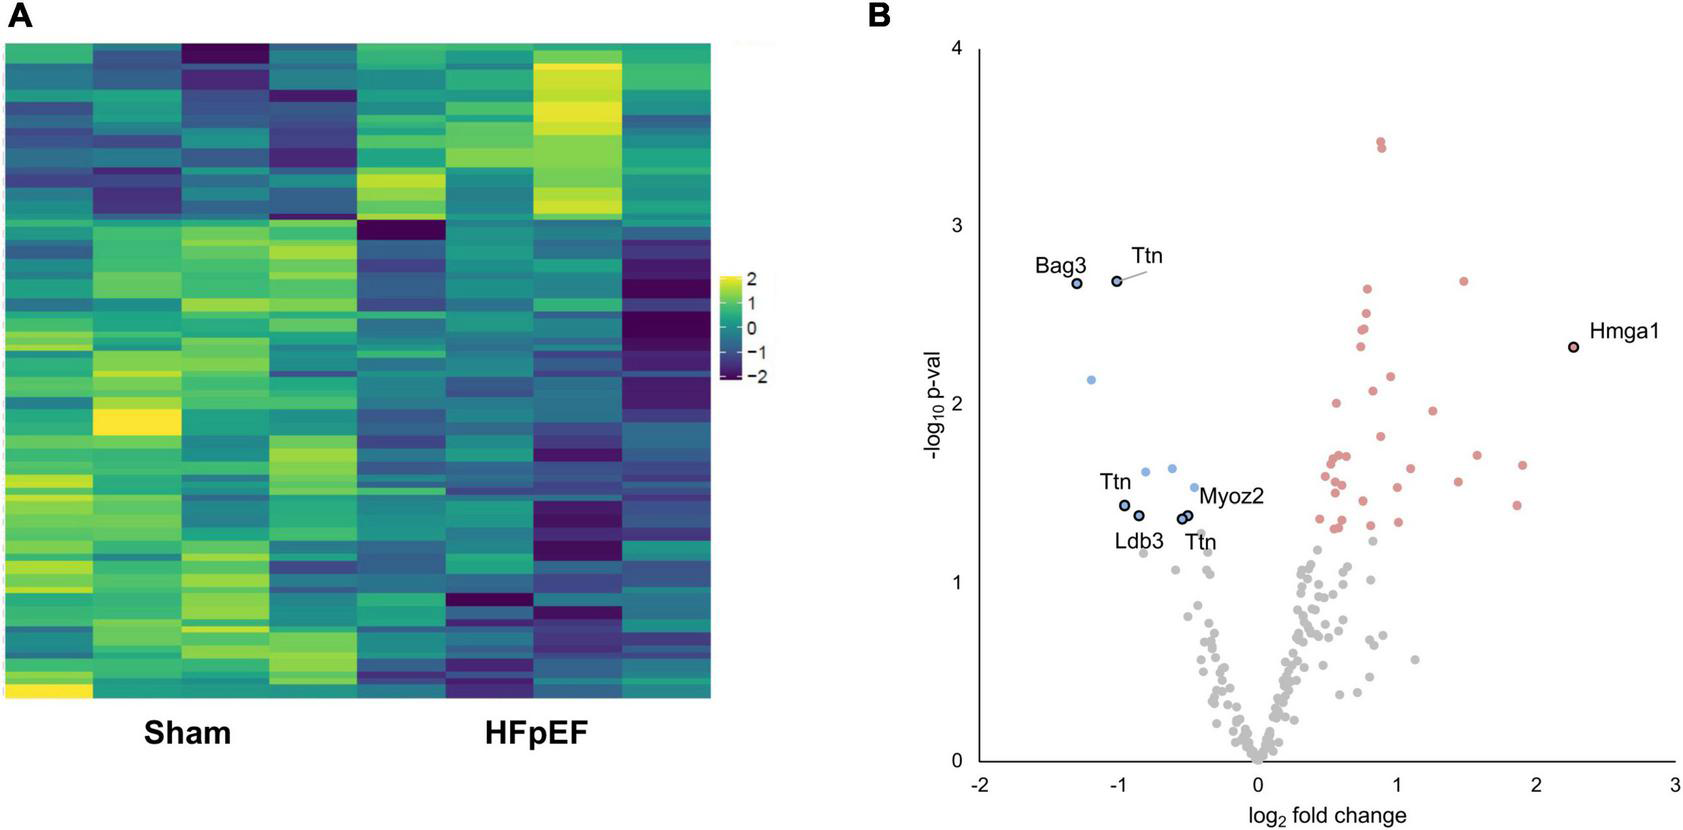
Phosphoproteomics analysis. (A) Heatmap of the differentially expressed phosphosites. (B) Volcano plot presenting log-transformed p-values (t-test) associated with individual significantly altered phosphosites plotted against log-transformed fold change in abundance between the left ventricles in Sham and HFpEF mice. Blue and red dots represent up-regulation and down-regulation in HFpEF (N = 4) vs. Sham (N = 4), respectively.
Aberrant phosphorylation patterns occurred on proteins linked to disparate subcellular compartments, ranging from sarcomeric proteins (LIM domain-binding protein 3, LDB3; myozenin 2, MYOZ2; titin, TTN), to nuclear-localized proteins (BAG family molecular chaperone regulator 3, BAG3; high mobility group protein HMG-I/HMG-Y, HMGA1) with established links to cardiac contractile function, cardiac hypertrophy and/or cardiomyopathy (Figure 4B and Supplementary Table 2).
Left ventricular titin expression and phosphorylation in HFpEF
Despite global proteomics not showing a significant change in total titin in the LV between HFpEF and Sham mice, extensive phosphorylation changes across titin were observed in HFpEF vs. Sham. We identified 22 titin phosphosites (including 76% serines, 19% threonines, and 4% tyrosines) in the phospho-dataset, and among them, seven phosphosites were P < 0.05, all considered class 1 (localization probability 0.75–1.00) (Table 4). Interestingly, five of these were located at the z disk binding region (S262, S264, T266, S1411, and S1415) while the remainder were residues in the C-terminal region (S34464, T34467), suggesting changes in the mechano-sensing activity of titin. These regions are known to act as titin “hotspots,” which respond to mechanical stress and regulate specific actions such as activating the hypertrophic gene program or interacting with the protein quality control machinery (62, 63).
TABLE 4
| Feature | Log FC (Sham/HFpEF) | P value | Position | Site probability (%) | Peptide sequence |
| Ttn_A2ASS6.55 | −1.01327 | 0.00203 | S262 | 0.99876 | QLPHKTPPRIPPKPKSRSPTPPSIAAKAQLA |
| Ttn_A2ASS6.56 | −1.01327 | 0.00203 | S264 | 0.99836 | PHKTPPRIPPKPKSRSPTPPSIAAKAQLARQ |
| Ttn_A2ASS6.60 | −1.01327 | 0.00203 | T266 | 0.99033 | KTPPRIPPKPKSRSPTPPSIAAKAQLARQQS |
| Ttn_A2ASS6.36 | −0.96294 | 0.03670 | S34464 | 0.96352 | VTSPPRVKSPEPRVKSPETVKSPKRVKSPEP |
| Ttn_A2ASS6.40 | −0.96294 | 0.03670 | T34467 | 0.81504 | PPRVKSPEPRVKSPETVKSPKRVKSPEPVTS |
| Ttn_A2ASS6.29 | −0.54438 | 0.04350 | S1411 | 0.79632 | PTPEAVSRIRSVSPRSLSRSPIRMSPAMSPA |
| Ttn_A2ASS6.30 | −0.54438 | 0.04350 | S1415 | 0.96095 | AVSRIRSVSPRSLSRSPIRMSPAMSPARMSP |
| Ttn_A2ASS6.27 | −0.41168 | 0.05240 | S283 | 0.89160 | PSIAAKAQLARQQSPSPIRHSPSPVRHVRAP |
| Ttn_A2ASS6.28 | −0.41168 | 0.05240 | S290 | 0.95098 | QLARQQSPSPIRHSPSPVRHVRAPTPSPVRS |
| Ttn_A2ASS6.23 | 0.42746 | 0.06498 | S34451 | 0.82907 | TLTVQKARVIEKAVTSPPRVKSPEPRVKSPE |
| Ttn_A2ASS6.24 | 0.42746 | 0.06498 | S34457 | 0.98108 | ARVIEKAVTSPPRVKSPEPRVKSPETVKSPK |
| Ttn_A2ASS6.38 | 0.31502 | 0.10499 | T33859 | 0.99883 | LTQDDLEMVRPARRRTPSPDYDLYYYRRRRR |
| Ttn_A2ASS6.31 | −0.31311 | 0.19004 | S34107 | 0.99068 | DAERRSPTPERTRPRSPSPVSSERSLSRFER |
| Ttn_A2ASS6.32 | −0.33175 | 0.22516 | S34109 | 0.76541 | ERRSPTPERTRPRSPSPVSSERSLSRFERSA |
| Ttn_A2ASS6.25 | 1.12758 | 0.27026 | S1406 | 1.00000 | APTYMPTPEAVSRIRSVSPRSLSRSPIRMSP |
| Ttn_A2ASS6.26 | 1.12758 | 0.27026 | S1408 | 1.00000 | TYMPTPEAVSRIRSVSPRSLSRSPIRMSPAM |
| Ttn_A2ASS6.41 | 0.46224 | 0.28856 | Y33864 | 0.93320 | LEMVRPARRRTPSPDYDLYYYRRRRRSLGDM |
| Ttn_A2ASS6.33 | −0.27602 | 0.31791 | S34112 | 0.88295 | SPTPERTRPRSPSPVSSERSLSRFERSARFD |
| Ttn_A2ASS6.22 | 0.19164 | 0.43120 | S307 | 0.93434 | VRHVRAPTPSPVRSVSPAGRISTSPIRSVKS |
| Ttn_A2ASS6.42 | −0.06749 | 0.79212 | S301 | 0.99417 | RHSPSPVRHVRAPTPSPVRSVSPAGRISTSP |
| Ttn_A2ASS6.43 | −0.06749 | 0.79212 | S307 | 0.93434 | VRHVRAPTPSPVRSVSPAGRISTSPIRSVKS |
| Ttn_A2ASS6.58 | −0.06749 | 0.79212 | T299 | 0.99713 | PIRHSPSPVRHVRAPTPSPVRSVSPAGRIST |
Significantly changed titin phosphosites.
Results are sorted by the nominal P-value in an ascending order. Highlighted values indicate significantly regulated phosphorylation between Sham and HFpEF.
Additionally, high-resolution gel electrophoresis was performed to further examine other potential switches in titin isoform expression which may affect titin stiffness, i.e., to quantitatively detect changes in the stiffer N2B or the compliant N2BA isoforms of titin (Figure 5A). As expected, there were no changes in total titin (TT) expression between HFpEF and Sham mice. However, as previously described (64), N2B expression was significantly increased in the LV from HFpEF compared to Sham mice (0.144 ± 0.010 vs. 0.127 ± 0.010; P < 0.05). Neither N2BA expression, N2BA/N2B ratio nor titin degradation were differentially altered between HFpEF and Sham mice (Figure 5B).
FIGURE 5
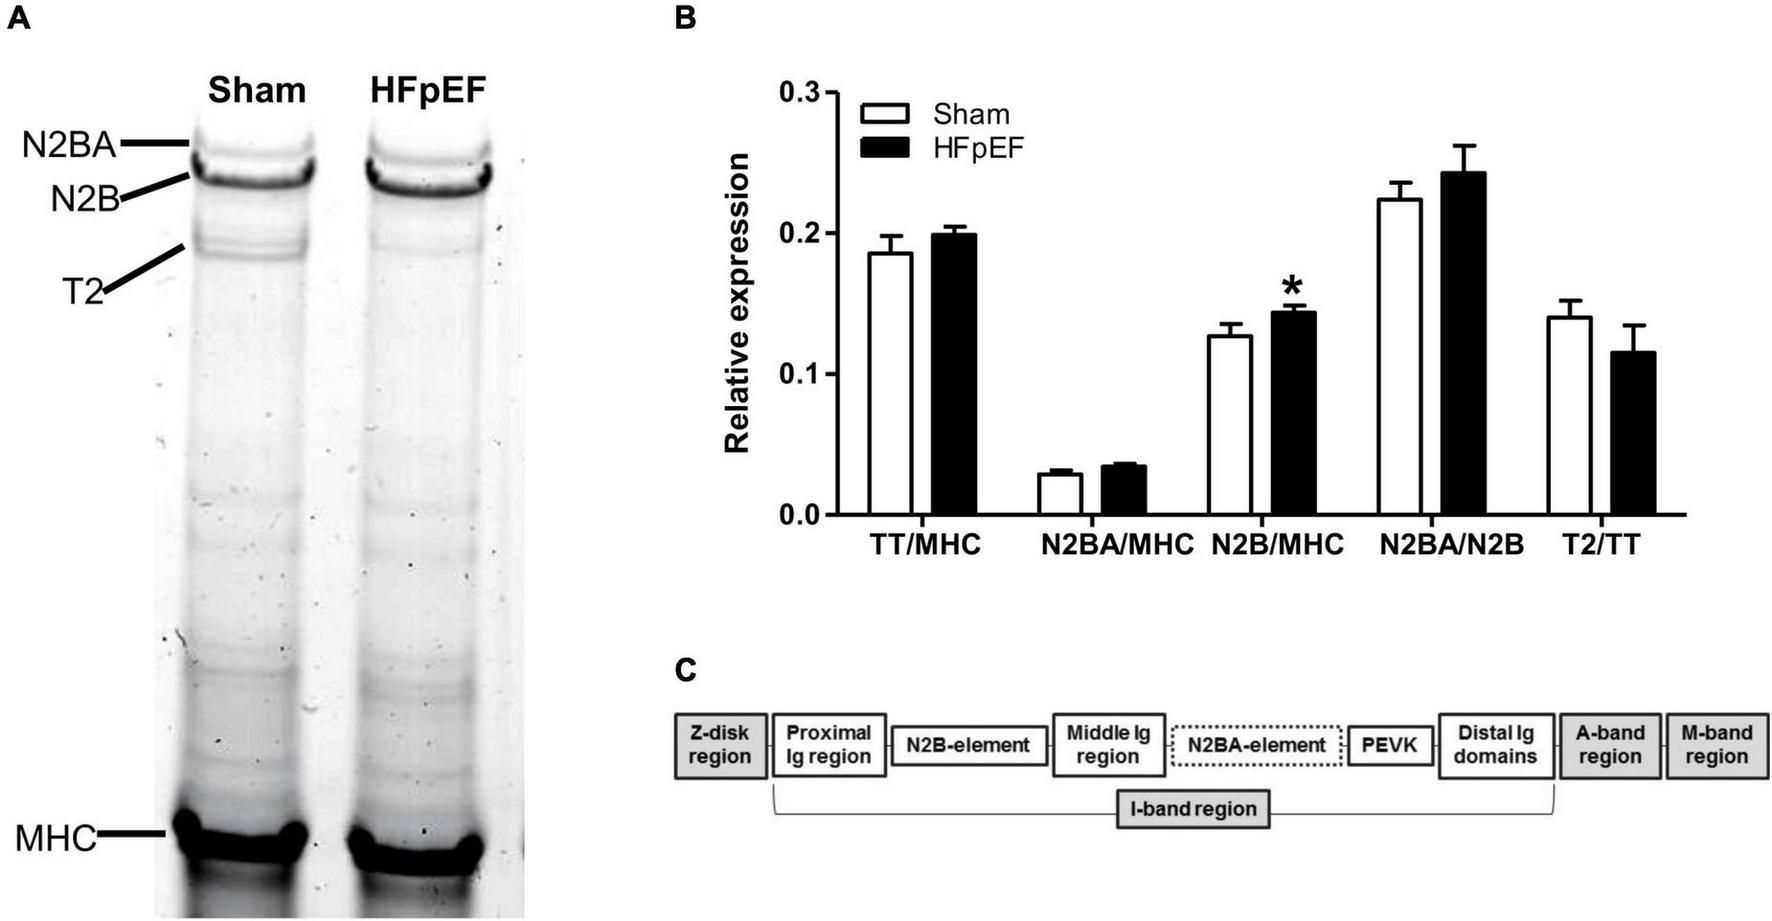
Titin isoform expression. (A) Representative image of 1% agarose gel for titin analysis. (B) Quantitative analysis of total titin (TT) and titin isoforms N2BA and N2B relative to total myosin heavy chain (MHC), the ratio of N2BA to N2B, and titin degradation product (T2) relative to TT, in the left ventricles from Sham (N = 7) and HFpEF mice (N = 11). Data are presented as mean ± SEM. Unpaired T-test was performed, *P < 0.05 vs. Sham mice. (C) Overview of the titin molecule structure.
Left ventricular expression of SIRT3 in HFpEF mice
Accumulating evidence suggests that SIRT3 plays a critical role in the development of HF (65), particularly in HFpEF (60, 66, 67). As the global proteomics dataset showed a decreased in SIRT3 in the LV from HFpEF mice vs. Sham (P = 0.000914), we thus performed additional immunoblot analysis to validate these findings. Indeed, SIRT3 expression was significantly decreased in the LV from HFpEF mice vs. Sham (0.8 ± 0.0 vs. 1.0 ± 0.0; P < 0.001; Figure 6A).
FIGURE 6
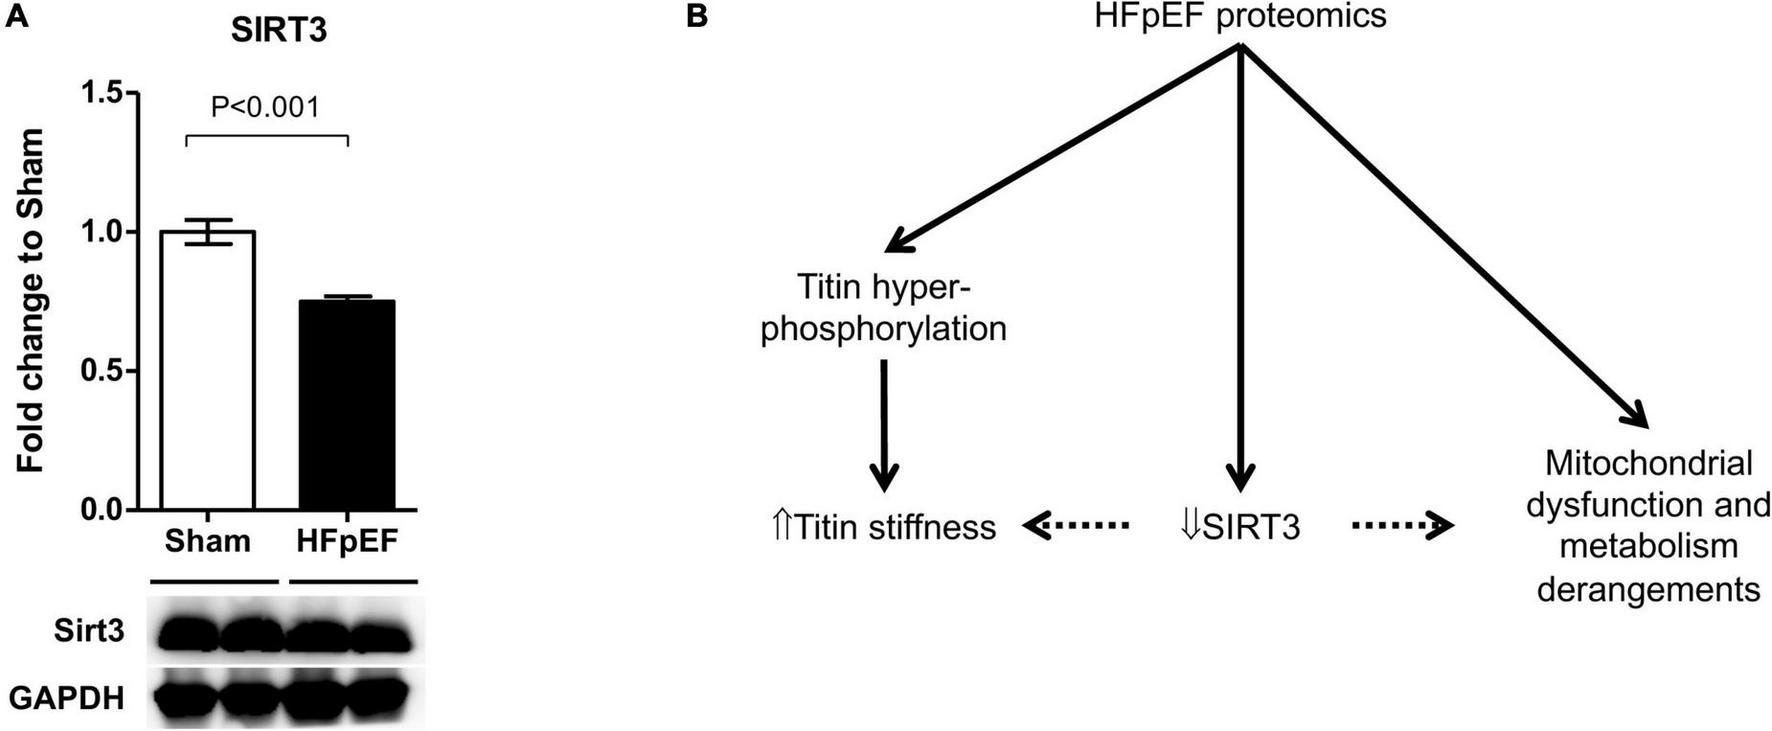
SIRT3 regulation in HFpEF. (A) SIRT3 protein expression in the left ventricles from HFpEF mice (N = 11) and Sham (N = 7). Data are presented as mean ± SEM. Statistical analysis by two-tailed Student’s t-test. (B) Overview of proposed SIRT3 regulatory system in HFpEF.
Discussion
Heart failure with preserved ejection fraction is a complex disease involving several sub-phenotypes within a heterogeneous HFpEF syndrome (10, 13, 68). Of all the comorbidities in HFpEF, hypertension remains the most common, and is implicated in both the pathogenesis and the prognosis of the disease (12, 29). However, the exact biological mechanisms that underlie hypertension associated HFpEF remain largely unclear. In this study, we investigated the proteomic and phosphoproteomics profile underlying HFpEF in a clinically relevant murine model of hypertension associated HFpEF. The SAUNA model of HFpEF model fulfils the criteria for a “high probability of HFpEF” based on HFA-PEFF diagnostic algorithm for human HFpEF (58, 69).
In the present study, extensive proteomics and phosphoproteomics analysis permitted in-depth screening of the changes in protein expression, post-translational modifications (i.e., phosphorylation), and pathway alterations in HFpEF. These included but were not limited to: (I) changes in cardiac metabolism, where the predominant components were the mitochondrial metabolic processes and mitochondrial dysfunction; (II) alteration in cardiac contractile function-related proteins; (III) overexpression of pathways related to immune modulation; and (IV) a significant decrease in SIRT3 expression, that was validated by immunoblotting.
We found marked changes in signatures of protein expression related to mitochondrial function and oxidative metabolism of energy substrates in HFpEF. There was a significant decrease in targets related to mitochondrial substrate oxidation, suggesting that cardiac mitochondrial metabolic function is impaired in HFpEF. Interestingly, there was an upregulation of the ketone bodies transporter SLC16A1 in the LV of HFpEF, but this was not accompanied by comparable changes in ketone metabolism enzymes. Although not investigated in this study, these findings may contribute to the metabolic impairment seen in HFpEF by increasing the transport of ketone bodies into the mitochondria, but without a compensatory catabolic response. We hypothesize that this mismatch in mitochondrial substrate intake and utilization results in mitochondrial ketone bodies accumulation which may detrimentally affect cardiac function (70). Ketone bodies are thought to be a relevant energy source in both preclinical HFrEF models (71) and advance HFrEF patients (72). Additionally, it has been shown that HFpEF patients have significantly higher circulating ketone levels than HFrEF patients (73) suggesting that some of the beneficial effects of SGLT2 inhibitors in HFpEF may be due to enhanced ketone bodies availability and cardiac utilization (74–76), a process known as “thrifty substrate/fuel hypothesis” (77). We also observed decreased OXCT1 (aka SCOT, succinyl-CoA:3-ketoacid CoA transferase) expression in HFpEF hearts (Figure 3). OXCT1 allows cells to utilize energy stored in ketone bodies thus its decrease in HFpEF hearts supports a role for ketone body cardiac metabolism. Similarly, others have shown worse HF in pre-clinical models with cardio-specific deletion of OXCT1 (78).
Proteomic evaluation of PTMs is essential to understand the function of many proteins in physiological and pathophysiological settings. PTMs are regulators of protein structure and function and, in the heart the predominant PTM is phosphorylation, followed by acetylation (79), and it is also recognized that many proteins are regulated by phosphorylation independently of their expression (80).
Titin is a major cardiac protein regulated by phosphorylation and facilitates myocardial passive tension by conditioning cardiomyocyte-derived stiffness (81). Titin regulates cardiomyocyte stiffness both at the transcriptional and post-transcriptional level. At the transcriptional level, titin shifts from its compliant isoform N2BA toward its stiff isoform N2B, which contributes to the impaired diastolic function that is seen in HFpEF (33, 64, 82). In the present study, translational and PTMs in titin are apparent in the LV of HFpEF hearts. The stiffer N2B isoform was significantly increased in HFpEF mice. However, it is notably that the N2B isoform is also the predominant isoform expressed in the LV of rodents (83). At the post-transcriptional level, despite comparable global proteomics expression between HFpEF mice and Sham, phosphoproteomics analysis showed that titin was one of the proteins with the greatest alterations in phosphorylation in HFpEF mice. Similar to a Dahl salt-sensitive rat study (84), in these SAUNA HFpEF mice most of the significantly hyper-phosphorylated titin residues were located at the Z-disk binding region of the titin protein (Figure 5C). Interestingly, it has been suggested that titin may be part of a Z-disk macromolecular machinery acting as a node for hypertrophic signaling (85). As such, our findings that the myofilament and myofilament-associated proteins viz. ACTA1, MYH7, MHY9, TPM1, and MYOZ2 were differentially expressed in both global and phosphoproteomics dataset, support the premise that alterations in sarcomeric and myofilament regulating proteins play a central role in HFpEF. Of these proteins, MYH7, TPM1 and MYOZ2 are known to be important in hypertrophic cardiomyopathy (86–88), and may play a similar role in HFpEF. However, although their function in muscle contraction is well known (89, 90), their role in cardiac hypertrophy and adverse cardiac remodeling remains elusive. It has been hypothesized that changes in cardiac architecture may be a compensatory response that eventually fails, resulting in a re-induction of fetal genes, fibrosis replacing necrotic and apoptotic cardiac cells, and a shift in metabolic substrates (91). However, additional studies are warranted to identify the precise role these myofilament-associated proteins play in HFpEF.
Because of its size, titin has more phosphorylation sites than other smaller proteins and hundreds of phosphorylation sites have been predicted based on proteomic analysis (83), Z-disk Similarly, multiple kinases are also involved in titin phosphorylation (92), representing more opportunities for the regulation of the cardiomyocyte structure and function. However, the effect that a specific phosphorylation pattern has on the function of titin is largely dependent on the specific structural domain which is modified within the protein (93). For example several studies have focused on the “spring-like” I-domain, including the N2bus and PEVK regions, likely due to the mechanically active nature of this specific domain, where phosphorylation may modulate passive and active tension of the sarcomere (85, 92–94). Conversely, the proline-directed kinases, including extracellular signal-regulated kinase-1/-2 (ERK1/2) and cyclin-dependent protein kinase-2 (Cdc2) were able to regulate the phosphorylation status of non-extensible Z-disk (95, 96) and C-terminal (M-band) (97) regions (98). Although additional studies using site-specific methods are needed (92), it has been suggested that changes in the phosphorylation status of these regions may have an important function, not only during developmental stages, but also regulating the binding of titin to other and M-band proteins, as well as the assembly and turnover of these binding partners (99, 100).
In addition to phosphorylation, HFpEF is also associated with hyperacetylation of mitochondrial proteins in the myocardium (101, 102). In the mitochondria, the acetylation state of key enzymes involved in mitochondrial metabolism, oxidative stress defense and mitochondrial dynamics is regulated by the mitochondrial, NAD-dependent protein deacetylase SIRT3 (103–106). SIRT3 interacts with at least 84 mitochondrial proteins involved in many aspects of mitochondrial biology, such as maintaining mitochondrial integrity and function (67, 106). In the present study, the global proteomics data set showed decreased expression of SIRT3 in the LV of HFpEF mice, which was also confirmed by immunoblotting. Others have shown that reduced SIRT3 expression is related to reduced NAD+ bioavailability in HFpEF, and that cardiomyocyte specific SIRT3 knockout mice developed worse diastolic dysfunction in HFpEF (60). Additional studies using whole-body knockout or transgenic mice similarly showed that SIRT3 is required to maintain cardiac contractile function under pro-hypertrophic or ischemic stress (107–110). A recent study showed that a deficit of cardiac NAD+ exists not only pre-clinical HFpEF models but also in patients with HFpEF, and that increasing NAD+ levels with nicotinamide improved diastolic dysfunction (111). The authors hypothesized the beneficial effects were mediated, partly by increasing deacetylation of proteins that regulate the mechano-elastic properties of cardiac myocytes such as titin and sarco/endoplasmic reticulum Ca2+ ATPase 2a (SERCA2a). Although not investigated in the present study, SIRT3 may also play a role in cardiomyocyte stiffness and impaired diastolic function in HFpEF, possibly by titin acetylation (59). SIRT 3 may be a future target since, compared to younger subjects, exercise increases SIRT3 protein expression in muscle, which is decreased in older sedentary individuals (112). Interestingly, of the 7 mammalian sirtuins described, SIRT3 is the only analog whose increased expression associates with longevity in humans (113–115). Since HFpEF is highly associated with aging, and exercise training is effective in improving the quality of life in HFpEF patients (116), future studies are warranted to explore the role of SIRT3 expression in muscle in patients with HFpEF.
In conclusion, untargeted proteomics have demonstrated a key role of protein PTMs in metabolism, cell preservation and sarcomere function in the heart (117). In the present study marked proteomics and phosphoproteomics changes occurred in the heart in HFpEF mice which were related to altered mitochondrial metabolism and sarcomere contractility. It is possible that SIRT3 plays a pivotal role in HFpEF, by regulating mitochondrial metabolism and titin stiffness but this requires further study (Figure 6B).
Statements
Data availability statement
The datasets presented in this study can be found online at the PRIDE Archive, proteomics data repository (European Bioinformatics Institute, European Molecular Biology Laboratory) with the data set identifier PXD033501. Raw unedited gels images are shown in Supplementary Figure 3.
Ethics statement
The animal study was reviewed and approved by the Institutional Animal Care and Use Committee at Boston University School of Medicine.
Author contributions
MV-M and FS contributed to the conception and design of the study. MV-M and ES performed the surgeries and physiological measurements. MV-M, ES, and ZH performed the molecular analysis. RH and BB performed the proteomic sample preparation and carried out the mass spectrometry and bioinformatics analysis. MV-M, ES, and FS wrote the first draft of the manuscript. RH wrote sections of the manuscript. All authors contributed to the manuscript revision, read, and approved the submitted version.
Funding
This work was supported by the National Institute of Health RO1HL145985 to FS and R35HL144998 to HG.
Conflict of interest
FS was a full-time employee of Eli Lilly and Co, Indianapolis, IN and holds a joint, academic appointment at Boston University School of Medicine. All the work in this publication is from The Sam Lab, Whitaker Cardiovascular Institute at Boston University School of Medicine, Boston, MA. This work was funded by NIH RO1HL145985 awarded to FS. None of the work was funded nor supported by Eli Lilly and Co. FS has no other conflicts to disclose regarding the work in this manuscript. The remaining authors declare that the research was conducted in the absence of any commercial or financial relationships that could be construed as a potential conflict of interest.
Publisher’s note
All claims expressed in this article are solely those of the authors and do not necessarily represent those of their affiliated organizations, or those of the publisher, the editors and the reviewers. Any product that may be evaluated in this article, or claim that may be made by its manufacturer, is not guaranteed or endorsed by the publisher.
Supplementary material
The Supplementary Material for this article can be found online at: https://www.frontiersin.org/articles/10.3389/fcvm.2022.966968/full#supplementary-material
Abbreviations
- ACTA1
skeletal alpha-actin
- EF
ejection fraction
- GLUT1
glucose transporter 1
- GLUT4
glucose transporter 4
- HF
heart failure
- HFpEF
heart failure with preserved ejection fraction
- HFrEF
heart failure with reduced ejection fraction
- IVST
interventricular septum wall thickness
- LV
left ventricle
- LVEF
left ventricle ejection fraction
- LVEDD
left ventricle end diastolic diameter
- LVESD
left ventricle end systolic diameter
- MFN1
mitofusin 1
- MS/MS
tandem mass spectrometry
- MYH7
beta-myosin heavy chain
- MYH9
myosin heavy chain 9
- OXCT1
succinyl-CoA:3-ketoacid coenzyme A transferase 1
- PM1
tropomyosin alpha-1 chain
- PTM
post-translational modification
- RWT
relative wall thickness
- SLC16A1
monocarboxylate transporter 1
- SIRT3
sirtuin-3
- TFAM
transcription factor A mitochondrial
- TWT
total wall thickness.
Footnotes
References
1.
Metra M Teerlink JR . Heart failure.Lancet. (2017) 390:1981–95. 10.1016/S0140-6736(17)31071-1
2.
Udelson JE Lewis GD Shah SJ Zile MR Redfield MM Burnett J Jr et al Effect of praliciguat on peak rate of oxygen consumption in patients with heart failure with preserved ejection fraction: the CAPACITY HFpEF randomized clinical trial. JAMA. (2020) 324:1522–31. 10.1001/jama.2020.16641
3.
Armstrong PW Lam CSP Anstrom KJ Ezekowitz J Hernandez AF O’Connor CM et al Effect of vericiguat vs placebo on quality of life in patients with heart failure and preserved ejection fraction: the VITALITY-HFpEF randomized clinical trial. JAMA. (2020) 324:1512–21. 10.1001/jama.2020.15922
4.
Anker SD Butler J Filippatos G Ferreira JP Bocchi E Böhm M et al Empagliflozin in heart failure with a preserved ejection fraction. N Engl J Med. (2021) 385:1451–61.
5.
Steinberg BA Zhao X Heidenreich PA Peterson ED Bhatt DL Cannon CP et al Trends in patients hospitalized with heart failure and preserved left ventricular ejection fraction: prevalence, therapies, and outcomes. Circulation. (2012) 126:65–75. 10.1161/CIRCULATIONAHA.111.080770
6.
Zile MR Gottdiener JS Hetzel SJ McMurray JJ Komajda M McKelvie R et al Prevalence and significance of alterations in cardiac structure and function in patients with heart failure and a preserved ejection fraction. Circulation. (2011) 124:2491–501. 10.1161/CIRCULATIONAHA.110.011031
7.
Paulus WJ Tschöpe C . A novel paradigm for heart failure with preserved ejection fraction: comorbidities drive myocardial dysfunction and remodeling through coronary microvascular endothelial inflammation.J Am Coll Cardiol. (2013) 62:263–71. 10.1016/j.jacc.2013.02.092
8.
Ferrari R Böhm M Cleland JG Paulus WJ Pieske B Rapezzi C et al Heart failure with preserved ejection fraction: uncertainties and dilemmas. Eur J Heart Fail. (2015) 17:665–71. 10.1002/ejhf.304
9.
Borlaug BA . Heart failure with preserved and reduced ejection fraction: different risk profiles for different diseases.Eur Heart J. (2013) 34:1393–5. 10.1093/eurheartj/eht117
10.
Shah SJ Kitzman DW Borlaug BA van Heerebeek L Zile MR Kass DA et al Phenotype-specific treatment of heart failure with preserved ejection fraction: a multiorgan roadmap. Circulation. (2016) 134:73–90. 10.1161/CIRCULATIONAHA.116.021884
11.
van Heerebeek L Paulus WJ . Understanding heart failure with preserved ejection fraction: where are we today?Neth Heart J. (2016) 24:227–36. 10.1007/s12471-016-0810-1
12.
Tromp J Claggett BL Liu J Jackson AM Jhund PS Køber L et al Global differences in heart failure with preserved ejection fraction: the PARAGON-HF trial. Circ Heart Fail. (2021) 14:e007901. 10.1161/CIRCHEARTFAILURE.120.007901
13.
Shah SJ Katz DH Selvaraj S Burke MA Yancy CW Gheorghiade M et al Phenomapping for novel classification of heart failure with preserved ejection fraction. Circulation. (2015) 131:269–79. 10.1161/CIRCULATIONAHA.114.010637
14.
Lundby A Olsen JV . Phosphoproteomics taken to heart.Cell Cycle. (2013) 12:2707–8. 10.4161/cc.25883
15.
Arrell DK Neverova I Van Eyk JE . Cardiovascular proteomics: evolution and potential.Circ Res. (2001) 88:763–73. 10.1161/hh0801.090193
16.
Farmakis D Papingiotis G Parissis J Filippatos G . Ups and downs in heart failure: the case of proteomics.Eur J Heart Fail. (2018) 20:63–6. 10.1002/ejhf.1065
17.
Steiner S Witzmann FA . Proteomics: applications and opportunities in preclinical drug development.Electrophoresis. (2000) 21:2099–104. 10.1002/1522-2683(20000601)21:11<2099::AID-ELPS2099>3.0.CO;2-N
18.
Sharma P Cosme J Gramolini AO . Recent advances in cardiovascular proteomics.J Proteomics. (2013) 81:3–14. 10.1016/j.jprot.2012.10.026
19.
Corbett JM Why HJ Wheeler CH Richardson PJ Archard LC Yacoub MH et al Cardiac protein abnormalities in dilated cardiomyopathy detected by two-dimensional polyacrylamide gel electrophoresis. Electrophoresis. (1998) 19:2031–42. 10.1002/elps.1150191123
20.
Duran MC Mas S Martin-Ventura JL Meilhac O Michel JB Gallego-Delgado J et al Proteomic analysis of human vessels: application to atherosclerotic plaques. Proteomics. (2003) 3:973–8. 10.1002/pmic.200300389
21.
Lai LP Lin JL Lin CS Yeh HM Tsay YG Lee CF et al Functional genomic study on atrial fibrillation using cDNA microarray and two-dimensional protein electrophoresis techniques and identification of the myosin regulatory light chain isoform reprogramming in atrial fibrillation. J Cardiovasc Electrophysiol. (2004) 15:214–23. 10.1046/j.1540-8167.2004.03423.x
22.
Kuzmanov U Guo H Buchsbaum D Cosme J Abbasi C Isserlin R et al Global phosphoproteomic profiling reveals perturbed signaling in a mouse model of dilated cardiomyopathy. Proc Natl Acad Sci U.S.A. (2016) 113:12592–7. 10.1073/pnas.1606444113
23.
Lu D Xia Y Chen Z Chen A Wu Y Jia J et al Cardiac proteome profiling in ischemic and dilated cardiomyopathy mouse models. Front Physiol. (2019) 10:750. 10.3389/fphys.2019.00750
24.
Brioschi M Polvani G Fratto P Parolari A Agostoni P Tremoli E et al Redox proteomics identification of oxidatively modified myocardial proteins in human heart failure: implications for protein function. PLoS One. (2012) 7:e35841. 10.1371/journal.pone.0035841
25.
Li W Rong R Zhao S Zhu X Zhang K Xiong X et al Proteomic analysis of metabolic, cytoskeletal and stress response proteins in human heart failure. J Cell Mol Med. (2012) 16:59–71. 10.1111/j.1582-4934.2011.01336.x
26.
Roselló-Lletí E Alonso J Cortés R Almenar L Martínez-Dolz L Sánchez-Lázaro I et al Cardiac protein changes in ischaemic and dilated cardiomyopathy: a proteomic study of human left ventricular tissue. J Cell Mol Med. (2012) 16:2471–86. 10.1111/j.1582-4934.2012.01565.x
27.
DeAguero JL McKown EN Zhang L Keirsey J Fischer EG Samedi VG et al Altered protein levels in the isolated extracellular matrix of failing human hearts with dilated cardiomyopathy. Cardiovasc Pathol. (2017) 26:12–20. 10.1016/j.carpath.2016.10.001
28.
Adamo L Yu J Rocha-Resende C Javaheri A Head RD Mann DL . Proteomic signatures of heart failure in relation to left ventricular ejection fraction.J Am Coll Cardiol. (2020) 76:1982–94. 10.1016/j.jacc.2020.08.061
29.
Shah SJ Borlaug BA Kitzman DW McCulloch AD Blaxall BC Agarwal R et al Research priorities for heart failure with preserved ejection fraction: national heart, lung, and blood institute working group summary. Circulation. (2020) 141:1001–26. 10.1161/CIRCULATIONAHA.119.041886
30.
Wilson Richard M De Silva Deepa S Sato K Izumiya Y Sam F . Effects of fixed-dose isosorbide dinitrate/hydralazine on diastolic function and exercise capacity in hypertension-induced diastolic heart failure.Hypertension. (2009) 54:583–90. 10.1161/HYPERTENSIONAHA.109.134932
31.
Garcia AG Wilson RM Heo J Murthy NR Baid S Ouchi N et al Interferon-γ ablation exacerbates myocardial hypertrophy in diastolic heart failure. Am J Physiol Heart Circ Physiol. (2012) 303:H587–96. 10.1152/ajpheart.00298.2012
32.
Tanaka K Valero-Muñoz M Wilson RM Essick EE Fowler CT Nakamura K et al Follistatin like 1 regulates hypertrophy in heart failure with preserved ejection fraction. JACC Basic Transl Sci. (2016) 1:207–21. 10.1016/j.jacbts.2016.04.002
33.
Valero-Munoz M Li S Wilson RM Boldbaatar B Iglarz M Sam F . Dual endothelin-A/endothelin-B receptor blockade and cardiac remodeling in heart failure with preserved ejection fraction.Circ Heart Fail. (2016) 9:e003381. 10.1161/CIRCHEARTFAILURE.116.003381
34.
Valero-Muñoz M Backman W Sam F . Murine models of heart failure with preserved ejection fraction: a “fishing expedition”.JACC Basic Transl Sci. (2017) 2:770–89. 10.1016/j.jacbts.2017.07.013
35.
Hulsmans M Sager HB Roh JD Valero-Muñoz M Houstis NE Iwamoto Y et al Cardiac macrophages promote diastolic dysfunction. J Exp Med. (2018) 215:423–40. 10.1084/jem.20171274
36.
Yang HJ Kong B Shuai W Zhang JJ Huang H . Knockout of MD1 contributes to sympathetic hyperactivity and exacerbates ventricular arrhythmias following heart failure with preserved ejection fraction via NLRP3 inflammasome activation.Exp Physiol. (2020) 105:966–78. 10.1113/EP088390
37.
Yoon S Kim M Lee H Kang G Bedi K Margulies KB et al S-nitrosylation of histone deacetylase 2 by neuronal nitric oxide synthase as a mechanism of diastolic dysfunction. Circulation. (2021) 143:1912–25. 10.1161/CIRCULATIONAHA.119.043578
38.
Kiatchoosakun S Restivo J Kirkpatrick D Hoit BD . Assessment of left ventricular mass in mice: comparison between two-dimensional and m-mode echocardiography.Echocardiography. (2002) 19:199–205. 10.1046/j.1540-8175.2002.00199.x
39.
Zhou YQ Foster FS Parkes R Adamson SL . Developmental changes in left and right ventricular diastolic filling patterns in mice.Am J Physiol Heart Circ Physiol. (2003) 285:H1563–75. 10.1152/ajpheart.00384.2003
40.
Guo H Isserlin R Emili A Burniston JG . Exercise-responsive phosphoproteins in the heart.J Mol Cell Cardiol. (2017) 111:61–8. 10.1016/j.yjmcc.2017.08.001
41.
Kim S Rabhi N Blum BC Hekman R Wynne K Emili A et al Triphenyl phosphate is a selective PPARγ modulator that does not induce brite adipogenesis in vitro and in vivo. Arch Toxicol. (2020) 94:3087–103.
42.
Dost AFM Moye AL Vedaie M Tran LM Fung E Heinze D et al Organoids model transcriptional hallmarks of oncogenic KRAS activation in lung epithelial progenitor cells. Cell Stem Cell. (2020) 27:663–78.e8. 10.1016/j.stem.2020.07.022
43.
Cantin GT Shock TR Park SK Madhani HD Yates JR III Optimizing TiO2-based phosphopeptide enrichment for automated multidimensional liquid chromatography coupled to tandem mass spectrometry. Anal Chem. (2007) 79:4666–73. 10.1021/ac0618730
44.
Guo H Isserlin R Chen X Wang W Phanse S Zandstra PW et al Integrative network analysis of signaling in human CD34(+) hematopoietic progenitor cells by global phosphoproteomic profiling using TiO2 enrichment combined with 2D LC-MS/MS and pathway mapping. Proteomics. (2013) 13:1325–33. 10.1002/pmic.201200369
45.
Blum BC Emili A Omics notebook: robust, reproducible, and flexible automated multi-omics exploratory analysis and reporting. Bioinform. Adv. (2021) 1:1–4.
46.
Ritchie ME Phipson B Wu D Hu Y Law CW Shi W et al limma powers differential expression analyses for RNA-sequencing and microarray studies. Nucleic Acids Res. (2015) 43:e47. 10.1093/nar/gkv007
47.
Sergushichev AA . An algorithm for fast preranked gene set enrichment analysis using cumulative statistic calculation.bioRxiv [Preprint]. (2016).
48.
Korotkevich G Sukhov V Budin N Shpak B Artyomov MN Sergushichev A . Fast gene set enrichment analysis.bioRxiv [Preprint]. (2021). 10.1101/060012
49.
Subramanian A Tamayo P Mootha VK Mukherjee S Ebert BL Gillette MA et al Gene set enrichment analysis: a knowledge-based approach for interpreting genome-wide expression profiles. Proc Natl Acad Sci U.S.A. (2005) 102:15545–50. 10.1073/pnas.0506580102
50.
Merico D Isserlin R Stueker O Emili A Bader GD . Enrichment map: a network-based method for gene-set enrichment visualization and interpretation.PLoS One. (2010) 5:e13984. 10.1371/journal.pone.0013984
51.
Warren CM Krzesinski PR Greaser ML . Vertical agarose gel electrophoresis and electroblotting of high-molecular-weight proteins.Electrophoresis. (2003) 24:1695–702. 10.1002/elps.200305392
52.
Neuhoff V Arold N Taube D Ehrhardt W . Improved staining of proteins in polyacrylamide gels including isoelectric focusing gels with clear background at nanogram sensitivity using Coomassie brilliant blue G-250 and R-250.Electrophoresis. (1988) 9:255–62. 10.1002/elps.1150090603
53.
van der Pijl RJ Hudson B Granzier-Nakajima T Li F Knottnerus AM Smith J et al Deleting titin’s C-terminal PEVK exons increases passive stiffness, alters splicing, and induces cross-sectional and longitudinal hypertrophy in skeletal muscle. Front Physiol. (2020) 11:494. 10.3389/fphys.2020.00494
54.
Saw EL Pearson JT Schwenke DO Munasinghe PE Tsuchimochi H Rawal S et al Activation of the cardiac non-neuronal cholinergic system prevents the development of diabetes-associated cardiovascular complications. Cardiovasc Diabetol. (2021) 20:50. 10.1186/s12933-021-01231-8
55.
R Core Team. R: A Language and Environment for Statistical Computing. Vienna: R Foundation for Statistical Computing (2020).
56.
Sanders-Van Wijk S Barandiarán Aizpurua A Brunner-La Rocca HP Henkens M Weerts J Knackstedt C et al The HFA-PEFF and H2FPEF scores largely disagree in classifying patients with suspected heart failure with preserved. Eur J Heart Fail. (2021) 23:838–40. 10.1002/ejhf.2019
57.
Barandiarán Aizpurua A Sanders-Van Wijk S Brunner-La Rocca HP Henkens M Heymans S Beussink-Nelson L et al Validation of the HFA-PEFF score for the diagnosis of heart failure with preserved ejection fraction. Eur J Heart Fail. (2020) 22:413–21. 10.1002/ejhf.1614
58.
Withaar C Lam CSP Schiattarella GG De Boer RA Meems LMG . Heart failure with preserved ejection fraction in humans and mice: embracing clinical complexity in mouse models.Eur Heart J. (2021) 42:4420–30. 10.1093/eurheartj/ehab389
59.
Zeng H Chen JX . Sirtuin 3, endothelial metabolic reprogramming, and heart failure with preserved ejection fraction.J Cardiovasc Pharmacol. (2019) 74:315–23. 10.1097/FJC.0000000000000719
60.
Tong D Schiattarella GG Jiang N Altamirano F Szweda PA Elnwasany A et al NAD(+) repletion reverses heart failure with preserved ejection fraction. Circ Res. (2021) 128:1629–41. 10.1161/CIRCRESAHA.120.317046
61.
Zhang W Zhang H Yao W Li L Niu P Huo Y et al Morphometric, hemodynamic, and multi-omics analyses in heart failure rats with preserved ejection fraction. Int J Mol Sci. (2020) 21:3362. 10.3390/ijms21093362
62.
Voelkel T Linke WA . Conformation-regulated mechanosensory control via titin domains in cardiac muscle.Pflugers Arch. (2011) 462:143–54. 10.1007/s00424-011-0938-1
63.
Kötter S Andresen C Krüger M . Titin: central player of hypertrophic signaling and sarcomeric protein quality control.Biol Chem. (2014) 395:1341–52. 10.1515/hsz-2014-0178
64.
Zile MR Baicu CF Ikonomidis JS Stroud RE Nietert PJ Bradshaw AD et al Myocardial stiffness in patients with heart failure and a preserved ejection fraction: contributions of collagen and titin. Circulation. (2015) 131:1247–59. 10.1161/CIRCULATIONAHA.114.013215
65.
Chen J Chen S Zhang B Liu J . SIRT3 as a potential therapeutic target for heart failure.Pharmacol Res. (2021) 165:105432. 10.1016/j.phrs.2021.105432
66.
Lai YC Tabima DM Dube JJ Hughan KS Vanderpool RR Goncharov DA et al SIRT3-AMP-activated protein kinase activation by nitrite and metformin improves hyperglycemia and normalizes pulmonary hypertension associated with heart failure with preserved ejection fraction. Circulation. (2016) 133:717–31. 10.1161/CIRCULATIONAHA.115.018935
67.
Del Campo A Perez G Castro PF Parra V Verdejo HE . Mitochondrial function, dynamics and quality control in the pathophysiology of HFpEF.Biochim Biophys Acta Mol Basis Dis. (2021) 1867:166208. 10.1016/j.bbadis.2021.166208
68.
Shah SJ . Precision medicine for heart failure with preserved ejection fraction: an overview.J Cardiovasc Transl Res. (2017) 10:233–44. 10.1007/s12265-017-9756-y
69.
Pieske B Tschöpe C De Boer RA Fraser AG Anker SD Donal E et al How to diagnose heart failure with preserved ejection fraction: the HFA–PEFF diagnostic algorithm: a consensus recommendation from the Heart Failure Association (HFA) of the European Society of Cardiology (ESC). Eur Heart J. (2019) 40:3297–317. 10.1093/eurheartj/ehz641
70.
Bertero E Sequeira V Maack C . Hungry hearts.Circ Heart Fail. (2018) 11:e005642. 10.1161/CIRCHEARTFAILURE.118.005642
71.
Aubert G Martin OJ Horton JL Lai L Vega RB Leone TC et al The failing heart relies on ketone bodies as a fuel. Circulation. (2016) 133:698–705. 10.1161/CIRCULATIONAHA.115.017355
72.
Bedi KC Jr Snyder NW Brandimarto J Aziz M Mesaros C Worth AJ et al Evidence for intramyocardial disruption of lipid metabolism and increased myocardial ketone utilization in advanced human heart failure. Circulation. (2016) 133:706–16. 10.1161/CIRCULATIONAHA.115.017545
73.
Zordoky BN Sung MM Ezekowitz J Mandal R Han B Bjorndahl TC et al Metabolomic fingerprint of heart failure with preserved ejection fraction. PLoS One. (2015) 10:e0124844. 10.1371/journal.pone.0124844
74.
Echouffo-Tcheugui JB Lewsey SC Weiss RG . SGLT2 inhibitors: further evidence for heart failure with preserved ejection fraction as a metabolic disease?J Clin Invest. (2021) 131:e156309. 10.1172/JCI156309
75.
Murashige D Jang C Neinast M Edwards JJ Cowan A Hyman MC et al Comprehensive quantification of fuel use by the failing and nonfailing human heart. Science. (2020) 370:364–8. 10.1126/science.abc8861
76.
Yurista SR Rosenzweig A Nguyen CT . Ketone bodies: universal cardiac response to stress?J Am Coll Cardiol. (2021) 78:1433–6. 10.1016/j.jacc.2021.08.002
77.
Ferrannini E Mark M Mayoux E . CV protection in the EMPA-REG OUTCOME trial: a “thrifty substrate” hypothesis.Diabetes Care. (2016) 39:1108–14. 10.2337/dc16-0330
78.
Schugar RC Moll AR André d’Avignon D Weinheimer CJ Kovacs A Crawford PA . Cardiomyocyte-specific deficiency of ketone body metabolism promotes accelerated pathological remodeling.Mol Metab. (2014) 3:754–69. 10.1016/j.molmet.2014.07.010
79.
Van Eyk JE . Overview: the maturing of proteomics in cardiovascular research.Circ Res. (2011) 108:490–8.
80.
Huttlin EL Jedrychowski MP Elias JE Goswami T Rad R Beausoleil SA et al A tissue-specific atlas of mouse protein phosphorylation and expression. Cell. (2010) 143:1174–89.
81.
Lam CSP Voors AA de Boer RA Solomon SD van Veldhuisen DJ . Heart failure with preserved ejection fraction: from mechanisms to therapies.Eur Heart J. (2018) 39:2780–92.
82.
Borlaug BA Paulus WJ . Heart failure with preserved ejection fraction: pathophysiology, diagnosis, and treatment.Eur Heart J. (2011) 32: 670–9.
83.
Fukuda N Granzier H Ishiwata S Morimoto S . Editorial: recent advances on myocardium physiology.Front Physiol. (2021) 12:697852. 10.3389/fphys.2021.697852
84.
Soetkamp D Gallet R Parker SJ Holewinski R Venkatraman V Peck K et al Myofilament phosphorylation in stem cell treated diastolic heart failure. Circ Res. (2021) 129:1125–40. 10.1161/CIRCRESAHA.119.316311
85.
Linke WA Kruger M . The giant protein titin as an integrator of myocyte signaling pathways.Physiology. (2010) 25:186–98. 10.1152/physiol.00005.2010
86.
Frey N Luedde M Katus HA . Mechanisms of disease: hypertrophic cardiomyopathy.Nat Rev Cardiol. (2011) 9:91–100. 10.1038/nrcardio.2011.159
87.
Maron BJ Maron MS . Hypertrophic cardiomyopathy.Lancet. (2013) 381:242–55. 10.1016/S0140-6736(12)60397-3
88.
Landstrom AP Ackerman MJ . Beyond the cardiac myofilament: hypertrophic cardiomyopathy- associated mutations in genes that encode calcium-handling proteins.Curr Mol Med. (2012) 12:507–18. 10.2174/156652412800620020
89.
Marian AJ . Molecular genetic basis of hypertrophic cardiomyopathy.Circ Res. (2021) 128:1533–53. 10.1161/CIRCRESAHA.121.318346
90.
Sequeira V Nijenkamp LL Regan JA van der Velden J . The physiological role of cardiac cytoskeleton and its alterations in heart failure.Biochim Biophys Acta. (2014) 1838:700–22. 10.1016/j.bbamem.2013.07.011
91.
Harvey PA Leinwand LA . The cell biology of disease: cellular mechanisms of cardiomyopathy.J Cell Biol. (2011) 194:355–65. 10.1083/jcb.201101100
92.
Koser F Loescher C Linke WA . Posttranslational modifications of titin from cardiac muscle: how, where, and what for?FEBS J. (2019) 286:2240–60. 10.1111/febs.14854
93.
Tharp CA Haywood ME Sbaizero O Taylor MRG Mestroni L . The giant protein titin’s role in cardiomyopathy: genetic, transcriptional, and post-translational modifications of TTN and their contribution to cardiac disease.Front Physiol. (2019) 10:1436. 10.3389/fphys.2019.01436
94.
LeWinter MM Granzier HL . Cardiac titin and heart disease.J Cardiovasc Pharmacol. (2014) 63:207–12. 10.1097/FJC.0000000000000007
95.
Gautel M Goulding D Bullard B Weber K Furst DO . The central Z-disk region of titin is assembled from a novel repeat in variable copy numbers.J Cell Sci. (1996) 109(Pt 11):2747–54. 10.1242/jcs.109.11.2747
96.
Sebestyen MG Wolff JA Greaser ML . Characterization of a 5.4 kb cDNA fragment from the Z-line region of rabbit cardiac titin reveals phosphorylation sites for proline-directed kinases.J Cell Sci. (1995) 108(Pt 9):3029–37. 10.1242/jcs.108.9.3029
97.
Gautel M Leonard K Labeit S . Phosphorylation of KSP motifs in the C-terminal region of titin in differentiating myoblasts.EMBO J. (1993) 12:3827–34. 10.1002/j.1460-2075.1993.tb06061.x
98.
Loescher CM Hobbach AJ Linke WA . Titin (TTN): from molecule to modifications, mechanics and medical significance.Cardiovasc Res. (2021) 1–6. 10.1093/cvr/cvab328[Epub ahead of print].
99.
Hidalgo C Granzier H . Tuning the molecular giant titin through phosphorylation: role in health and disease.Trends Cardiovasc Med. (2013) 23:165–71. 10.1016/j.tcm.2012.10.005
100.
Hamdani N Herwig M Linke WA . Tampering with springs: phosphorylation of titin affecting the mechanical function of cardiomyocytes.Biophys Rev. (2017) 9:225–37. 10.1007/s12551-017-0263-9
101.
Horton JL Martin OJ Lai L Riley NM Richards AL Vega RB et al Mitochondrial protein hyperacetylation in the failing heart. JCI Insight. (2016) 2:e84897.
102.
Lai L Leone TC Keller MP Martin OJ Broman AT Nigro J et al Energy metabolic reprogramming in the hypertrophied and early stage failing heart: a multisystems approach. Circ Heart Fail. (2014) 7:1022–31. 10.1161/CIRCHEARTFAILURE.114.001469
103.
Jin L Galonek H Israelian K Choy W Morrison M Xia Y et al Biochemical characterization, localization, and tissue distribution of the longer form of mouse SIRT3. Protein Sci. (2009) 18:514–25. 10.1002/pro.50
104.
Rardin MJ Newman JC Held JM Cusack MP Sorensen DJ Li B et al Label-free quantitative proteomics of the lysine acetylome in mitochondria identifies substrates of SIRT3 in metabolic pathways. Proc Natl Acad Sci U.S.A. (2013) 110:6601–6. 10.1073/pnas.1302961110
105.
Samant SA Zhang HJ Hong Z Pillai VB Sundaresan NR Wolfgeher D et al SIRT3 deacetylates and activates OPA1 to regulate mitochondrial dynamics during stress. Mol Cell Biol. (2014) 34:807–19. 10.1128/MCB.01483-13
106.
Zhang J Xiang H Liu J Chen Y He RR Liu B . Mitochondrial sirtuin 3: new emerging biological function and therapeutic target.Theranostics. (2020) 10:8315–42. 10.7150/thno.45922
107.
Sundaresan NR Gupta M Kim G Rajamohan SB Isbatan A Gupta MP . Sirt3 blocks the cardiac hypertrophic response by augmenting Foxo3a-dependent antioxidant defense mechanisms in mice.J Clin Invest. (2009) 119:2758–71. 10.1172/JCI39162
108.
Koentges C Pfeil K Schnick T Wiese S Dahlbock R Cimolai MC et al SIRT3 deficiency impairs mitochondrial and contractile function in the heart. Basic Res Cardiol. (2015) 110:36. 10.1007/s00395-015-0493-6
109.
He X Zeng H Chen JX . Ablation of SIRT3 causes coronary microvascular dysfunction and impairs cardiac recovery post myocardial ischemia.Int J Cardiol. (2016) 215:349–57. 10.1016/j.ijcard.2016.04.092
110.
He X Zeng H Chen JX . Emerging role of SIRT3 in endothelial metabolism, angiogenesis, and cardiovascular disease.J Cell Physiol. (2019) 234:2252–65. 10.1002/jcp.27200
111.
Abdellatif M Trummer-Herbst V Koser F Durand S Adão R Vasques-Nóvoa F et al Nicotinamide for the treatment of heart failure with preserved ejection fraction. Sci Transl Med. (2021) 13:eabd7064. 10.1126/scitranslmed.abd7064
112.
Lanza IR Short DK Short KR Raghavakaimal S Basu R Joyner MJ et al Endurance exercise as a countermeasure for aging. Diabetes. (2008) 57:2933–42. 10.2337/db08-0349
113.
Rose G Dato S Altomare K Bellizzi D Garasto S Greco V et al Variability of the SIRT3 gene, human silent information regulator Sir2 homologue, and survivorship in the elderly. Exp Gerontol. (2003) 38:1065–70. 10.1016/s0531-5565(03)00209-2
114.
Bellizzi D Rose G Cavalcante P Covello G Dato S De Rango F et al A novel VNTR enhancer within the SIRT3 gene, a human homologue of SIR2, is associated with survival at oldest ages. Genomics. (2005) 85:258–63. 10.1016/j.ygeno.2004.11.003
115.
Pillai VB Sundaresan NR Jeevanandam V Gupta MP . Mitochondrial SIRT3 and heart disease.Cardiovasc Res. (2010) 88:250–6. 10.1093/cvr/cvq250
116.
Pandey A Parashar A Kumbhani D Agarwal S Garg J Kitzman D et al Exercise training in patients with heart failure and preserved ejection fraction: meta-analysis of randomized control trials. Circ Heart Fail. (2015) 8:33–40. 10.1161/CIRCHEARTFAILURE.114.001615
117.
Raghow R . An ‘omics’ perspective on cardiomyopathies and heart failure.Trends Mol Med. (2016) 22:813–27. 10.1016/j.molmed.2016.07.007
Summary
Keywords
HFpEF – heart failure with preserved ejection fraction, proteomics, phosphoproteomics, titin, mitochondria, metabolism, SIRT3
Citation
Valero-Muñoz M, Saw EL, Hekman RM, Blum BC, Hourani Z, Granzier H, Emili A and Sam F (2022) Proteomic and phosphoproteomic profiling in heart failure with preserved ejection fraction (HFpEF). Front. Cardiovasc. Med. 9:966968. doi: 10.3389/fcvm.2022.966968
Received
12 June 2022
Accepted
01 August 2022
Published
25 August 2022
Volume
9 - 2022
Edited by
Nazha Hamdani, Ruhr University Bochum, Germany
Reviewed by
Diederik Wouter Dimitri Kuster, University Medical Center Amsterdam, Netherlands; Tamás Radovits, Semmelweis University, Hungary
Updates
Copyright
© 2022 Valero-Muñoz, Saw, Hekman, Blum, Hourani, Granzier, Emili and Sam.
This is an open-access article distributed under the terms of the Creative Commons Attribution License (CC BY). The use, distribution or reproduction in other forums is permitted, provided the original author(s) and the copyright owner(s) are credited and that the original publication in this journal is cited, in accordance with accepted academic practice. No use, distribution or reproduction is permitted which does not comply with these terms.
*Correspondence: María Valero-Muñoz, mvalerom@bu.eduFlora Sam, florasam@bu.edu
†These authors have contributed equally to this work
This article was submitted to Heart Failure and Transplantation, a section of the journal Frontiers in Cardiovascular Medicine
Disclaimer
All claims expressed in this article are solely those of the authors and do not necessarily represent those of their affiliated organizations, or those of the publisher, the editors and the reviewers. Any product that may be evaluated in this article or claim that may be made by its manufacturer is not guaranteed or endorsed by the publisher.