Abstract
Introduction:
Right ventricular (RV) dysfunction and pulmonary hypertension (PH) have been previously associated with unfavorable outcomes in patients with severe aortic stenosis (AS) undergoing transcatheter aortic valve implantation (TAVI), but little is known about the effect of right ventricle (RV) to pulmonary artery (PA) coupling. Our study aimed to evaluate the determinant factors and the prognostic value of RV-PA coupling in patients undergoing TAVI.
Methods:
One hundred sixty consecutive patients with severe AS were prospectively enrolled, between September 2018 and May 2020. They underwent a comprehensive echocardiogram before and 30 days after TAVI, including speckle tracking echocardiography (STE) for myocardial deformation analysis of the left ventricle (LV), left atrium (LA), and RV function. Complete data on myocardial deformation was available in 132 patients (76.6 ± 7.5 years, 52.5% men) who formed the final study population. The ratio of RV free wall longitudinal strain (RV-FWLS) to PA systolic pressure (PASP) was used as an estimate of RV-PA coupling. Patients were analyzed according to baseline RV-FWLS/PASP cut-off point, determined through time-dependent ROC curve analysis, as follows: normal RV-PA coupling group (RV-FWLS/PASP ≥0.63, n = 65) and impaired RV-PA coupling group (RV-FWLS/PASP < 0.63, n = 67).
Results:
A significant improvement of RV-PA coupling was observed early after TAVI (0.75 ± 0.3 vs. 0.64 ± 0.3 before TAVI, p < 0.001), mainly due to PASP decrease (p < 0.001). LA global longitudinal strain (LA-GLS) is an independent predictor of RV-PA coupling impairment before and after TAVI (OR = 0.837, p < 0.001, OR = 0.848, p < 0.001, respectively), while RV diameter is an independent predictor of persistent RV-PA coupling impairment after TAVI (OR = 1.174, p = 0.002). Impaired RV-PA coupling was associated with a worse survival rate (66.3% vs. 94.9%, p-value < 0.001) and emerged as an independent predictor of mortality (HR = 5.97, CI = 1.44–24.8, p = 0.014) and of the composite endpoint of death and rehospitalization (HR = 4.14, CI = 1.37–12.5, p = 0.012).
Conclusion:
Our results confirm that relief of aortic valve obstruction has beneficial effects on the baseline RV-PA coupling, and they occur early after TAVI. Despite significant improvement in LV, LA, and RV function after TAVI, RV-PA coupling remains impaired in some patients, it is mainly related to persistent pulmonary hypertension and is associated with adverse outcomes.
Introduction
The treatment of severe aortic stenosis (AS) is guided by evidence-based recommendations (1–3). Transcatheter aortic valve implantation (TAVI) has become the preferred treatment of severe symptomatic AS in patients who are at high risk for surgery, with continuous expansion towards use in intermediate and low-risk patients (4–7). Although providing excellent short-term results, post-TAVI-associated 1–5 year mortality varies widely between 8.3% and 67.8% according to patients' risk profiles (5–7). This calls for a detailed examination of patient-related factors that have an impact on long-term survival (8). Among these, right ventricular (RV) dysfunction and pulmonary hypertension have been shown to have a negative prognostic impact after TAVI (9–11). Only a few studies have analyzed the synergic impact of these factors on mortality, by evaluating the RV to pulmonary artery (RV-PA) coupling, which integrates the RV systolic performance at a given degree of afterload through a non-invasive parameter, but using different parameters or in chronic heart failure patients (12, 13). Our study aims to assess the determinant factors and the prognostic value of RV-PA coupling, by using the ratio between right ventricle free wall longitudinal strain (RV-FWLS) and pulmonary artery systolic pressure (PASP), in patients undergoing TAVI.
Methods
Study population and procedure
Patients with severe symptomatic AS scheduled to undergo transfemoral TAVI in our center were prospectively enrolled between September 2018 and May 2020. Selection criteria included: age >40, severe AS [aortic valve area (AVA) < 1.0 cm2, indexed AVA < 0.6 cm2/m2, peak aortic jet velocity ≥4 m/s, or mean gradient ≥40 mmHg]. Exclusion criteria included: hypertrophic cardiomyopathy, prosthetic aortic valve, non-transfemoral TAVI, and poor acoustic window. All patients underwent Heart Team evaluation and were deemed eligible for TAVI based on current guideline recommendations. All procedures were performed in a hybrid operating room with participation of both interventional cardiologist and cardiovascular surgeon.
All patients underwent percutaneous transfemoral TAVI with balloon-expandable valve. The procedure was performed under general anesthesia and invasive hemodynamic monitoring. Transesophageal echocardiography was used during the procedure for additional guidance and assessment. Clinical, biological, and procedural data were collected. Coronary artery disease (CAD) was defined as the presence of coronary artery lesions, previously treated (PCI or CABG) or not requiring treatment at the time of procedure. The primary outcome was a composite endpoint of major adverse cardiac events (MACE) consisting of cardiac-related rehospitalization (obtained through a search in our institutional database and a telephone questionnaire), and all-cause mortality (obtained through a query of the National Register of population records), both performed 3 years after TAVI. No event was registered in the interval between intervention and follow-up echocardiography. The study was reviewed and approved by the institutional Ethics Committee.
Definitions and data collection—echocardiographic evaluation
All patients underwent a comprehensive echocardiogram performed by experienced echocardiographers both before and 30 days after TAVI using a Vivid E95 ultrasound system (General Electric Healthcare, Horten, Norway). Data were digitally stored for offline analysis using commercially available software (EchoPac version 203; GE Medical Systems, Horten, Norway) and images were analyzed by a single trained cardiologist according to current guidelines (14). Evaluation included standard parameters used to assess AS severity: peak aortic jet velocity, peak and mean pressure gradients across the aortic valve (using modified Bernoulli equation), and AVA (using continuity equation). In the parasternal long-axis view, LV dimensions were assessed, and LV mass was calculated using Devereux's formula and indexed to body surface area (14). LV end-diastolic and end-systolic volumes were measured in the apical 4-chamber and 2-chamber views and indexed to body surface area (14). LV ejection fraction (EF) was calculated according to the Simpson's biplane method (14). Left atrial volumes were measured by the biplane method of disks and indexed for body surface area (14). Transmitral flow was assessed by PW Doppler to measure the peak early (E) and late (A) diastolic velocities, and tissue Doppler imaging of the mitral annulus on the apical 4- chamber view was used to measure the e' velocities at both the lateral and septal sites to calculate the E/e’ ratio.
Myocardial deformation analysis using speckle tracking echocardiography (STE) was performed to assess LV and LA function. Evaluation included STE analysis for LV function: LV global longitudinal strain (GLS); LA function: LA global longitudinal strain (LAε, reservoir function), LA systolic strain rate (SSr, reservoir function), LA early diastolic strain rate (ESr, conduit function), late diastolic LA strain rate (ASr, contractile function). Complete myocardial deformation analysis was possible in 132 out of 160 patients. Negative values of strain parameters are used as moduli (positive numbers) for ease of analysis. RV function was assessed by measuring TAPSE, the peak systolic myocardial velocity at the lateral site of the tricuspid annulus (S'RV), RV fractional area change (FAC) and RV longitudinal strain parameters by STE: peak values of global RV strain (RV-GLS), RV free wall longitudinal strain (RV-FWLS) and the interventricular septum longitudinal strain (RV-IVS). The right ventricular systolic pressure was calculated from the peak velocity of the tricuspid regurgitant jet using the Bernoulli equation and the right atrial pressure (determined by the diameter and inspiratory collapse of the inferior vena cava) was added (14). Mean pulmonary arterial pressure was derived from pulmonary arterial systolic pressure (PASP) (15). The ratio of RV-FWLS to PASP was used as an estimate of RV-PA coupling. Patients were divided according to baseline RV-FWLS/PASP ratio as follows: RV-FWLS/PASP ≥ 0.63 as normal RV-PA coupling group (n = 65) and RV-FWLS/PASP < 0.63 as impaired RV-PA coupling group (n = 67) and were analyzed accordingly.
Statistical analysis
Continuous variables are given as mean ± standard deviation and compared using the Student t-test. Discrete variables were expressed as counts and percentages, and comparisons between groups were done with the χ2 or Fisher`s exact test, when appropriate. For comparisons between subgroups, Kruskal–Wallis test, Wilcoxon rank sum tests using pairwise comparisons and Chi-square test for comparing proportions (of categorical variables) between >2 groups have been used. Bonferroni method was used to adjust p-values for multiple comparisons.
Long-term clinical outcomes were estimated using the Kaplan-Meier method, with comparisons made using the log-rank test (overall or pair wise as appropriate).
Univariable analysis (linear and binary logistic) was used to identify potential predictors of RV-PA coupling from baseline characteristics. After careful selection of variables based on clinical judgment, univariable assessment (p < 0.05), exclusion of variables showing collinearity (Pearson's coefficient >0.6), and multiple testing to ensure stability, a multivariable model has been fitted (by stepwise multivariable regression analysis, linear and binary logistic).
Univariable predictors of all-cause mortality were determined using Cox proportional hazards (Enter). Multivariable analysis was also performed in a similar fashion (Forward Wald). A two-sided p-value of 0.05 was considered statistically significant for all tests. Time-dependent receiver operating characteristic (ROC) analysis was used to determine the associations between individual and combined surrogate parameters of RV-PA coupling and 3-year mortality (Figure 1). The baseline RV-FWLS/PASP cut-off point of 0.63 to discriminate between normal and impaired RV-PA coupling was determined through time-dependent ROC curve analysis based on the highest sum of sensitivity and specificity (death—AUC 0.650, CI 0.60–0.70, p = 0.001; sensitivity 86%, specificity 57%;) and is within the same range of previous studies associated with survival in AS or heart failure patients (12, 16, 17). Time-dependent ROC curve analysis was performed using SAS, version 9.3, software (Cary, NC). The rest of the analyses were conducted using SPSS 21.0 (SPSS, Inc., Chicago, IL, USA).
Figure 1
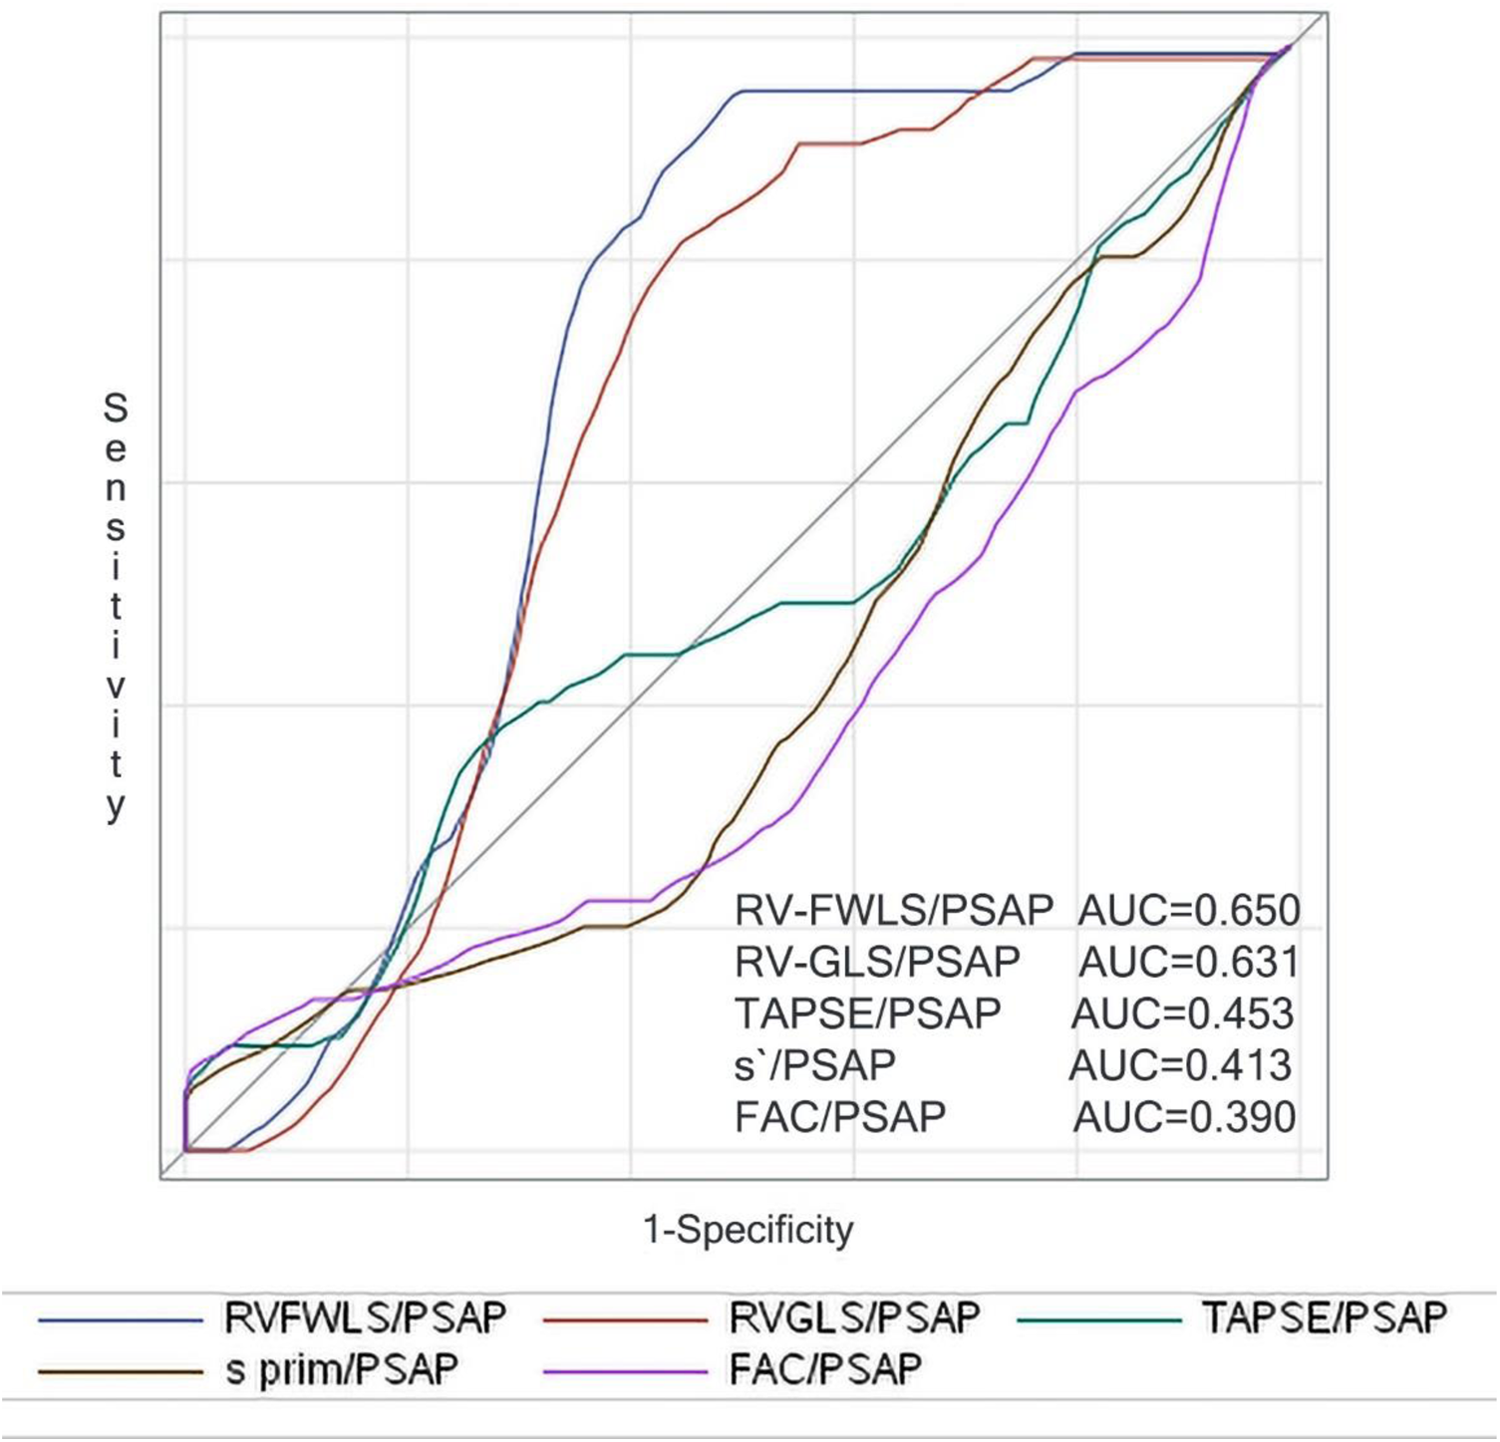
Right censored ROC curves for 3-year mortality of the parameters reflecting surrogates of baseline RV-PA coupling.
Results
Baseline characteristics
Patients with impaired baseline RV-PA coupling were younger, had more often atrial fibrillation, prior myocardial infarction, angina, and higher NYHA functional class compared to patients with normal RV-PA coupling (Table 1). There were no differences between groups regarding comorbidities. Even though there were no significant differences between groups regarding peak aortic jet velocity and mean transvalvular gradient (Table 2), there was a higher incidence of bicuspid valve and smaller AVAi in the group with impaired RV-PA coupling as compared to patients with normal RV-PA coupling (p = 0.031, and p = 0.008, respectively). Impaired LVEF was more frequent, and the impairment was more severe in patients with impaired RV-PA coupling (p < 0.001). Additionally, patients with impaired RV-PA coupling had more advanced cardiac damage as suggested by larger LA dimension and lower LA-GLS, larger RA and RV dimensions, and lower parameters of RV function compared to normal RV-PA coupling group (p < 0.001).
Table 1
| Demographic and clinical characteristics | All patients (n = 132) | Normal baseline RV-PA coupling | Impaired baseline RV-PA coupling | p-value |
|---|---|---|---|---|
| RVFWLS/PASP ≥0.63 (n = 65) | RVFWLS/PASP <0.63 (n = 67) | |||
| Age (years) | 76.6 ± 7.5 | 78.0 ± 5.7 | 75.1 ± 8.6 | 0.024 |
| Gender (female) | 76 (47.5%) | 30 (46.2%) | 37 (55.2%) | 0.297 |
| BMI (kg/m2) | 27.2 ± 4.5 | 26.8 ± 4.4 | 27.5 ± 4.6 | 0.375 |
| Symptoms | ||||
| Angina | 78 (59.1%) | 44 (67.7%) | 34 (50.7%) | 0.048 |
| NYHA functional class | 2.7 ± 0.6 | 2.6 ± 0.6 | 2.7 ± 0.6 | 0.191 |
| Class 2 | 39 (29.5%) | 26 (40.0%) | 13 (19.4%) | 0.035 |
| Class 3 | 86 (65.2%) | 36 (55.4%) | 50 (74.6%) | |
| Class 4 | 7 (5.3%) | 3 (4.6%) | 4 (6.0%) | |
| Comorbidities | ||||
| Atrial fibrillation | 41 (31.1%) | 11 (16.9%) | 30 (44.8%) | 0.001 |
| CAD | 74 (56.1%) | 40 (61.5%) | 34 (50.7%) | 0.212 |
| Prior PCI | 35 (26.5%) | 15 (23.1%) | 20 (29.9%) | 0.378 |
| Obesity | 45 (34.1%) | 20 (30.8%) | 25 (37.3%) | 0.428 |
| Type 2 DM | 38 (29.0%) | 21 (32.3%) | 17 (25.8%) | 0.402 |
| COPD | 13 (9.8%) | 5 (7.7%) | 9 (13.4%) | 0.284 |
| Anemia | 57 (43.2%) | 23 (35.4%) | 34 (50.7%) | 0.075 |
| CKD (≥3) | 31 (23.5%) | 16 (24.6%) | 15 (22.4%) | 0.763 |
| Frailty | 54 (40.9%) | 28 (43.1%) | 26 (38.8%) | 0.618 |
Clinical characteristics.
BMI, body mass index; DM, diabetes mellitus; CAD, coronary artery disease; CKD, chronic kidney disease; COPD, chronic obstructive pulmonary disease; NYHA, New York Hear Association Class; PCI, percutaneous coronary intervention.
Values are mean ± SD, n (%), or median (interquartile range).
Table 2
| Echocardiographic characteristics | All patients (n = 132) | Normal baseline RV-PA coupling | Impaired baseline RV-PA coupling | p-value |
|---|---|---|---|---|
| RVFWLS/PASP ≥0.63 (n = 65) | RVFWLS/PASP <0.63 (n = 67) | |||
| Aortic stenosis severity | ||||
| Vmax, m/s | 4.67 ± 0.8 | 4.8 ± 0.8 | 4.6 ± 0.8 | 0.106 |
| Mean gradient, mmHg | 57.6 ± 19.3 | 59.7 ± 19.4 | 55.6 ± 19.3 | 0.233 |
| AVAi, cm2/m2 | 0.4 ± 0.2 | 0.44 ± 0.2 | 0.37 ± 0.1 | 0.008 |
| Bicuspid valve | 19 (14.4%) | 5 (7.7%) | 14 (20.9%) | 0.031 |
| Aortic regurgitation | 1.2 ± 0.7 | 1.3 ± 0.7 | 1.2 ± 0.7 | 0.742 |
| Left ventricle | ||||
| LVEF, % | 51.8 ± 12.2 | 55.0 ± 7.9 | 48.6 ± 14.9 | 0.001 |
| LV-GLS, % | −12.4 ± 4.3 | −14.2 ± 3.9 | −10.5 ± 3.7 | <0.001 |
| LVMi, g/m2 | 180.3 ± 50.9 | 174 ± 47 | 187 ± 53 | 0.154 |
| E/A | 1.2 ± 0.8 | 0.84 ± 0.4 | 1.8 ± 0.9 | <0.001 |
| Mitral regurgitation | 1.3 ± 0.6 | 1.28 ± 0.6 | 1.27 ± 0.6 | 0.934 |
| Left atrium | ||||
| LAAi, cm2/m2 | 15.2 ± 3.3 | 14.2 ± 2.4 | 16.3 ± 3.6 | <0.001 |
| LAVi, ml/m2 | 55.2 ± 19.0 | 49.3 ± 13.4 | 61.3 ± 21.6 | <0.001 |
| LA-GLS, % (LAɛ) | 12.4 ± 6.9 | 16.1 ± 5.9 | 8.6 ± 5.6 | <0.001 |
| Right ventricle | ||||
| TAPSE, cm | 2.0 ± 0.4 | 2.2 ± 0.4 | 1.9 ± 0.4 | <0.001 |
| S`RV, cm/s | 10.4 ± 2.8 | 11.5 ± 2.5 | 9.4 ± 2.6 | <0.001 |
| FAC, % | 0.59 ± 0.3 | 42.6 ± 6.5 | 38.9 ± 9.1 | 0.009 |
| PASP, mmHg | 40.5 ± 15 | 30.9 ± 8.4 | 49.2 ± 15.1 | <0.001 |
| PAPm, mmHg | 26.3 ± 9.2 | 20.9 ± 5.2 | 32.0 ± 9.2 | <0.001 |
| RA, mm | 0.41 ± 0.1 | 33.8 ± 6.7 | 41.4 ± 8.5 | <0.001 |
| RV, mm | 37.7 ± 8.4 | 32.0 ± 4.7 | 36.6 ± 6.4 | <0.001 |
| Tricuspid regurgitation | 0.98 ± 0.87 | 0.85 ± 0.83 | 1.2 ± 0.90 | 0.014 |
| RV-GLS, % | 34.3 ± 6.1 | −21.2 ± 4.3 | −13.6 ± 4.9 | <0.001 |
| RV-FWLS, % | −17.4 ± 6.0 | −27.0 ± 4.9 | −16.9 ± 6.1 | <0.001 |
| RV-IVS, % | −22.0 ± 7.5 | −13.4 ± 6.1 | −8.6 ± 5.7 | <0.001 |
Echocardiographic characteristics.
Values are mean ± SD, n (%), or median (interquartile range). Vmax, maximum aortic velocity; AVA, aortic valve area; AVAi, aortic valve area index; LVEF, left ventricle ejection fraction; LV-GLS, left ventricle global longitudinal strain; LA, left atrium; LAAi, LA area index; LAVi, LA volume index; LVMi, LV mass index; LA-GLS, LA global longitudinal strain; TAPSE, tricuspid annular plane systolic excursion; S`RV, peak systolic myocardial velocity at the lateral site of the tricuspid annulus; PASP, systolic pulmonary artery pressure; PAPm, mean pulmonary artery pressure; FAC, right ventricle fractional area change; RA, right atrium; RV, right ventricle; RV-GLS, RV global longitudinal strain; RV-FWLS, RV free wall longitudinal strain; RV-IVS, RV interventricular septum strain.
Echocardiographic changes after TAVI
All echocardiographic parameters describing AS severity improved significantly after the procedure (Table 3). Compared with baseline, there was a significant improvement of LVEF after TAVI (p = 0.008) and decrease of LV mass index (p < 0.001). Additionally, mitral valve regurgitation decreased after TAVI (p = 0.003) and there was also a decrease of LA volume (p = 0.007), and an improvement of LA function (p < 0.001). We found a significant improvement in RV-PA coupling after TAVI (p = 0.007), mainly driven by a decrease in PASP (p < 0.001).
Table 3
| All patients (n = 132) | Baseline | post-TAVI | p-value |
|---|---|---|---|
| Aortic stenosis severity | |||
| Vmax, m/s | 4.67 ± 0.8 | 2.2 ± 0.5 | <0.001 |
| Mean gradient, mmHg | 57.6 ± 19.4 | 12.1 ± 5.0 | <0.001 |
| AVA, cm2 | 0.72 ± 0.3 | 1.7 ± 0.6 | <0.001 |
| AVAi, cm2/m2 | 0.4 ± 0.2 | 1.0 ± 0.3 | <0.001 |
| Aortic regurgitation | 1.2 ± 0.7 | 0.8 ± 0.6 | <0.001 |
| Left ventricle | |||
| LVEF, % | 51.4 ± 12.1 | 55.1 ± 10.0 | 0.008 |
| LV-GLS, % | −12.3 ± 4.2 | −13.9 ± 4.0 | 0.002 |
| LVMi, g/m2 | 180.8 ± 50.5 | 155.8 ± 42.7 | <0.001 |
| E/A | 1.2 ± 0.8 | 0.9 ± 0.4 | 0.001 |
| Mitral regurgitation | 1.3 ± 0.6 | 1.1 ± 0.5 | 0.003 |
| Left atrium | |||
| LAAi, cm2/m2 | 15.3 ± 3.2 | 14.2 ± 3.2 | 0.007 |
| LAVi, ml/m2 | 55.3 ± 19.0 | 49.1 ± 18.2 | 0.007 |
| LA-GLS, % (LAɛ) | 12.4 ± 6.9 | 15.6 ± 7.3 | <0.001 |
| Right ventricle | |||
| TAPSE, cm/s | 2.0 ± 0.4 | 2.1 ± 0.4 | 0.374 |
| S’RV, cm/s | 10.4 ± 2.8 | 12.3 ± 6.8 | 0.004 |
| FAC, % | 0.41 ± 0.1 | 0.42 ± 0.1 | 0.017 |
| PASP, mmHg | 40.2 ± 15 | 33.7 ± 11 | <0.001 |
| PAPm, mmHg | 26.3 ± 9 | 22.1 ± 7 | <0.001 |
| RA, mm | 37.7 ± 8.4 | 36.3 ± 7.9 | 0.178 |
| RV, mm | 34.3 ± 6.1 | 33.7 ± 5.9 | 0.378 |
| Tricuspid regurgitation | 0.98 ± 0.86 | 0.97 ± 0.77 | 0.944 |
| RV-GLS, % | −17.3 ± 6.0 | −18.6 ± 5.7 | 0.083 |
| RV-FWLS, % | −21.9 ± 7.5 | −23.2 ± 7.7 | 0.168 |
| RV-IVS, % | −11.1 ± 6.2 | −13.0 ± 5.1 | 0.010 |
| TAPSE/PASP, cm/mmHg | 0.59 ± 0.3 | 0.71 ± 0.3 | <0.001 |
| RV-GLS/PSAP | 0.51 ± 0.27 | 0.61 ± 0.26 | 0.002 |
| RV-FWLS/PSAP | 0.64 ± 0.34 | 0.75 ± 0.33 | 0.007 |
Echocardiographic changes after TAVI.
Values are mean ± SD. TAVI, transcatheter aortic valve implantation. Vmax, maximum aortic velocity; AVA, aortic valve area; AVAi, aortic valve area index; LVEF, left ventricle ejection fraction; LV-GLS, left ventricle global longitudinal strain; LA, left atrium; LAAi, LA area index; LAVi, LA volume index; LVMi, LV mass index; LA-GLS, LA global longitudinal strain; TAPSE, tricuspid annular plane systolic excursion; S`RV, peak systolic myocardial velocity at the lateral site of the tricuspid annulus; PASP, systolic pulmonary artery pressure; PAPm, mean pulmonary artery pressure; FAC, right ventricle fractional area change; RA, right atrium; RV, right ventricle; RV-GLS, RV global longitudinal strain; RV-FWLS, RV free wall longitudinal strain; RV-IVS, RV interventricular septum strain.
Significant improvement of echocardiographic parameters describing AS severity after TAVI were further noted regardless of group (Table 4). LV remodeling and LV function improvement were significant after the procedure regardless of baseline RV-PA coupling status. LA function and volume significantly improved after TAVI in both groups. RA diameter significantly decreased after TAVI in the impaired RV-PA coupling group (p = 0.046). RV function improved after TAVI in the impaired RV-PA coupling group as measured by RV-GLS (p = 0.001), RV-FWLS (p = 0.003), RV-IVS (p = 0.003), S`RV (p = 0.026), but not by TAPSE (p = 0.187) and FAC (p = 0.060).
Table 4
| Echocardiographic parameters | Normal RV-PA coupling baseline RVFWLS/PASP ≥0.63 (n = 65) | Impaired RV-PA coupling baseline RVFWLS/PASP <0.63 (n = 67) | ||||
|---|---|---|---|---|---|---|
| Baseline | 1 m post-TAVI | p-value | Baseline | 1 m post TAVI | p-value | |
| Aortic stenosis severity | ||||||
| Vmax, m/s | 4.8 ± 0.8 | 2.3 ± 0.5 | <0.001 | 4.6 ± 0.8 | 2.2 ± 0.5 | <0.001 |
| AVAi, cm2/m2 | 0.44 ± 0.2 | 0.98 ± 0.4 | <0.001 | 0.37 ± 0.1 | 0.92 ± 0.3 | <0.001 |
| Aortic regurgitation | 1.3 ± 0.7 | 0.9 ± 0.6 | <0.001 | 1.2 ± 0.7 | 0.8 ± 0.6 | <0.001 |
| Left ventricle | ||||||
| LVEF, % | 55.0 ± 7.9 | 57.5 ± 6.3 | 0.041 | 48.0 ± 14.4 | 52.8 ± 12.4 | 0.042 |
| LV-GLS, % | −14.2 ± 3.9 | −15.3 ± 3.6 | 0.098 | −10.5 ± 3.7 | −12.6 ± 3.9 | 0.002 |
| LVMi, g/m2 | 174 ± 47 | 151 ± 41 | 0.003 | 187 ± 53 | 160 ± 44 | 0.002 |
| E/A | 0.84 ± 0.4 | 0.75 ± 0.3 | 0.167 | 1.8 ± 0.9 | 1.1 ± 0.6 | <0.001 |
| Mitral regurgitation | 1.28 ± 0.6 | 1.05 ± 0.4 | 0.007 | 1.27 ± 0.6 | 1.12 ± 0.5 | 0.111 |
| Left atrium | ||||||
| LAAi, cm2/m2 | 14.2 ± 2.4 | 13.3 ± 2.5 | 0.047 | 16.3 ± 3.6 | 15.0 ± 3.7 | 0.032 |
| LAVi, ml/m2 | 49.3 ± 13.4 | 44.5 ± 12.9 | 0.042 | 61.3 ± 21.6 | 53.5 ± 21.3 | 0.037 |
| LA-GLS, % (LAɛ) | 16.1 ± 5.9 | 19.1 ± 6.3 | 0.007 | 8.6 ± 5.6 | 12.1 ± 6.5 | 0.001 |
| Right ventricle | ||||||
| TAPSE, cm/s | 2.2 ± 0.4 | 2.2 ± 0.4 | 0.936 | 1.9 ± 0.4 | 2.0 ± 0.4 | 0.187 |
| S`RV, cm/s | 11.5 ± 2.5 | 12.4 ± 2.2 | 0.020 | 9.4 ± 2.6 | 12.1 ± 9.3 | 0.026 |
| FAC, % | 42.6 ± 6.5 | 44.6 ± 6.7 | 0.084 | 38.9 ± 9.1 | 41.7 ± 8.2 | 0.060 |
| PASP, mmHg | 30.9 ± 8.4 | 29.1 ± 7.0 | 0.191 | 49.2 ± 15.1 | 38.1 ± 13.1 | <0.001 |
| PAPm | 20.9 ± 5.2 | 19.8 ± 4.3 | 0.191 | 32.0 ± 9.1 | 25.3 ± 8.0 | <0.001 |
| RV-GLS, % | −21.2 ± 4.3 | −20.9 ± 5.1 | 0.732 | −13.6 ± 4.9 | −16.5 ± 5.5 | 0.001 |
| RV-FWLS, % | −27.0 ± 4.9 | −26.1 ± 6.7 | 0.424 | −16.9 ± 6.1 | −20.6 ± 7.5 | 0.003 |
| RV-IVS, % | −13.4 ± 6.1 | −14.6 ± 4.5 | 0.244 | −8.6 ± 5.2 | −11.5 ± 5.1 | 0.003 |
Echocardiographic changes after TAVI according to baseline RV-PA coupling impairment (short-term effect of TAVI on RV-PA coupling).
Values are mean ± SD, n (%), or median (interquartile range). Vmax, maximum aortic velocity; AVA, aortic valve area; AVAi, aortic valve area index; LVEF, left ventricle ejection fraction; LV-GLS, left ventricle global longitudinal strain; LA, left atrium; LAAi, LA area index; LAVi, LA volume index; LVMi, LV mass index; LA-GLS, LA global longitudinal strain; TAPSE, tricuspid annular plane systolic excursion; S`RV, peak systolic myocardial velocity at the lateral site of the tricuspid annulus; PASP, systolic pulmonary artery pressure; PAPm, mean pulmonary artery pressure; FAC, right ventricle fractional area change; RA, right atrium; RV, right ventricle; RV-GLS, RV global longitudinal strain; RV-FWLS, RV free wall longitudinal strain; RV-IVS, RV interventricular septum strain.
Predictors of impaired RV-PA coupling
RV-PA coupling correlates at univariable and multivariable logistic regression analysis are presented in Table 5. Before TAVI, LA-GLS and RA diameter were independent predictors of RV-PA coupling impairment. Age, LA-GLS and RV diameter emerged as independent predictors of impaired RV-PA coupling after TAVI.
Table 5
| Univariable regression analysis | Pre TAVI | Post TAVI | ||
|---|---|---|---|---|
| OR | p-value | OR | p-value | |
| Age | 0.940 | 0.028 | 0.952 | 0.044 |
| Atrial fibrillation | 3.980 | 0.001 | 9.389 | <0.001 |
| AVAi | 0.048 | 0.009 | 0.406 | 0.102 |
| Bicuspid | 3.170 | 0.001 | 3.786 | 0.999 |
| LVMi | 1.005 | 0.129 | 1.009 | 0.043 |
| LVEF | 0.947 | <0.001 | 0.951 | 0.008 |
| LV-GLS* | 1.305 | <0.001 | 1.290 | <0.001 |
| E/A* | 14.46 | <0.001 | 4.689 | 0.020 |
| LAVi | 1.051 | <0.001 | 1.046 | 0.001 |
| LAAi | 1.315 | <0.001 | 1.251 | 0.001 |
| LA-GLS | 0.803 | <0.001 | 0.845 | <0.001 |
| TAPSE | 0.820 | <0.001 | 0.900 | 0.030 |
| S’RV* | 0.715 | <0.001 | 1.003 | 0.902 |
| FAC* | 0.942 | 0.011 | 0.897 | <0.001 |
| PASP* | 1.156 | <0.001 | 1.140 | <0.001 |
| PAPm* | 1.267 | <0.001 | 1.239 | <0.001 |
| RA | 1.149 | <0.001 | 1.107 | <0.001 |
| RV | 1.179 | <0.001 | 1.139 | <0.001 |
| Tricuspid regurgitation | 1.687 | 0.017 | 1.750 | 0.024 |
| RV-GLS* | 1.483 | <0.001 | 1.480 | <0.001 |
| RV-FWLS* | 1.434 | <0.001 | 1.361 | <0.001 |
| RV-IVS* | 1.181 | <0.001 | 1.227 | <0.001 |
| Multivariable regression analysis—Model 1 (Pre TAVI) | ||||
| LA-GLS | 0.837 | <0.001 | ||
| RA | 1.111 | 0.003 | ||
| Multivariable regression analysis—Model 2 (Post TAVI) | ||||
| Age | 0.931 | 0.040 | ||
| LA-GLS | 0.848 | <0.001 | ||
| RV | 1.174 | 0.002 | ||
Univariable and multivariable predictors of RV-PA coupling impairment (binary logistic regression).
AVA, aortic valve area; AVAi, aortic valve area index; LVEF, left ventricle ejection fraction; LV-GLS, left ventricle global longitudinal strain; LA, left atrium; LAAi, LA area index; LAVi, LA volume index; LVMi, LV mass index; LA-GLS, LA global longitudinal strain; TAPSE, tricuspid annular plane systolic excursion; S`RV, peak systolic myocardial velocity at the lateral site of the tricuspid annulus; PAPS, systolic pulmonary artery pressure; PAPm, mean pulmonary artery pressure; FAC, right ventricle fractional area change; RA-right atrium; RV, right ventricle RV-GLS, RV global longitudinal strain; RV-FWLS, RV free wall longitudinal strain; RV-IVS, RV interventricular septum strain. Model 1—Multivariable analysis (Backward Wald)—variables: age, atrial fibrillation, AVAi, bicuspid, LAVi, LA-GLS, LVEF, RA, RV, tricuspid regurgitation. Model 2—Multivariable analysis (Backward Wald)—variables: age, atrial fibrillation, LAVi, LV mass index, LA-GLS, LVEF, RA, RV, tricuspid regurgitation.
*Variables highly correlated with another variable (Pearson coefficient > 0.6), not included.
Clinical outcomes
Follow-up data were available for all patients, mean follow-up lasting 2.47 years (903 ± 216 days, range: 134–1,095 days). During follow-up, MACE occurred in 38 patients (24.4%), of which rehospitalization in 19 patients (11.9%), and death in 25 patients (15.6%). At 3-year follow-up the survival rate was 82.1%. Kaplan Meier analysis revealed that impaired baseline RV-PA coupling was associated with worse outcomes: lower freedom from MACE (54.8% vs. 85.6% in normal RV-PA coupling, p-value = 0.001) and lower survival rate (66.3% vs. 94.9% in normal RV-PA coupling, p-value < 0.001) (Figure 2). Impaired baseline RV-PA coupling as quantified by RV-FWLS/PSAP emerged as an independent predictor of both mortality (HR = 5.97, CI = 1.44–24.8, p-value = 0.014) and MACE (HR = 4.14, CI = 1.37–12.5, p-value = 0.012) (Table 6).
Figure 2
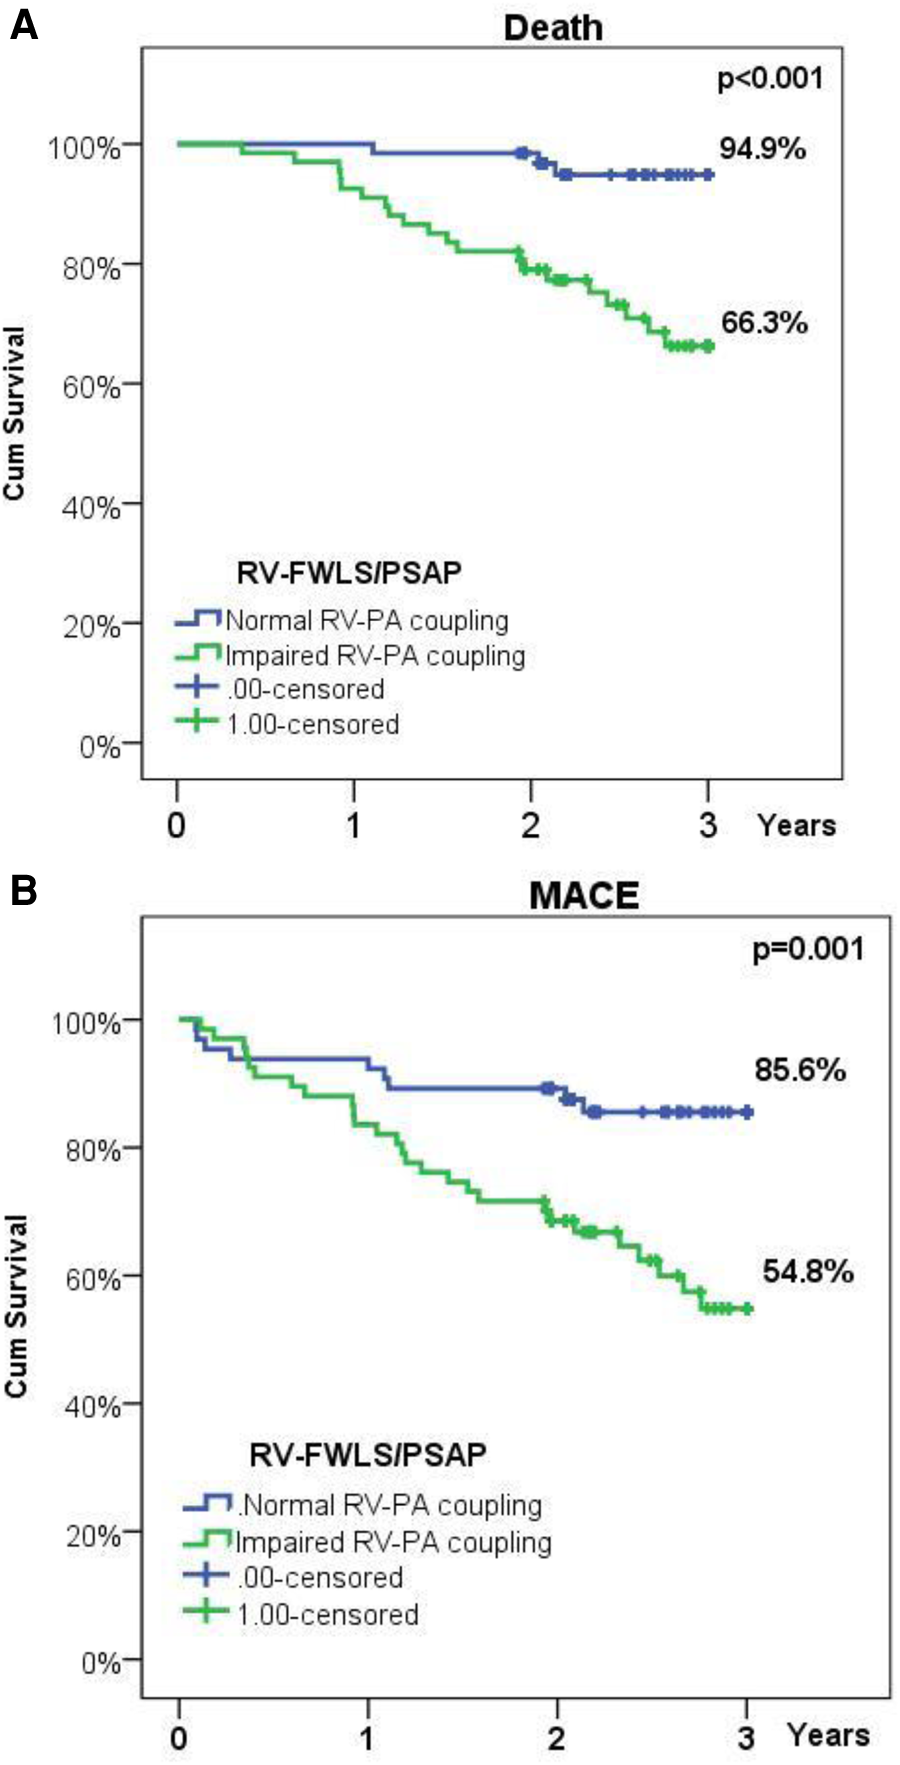
(A) Kaplan-Meier survival plot illustrating survival in patients with normal or impaired baseline RV-PA coupling; (B) Kaplan-Meier survival plot illustrating freedom from rehospitalization or death in patients with normal or impaired baseline RV-PA coupling.
Table 6
| Univariable analysis | MACE | Death | ||||
|---|---|---|---|---|---|---|
| Baseline parameters | HR | 95% CI | p-value | HR | 95% CI | p-value |
| Atrial fibrillation | 2.18 | 1.14–4.16 | 0.018 | 2.27 | 1.02–5.07 | 0.044 |
| LAVi | 1.01 | 0.99–1.02 | 0.110 | 1.02 | 0.99–1.03 | 0.059 |
| LAVi > 44* | 2.40 | 1.01–5.73 | 0.049 | 3.11 | 0.94–10.4 | 0.065 |
| LA-GLS | 0.96 | 0.91–1.01 | 0.110 | 0.96 | 0.90–1.02 | 0.160 |
| LA-GLS > 14* | 0.42 | 0.19–0.91 | 0.027 | 0.31 | 0.11–0.91 | 0.032 |
| LAAi | 1.07 | 0.99–1.16 | 0.097 | 1.10 | 1.00–1.21 | 0.047 |
| LAAi > 14* | 2.67 | 1.23–5.82 | 0.013 | 2.67 | 1.20–10.2 | 0.021 |
| PASP | 1.03 | 1.01–1.05 | 0.007 | 1.03 | 1.00–1.05 | 0.030 |
| PASP > 60* | 3.06 | 1.39–6.71 | 0.005 | 3.63 | 1.44–9.15 | 0.006 |
| TAPSE/PASP | 0.26 | 0.66–1.06 | 0.061 | 0.50 | 0.10–2.55 | 0.401 |
| TAPSE/PASP < 0.36* | 3.12 | 1.64–5.92 | 0.001 | 2.41 | 1.07–5.42 | 0.034 |
| RV-FWLS | 1.03 | 0.99–1.08 | 0.128 | 1.05 | 0.99–1.10 | 0.082 |
| RV-FWLS/PASP | 3.77 | 1.25–11.4 | 0.019 | 5.51 | 1.32–23.0 | 0.019 |
| RV-FWLS/PASP < 0.63* | 3.27 | 1.54–6.97 | 0.002 | 7.39 | 2.19–24.9 | 0.001 |
| Multivariable analysis | MACE | Death | ||||
| RV-FWLS/PASP | 4.14 | 1.37–12.5 | 0.012 | 5.97 | 1.44–24.8 | 0.014 |
Predictors of MACE and mortality (Cox regression analysis).
MACE, major adverse cardiac events; LAVi, LA volume index; LAAI, LA area index; LA-GLS, LA global longitudinal strain; TAPSE, tricuspid annular plane systolic excursion; PAPS, systolic pulmonary artery pressure; PAPm, mean pulmonary artery pressure; RV-FWLS, RV free wall longitudinal strain; RV-GLS, RV global longitudinal strain. Multivariable analysis (Backward Wald)—variables: atrial fibrillation, LAVi, LAAi, LA-GLS, RV-FWS/PSAP.
*Cut-off values determined by ROC analysis.
Discussion
Our study provides evidence that baseline RV-FWLS/PASP ratio, as a non-invasive surrogate of RV-PA coupling in patients with severe AS undergoing TAVI, is a novel parameter that refines risk assessment and independently predicts outcomes. The main findings of our study are: 1. Baseline RV-PA coupling impairment is influenced by persistent pulmonary hypertension and is associated with a greater burden of cardiac damage; 2. cardiac damage is only partially reversible, despite significant improvement of LV, LA, and RV function after TAVI; 3. Baseline impaired RV-PA coupling improves early after the procedure but continues to present a higher mortality risk in the long term.
RV-PA coupling and aortic stenosis severity
Although some studies reported no correlation between AS severity and the presence of PH or RV dysfunction, we found that patients with impaired baseline RV-PA coupling had more severe AS with lower AVAi and had more often bicuspid valves (13, 18, 19). The fact that there were no significant differences between groups regarding peak aortic jet velocity, peak and mean transvalvular gradients, should be interpreted in the context of impaired LVEF and low-flow low-gradient AS, which was more frequent in patients with impaired baseline RV-PA coupling. Moreover, AS severity traditionally quantified by transvalvular gradient and AVA has recently suffered a paradigm shift, resulting in the concept of AS-related cardiac damage or injury according to the reversibility potential (20, 21). As this model better translates AS severity into prognosis, in depth analysis of each component of cardiac damage/injury is required to improve treatment strategies and timing with respect to reversibility of injury (22, 23).
RV-PA coupling and left ventricular function in aortic stenosis
Even though the impact of impaired LVEF on RV-PA coupling has not been extensively studied, it has been previously reported that impaired LVEF is an independent predictor of PH (24). Due to ventricular interdependence, a significant fraction of developed pressure and RV volume outflow depends on LVEF, resulting in frequent RV dysfunction in patients with AS and is associated with reduced survival (25). Our study population included patients with impaired LVEF, more than a quarter, with a higher prevalence in the group with impaired RV-PA coupling. While LVEF and LV-GLS predicted to some extent baseline RV-PA coupling impairment, they failed to be independent predictors in the multivariable analysis. This could suggest that ventricular interdependence plays only a secondary role in the equation of RV-PA coupling. In our study we observed that baseline RV-PA coupling correlated with LV diastolic dysfunction but failed to independently predict it, which could indicate that despite reversible LV injury, impairment of upstream cardiac components could have different reversibility.
RV-PA coupling and left atrial function in aortic stenosis
Although LA function and dimensions have been previously shown to have an impact on morbidity and mortality in AS, little is known about the link between RV-PA coupling and LA function (26–28). In the context of AS, LA enlargement is a marker of longstanding increased LV filling pressures, and has been further correlated with upstream increased pressures in the pulmonary circulation (29).
In our study impaired baseline RV-PA coupling was associated with larger LA dimensions and impaired LA function, especially the reservoir and booster-pump. Atrial fibrillation was also correlated with impaired baseline RV-PA coupling, indicating loss of LA booster-pump. LA-GLS was associated with impaired RV-PA coupling before and after TAVI, suggesting that persistently impaired RV-PA coupling may be linked to irreversibility of atrial dysfunction. From a clinical point of view, improvement of left atrial function in the context of impaired RV-PA coupling failed to offer a significant benefit in terms of morbidity and mortality. While both indexed LA area and volume decreased after the procedure, persistence of LA dilation predicts the persistence of RV-PA coupling impairment. This clinically translated into the fact that the degree of decrease in LA dimensions only marginally impacted outcomes. These data are consistent with previous studies which suggest that LA active emptying is impaired in the presence of severe LA dilation, and propose the exceeding of optimal Frank-Starling mechanism as the explanation (30).
RV-PA coupling in aortic stenosis
Baseline pulmonary hypertension (PH) is common in patients with AS undergoing TAVI and has been linked to increased morbidity and mortality (31–33). Although more controversial regarding evaluation, quantification and impact, baseline RV dysfunction is also associated with adverse outcomes (21, 34, 35). The connection between PH and RV function has complex underlying pathophysiologic mechanisms that can be partly expressed through RV-PA coupling (36). Several studies have shown that TAPSE/PASP ratio as a non-invasive surrogate of RV-PA coupling offers prognostic information in patients with severe AS (12, 13). While PH can improve after TAVI and is associated with improved survival, similar to patients without PH, persistent PH is strongly associated with increased mortality and may require further treatment (33). Our study indicates an improvement in RV-PA coupling after TAVI, mainly through decrease in PASP values. Although not reflected by all RV function parameters, early improvement of RV function was noted, as assessed by tricuspid lateral annulus systolic velocity, FAC, RV-GLS and RV-FWLS. Acute improvements in RV function after TAVI have been previously demonstrated and can be partly explained by the LV-RV systolic interaction (37, 38). A study on HFrEF patients, where both RVGLS and RV-FWS have prognostic value, has shown that RV-FWS better predicts outcome, mainly because it is less influenced by LV longitudinal dysfunction (39). The results of our study, together with previous findings, support the idea that baseline RV-FWLS better refines risk assessment when used as a surrogate parameter for RV function normalized to baseline PASP value in the RV-PA coupling equation.
Limitations
This is a prospective study conducted on consecutive AS patients meeting the eligibility criteria for TAVI, resulting in a heterogenous population in terms of associated comorbidities, but resembling the real-life clinical setting. More than half of the included patients had associated CAD (of which half underwent previous coronary revascularization), as CAD is the most common comorbidity in AS (40).
One limitation of the study consisted in the short follow-up period as comprehensive echocardiographic evaluation was not routinely performed after the 1-month follow-up visit. Another limitation of the study is the lack of invasive measurements for comparison, but RV-FWLS/PASP has already been validated as a surrogate of RV-PA coupling as Ees/Ea in other populations (12, 41, 42) While mortality at 3-years was obtained through queries of the National Register of population records, no data regarding cause of death was available. Nonetheless, all-cause mortality represents an objective and relevant outcome. The pathophysiologic relations outlined in our study need to be interpreted in the context of a relatively small number of patients, but with comprehensive advanced echocardiographic assessment, and require further confirmation in larger studies.
Conclusion
Our results confirm that relief of aortic valve obstruction by TAVI has beneficial effects on the RV-PA coupling, that occur early after the procedure. This is accompanied by a significant improvement in LV, LA, and RV function. The results show a significant correlation between LA function and RV-PA coupling before TAVI, suggesting the contribution of LA function in modulating right heart function in patients with AS. Persistence of impaired RV-PA coupling after TAVI is mainly influenced by persistent pulmonary hypertension and is associated with long-term adverse outcomes. The complex underlying mechanisms of RV-PA coupling impairment require further analysis of cardiac injury reversibility.
Statements
Data availability statement
Requests to access these datasets should be directed to bogdan.a.popescu@gmail.com.
Ethics statement
The studies involving human participants were reviewed and approved by Institute for Cardiovascular Diseases “Prof. Dr. C. C. Iliescu”, Bucharest, Romania. The patients/participants provided their written informed consent to participate in this study.
Author contributions
CAP, AC, and BAP contributed to conception and design of the study. AC, MR, DC, SBB, RE and CB organized the database. CAP and AC performed the statistical analysis. CAP and AC wrote the first draft of the manuscript. DC, AM, MR, SBB, RE, CB wrote sections of the manuscript; CG, DD, OC, SB-T, VAI and BAP made critical revisions of the paper. All authors contributed to the article and approved the submitted version.
Acknowledgments
We gratefully acknowledge the support of our colleagues who have referred patients for this study. Publication of this paper was supported by the University of Medicine and Pharmacy Carol Davila, through the institutional program Publish not Perish.
Conflict of interest
BAP has received research support and lecture honoraria from GE Healthcare and Hitachi-Aloka. The remaining authors declare that the research was conducted in the absence of any commercial or financial relationships that could be construed as a potential conflict of interest.
Publisher’s note
All claims expressed in this article are solely those of the authors and do not necessarily represent those of their affiliated organizations, or those of the publisher, the editors and the reviewers. Any product that may be evaluated in this article, or claim that may be made by its manufacturer, is not guaranteed or endorsed by the publisher.
References
1.
Harris AW Pibarot P Otto CM . Aortic stenosis: guidelines and evidence gaps. Cardiol Clin. (2020) 38(1):55–63. 10.1016/j.ccl.2019.09.003
2.
Vahanian A Beyersdorf F Praz F Milojevic M Baldus S Bauersachs J et al 2021 ESC/EACTS guidelines for the management of valvular heart disease. Eur Heart J. (2021) 43(7):561–632. 10.1093/eurheartj/ehab395
3.
Nishimura RA Otto CM Bonow RO Carabello BA Erwin JP Fleisher LA et al 2017 AHA/ACC focused update of the 2014 AHA/ACC guideline for the management of patients with valvular heart disease: a report of the American college of cardiology/American heart association task force on clinical practice guidelines. J Am Coll Cardiol. (2017) 70(2):252–89. 10.1016/j.jacc.2017.03.011
4.
Popma JJ Deeb GM Yakubov SJ Mumtaz M Gada H O’Hair D et al Transcatheter aortic-valve replacement with a self-expanding valve in low-risk patients. N Engl J Med. (2019) 380(18):1706–15. 10.1056/NEJMoa1816885
5.
Mack MJ Leon MB Smith CR Miller DC Moses JW Tuzcu EM et al 5-year outcomes of transcatheter aortic valve replacement or surgical aortic valve replacement for high surgical risk patients with aortic stenosis (PARTNER 1): a randomised controlled trial. Lancet. (2015) 385(9986):2477–84. 10.1016/S0140-6736(15)60308-7
6.
Leon MB Smith CR Mack MJ Makkar RR Svensson LG Kodali SK et al Transcatheter or surgical aortic-valve replacement in intermediate-risk patients. N Engl J Med. (2016) 374(17):1609–20. 10.1056/NEJMoa1514616
7.
Mack MJ Leon MB Thourani VH Makkar R Kodali SK Russo M et al Transcatheter aortic-valve replacement with a balloon-expandable valve in low-risk patients. N Engl J Med. (2019) 380(18):1695–705. 10.1056/NEJMoa1814052
8.
Price J Bob-Manuel T Aymond J Amoran O Almusawi H Kelly J et al Low risk TAVR: long- term considerations and appropriate patient selection. Prog Cardiovasc Dis. (2020) 63(3):377–82. 10.1016/j.pcad.2020.04.002
9.
Cavalcante JL Simon MA Chan SY . Comprehensive right-sided assessment for transcatheter aortic valve replacement Risk stratification: time for a change. J Am Soc Echocardiogr. (2017) 30(1):47–51. 10.1016/j.echo.2016.11.006
10.
Schwartz LA Rozenbaum Z Ghantous E Kramarz J Biner S Ghermezi M et al Impact of right ventricular dysfunction and tricuspid regurgitation on outcomes in patients undergoing transcatheter aortic valve replacement. J Am Soc Echocardiogr. (2017) 30(1):36–46. 10.1016/j.echo.2016.08.016
11.
Grevious SN Fernandes MF Annor AK Ibrahim M Saint Croix GR de Marchena E et al Prognostic assessment of right ventricular systolic dysfunction on post–transcatheter aortic valve replacement short-term outcomes: systematic review and meta-analysis. J Am Heart Assoc. (2020) 9(12):e014463. 10.1161/JAHA.119.014463
12.
Iacoviello M Monitillo F Citarelli G Leone M Grande D Antoncecchi V et al Right ventriculo-arterial coupling assessed by two-dimensional strain: a new parameter of right ventricular function independently associated with prognosis in chronic heart failure patients. Int J Cardiol. (2017) 241:318–21. 10.1016/j.ijcard.2017.04.051
13.
Sultan I Cardounel A Abdelkarim I Kilic A Althouse AD Sharbaugh MS et al Right ventricle to pulmonary artery coupling in patients undergoing transcatheter aortic valve implantation. Heart. (2019) 105(2):117–21. 10.1136/heartjnl-2018-313385
14.
Lang RM Badano LP Mor-Avi V Afilalo J Armstrong A Ernande L et al Recommendations for cardiac chamber quantification by echocardiography in adults: an update from the American society of echocardiography and the European association of cardiovascular imaging. Eur Heart J Cardiovasc Imaging. (2015) 16(3):233–70. 10.1093/ehjci/jev014
15.
Chemla D Castelain V Humbert M Hébert JL Simonneau G Lecarpentier Y et al New formula for predicting mean pulmonary artery pressure using systolic pulmonary artery pressure. Chest. (2004) 126(4):1313–7. 10.1378/chest.126.4.1313
16.
Habibzadeh F Habibzadeh P Yadollahie M . On determining the most appropriate test cut-off value: the case of tests with continuous results. Biochem Medica. (2016) 26(3):297–307. 10.11613/BM.2016.034
17.
Vizzardi E Gavazzoni M Sciatti E Dallapellegrina L Bernardi N Raddino R et al Right ventricular deformation and right ventricular-arterial coupling in patients with heart failure due to severe aortic stenosis undergoing TAVI: long-term results. Am J Cardiovasc Dis. (2020) 10(3):150–63. PMID: 32923096; PMCID: PMC7486529.
18.
Ahn HS Chang SA Kim HK Kim SJ Lee SP Park SJ et al Determinants of pulmonary hypertension development in moderate or severe aortic stenosis. Int J Cardiovasc Imaging. (2014) 30(8):1519–28. 10.1007/s10554-014-0498-5
19.
Casaclang-Verzosa G Nkomo VT Sarano ME Malouf JF Miller FA Oh JK . E/Ea is the major determinant of pulmonary artery pressure in moderate to severe aortic stenosis. J Am Soc Echocardiogr. (2008) 21(7):824–7. 10.1016/j.echo.2007.12.002
20.
Capoulade R Le Ven F Clavel MA Dumesnil JG Dahou A Thébault C et al Echocardiographic predictors of outcomes in adults with aortic stenosis. Heart. (2016) 102(12):934–42. 10.1136/heartjnl-2015-308742
21.
Généreux P Pibarot P Redfors B Mack MJ Makkar RR Jaber WA et al Staging classification of aortic stenosis based on the extent of cardiac damage. Eur Heart J. (2017) 38(45):3351–58. 10.1093/eurheartj/ehx381
22.
Maeder MT Weber L Weilenmann D Haager PK Joerg L Taramasso M et al Invasive hemodynamic staging classification of cardiac damage in patients with aortic stenosis undergoing valve replacement. Can J Cardiol. (2020) 36(10):1667–74. 10.1016/j.cjca.2020.02.004
23.
Schewel J Kuck KH Frerker C Schmidt T Schewel D . Outcome of aortic stenosis according to invasive cardiac damage staging after transcatheter aortic valve replacement. Clin Res Cardiol. (2021) 110(5):699–710. 10.1007/s00392-021-01835-w
24.
Kapoor N Varadarajan P Pai RG . Echocardiographic predictors of pulmonary hypertension in patients with severe aortic stenosis. Eur J Echocardiogr. (2008) 9(1):31–3. 10.1016/j.euje.2007.01.005
25.
Khaddi S Kharbouche K Habbal R Azouzi L Drighil A . Prevalence and determinants or right ventricular dysfunction in severe aortic stenosis. Arch Cardiovasc Dis Suppl. (2018) 10(1):67. 10.1016/j.acvdsp.2017.11.269
26.
De Rosa R Murray MI Schranz D Mas-Peiro S Esmaeili A Zeiher AM et al Short-term decrease of left atrial size predicts clinical outcome in patients with severe aortic stenosis undergoing TAVR. Catheter Cardiovasc Interv. (2020) 96(3):E341–47. 10.1002/ccd.28542
27.
Imanishi J Tanaka H Sawa T Motoji Y Miyoshi T Mochizuki Y et al Association of left atrial booster-pump function with heart failure symptoms in patients with severe aortic stenosis and preserved left ventricular ejection fraction. Echocardiography. (2015) 32(5):758–67. 10.1111/echo.12733
28.
Galli E Fournet M Chabanne C Lelong B Leguerrier A Flecher E et al Prognostic value of left atrial reservoir function in patients with severe aortic stenosis: a 2D speckle-tracking echocardiographic study. Eur Heart J Cardiovasc Imaging. (2016) 17(5):533–41. 10.1093/ehjci/jev230
29.
Calin A Mateescu AD Rosca M Beladan CC Enache R Botezatu S et al Left atrial dysfunction as a determinant of pulmonary hypertension in patients with severe aortic stenosis and preserved left ventricular ejection fraction. Int J Cardiovasc Imaging. (2017) 33(12):1939–47. 10.1007/s10554-017-1211-2
30.
Pagel PS Kehl F Gare M Hettrick DA Kersten JR Warltier DC . Mechanical function of the left atrium: new insights based on analysis of pressure-volume relations and Doppler echocardiography. Anesthesiology. (2003) 98(4):975–94. 10.1097/00000542-200304000-00027
31.
Abdelkarim I Althouse AD Thoma FW Lee JS Schindler JT Gleason TG et al The importance of invasive hemodynamics for pulmonary hypertension screening in TAVR patients. J Am Coll Cardiol. (2017) 70(4):510–11. 10.1016/j.jacc.2017.04.061
32.
Ujihira K Kohmoto T Gimelli G Raval A Jacobson K Wolff M et al The impact of increased pulmonary arterial pressure on outcomes after transcatheter aortic valve replacement. Catheter Cardiovasc Interv. (2020) 96(7):E723–34. 10.1002/ccd.28862
33.
Masri A Abdelkarim I Sharbaugh MS Althouse AD Xu J Han W et al Outcomes of persistent pulmonary hypertension following transcatheter aortic valve replacement. Heart. (2018) 104(10):821–27. 10.1136/heartjnl-2017-311978
34.
Medvedofsky D Koifman E Jarrett H Miyoshi T Rogers T Ben-Dor I et al Association of right ventricular longitudinal strain with mortality in patients undergoing transcatheter aortic valve replacement. J Am Soc Echocardiogr. (2020) 33(4):452–60. 10.1016/j.echo.2019.11.014
35.
Ito S Pislaru SV Soo WM Huang R Greason KL Mathew V et al Impact of right ventricular size and function on survival following transcatheter aortic valve replacement. Int J Cardiol. (2016) 221:269–74. 10.1016/j.ijcard.2016.07.085
36.
Kubba S Davila CD Forfia PR . Methods for evaluating right ventricular function and ventricular–arterial coupling. Prog Cardiovasc Dis. (2016) 59(1):42–51. 10.1016/j.pcad.2016.06.001
37.
Eleid MF Padang R Pislaru SV Greason KL Crestanello J Nkomo VT et al Effect of transcatheter aortic valve replacement on right ventricular–pulmonary artery coupling. JACC Cardiovasc Interv. (2019) 12(21):2145–54. 10.1016/j.jcin.2019.07.025
38.
Schwarz K Singh S Dawson D Frenneaux MP . Right ventricular function in left ventricular disease: pathophysiology and implications. Heart Lung Circ. (2013) 22(7):507–11. 10.1016/j.hlc.2013.03.072
39.
Carluccio E Biagioli P Lauciello R Zuchi C Mengoni A Bardelli G et al Superior prognostic value of right ventricular free wall compared to global longitudinal strain in patients with heart failure. J Am Soc Echocardiogr. (2019) 32(7):836–44.e1. 10.1016/j.echo.2019.02.011
40.
Beach JM Mihaljevic T Svensson LG Rajeswaran J Marwick T Griffin B et al Coronary artery disease and outcomes of aortic valve replacement for severe aortic stenosis. J Am Coll Cardiol. (2013) 61(8):837–48. 10.1016/j.jacc.2012.10.049
41.
Focardi M Cameli M Carbone SF Massoni A De Vito R Lisi M et al Traditional and innovative echocardiographic parameters for the analysis of right ventricular performance in comparison with cardiac magnetic resonance. Eur Heart J Cardiovasc Imaging. (2015) 16(1):47–52. 10.1093/ehjci/jeu156
42.
Schmeisser A Rauwolf T Groscheck T Kropf S Luani B Tanev I et al Pressure-volume loop validation of TAPSE/PASP for right ventricular arterial coupling in heart failure with pulmonary hypertension. Eur Heart J Cardiovasc Imaging. (2021) 22(2):168–76. 10.1093/ehjci/jeaa285
Summary
Keywords
aortic stenosis, TAVI, coupling, right ventricle, pulmonary hypertension
Citation
Parasca CA, Calin A, Cadil D, Mateescu A, Rosca M, Botezatu SB, Enache R, Beladan C, Ginghina C, Deleanu D, Chioncel O, Bubenek-Turconi S, Iliescu VA and Popescu BA (2023) Right ventricle to pulmonary artery coupling after transcatheter aortic valve implantation—Determinant factors and prognostic impact. Front. Cardiovasc. Med. 10:1150039. doi: 10.3389/fcvm.2023.1150039
Received
23 January 2023
Accepted
27 March 2023
Published
17 April 2023
Volume
10 - 2023
Edited by
Francesco Ancona, Ospedale San Raffaele (IRCCS), Italy
Reviewed by
Erberto Carluccio, Division of Cardiology and Cardiovascular Pathophysiology, Heart Failure Unit, Italy Davide Margonato, San Raffaele Hospital (IRCCS), Italy
Updates
Copyright
© 2023 Parasca, Calin, Cadil, Mateescu, Rosca, Botezatu, Enache, Beladan, Ginghina, Deleanu, Chioncel, Bubenek-Turconi, Iliescu and Popescu.
This is an open-access article distributed under the terms of the Creative Commons Attribution License (CC BY). The use, distribution or reproduction in other forums is permitted, provided the original author(s) and the copyright owner(s) are credited and that the original publication in this journal is cited, in accordance with accepted academic practice. No use, distribution or reproduction is permitted which does not comply with these terms.
* Correspondence: Catalina A. Parasca catalina.parasca@gmail.com Bogdan A. Popescu bogdan.a.popescu@gmail.com
These authors have contributed equally to this work and share first authorship
†Deceased
Specialty Section: This article was submitted to Cardiovascular Imaging, a section of the journal Frontiers in Cardiovascular Medicine
Disclaimer
All claims expressed in this article are solely those of the authors and do not necessarily represent those of their affiliated organizations, or those of the publisher, the editors and the reviewers. Any product that may be evaluated in this article or claim that may be made by its manufacturer is not guaranteed or endorsed by the publisher.