Abstract
Background:
The relationship between the optical flow ratio (OFR) and clinical outcomes in patients with coronary artery disease (CAD) after percutaneous coronary stent implantation (PCI) remains unknown.
Objective:
To examine the correlation between post-PCI OFR and clinical outcomes in patients with CAD following PCI.
Methods:
Patients who underwent optical coherence tomography (OCT) guided PCI at Guangdong Provincial People's Hospital were retrospectively and continuously enrolled. Clinical data, post-PCI OCT characteristics, and OFR measurements were collected and analyzed to identify predictors of target vessel failure (TVF) after PCI.
Results:
Among 354 enrolled patients, 26 suffered TVF during a median follow-up of 484 (IQR: 400–774) days. Post-PCI OFR was significantly lower in the TVF group than in the non-TVF group (0.89 vs. 0.93; P = 0.001). In multivariable Cox regression analysis, post-PCI OFR (HR per 0.1 increase: 0.60; 95% CI: 0.41–0.89; P = 0.011), large stent edge dissection (HR: 3.85; 95% CI: 1.51–9.84; P = 0.005) and thin-cap fibroatheroma (TCFA) (HR: 2.95; 95% CI: 1.19–7.35; P = 0.020) in the non-stented segment were independently associated with TVF. In addition, the inclusion of post-PCI OFR to baseline characteristics and post-PCI OCT findings improved the predictive power of the model to distinguish subsequent TVF after PCI (0.838 vs. 0.796; P = 0.028).
Conclusion:
The post-PCI OFR serves as an independent determinant of risk for TVF in individuals with CAD after PCI. The inclusion of post-PCI OFR assessments, alongside baseline characteristics and post-PCI OCT findings, substantially enhances the capacity to differentiate the subsequent manifestation of TVF in CAD patients following PCI.
1. Introduction
Percutaneous coronary stent implantation (PCI) is an important treatment for patients with coronary artery disease (CAD) (1). Not only the status of stent implantation, but also fractional flow reserve (FFR) following PCI, are related to future prognosis (2–4). However, traditional methods for assessing PCI results, such as coronary angiography and intravascular imaging, are primarily used to evaluate vascular structure and stent implantation status, but their ability to assess the physiological function of coronary is limited (5–7). With the emergence of functional tools based on angiography and endovascular imaging in recent years, this ability to assess the physiological function has been enhanced (8, 9).
In recent years, optical coherence tomography (OCT) has become increasingly popular as an intravascular imaging modality for microstructure assessment during PCI (3). Recent studies indicate that optical flow ratio (OFR), as an OCT-based method for fast computation of FFR, has a strong correlation with wire-based FFR (9, 10). Shunsuke et al. (11) suggest that OFR is an independent predictor of TVF in patients with acute coronary syndrome (ACS) after PCI. However, their study did not include non-ACS patients. Even though it is strongly advised to use OCT in ACS (12, 13), a subgroup of patients with chronic myocardial ischemia syndrome, including stable angina, also benefit from OCT (14, 15). However, the association between post-PCI OFR and CAD patients (including ACS and stable angina) remains unclear. Therefore, the objective of this study was to investigate the relationship between post-PCI OFR and clinical outcomes in CAD patients following OCT-guided PCI.
2. Methods
2.1. Study population
This was a retrospective and observational study aimed to investigate the association between post-PCI OFR and clinical outcomes in patients with CAD after OCT-guided PCI. Patients diagnosed with CAD who underwent OCT-guided PCI at Guangdong Provincial People's Hospital from January 2018 to July 2021 were consecutively enrolled. This study protocol complied with the Declaration of Helsinki and was approved by the Ethics Committee of Guangdong Provincial People's Hospital with the requirement for informed consent waived (KY-Q-2022-091-01).
2.1.1. Inclusion criteria
Patients with CAD who underwent OCT-guided PCI and whose post-PCI OCT images were clear and analyzable. This clarity was attained through the successful removal of red blood cells from the OCT images, thereby enabling a precise visualization of the vascular tissue. In cases where a limited number of red blood cells remained, the accuracy of identifying the intimal tissue located behind them was still maintained.
2.1.2. Exclusion criteria
Patients without stent implantation, those with non-post-PCI OCT images, or those with unanalyzable OCT images due to poor image quality were excluded. Patients with CAD due to in-stent restenosis were also excluded from the present study.
The target lesion was identified based on coronary angiography, electrocardiography, or coronary physiologic examination results. The indication for PCI was ultimately decided by the operator.
2.2. Analysis and definitions of angiographic view
The angiographic view that best exposed the severity of the stenosis was used for quantitative coronary angiography (QCA) analysis, using the QCA software (Beijing Sichuang Technology Imaging Systems, Beijing, China).
Diameter stenosis (DS) was determined as the quotient of the minimum diameter to the reference diameter. Multivessel disease was defined as DS exceeding 50% in at least two vessels.
2.3. Analysis and definitions of OCT images
Patients underwent OCT guided PCI. Following the completion of the PCI procedure, OCT images were obtained using an OCT system (OPTIS™; Abbott Vascular, Santa Clara, CA, USA) and Dragonfly™ Optis™ OCT imaging catheters. The OCT catheter was advanced at least 5–10 mm distal to the target stent, and blood in the lumen was emptied with automated contrast injection during image acquisition. Images were stored digitally offline and analyzed by two experienced investigators who were blinded to the angiographic data and clinical presentation.
The target vessel was partitioned into two longitudinal subsegments after PCI: (1) the stented segment; (2) the non-stented segments (Figure 1). This study omitted the analysis of OCT results for branch vessels.
Figure 1
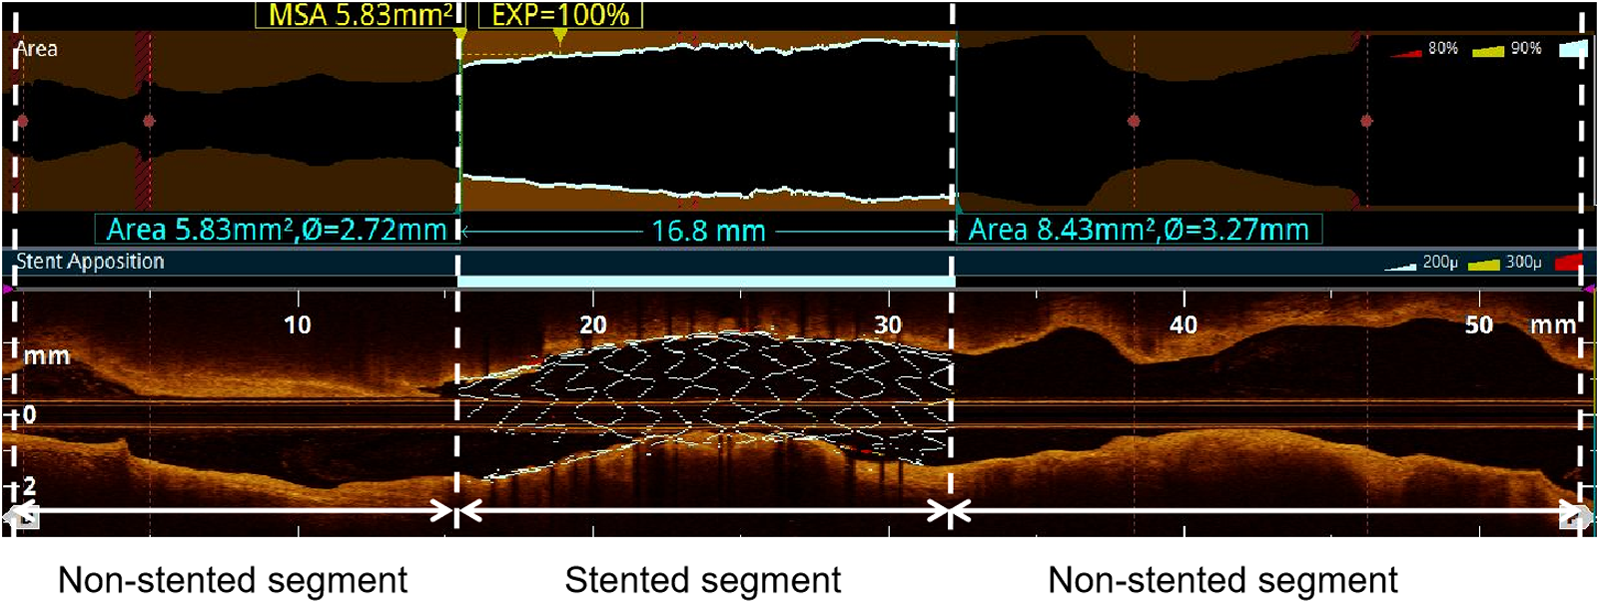
Subsegments analyzed by post-PCI OCT. The target vessel after PCI was divided into the following longitudinal subsegments: (1) stented segment; (2) non-stented segments. MSA: minimum stent area.
Stent expansion was quantified as the ratio of the minimum lumen area within the stent to the average reference lumen area (3, 16). The reference lumen was defined as the 5 mm lumen located distally and proximally from the stent edge. In-stent irregular protrusion was characterized as the presence of material with an uneven surface extending into the lumen between the stent struts (17, 18). To ensure accuracy, only protrusions within the stent with a maximum height of ≥200 μm were considered in the analysis, as some struts might be obscured within the intima. Malapposition was defined as the clear separation of struts from the vessel wall by ≥0.2 mm (17). Large stent edge dissection was characterized as the disruption of the luminal surface, exhibiting a visible flap (longitudinal extension >3 mm or extensive lateral >60° or deeper layers medial) at the stent edge (3). Thin-cap fibroatheroma (TCFA) was defined as plaque presenting a fibrous-cap thickness of <65 μm and a lipid arc of ≥180° (19, 20). In OCT imaging, we interpret areas of visually heightened signal intensity as potential indicators of macrophage infiltration. These regions present as distinct or continuous punctate patterns, where the signal intensity surpasses the speckle noise of the surrounding tissue. Such regions are commonly characterized as signal-rich (21).
2.4. OFR principle and plaque characterization analysis
In this study, the methodology for OFR computation and automatic plaque characterization, using OctPlus software (OctPlus1.0; Pulse Medical Imaging Technology, Shanghai, China), was previously described by Shengxian Tu et al. (22, 23) and Miao Chu et al. (24). All cross-sections from OCT were automatically delineated for lumens and internal elastic lamina, and side branches were automatically detected. Then, the area of the side branches ostium was calculated in the cut-plane perpendicular to the centreline of the side branches (23). In order to calculate the reference vessel size, the fractal laws of bifurcation were applied. The healthy lumen appears unaffected by stenosis, accounting for the inherent alteration in lumen dimensions caused by the step-down phenomenon during the traversal of bifurcations (22). In this model, the flow was assumed to be incompressible to follow the law of conservation of mass (25). The OFR value at each position along the vessel under investigation was calculated using a novel method derived from a validated computational FFR method. This involved applying a virtual volumetric flow rate at the inlet boundary. Specifically, the hyperemic volumetric flow rate was determined by multiplying the proximal reference lumen area obtained from OCT with a virtual hyperemic flow of 0.35 m/s (25). Following the computation, the reconstructed artery was color-coded based on the calculated OFR values (20). Plaque composition, including lipidic, fibrous, calcification, crystal and macrophage tissues, was subsequently detected and quantified by the software (20, 24). Examples of post-PCI OFR measurements and plaque composition analysis are presented in Figure 2. The aforementioned results were obtained by a proficient analyst who was blinded to the clinical outcomes.
Figure 2
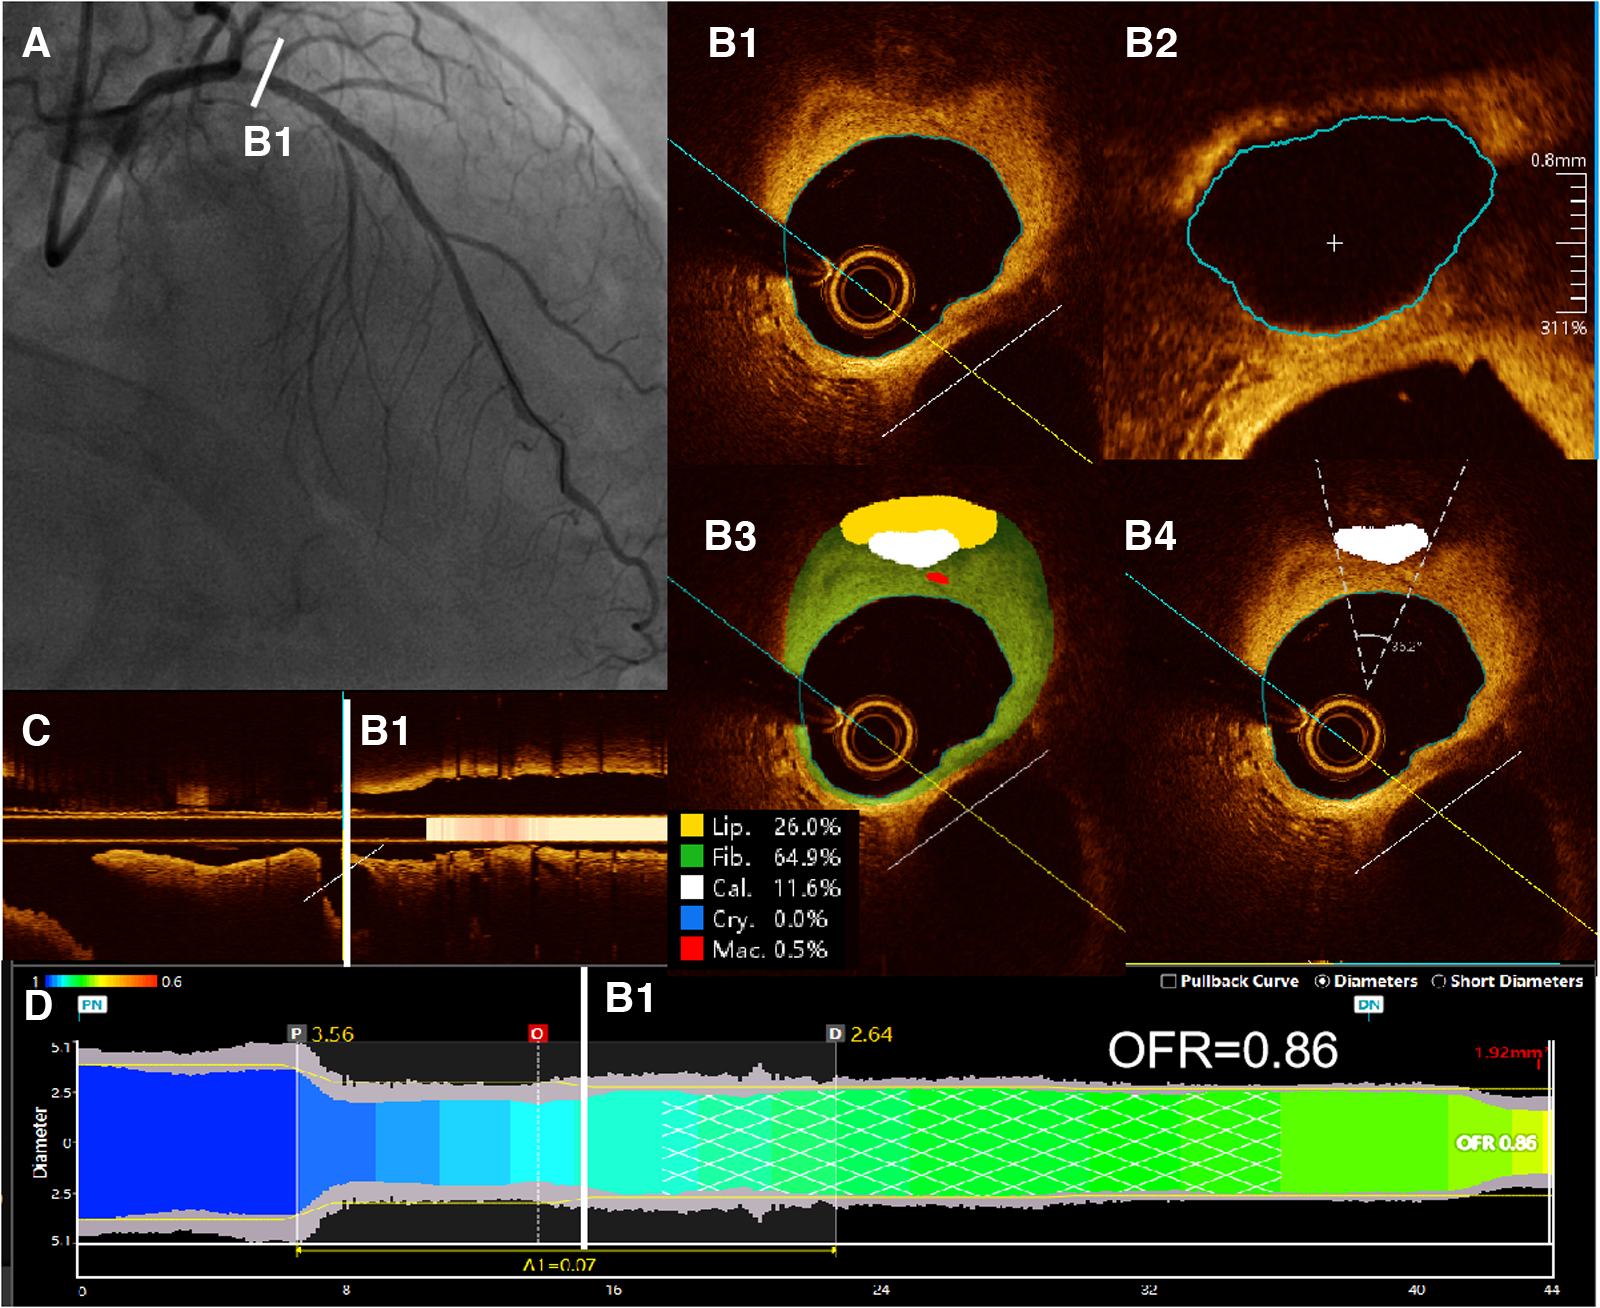
Examples of post-PCI OFR measurements and plaque composition analysis. (A) Coronary angiography showed residual stenosis in the proximal of LAD after PCI. (B1) All cross-sections from post-PCI OCT were automatically delineated for lumens and internal elastic lamina, and side branches were automatically detected. (B2) Then, the cut-plane perpendicular to the centreline of the side branch was reconstructed and the area of the side branch ostium in the cut-plane was computed. (B3) Plaque composition, including lipidic, fibrous, calcification, crystal and macrophage tissues, was detected and quantified by the software. (B4) Automatic computed values of cacification arc were shown on the corresponding cross sections. (C) Branches of the vessel were shown in the longitudinal view. (D) The computed post-PCI OFR measurements are color coded and displayed on the lumen-media diameter profiles. Post-PCI OFR of this example is 0.86. LAD, left anterior descending artery. OCT, optical coherence tomography. OFR, optical flow ratio.
To assess inter-observer and intra-observer consistency, we randomly selected 30 OCT images for analysis. Two experienced OCT imaging experts used OctPlus software to identify TCFA. Each researcher conducted a preliminary analysis at the initial time point and then repeated the analysis two weeks later.
2.5. Endpoint and follow-up
The primary endpoint of the study was target vessel failure (TVF), defined as the composite endpoint of cardiac death, target vessel-related myocardial infarction (TVMI), and ischemia-related target vessel revascularization (TVR) (11, 26). All deaths were considered cardiac deaths unless there was a clear non-cardiac cause. TVMI was identified by the presence of conclusive evidence of a target vessel subsequent to PCI. This evidence encompassed a notable elevation in creatine kinase-myocardial band (CK-MB) levels surpassing the upper reference limit, the observation of ST-segment elevation or depression on an electrocardiogram, and imaging results indicating fresh loss of viable myocardium or new regional wall motion abnormality. Procedural myocardial infarction (MI) refers to myocardial infarction that occurs as a result of a coronary intervention procedure, such as PCI, and was included in TVMI. TVR was defined as an unplanned repeat of PCI or bypass surgery of target vessels according to PCI. The event adjudication process was performed by an independent committee of experienced cardiologists who were blinded to the treatment assignments. They reviewed and analyzed all relevant clinical data, including medical records, laboratory results, and imaging studies, to determine whether each reported MI event met the predefined criteria for diagnosis. Any disagreements or uncertainties were resolved through discussion and consensus among the committee members. All patients underwent follow-up at least every year after PCI. Clinical outcomes were confirmed by medical record review, outpatient follow-up, and telephone visits.
2.6. Statistical analyses
The measurement data that adhered to a normal distribution were represented as mean ± SD, and the t-test was employed to compare groups. Continuous variables that did not adhere to a normal distribution were represented as median with an interquartile range (IQR) and analyzed using the Mann–Whitney U-test. Categorical variables were presented as frequencies, and group comparisons were conducted using the chi-square test or Fisher's exact test. All research variables were evaluated for their bivariate association with TVF. Those variables demonstrating a significant association at a level of P < 0.05 were included in the Cox regression model. Both univariate and multivariate Cox regression analyses were conducted to identify factors independently associated with TVF, and to calculate the corresponding hazard ratios (HR). Results were reported as HR with corresponding 95% confidence intervals (CI). Variables demonstrating a significant association in the univariate model (P < 0.05) were included in the multivariate model. The Cox regression model was applied using a backward elimination approach and was subjected to Bonferroni correction to adjust for multiple comparisons. Survival curves of TVF were generated through Kaplan-Meier analysis, and the log-rank test was utilized to compare TVF incidence disparities. The receiver operating characteristic (ROC) curve and the area under the ROC curve (AUC) were utilized to evaluate the added benefit of post-PCI OFR in conjunction with baseline characteristics and post-PCI OCT characteristics for the purpose of predicting TVF. The inter-observer and intra-observer variabilities for TCFA identification were evaluated using Cohen's Kappa statistic. The range of the Kappa value is between 0 and 1, where a value closer to 1 indicates better consistency.
In this research, the primary endpoint was assessed utilizing Cox regression analysis. Initially, we executed a univariate analysis to ascertain the correlation of each variable with TVF. Subsequently, variables that exhibited a significant correlation (P < 0.05) in the univariate Cox analysis, along with factors traditionally deemed clinically significant, were incorporated into the multivariate Cox regression model. This multivariate model employed a backward selection to identify which variables maintained a significant correlation with TVF upon controlling for other variables. Notably, even in the absence of statistical significance, factors traditionally considered clinically significant were included in the predictive model. The determination of statistical significance was undertaken via P-values. In both the univariate and multivariate Cox regression analyses, a P-value less than 0.05 was interpreted as statistically significant. Nevertheless, to adjust for the possibility of multiple comparisons, we implemented the Bonferroni correction.
3. Results
During the study period, a total of 494 consecutive patients underwent OCT-guided PCI. After exclusion of 140 patients, 354 patients with 354 vessels were finally included in the study (Figure 3). Table 1 provides a summary of the baseline, angiographic, and procedural characteristics. Table 2 presents a summary of the post-PCI OFR and OCT findings.
Figure 3
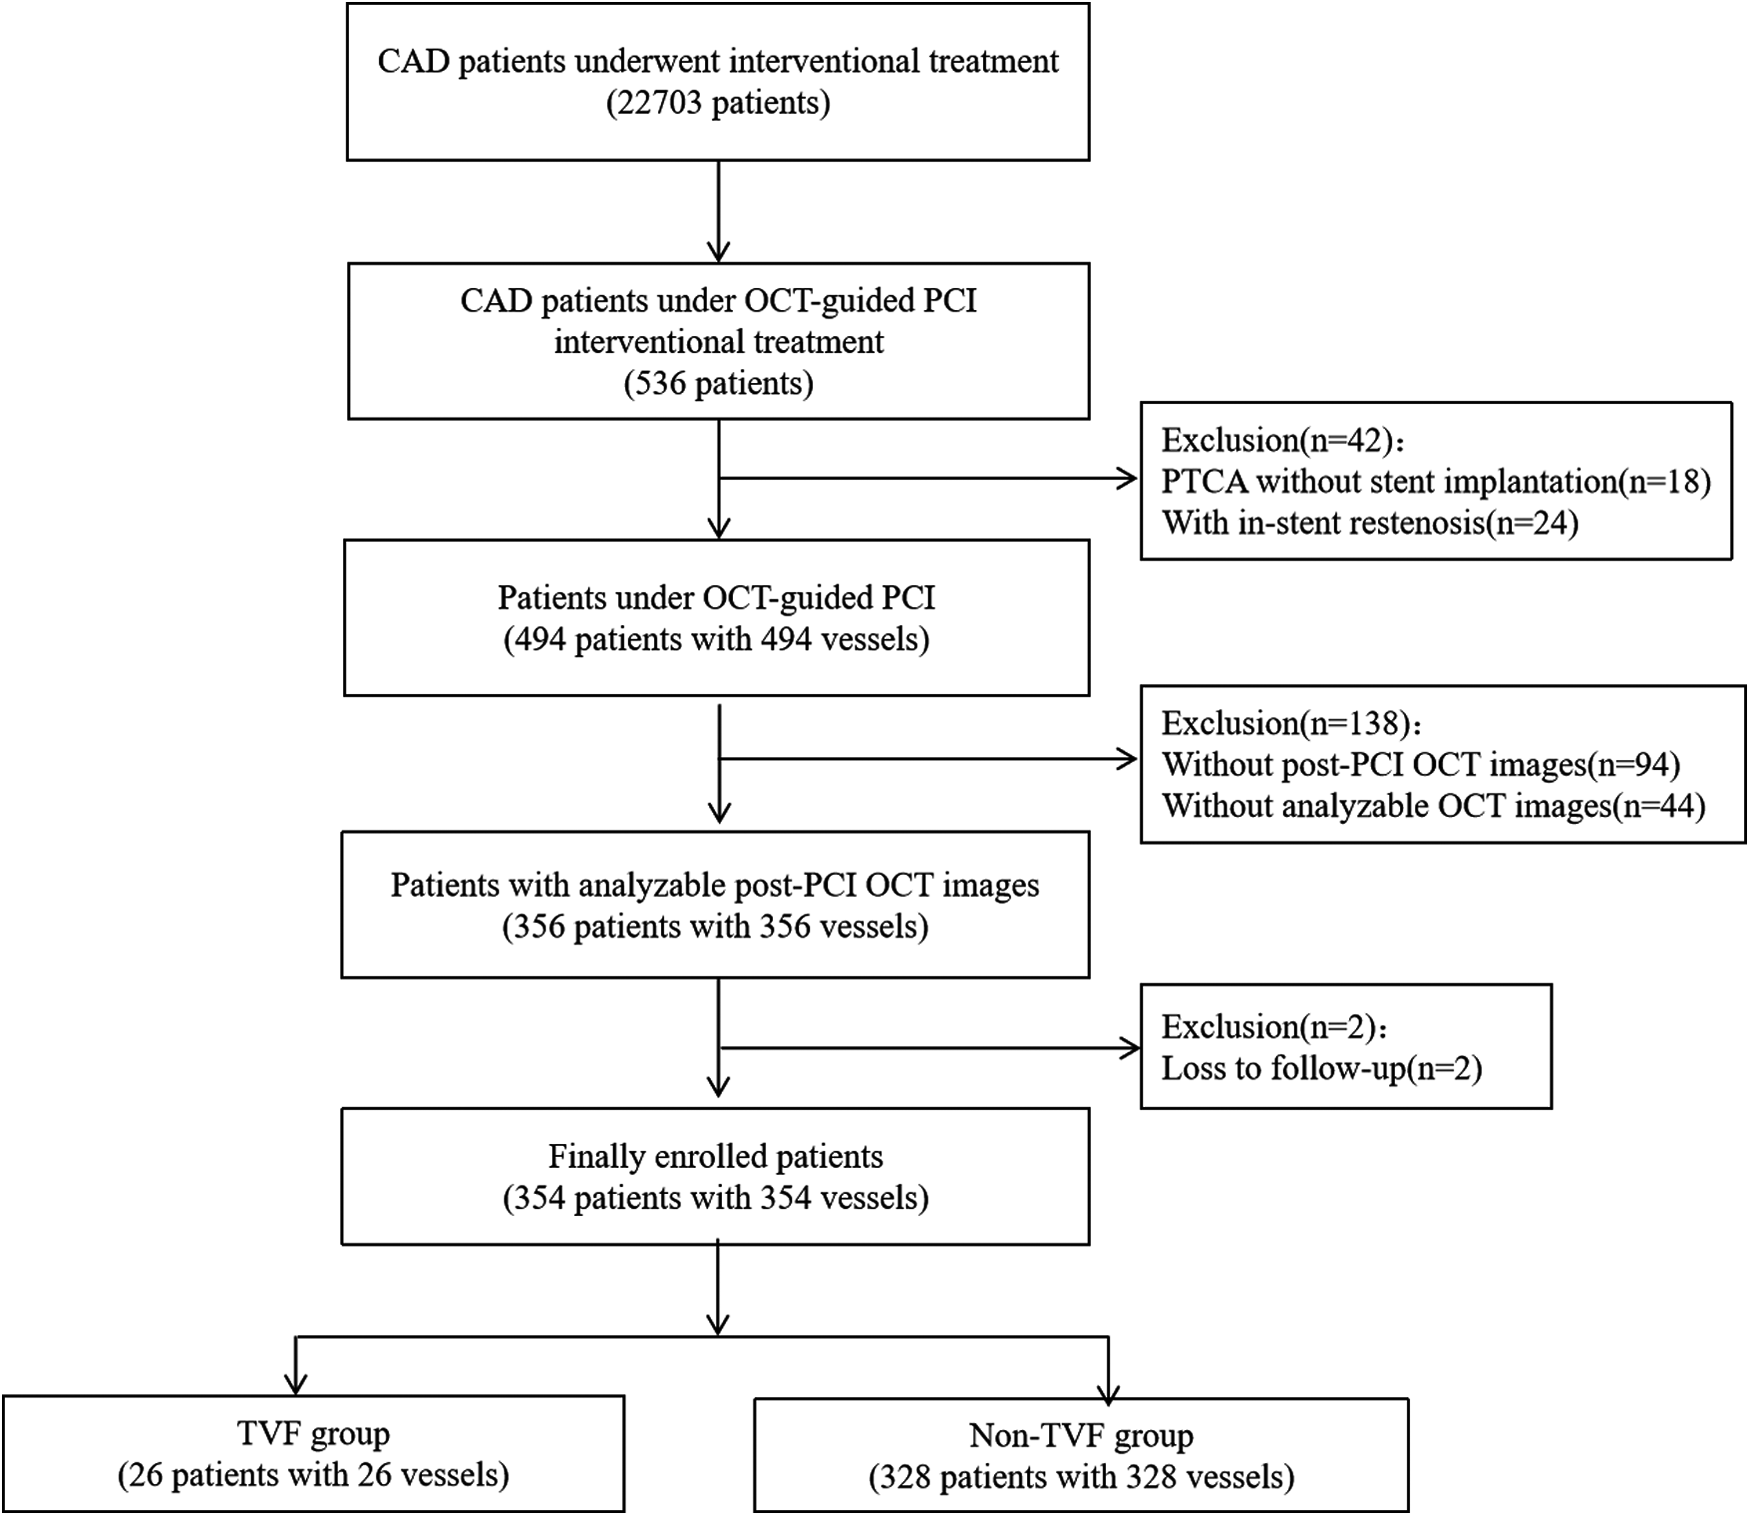
Patient flow diagram.
Table 1
| Overall (n = 354) |
TVF (n = 26) |
non-TVF (n = 328) |
P-value | |
|---|---|---|---|---|
| Male | 294 (83.1) | 21 (80.8) | 273 (83.2) | 0.786 |
| Age, year | 63 (55–71) | 66 (61–73) | 63 (55–71) | 0.091 |
| BMI, kg/m² | 23.9 (21.8–25.8) | 23.7 (20.5–25.3) | 24 (21.9–25.9) | 0.210 |
| Comorbidity | ||||
| Hypertension | 211 (59.6) | 15 (57.7) | 196 (59.8) | 0.836 |
| Diabetes mellitus | 96 (27.1) | 5 (19.2) | 91 (27.7) | 0.347 |
| Smoking | 117 (33.1) | 5 (19.2) | 112 (34.1) | 0.120 |
| Prior MI | 31 (8.8) | 2 (7.7) | 29 (8.8) | 0.842 |
| Prior PCI | 93 (26.3) | 12 (46.2) | 81 (24.7) | 0.017 |
| Prior CABG | 1 (0.3) | 0 (0) | 1 (0.3) | 1.000 |
| Clinical presentation | ||||
| Stable angina | 256 (72.3) | 14 (53.8) | 242 (73.8) | 0.025 |
| ACS | 98 (26.7) | 12 (46.2) | 86 (26.2) | |
| ACS type | 0.148 | |||
| STEMI | 42 (11.9) | 6 (23.1) | 36 (11.0) | |
| Non-STEMI | 31 (8.8) | 3 (11.5) | 28 (8.5) | |
| Unstable angina | 25 (7.1) | 3 (11.5) | 22 (6.7) | |
| Laboratory data | ||||
| LDL-C, mmol/L | 2.7 (2.1–3.3) | 2.3 (2.1–3.1) | 2.7 (2.0–3.3) | 0.485 |
| Cholesterol, mmol/L | 3.9 (3.4–5.1) | 4.1 (3.5–5.1) | 3.8 (3.4–4.6) | 0.304 |
| Creatinine, mg/dl | 81.5 (70.0–95.0) | 82.3 (73.1–101.7) | 80.9 (69.4–95.0) | 0.302 |
| HGB, g/L | 135 (121–145) | 136.5 (111.8–147) | 135 (121.5–144.5) | 0.874 |
| Pre-PCI CK-MB, U/L | 12.0 (10.0–15.9) | 14.5 (10.2–44.7) | 12.0 (10.0–15.8) | 0.075 |
| LVEF, % | 62 (57–67) | 60.5 (49.5–63.3) | 62 (58–67) | 0.101 |
| Lesion location | 0.243 | |||
| LAD | 205 (58.1) | 19 (73.1) | 186 (56.9) | |
| LCX | 35 (9.9) | 1 (3.8) | 34 (10.4) | |
| RCA | 113 (32.0) | 6 (23.1) | 107 (32.7) | |
| QCA | ||||
| Lesion length, mm | 26.7 (15.3–43.8) | 30.8 (20.2–47.6) | 26.4 (15.2–43.6) | 0.371 |
| Minimum diameter, mm | 1.6 (1.2–2.1) | 1.4 (1.1–1.6) | 1.6 (1.2–2.1) | 0.101 |
| Reference diameter, mm | 3.6 (3.3–4.0) | 3.5 (3.0–3.7) | 3.6 (3.3–4.1) | 0.234 |
| DS, % | 57.1 (44.6–63.0) | 56.5 (44.3–63.0) | 60.0 (55.4–63.7) | 0.220 |
| Multivessel disease | 223 (63.0) | 18 (69.2) | 205 (62.5) | 0.494 |
| Multiple stents | 131 (37.0) | 11 (42.3) | 120 (36.6) | 0.561 |
| Stent length, mm | 32 (23–42) | 38 (28–46) | 32 (22–41) | 0.108 |
| Pre-PCI TIMI flow | 0.436 | |||
| Grade 0 or 1 | 43 (12.1) | 5 (19.2) | 38 (11.6) | |
| Grade 2 | 11 (3.1) | 0 (0) | 11 (3.4) | |
| Grade 3 | 300 (84.7) | 21 (80.8) | 279 (85.1) | |
| Post-PCI TIMI flow | 0.927 | |||
| Grade 0 or 1 | 0 (0) | 0 (0) | 0 (0) | |
| Grade 2 | 1 (0.3) | 0 (0) | 1 (0.3) | |
| Grade 3 | 353 (99.7) | 26 (100) | 327 (99.7) | |
| Medication at discharge | ||||
| DAPT | 352 (99.4) | 25 (96.2) | 327 (99.7) | 0.337 |
| Statin | 343 (96.9) | 24 (92.3) | 319 (97.3) | 0.416 |
| Beta blocker | 282 (79.7) | 20 (76.9) | 262 (79.9) | 0.719 |
Patient baseline, angiographic, and procedural characteristics.
Values are expressed as median (IQR) or n (%).
ACS: acute coronary syndrome; BMI, body mass index; CABG, coronary artery bypass grafting; CK-MB, creatine kinase-myocardial band; DAPT, dual antiplatelet therapy; DS, diameter stenosis; HGB, haemoglobin; LAD, left anterior descending artery; LCX, left circumflex artery; LDL-C, low-density lipoprotein cholesterol; LVEF, left ventricular ejection fraction; MI, myocardial infarction; RCA, right coronary artery; STEMI, ST-segment elevation myocardial infarction; TVF, target vessel failure.
Table 2
| Overall (n = 354) |
TVF (n = 26) |
non-TVF (n = 328) |
95% CI | P-value | |
|---|---|---|---|---|---|
| Target vessel | |||||
| Post-PCI OFR | 0.92 (0.87–0.96) | 0.89 (0.84–0.91) | 0.93 (0.88–0.96) | −0.07, −0.02 | 0.001 |
| Length of analyzable images, mm | 53.4 (46.4–60.5) | 53.8 (47.2–60.7) | 53.1 (46.2–60.6) | −3.40, 2.60 | 0.615 |
| Average lumen diameter, mm | 3.1 (2.7–3.5) | 2.9 (2.5–3.3) | 3.1 (2.8–3.5) | −0.47, 0.34 | 0.074 |
| Average lumen area, mm² | 7.75 (6.21–9.35) | 6.33 (5.33–8.42) | 7.83 (6.29–9.37) | −2.39, 0.06 | 0.013 |
| Proximal reference minimum lumen area, mm2 | 7.1 (5.3–9.5) | 7.1 (5.4–9.2) | 7.1 (5.3–9.6) | −2.19, 2.39 | 0.959 |
| Distal reference minimum lumen area, mm2 | 4.6 (3.2–6.4) | 3.9 (3.4–4.1) | 4.7 (3.3–6.4) | −1.40, −0.63 | 0.089 |
| MLA, mm² | 5.3 (4.2–6.9) | 4.0 (3.5–5.2) | 5.5 (4.4–7.0) | −2.06, −0.57 | 0.001 |
| Stented segment | |||||
| MSA, mm² | 5.2 (4.3–6.6) | 4.4 (3.7–5.6) | 5.4 (4.4–6.6) | −1.69, −0.32 | 0.009 |
| Mean stent area, mm² | 8.2 (6.6–9.7) | 7.8 (6.0–9.2) | 8.2 (6.7–9.8) | −1.90, 0.34 | 0.128 |
| Minimal expansion, % | 58.0 (50.0–67.3) | 58.5 (44.5–66.0) | 58.0 (50.0–68.0) | −8.0, 4.0 | 0.415 |
| Irregular protrusion | 185 (52.3) | 18 (69.2) | 167 (50.9) | 0.92, 5.13 | 0.072 |
| Malapposition | 211 (59.6) | 16 (61.5) | 195 (59.5) | 0.48, 2.48 | 0.835 |
| Non-stented segment | |||||
| Plaque detection | |||||
| Plaque volume, mm³ | 275.0 (221.5–329.4) | 257.2 (201.6–302.3) | 276.9 (223.7–334.0) | −52.35, 23.76 | 0.357 |
| Fibrous tissue volume, mm³ | 186.7 (146.8–229.6) | 177.9 (135.1–231.4) | 188.1 (148.1–229.4) | −44.70, 15.19 | 0.452 |
| Lipid plaque volume, mm³ | 47.6 (26.0–68.4) | 40.6 (30.2–65.9) | 48.1 (25.9–68.4) | −13.09, 8.96 | 0.944 |
| Calcification volume, mm³ | 3.4 (1.2–8.6) | 3.7 (1.6–6.6) | 3.4 (1.1–8.9) | −1.36, 2.31 | 0.803 |
| Crystal volume, mm³ | 0.04 (0.01–0.10) | 0.05 (0.02–0.12) | 0.03 (0.01–0.09) | −0.01, 0.08 | 0.363 |
| Macrophage volume, mm³ | 0.23 (0.07–0.69) | 0.24 (0.06–0.43) | 0.23 (0.07–0.74) | −0.16, 0.14 | 0.315 |
| Lipid | |||||
| Max area, mm² | 4.3 (3.4–5.4) | 3.8 (3.3–5.4) | 4.4 (3.4–5.4) | −0.95, 0.09 | 0.287 |
| Max volume, mm³ | 18.7 (8.2–33.5) | 15.0 (10.4–26.8) | 19.0 (8.1–33.8) | −9.03, 3.60 | 0.621 |
| Max angle, ° | 223.2 (166.9–273.4) | 233.3 (193.1–286.6) | 221.2 (165.4–271.5) | −25.10, 46.30 | 0.360 |
| Calcification | |||||
| Max area, mm² | 1.3 (0.8–2.1) | 1.4 (0.9–2.4) | 1.3 (0.8–2.0) | −0.27, 0.61 | 0.400 |
| Max volume, mm³ | 0.9 (0.3–2.6) | 0.9 (0.3–2.4) | 0.9 (0.3–2.7) | −0.42, 0.80 | 0.910 |
| Max angle, ° | 86.5 (58.3–112.6) | 93.5 (65.4–111.1) | 85.5 (58.3–112.6) | −9.05, 18.10 | 0.552 |
| Max thickness, mm | 0.9 (0.7–1.1) | 1.0 (0.8–1.2) | 0.9 (0.7–1.1) | −0.05, 0.24 | 0.209 |
| Qualitative findings | |||||
| TCFA | 188 (53.1) | 19 (73.1) | 169 (51.5) | 1.05, 6.24 | 0.034 |
| Large stent edge dissection | 35 (9.9) | 7 (26.9) | 28 (8.5) | 1.53, 10.20 | 0.002 |
Post-PCI OFR and OCT findings.
Values are median (IQR) or n (%).
CI, confidence interval; MLA, minimum lumen area; MSA, minimum stent area; Post-PCI OFR, percutaneous coronary stent implantation optical flow ratio; TCFA, thin-cap fibroatheroma; TVF, target vessel failure.
3.1. Outcomes
All enrolled patients completed the follow-up for at least 1 year. During a median follow-up of 484 (IQR: 400–774) days, TVF occurred in 26 (7.3%) patients. Specifically, the following were observed: cardiac death (4 patients), TVMI (12 patients), and TVR (10 patients).
3.2. Comparison of TVF and non-TVF groups
The incidence of previous PCI and ACS was significantly higher in the TVF group compared to the non-TVF group (Table 1).
Additionally, the TVF group exhibited significantly lower post-PCI OFR compared to the non-TVF group [0.89 (IQR: 0.84–0.91) vs. 0.93 (IQR: 0.88–0.96); P = 0.001] (Table 2).
These findings are presented in Table 2, which displays the results obtained from post-PCI OCT. In terms of the target vessel, the TVF group demonstrated significantly smaller average lumen area (P = 0.013), minimum lumen area (MLA) (P = 0.001), and minimum stent area (MSA) (P = 0.009) compared to the non-TVF group. Furthermore, the TVF group exhibited a higher prevalence of thin-cap fibroatheroma (TCFA) (P = 0.034) and large stent edge dissection (P = 0.002) compared to the non-TVF group.
3.3. Factors correlated with TVF
The findings of the univariable and multivariable Cox regression analyses pertaining to TVF are concisely presented in Table 3. The multivariable model demonstrated that previous PCI, ACS, post-PCI OFR, large stent edge dissection, and TCFA in the non-stented segment exhibited independent associations with TVF (Table 3).
Table 3
| Univariable regression | Multivariable regression | |||||
|---|---|---|---|---|---|---|
| HR | 95% CI | P-value | HR | 95% CI | P-value | |
| Traditional cardiovascular risk factors | ||||||
| Male | 1.17 | 0.44–3.11 | 0.748 | |||
| Age, year | 1.04 | 1.00–1.08 | 0.053 | |||
| BMI, kg/m² | 0.94 | 0.82–1.06 | 0.307 | |||
| Hypertension | 1.08 | 0.49–2.34 | 0.852 | |||
| Diabetes mellitus | 0.64 | 0.24–1.70 | 0.371 | |||
| Smoking | 0.47 | 0.18–1.25 | 0.131 | |||
| Prior MI | 0.82 | 0.19–3.46 | 0.785 | |||
| Prior PCI | 2.51 | 1.16–5.43 | 0.019 | 3.85 | 1.70–8.73 | 0.001 |
| ACS | 2.19 | 1.01–4.77 | 0.048 | 2.60 | 1.23–5.96 | 0.018 |
| Target vessel | ||||||
| Post-PCI OFR(per 0.1 increase) | 0.54 | 0.38–0.79 | 0.001 | 0.60 | 0.41–0.89 | 0.011 |
| Average lumen area, mm² | 0.78 | 0.64–0.96 | 0.018 | |||
| MLA, mm² | 0.67 | 0.52–0.86 | 0.002 | |||
| Stented segment | ||||||
| MSA, mm² | 0.72 | 0.55–0.93 | 0.011 | |||
| Qualitative findings | ||||||
| TCFA | 2.48 | 1.04–5.90 | 0.040 | 2.95 | 1.19–7.35 | 0.020 |
| Large stent edge dissection | 3.91 | 1.64–9.32 | 0.002 | 3.85 | 1.51–9.84 | 0.005 |
Cox regression analyses for factors associated with TVF after PCI in patients.
ACS, acute coronary syndrome; CI, confidence interval; HR, hazard ratio; MLA, minimum lumen area; MSA, minimum stent area; Post-PCI OFR, percutaneous coronary stent implantation optical flow ratio; TCFA, thin-cap fibroatheroma.
ROC analysis revealed that the cutoff value of post-PCI OFR for the identification of patients with subsequent TVF was determined to be 0.92 (sensitivity: 60.4%; specificity: 76.9%; area under the curve: 0.701; P = 0.035) (Figure 4).
Figure 4
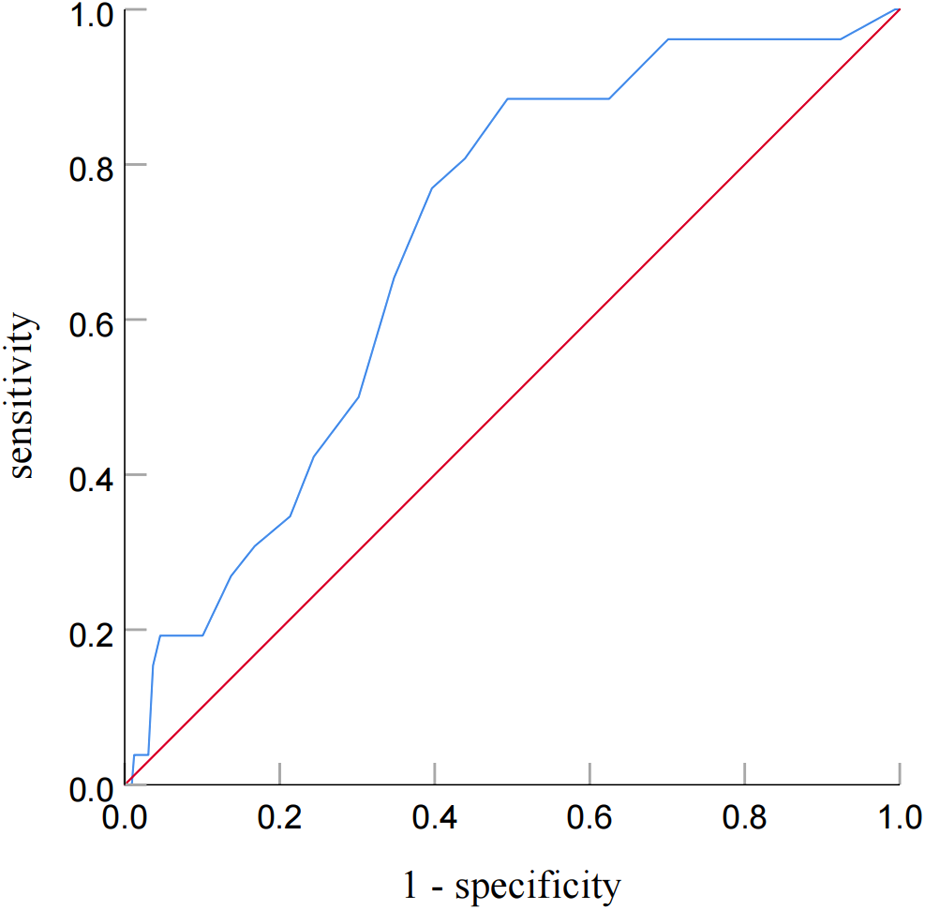
Receiver operating characteristic curve analysis for identifying patients with subsequent TVF from post-PCI OFR. Receiver-operating characteristic curve analysis showed that the cutoff value of the post-PCI OFR for identifying patients with subsequent TVF was 0.92.
Notably, the incidence of TVF was observed to be 6.6 times higher in vessels with low post-PCI OFR (≤0.92) compared to those with high post-PCI OFR (>0.92) (log-rank P < 0.001) (Figure 5A). Furthermore, it was observed that the occurrence of TVF was 3.3 times greater in vessels exhibiting large stent edge dissection compared to vessels without such dissection (log-rank P = 0.001) (Figure 5B).
Figure 5
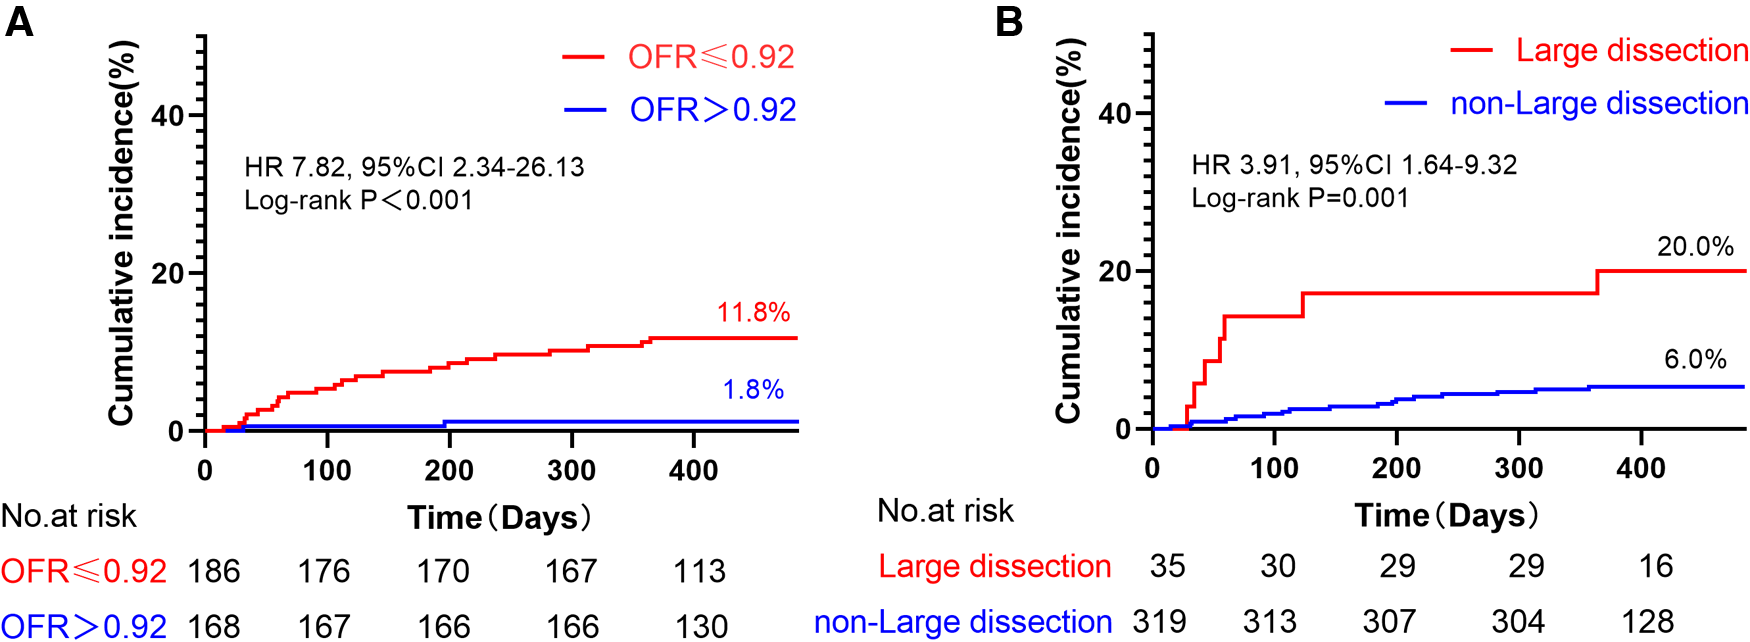
Kaplan–meier curves of TVF according to post-PCI OFR and large stent edge dissection. (A) The incidence of TVF was 6.6 times higher in vessels with low post-PCI OFR (≤0.92) than in those with high post-PCI OFR (>0.92). (B) The incidence of TVF 3.3 times higher in vessels with large stent edge dissection than in those without large stent edge dissection. It is noteworthy that these results were not adjusted for HRs.
3.4. The incremental value of OFR in identifying patients with TVF after PCI
As shown in Figure 6, two models were compared. Model 1 was based on baseline characteristics and OCT results (large stent edge dissection and TCFA) following PCI, while Model 2 incorporated OFR after PCI into Model 1. The baseline characteristics included traditional cardiovascular risk factors (age, male, BMI, hypertension, diabetes mellitus, smoking, and prior MI), as well as baseline variables with statistical differences (prior PCI and ACS). The results demonstrated that Model 2 had superior ability in distinguishing subsequent TVF in CAD patients after PCI than Model 1 (0.838 vs. 0.796; P = 0.028). This indicated that the combination of OFR after PCI with OCT results and baseline characteristics significantly improved the ability to distinguish subsequent TVF in CAD patients.
Figure 6
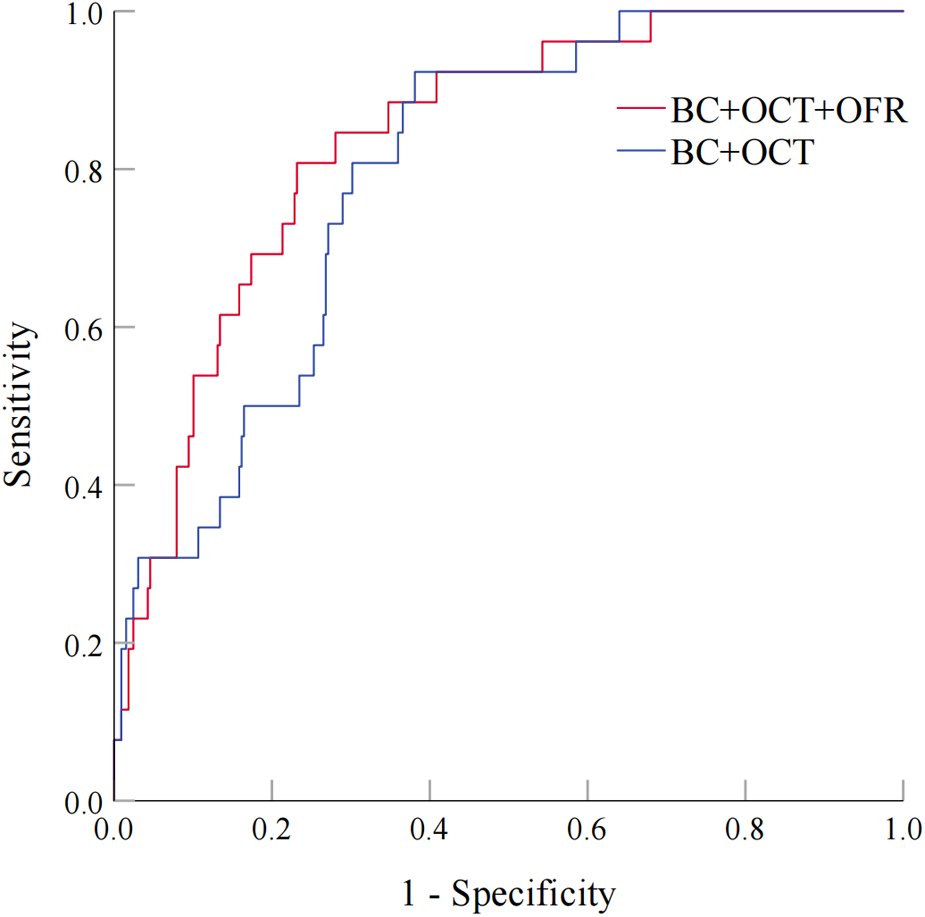
Evaluation of Two models for predicting TVF in CAD patients after PCI. Figure 6 compares two models. Model 1 uses baseline characteristics and post-PCI OCT findings, while Model 2 adds post-PCI OFR to Model 1. The comparison shows that Model 2 is better at predicting TVF in CAD patients after PCI (0.838 vs 0.796; P = 0.028), indicating that combining OFR with OCT and baseline characteristics improves prediction. BC, baseline characteristics; OCT, optical coherence tomography; OFR: optical flow ratio. Abbreviations as in Figure 6.
3.5. Comparison of post-PCI OFR and plaque characteristics between patients with stable angina and ACS
In Table 4, we compared the post-PCI OFR and plaque detection results of patients with stable angina and ACS. There was no statistically significant difference in post-PCI OFR between patients with stable angina and ACS (P = 0.316). In terms of plaque detection, there was a significant difference in lipid plaque volume between the two groups of patients (P = 0.047), with a higher median lipid plaque volume in ACS patients. In addition, there was a significant difference in crystal volume between the two groups of patients (P = 0.001), with a higher median crystal volume in ACS patients. No significant differences were observed in other plaque detection parameters between the two groups.
Table 4
| Overall (n = 354) |
Stable angina (n = 256) |
ACS (n = 98) |
P-value | |
|---|---|---|---|---|
| Target vessel | ||||
| Post-PCI OFR | 0.92 (0.87–0.96) | 0.92 (0.87–0.96) | 0.92 (0.87–0.96) | 0.316 |
| Plaque detection | ||||
| Plaque volume, mm³ | 275.0 (221.5–329.4) | 271.2 (218.7–323.8) | 282.1 (224.6–337.6) | 0.255 |
| Fibrous tissue volume, mm³ | 186.7 (146.8–229.6) | 187.6 (148.1–229.4) | 184.7 (138.2–230.4) | 0.856 |
| Lipid plaque volume, mm³ | 47.6 (26.0–68.4) | 47.3 (25.4–64.7) | 53.6 (28.2–86.4) | 0.047 |
| Calcification volume, mm³ | 3.4 (1.2–8.6) | 3.5 (1.2–8.2) | 3.1 (1.1–9.3) | 0.636 |
| Crystal volume, mm³ | 0.04 (0.01–0.10) | 0.03 (0.01–0.09) | 0.05 (0.02–0.16) | 0.001 |
| Macrophage volume, mm³ | 0.23 (0.07–0.69) | 0.21 (0.06–0.68) | 0.32 (0.07–0.83) | 0.354 |
| Lipid | ||||
| Max area, mm² | 4.3 (3.4–5.4) | 4.2 (3.3–5.2) | 4.6 (3.5–5.8) | 0.050 |
| Max volume, mm³ | 18.7 (8.2–33.5) | 18.1 (8.2–31.4) | 20.4 (8.1–41.0) | 0.226 |
| Max angle, ° | 223.2 (166.9–273.4) | 220.2 (165.4–271.0) | 228.3 (178.5–228.3) | 0.204 |
| Calcification | ||||
| Max area, mm² | 1.3 (0.8–2.1) | 1.3 (0.8–2.0) | 1.3 (0.8–2.2) | 0.771 |
| Max volume, mm³ | 0.9 (0.3–2.6) | 0.9 (0.3–2.8) | 0.8 (0.2–2.0) | 0.228 |
| Max angle, ° | 86.5 (58.3–112.6) | 81.5 (50.8–107.1) | 88.5 (62.3–112.6) | 0.113 |
| Max thickness, mm | 0.9 (0.7–1.1) | 0.9 (0.7–1.1) | 0.9 (0.7–1.2) | 0.954 |
| Qualitative findings | ||||
| TCFA | 188 (53.1) | 131 (51.2) | 57 (58.2) | 0.238 |
Post-PCI OFR and plaque detection between stable angina and ACS patients.
ACS, acute coronary syndrome; Post-PCI OFR, percutaneous coronary stent implantation optical flow ratio; TCFA, thin-cap fibroatheroma.
3.6. Results of inter-observer and intra-observer consistency analysis
A high level of agreement was demonstrated between observers in the identification of TCFA. Two weeks prior, the Kappa value for inter-observer consistency was 0.862 (P < 0.001), and after two weeks, this consistency increased to 0.930 (P < 0.001). Over a two-week interval, the intra-observer consistency for the two observers was 1.0 (P < 0.001) and 0.930 (P < 0.001), respectively.
4. Discussion
The results of this study mainly show that: (1) In an unadjusted comparison among CAD patients who underwent PCI, the TVF group exhibited a significantly lower post-PCI OFR than the non-TVF group; (2) Upon adjustment for potential confounders through Cox regression analysis, it was found that post-PCI OFR is an independent predictor of TVF in CAD patients post-PCI; (3) The cut-off value of post-PCI OFR was 0.92, and the incidence of TVF in vessels with low post-PCI OFR was 6.6 times higher than that in vessels with high post-PCI OFR. (4) Post-PCI OFR demonstrated the incremental value in identifying patients with subsequent TVF beyond baseline characteristics and morphological OCT findings. (5) Despite similar post-PCI OFR in patients with stable angina and ACS, significant differences were observed in plaque characteristics, with ACS patients showing higher lipid plaque volume and cholesterol crystal volume. As far as we know, this is the first study to report the potential clinical predictive value of post-PCI OFR for subsequent TVF in CAD patients who underwent OCT-guided PCI.
Presently, intravascular imaging investigations have elucidated the intricate mechanisms underlying adverse outcomes in PCI within stented segments, and substantial enhancements in clinical outcomes have been evidenced through the use of intravascular imaging in comparison to solely relying on angiographic guidance (27). In contrast to PCI guided solely by angiography, intracavitary image-guided PCI has demonstrated noteworthy advancements in clinical outcomes (26, 28). Nevertheless, as PCI is a localized treatment, intravascular imaging typically concentrates on the target lesion or stented segment without considering the entirety of the target vessel (1, 9). In contrast, post-PCI FFR serves as an indicator of the remaining resistance within the entire vessel after maximal microvascular vasodilation (29). This measurement not only evaluates the level of stent optimization but also considers the presence of lesions in non-stent segments, both of which can impact future prognosis (30). The OFR method, which exclusively relies on quantitative lumen data derived from conventional OCT images for the computation of virtual FFR, offers unique advantages. Importantly, OFR is not just a numerical value. Along the direction of the vascular lumen, the color changes on the OFR correspond to changes in pressure ratio. Sudden color changes indicate sudden pressure ratio changes, pointing out the vascular segments that require our attention and may need further intervention to improve the final OFR. Unlike physiological measurements and OCT alone, it effectively mitigates superfluous congestion, providing a more comprehensive assessment of ischemia in patients with CAD subsequent to PCI (25, 31, 32).
We found that post-PCI OFR was a powerful independent factor associated with TVF. The possible reason is that stent underexpansion and residual lesions are significantly correlated with pressure drop, both of which may result in low physiological function value and lead to poor prognosis (9, 33). Therefore, in conjunction with luminal imaging-guided stent optimization, post-PCI OFR can provide insight into the potential benefit of additional PCI strategies in improving clinical outcomes (34, 35). Previous research has indicated a direct correlation between low post-PCI FFR and future adverse cardiac events (34). The specific cutoff value for post-PCI FFR may vary depending on factors such as the target lesion, vessel, and characteristics of the patients included in each study. Multiple investigations have demonstrated that the cutoff value for post-PCI FFR ranges from 0.89 to 0.91 for patients with coronary artery disease, encompassing both acute coronary syndrome and stable angina (2, 4, 33, 36). We found that the optimal cutoff value of post-PCI OFR was 0.92, which was slightly different from previous studies, and the reason might be related to the selection of patient population, number of cases and single center in this study.
Furthermore, this study demonstrated that incorporating post-PCI OFR into a model based on OCT findings and baseline characteristics (Model 2) significantly improved the ability to predict subsequent TVF in CAD patients compared to the model without post-PCI OFR (Model 1) (0.838 vs. 0.796; P = 0.028). These findings were consistent with the results of Shunsuke et al. (11).
In addition, this study shows that large stent edge dissection and TCFA in non-stented segment are independently associated with TVF in CAD patients after PCI. OCT can provide detailed information about high-risk plaques and accurately identify stent edge dissection (37, 38). In the TVF group, there is a high incidence of large stent edge dissections (26%) without further treatment. The possible reasons for this are that some surgeons believe that stent edge dissection does not require intervention with good flow on angiography, and previous studies support this view, which found no significant prognostic difference in stent edge dissection (38). But this study discovered that large stent edge dissection (length >3 mm or radian >60° or involving the media) is an independent related factor for TVF after PCI. The possible reason is that our study included large stent edge dissection as a research factor rather than with or without stent edge dissection. Large stent edge dissection is more likely to contribute to acute thrombotic events and affect blood flow, which is associated with poor prognosis (3, 27, 38). Our result is consistent with other studies reporting that severe stent edge dissection is associated with poor prognosis (38, 39). The result suggests that we need to pay more attention to large stent edge dissection, which may require further intervention.
Recent research findings indicate that TCFA serves as a strong predictor of plaque rupture, which is closely linked to significant adverse cardiovascular events (40). Furthermore, the outcomes of the current study demonstrate that TCFA in the non-stented segment is independently associated with TVF, aligning with previous reports (37, 41). The study cohort demonstrated a significant prevalence of TCFA, accounting for 53% of the entire cohort. However, in high-risk cohorts like the COMBINE OCT-FFR trial (41), only 25% of patients exhibited TCFA. This discrepancy may be attributed to the implementation of automated plaque detection, which enhances detection sensitivity and reduces assessment subjectivity, as well as the heightened risk profile of CAD patients with stents.
Our study findings reveal that while the post-PCI OFR is similar in patients with stable angina and ACS, their plaque morphology shows significant differences. Particularly, ACS patients demonstrated higher values in lipid plaque volume and cholesterol crystal volume, which might suggest that plaques in ACS patients tend to have a higher content of lipids and cholesterol crystals. These findings have important implications for treatment strategies and prognosis. Firstly, plaques rich in lipids are more prone to rupture, potentially leading to acute thrombotic events, which is of significant importance for risk assessment and treatment choices in ACS patients (12). Secondly, plaques rich in cholesterol crystals may be associated with inflammation, making them more prone to instability, which may require more intense anti-inflammatory treatment and closer monitoring (42). These differences underscore the need to consider not only the disease type but also the plaque morphology when treating patients with coronary artery disease. For plaques rich in lipids and cholesterol crystals, more aggressive lipid-lowering therapy may be needed, such as the use of drugs that lower low-density lipoprotein cholesterol, like proprotein convertase subtilisin/kexin type 9 inhibitors, as well as drugs that enhance plaque stability (43, 44).
Limitations of this study: First, because this is a retrospective observational study at a single center, there is inevitably selective bias, the relevant conclusions should be taken with caution and need to be further confirmed by a prospective multicenter randomized controlled trial. Second, due to the limited of OCT catheter pullback distance, not all lesions were included, which may lead to a certain deviation of the results. Third, one of the limitations of this study is that it primarily focuses on the evaluation of the main coronary arteries, with relatively limited assessment of the branch vessels. Further improvement is needed in prospective studies to enhance the evaluation of branch vessels. Fifth, our study did not delineate the components of proximal and distal plaques Fourth, a notable limitation is the non-routine use of Troponin T (TnT), a more sensitive and specific marker for MI, compared to the primarily used CK-MB. separately. We acknowledge that the small sample size of our study could lead to an overfitting issue in variable analysis, potentially resulting in decreased statistical power. Despite this, we recognize the significance of this aspect and pledge to incorporate it as much as possible in our future research. Sixth, because of the small sample size of non-ACS patients and the fact that the relevant studies on FFR did not perform a classificcation study for such patients (2, 4, 33, 35), we did not perform a classified analysis in this study, and we will perform analyzes in the future.
5. Conclusion
The presence of post-PCI OFR serves as an independent determinant of risk for TVF in individuals with CAD after PCI. Incorporating post-PCI OFR measurements alongside baseline characteristics and post-PCI OCT outcomes substantially enhances the capacity to differentiate the subsequent manifestation of TVF in patients with CAD after PCI. However, given the relatively low number of events in our study, these results should be considered hypothesis-generating and need to be confirmed in larger studies.
Statements
Data availability statement
The original contributions presented in the study are included in the article/Supplementary Material, further inquiries can be directed to the corresponding authors.
Ethics statement
The studies involving humans were approved by The Ethics Committee of Guangdong Provincial People's Hospital. The studies were conducted in accordance with the local legislation and institutional requirements. The ethics committee/institutional review board waived the requirement of written informed consent for participation from the participants or the participants’ legal guardians/next of kin because Research using medical records and biological specimens obtained from previous clinical diagnosis and treatment, and meeting all of the following conditions: The purpose of the research is important. The risk to the subjects from the research is no greater than minimal risk*. Waiving informed consent will not adversely affect the rights and health of the subjects. The privacy of the subjects and the protection of their personal identity information are ensured. If informed consent is required, the research cannot be conducted (refusal or disagreement from the subjects to participate in the research is not evidence that the research cannot be implemented or that informed consent can be waived). As far as possible, appropriate information should be provided to the subjects at an appropriate time after the research. Written informed consent was obtained from the individual(s) for the publication of any potentially identifiable images or data included in this article.
Author contributions
Conception and design of the study: TH, NX and MH. Data collection, and editing and revision of the manuscript: TH, QQ, MS, QJ and MH. Analysis and interpretation of the data: TH, QJ and MH. Writing and revision of the manuscript: all authors. All authors contributed to the article and approved the submitted version.
Funding
This work was supported by the 2021 National Natural Science Foundation of China Start-up Fund (General Program) of Guangdong Provincial People’s Hospital, with the grant project number 8217070758, awarded to Meiping Huang.
Acknowledgments
A special thanks to Shanghai Pulse Medical Technology Company for providing us free of charge the OctPlus software for research purposes.
Conflict of interest
The authors declare that the research was conducted in the absence of any commercial or financial relationships that could be construed as a potential conflict of interest.
Publisher’s note
All claims expressed in this article are solely those of the authors and do not necessarily represent those of their affiliated organizations, or those of the publisher, the editors and the reviewers. Any product that may be evaluated in this article, or claim that may be made by its manufacturer, is not guaranteed or endorsed by the publisher.
References
1.
Neumann FJ Sousa-Uva M Ahlsson A Alfonso F Banning AP Benedetto U et al 2018 ESC/EACTS guidelines on myocardial revascularization. Eur Heart J. (2019) 40:87–165. 10.1093/eurheartj/ehy394
2.
Collison D Didagelos M Aetesam-Ur-Rahman M Copt S McDade R McCartney P et al Post-stenting fractional flow reserve vs coronary angiography for optimization of percutaneous coronary intervention (TARGET-FFR). Eur Heart J. (2021) 42:4656–68. 10.1093/eurheartj/ehab449
3.
Räber L Mintz GS Koskinas KC Johnson TW Holm NR Onuma Y et al Clinical use of intracoronary imaging. Part 1: guidance and optimization of coronary interventions. An expert consensus document of the European association of percutaneous cardiovascular interventions. Eur Heart J. (2018) 39:3281–300. 10.1093/eurheartj/ehy285
4.
Rimac G Fearon WF De Bruyne B Ikeno F Matsuo H Piroth Z et al Clinical value of post-percutaneous coronary intervention fractional flow reserve value: a systematic review and meta-analysis. Am Heart J. (2017) 183:1–9. 10.1016/j.ahj.2016.10.005
5.
Takahashi T Shin D Kuno T Lee JM Latib A Fearon WF et al Diagnostic performance of fractional flow reserve derived from coronary angiography, intravascular ultrasound, and optical coherence tomography; a meta-analysis. J Cardiol. (2022) 80:1–8. 10.1016/j.jjcc.2022.02.015
6.
Hu MJ Tan JS Yin L Zhao YY Gao XJ Yang JG et al Clinical outcomes following hemodynamic parameter or intravascular imaging-guided percutaneous coronary intervention in the era of drug-eluting stents: an updated systematic review and Bayesian network meta-analysis of 28 randomized trials and 11,860 patients. Front Cardiovasc Med. (2022) 9:860189. 10.3389/fcvm.2022.860189
7.
Tu S Westra J Adjedj J Ding D Liang F Xu B et al Fractional flow reserve in clinical practice: from wire-based invasive measurement to image-based computation. Eur Heart J. (2020) 41:3271–9. 10.1093/eurheartj/ehz918
8.
Hu F Ding D Westra J Li Y Yu W Wang Z et al Diagnostic accuracy of optical flow ratio: an individual patient-data meta-analysis. Eurointervention. (2023) 19:e14–54. 10.4244/EIJ-D-22-01098
9.
Ding D Yu W Tauzin H De Maria GL Wu P Yang F et al Optical flow ratio for assessing stenting result and physiological significance of residual disease. Eurointervention. (2021) 17:e989–98. 10.4244/EIJ-D-21-00185
10.
Emori H Kubo T Shiono Y Ino Y Shimamura K Terada K et al Comparison of optical flow ratio and fractional flow ratio in stent-treated arteries immediately after percutaneous coronary intervention. Circ J. (2020) 84:2253–8. 10.1253/circj.CJ-20-0661
11.
Kakizaki S Otake H Seike F Kawamori H Toba T Nakano S et al Optical coherence tomography fractional flow reserve and cardiovascular outcomes in patients with acute coronary syndrome. JACC Cardiovasc Interv. (2022) 15:2035–48. 10.1016/j.jcin.2022.08.010
12.
Abdelwahed YS Nelles G Frick C Seppelt C Meteva D Stahli BE et al Coexistence of calcified- and lipid-containing plaque components and their association with incidental rupture points in acute coronary syndrome-causing culprit lesions: results from the prospective OPTICO-ACS study. Eur Heart J Cardiovasc Imaging. (2022) 23:1598–605. 10.1093/ehjci/jeab247
13.
Kubo T Ino Y Mintz GS Shiono Y Shimamura K Takahata M et al Optical coherence tomography detection of vulnerable plaques at high risk of developing acute coronary syndrome. Eur Heart J Cardiovasc Imaging. (2021) 22:1376–84. 10.1093/ehjci/jeab028
14.
Okamoto H Kume T Yamada R Koyama T Tamada T Imai K et al Prevalence and clinical significance of layered plaque in patients with stable angina pectoris—evaluation with histopathology and optical coherence tomography. Circ J. (2019) 83:2452–9. 10.1253/circj.CJ-19-0640
15.
Lee T Murai T Yonetsu T Suzuki A Hishikari K Kanaji Y et al Relationship between subclinical cardiac troponin I elevation and culprit lesion characteristics assessed by optical coherence tomography in patients undergoing elective percutaneous coronary intervention. Circ Cardiovasc Interv. (2015) 8(4):e001727. 10.1161/CIRCINTERVENTIONS.114.001727
16.
Souteyrand G Amabile N Mangin L Chabin X Meneveau N Cayla G et al Mechanisms of stent thrombosis analysed by optical coherence tomography: insights from the national pesto French registry. Eur Heart J. (2016) 37:1208–16. 10.1093/eurheartj/ehv711
17.
Kyodo A Soeda T Okamura A Iwai S Sakagami A Nogi K et al Clinical impact of irregular protrusion angle after coronary stenting at culprit lesions with ST-elevation myocardial infarction—an intravascular optical coherence tomography study. Circ Rep. (2021) 3:431–9. 10.1253/circrep.CR-21-0071
18.
Bryniarski KL Tahk SJ Choi SY Soeda T Higuma T Yamamoto E et al Clinical, angiographic, IVUS, and OCT predictors for irregular protrusion after coronary stenting. Eurointervention. (2017) 12:e2204–11. 10.4244/EIJ-D-16-00679
19.
Tian J Dauerman H Toma C Samady H Itoh T Kuramitsu S et al Prevalence and characteristics of TCFA and degree of coronary artery stenosis: an OCT, IVUS, and angiographic study. J Am Coll Cardiol. (2014) 64:672–80. 10.1016/j.jacc.2014.05.052
20.
Hong H Jia H Zeng M Gutiérrez-Chico JL Wang Y Zeng X et al Risk stratification in acute coronary syndrome by comprehensive morphofunctional assessment with optical coherence tomography. JACC Asia. (2022) 2:460–72. 10.1016/j.jacasi.2022.03.004
21.
Di Vito L Agozzino M Marco V Ricciardi A Concardi M Romagnoli E et al Identification and quantification of macrophage presence in coronary atherosclerotic plaques by optical coherence tomography. Eur Heart J Cardiovasc Imaging. (2015) 16:807–13. 10.1093/ehjci/jeu307
22.
Tu S Echavarria-Pinto M von Birgelen C Holm NR Pyxaras SA Kumsars I et al Fractional flow reserve and coronary bifurcation anatomy: a novel quantitative model to assess and report the stenosis severity of bifurcation lesions. JACC Cardiovasc Interv. (2015) 8:564–74. 10.1016/j.jcin.2014.12.232
23.
Karanasos A Tu S van Ditzhuijzen NS Ligthart JM Witberg K Van Mieghem N et al A novel method to assess coronary artery bifurcations by OCT: cut-plane analysis for side-branch ostial assessment from a main-vessel pullback. Eur Heart J Cardiovasc Imaging. (2015) 16:177–89. 10.1093/ehjci/jeu176
24.
Chu M Jia H Gutierrez-Chico JL Maehara A Ali ZA Zeng X et al Artificial intelligence and optical coherence tomography for the automatic characterisation of human atherosclerotic plaques. Eurointervention. (2021) 17:41–50. 10.4244/EIJ-D-20-01355
25.
Yu W Huang J Jia D Chen S Raffel OC Ding D et al Diagnostic accuracy of intracoronary optical coherence tomography-derived fractional flow reserve for assessment of coronary stenosis severity. Eurointervention. (2019) 15:189–97. 10.4244/EIJ-D-19-00182
26.
Gao XF Ge Z Kong XQ Kan J Han L Lu S et al 3-year outcomes of the ultimate trial comparing intravascular ultrasound versus angiography-guided drug-eluting stent implantation. JACC Cardiovasc Interv. (2021) 14:247–57. 10.1016/j.jcin.2020.10.001
27.
Prati F Romagnoli E Burzotta F Limbruno U Gatto L La Manna A et al Clinical impact of OCT findings during PCI: the CLI-OPCI II study. JACC Cardiovasc Imaging. (2015) 8:1297–305. 10.1016/j.jcmg.2015.08.013
28.
Ali ZA Maehara A Généreux P Shlofmitz RA Fabbiocchi F Nazif TM et al Optical coherence tomography compared with intravascular ultrasound and with angiography to guide coronary stent implantation (ILUMIEN III: OPTIMIZE PCI): a randomised controlled trial. Lancet. (2016) 388:2618–28. 10.1016/S0140-6736(16)31922-5
29.
van Zandvoort L Masdjedi K Neleman T Tovar FM Wilschut J den Dekker W et al Impact of intravascular ultrasound findings in patients with a post PCI fractional flow reserve ≤0.85 on 2 year clinical outcome. Int J Cardiol. (2020) 317:33–6. 10.1016/j.ijcard.2020.05.027
30.
Hakeem A Ghosh B Shah K Agarwal S Kasula S Hacioglu Y et al Incremental prognostic value of post-intervention PD/PA in patients undergoing ischemia-driven percutaneous coronary intervention. JACC Cardiovasc Interv. (2019) 12:2002–14. 10.1016/j.jcin.2019.07.026
31.
Gutiérrez-Chico JL Chen Y Yu W Ding D Huang J Huang P et al Diagnostic accuracy and reproducibility of optical flow ratio for functional evaluation of coronary stenosis in a prospective series. Cardiol J. (2020) 27:350–61. 10.5603/CJ.a2020.0071
32.
Huang J Emori H Ding D Kubo T Yu W Huang P et al Diagnostic performance of intracoronary optical coherence tomography-based versus angiography-based fractional flow reserve for the evaluation of coronary lesions. Eurointervention. (2020) 16:568–76. 10.4244/EIJ-D-19-01034
33.
Doh JH Nam CW Koo BK Lee SY Choi H Namgung J et al Clinical relevance of poststent fractional flow reserve after drug-eluting stent implantation. J Invasive Cardiol. (2015) 27:346–51. .
34.
Csanadi B Ferenci T Fulop G Piroth Z . Clinical implications of fractional flow reserve measured immediately after percutaneous coronary intervention. Cardiovasc Drugs Ther. (2023). 10.1007/s10557-023-07437-0. [Epub ahead of print].
35.
Agarwal SK Kasula S Hacioglu Y Ahmed Z Uretsky BF Hakeem A . Utilizing post-intervention fractional flow reserve to optimize acute results and the relationship to long-term outcomes. JACC Cardiovasc Interv. (2016) 9:1022–31. 10.1016/j.jcin.2016.01.046
36.
Li SJ Ge Z Kan J Zhang JJ Ye F Kwan TW et al Cutoff value and long-term prediction of clinical events by FFR measured immediately after implantation of a drug-eluting stent in patients with coronary artery disease: 1- to 3-year results from the DKCRUSH VII registry study. JACC Cardiovasc Interv. (2017) 10:986–95. 10.1016/j.jcin.2017.02.012
37.
Roleder-Dylewska M Gasior P Hommels TM Roleder T Berta B Ang HY et al Morphological characteristics of lesions with thin cap fibroatheroma-a substudy from the combine (OCT-FFR) trial. Eur Heart J Cardiovasc Imaging. (2023) 24(5):687–93. 10.1093/ehjci/jeac218
38.
Chamie D Bezerra HG Attizzani GF Yamamoto H Kanaya T Stefano GT et al Incidence, predictors, morphological characteristics, and clinical outcomes of stent edge dissections detected by optical coherence tomography. JACC Cardiovasc Interv. (2013) 6:800–13. 10.1016/j.jcin.2013.03.019
39.
Bouki KP Sakkali E Toutouzas K Vlad D Barmperis D Phychari S et al Impact of coronary artery stent edge dissections on long-term clinical outcome in patients with acute coronary syndrome: an optical coherence tomography study. Catheter Cardiovasc Interv. (2015) 86:237–46. 10.1002/ccd.25855
40.
Iannaccone M Quadri G Taha S D'Ascenzo F Montefusco A Omede P et al Prevalence and predictors of culprit plaque rupture at OCT in patients with coronary artery disease: a meta-analysis. Eur Heart J Cardiovasc Imaging. (2016) 17:1128–37. 10.1093/ehjci/jev283
41.
Kedhi E Berta B Roleder T Hermanides RS Fabris E IJsselmuiden A et al Thin-cap fibroatheroma predicts clinical events in diabetic patients with normal fractional flow reserve: the combine OCT-FFR trial. Eur Heart J. (2021) 42:4671–9. 10.1093/eurheartj/ehab433
42.
Sekimoto T Koba S Mori H Arai T Matsukawa N Sakai R et al Impact of small dense low-density lipoprotein cholesterol on cholesterol crystals in patients with acute coronary syndrome: an optical coherence tomography study. J Clin Lipidol. (2022) 16:438–46. 10.1016/j.jacl.2022.04.008
43.
Gao F Wang ZJ Ma XT Shen H Yang LX Zhou YJ . Effect of alirocumab on coronary plaque in patients with coronary artery disease assessed by optical coherence tomography. Lipids Health Dis. (2021) 20(1):106. 10.1186/s12944-021-01528-3
44.
Yano H Horinaka S Ishimitsu T . Effect of evolocumab therapy on coronary fibrous cap thickness assessed by optical coherence tomography in patients with acute coronary syndrome. J Cardiol. (2020) 75:289–95. 10.1016/j.jjcc.2019.08.002
Summary
Keywords
coronary artery disease, optical coherence tomography, optical flow ratio, percutaneous coronary stent implantation, target vessel failure
Citation
Hu T, Qiu Q, Xie N, Sun M, Jia Q and Huang M (2023) Prognostic value of optical flow ratio for cardiovascular outcomes in patients after percutaneous coronary stent implantation. Front. Cardiovasc. Med. 10:1247053. doi: 10.3389/fcvm.2023.1247053
Received
25 June 2023
Accepted
20 November 2023
Published
01 December 2023
Volume
10 - 2023
Edited by
Jelmer Westra, Aarhus University Hospital, Denmark
Reviewed by
Emil Nielsen Holck, Aarhus University Hospital, Denmark Hui Gong, Fudan University, China
Updates
Copyright
© 2023 Hu, Qiu, Xie, Sun, Jia and Huang.
This is an open-access article distributed under the terms of the Creative Commons Attribution License (CC BY). The use, distribution or reproduction in other forums is permitted, provided the original author(s) and the copyright owner(s) are credited and that the original publication in this journal is cited, in accordance with accepted academic practice. No use, distribution or reproduction is permitted which does not comply with these terms.
* Correspondence: Qianjun Jia jiaqianjun@126.com Meiping Huang huangmeiping@126.com
†These authors have contributed equally to this work
Disclaimer
All claims expressed in this article are solely those of the authors and do not necessarily represent those of their affiliated organizations, or those of the publisher, the editors and the reviewers. Any product that may be evaluated in this article or claim that may be made by its manufacturer is not guaranteed or endorsed by the publisher.