Abstract
Background:
Previous studies have shown that global constructive work (CW) and wasted work (WW) predict response to cardiac resynchronization therapy (CRT). This study evaluated the predictive value of regional CW and WW for reverse remodeling and clinical outcomes after CRT.
Methods:
We performed a prospective study involving 134 CRT candidates with left bundle branch block and left ventricular ejection fraction ≤35%. Global and regional CW and WW were calculated using pressure-strain loop analysis. CRT response was defined by reverse remodeling as a reduction of ≥15% in left ventricular end-systolic volume after six months.
Results:
At six-month follow-up, 92 (69%) patients responded to CRT. Of the regional CW and WW measures, lateral wall (LW) CW and septal WW were most strongly and significantly correlated with reverse remodeling. At multivariate analysis, LW CW and septal WW were both independent determinants of reverse remodeling. When LW CW and septal WW were included in the model, global CW and WW were not independently associated with reverse remodeling. LW CW and septal WW predicted reverse remodeling with an area under the curve (AUC) of 0.783 (95% CI: 0.700–0.866) and 0.737 (95% CI: 0.644–0.831), respectively. Using both variables increased the AUC to 0.832 (95% CI: 0.755–0.908). Both LW CW ≤878 mmHg% (HR 2.01; 95% CI: 1.07–3.79) and septal WW ≤181 mmHg% (HR 2.60; 95% CI: 1.38–4.90) were significant predictors of combined death and HF hospitalization at two-year follow-up.
Conclusion:
LW CW and septal WW before CRT are important determinants of reverse remodeling and clinical outcomes.
Introduction
Cardiac resynchronization therapy (CRT) reduces morbidity and mortality in patients with heart failure (HF) and a wide QRS complex (1). However, a significant portion of patients who receive CRT do not respond favorably to the therapy (2). Several echocardiographic measures have been suggested to predict CRT response by analyzing the timing of mechanical events (3–5). Although these time-delay parameters initially showed promise, randomized controlled trials have shown that these parameters are not reliable predictors of CRT response (6, 7). One possible explanation for these findings is that the mechanical dyssynchrony caused by primary electric dyssynchrony is the modifiable substrate for CRT (8). The problem with conventional time-delay indices of mechanical dyssynchrony is that they can also be caused by regional contractile disparities such myocardial ischemia, infarction, or scar, which are less likely to be amenable to CRT (8, 9). As an alternative, visual assessments of apical rocking, septal flash, and left bundle branch block (LBBB) contraction pattern are used to assess left ventricular (LV) mechanical dyssynchrony, potentially overcoming the limitations of previously suggested parameters (10, 11).
In a healthy heart, all LV segments contract synchronously and myocardial energy is used efficiently to eject blood into the aorta. However, when there is a delay in electrical conduction, segments that activate early and late contract at different times, leading to the wastage of myocardial energy in stretching opposing walls. Several studies have shown that non-invasive estimates of global constructive work (CW) or wasted work (WW) using pressure–strain loops predict reverse remodeling or mortality after CRT better than dyssynchrony indices do (12–15). The combined assessment of myocardial CW and WW involves evaluating the contractile reserve and wasted energy caused by LV dyssynchrony, providing a comprehensive approach to evaluate the mechanisms underlying the CRT response. However, the prognostic value of regional CW and WW in CRT candidates has rarely been defined (16). In addition, a recent study showed that the combination of work difference between the septum and lateral wall (LW) with septal viability can be used to predict CRT response (17). The study employed cardiac magnetic resonance imaging with late gadolinium enhancement to evaluate septal viability. The current study aims to assess the efficacy of combining regional CW and WW in predicting reverse remodeling and clinical outcomes of patients undergoing CRT.
Methods
Study population
This was a prospective single-center study. We assessed patients with HF and LBBB who were undergoing CRT. We excluded patients who had atrial fibrillation, severe heart valve disease, or poor apical acoustic window. All patients were receiving optimized medical therapy at the time of CRT. An ischemic etiology was defined as a history of myocardial infarction, coronary revascularization, or angiographic evidence of multi-vessel disease or single-vessel disease with >75% stenosis of the left main or proximal left anterior descending artery. The study was approved by the institutional review board and complied with the Declaration of Helsinki. All patients provided written informed consent to participate in the study.
Conventional echocardiographic analysis
All patients underwent transthoracic echocardiography using a commercially available ultrasound probe and device (M5S probe, Vivid E9, GE Healthcare, Horten, Norway) before and six months after CRT. Two dimensional and pulsed wave Doppler data were stored and analyzed offline. LV volumes and function were obtained using the modified Simpson's rule.
Speckle tracking analysis
The study used digital loops of two-dimensional LV images for offline speckle-tracking analysis with a commercially available software (EchoPAC, GE Vingmed Ultrasound, Horten, Norway). The gain settings and sector width were adjusted to optimize the image quality with frame rates of 50–90 Hz. Two-dimensional LV images were obtained at the apical four-chamber, two-chamber, and long-axis views for speckle-tracking strain analysis. To analyze LV longitudinal strain, the endocardial border was traced on an end-systolic frame, and the width of the region of interest was adjusted to include most of the LV myocardium. The software automatically tracked myocardial motion and generated six curves of segmental longitudinal strain for each apical view. Global longitudinal strain was computed as the average of peak systolic longitudinal strain of all LV segments.
Myocardial work assessment
The study utilized a vendor-specific software (EchoPAC version 202, GE Vingmed Ultrasound) to assess global and regional myocardial work. The peak LV pressure was assumed to be equivalent to the brachial systolic blood pressure, measured before the echocardiographic study. The software produced a previously validated noninvasive LV pressure curve that was adjusted based on the timing of ejection and isovolumic phases (18). These phases were defined by the timing of aortic valve and mitral valve opening and closing using spectral Doppler tracings. LV strain measured by speckle-tracking analysis and LV pressure curve were synchronized by aligning cardiac cycle phases and peak LV pressure. We quantified myocardial work by computing the rate of regional shortening via strain curve differentiation and multiplying this value by estimates of instantaneous LV pressure. Myocardial CW measurements quantified the amount of work performed during systolic shortening and the negative work performed while lengthening during isovolumic relaxation. Myocardial WW measurements quantified the amount of negative work performed while lengthening in systole and work performed while shortening in isovolumic relaxation. We computed regional CW and WW values for six regional walls (the inferior, posterior, lateral, anterior, anteroseptal, and septal walls) as the averages of the values for the basal- and mid-LV segments. We calculated the global values of CW and WW as the mean values for all LV walls.
Alternative approaches
Two experienced observers assessed the existence of septal flash, apical rocking, and LBBB contraction pattern before CRT. Septal flash was characterized as the thickening and thinning of the septum during the isovolumic contraction period, while apical rocking was described as the movement of the LV apical myocardium vertical to the LV long axis (10). The LBBB contraction pattern was recognized by analyzing longitudinal strain curves in the apical four-chamber view using three criteria (11). These criteria included: (1) early shortening of at least one basal- or mid-LV segment in the septum and early lengthening in at least one basal- or mid-LV segment in the LW; (2) early septal peak shortening occurring within the initial 70% of the ejection period; and (3) LW reaching peak shortening after aortic valve closure (11). The work difference between the LW and septum was calculated in the apical four-chamber view as the absolute difference between net myocardial work in the LW and septum (17).
Endpoints
The study's primary objective was to assess LV reverse remodeling, which was defined as a reduction in LV end-systolic volume (ESV) of ≥15% after six months of CRT. The secondary endpoint was the composite of all-cause death or hospitalization due to HF during a two-year follow-up.
Statistical analysis
Continuous data are presented as mean ± standard deviation and categorical data as number and percentage. Comparisons among continuous variables were examined using the Student's t-test. Comparisons among categorical data were performed using the chi-squared test. We evaluate the predictive performance of global and regional CW and WW for reverse remodeling by calculating receiver-operating characteristic cures and areas under the curve (AUCs). To identify CRT responders, we selected an optimal cut-off value that maximized the Youden index (sensitivity + specificity − 1). Pearson's correlation analysis was conducted to examine the association between values of CW and WW and the decrease in LV ESV following CRT. To assess the predictive value of variables for reverse remodeling, we employed logistic regression analysis. Variables that had a univariate p value of <0.05 were included in a multivariate model. We utilized a series of nested models by incorporating CW (global or lateral) and WW (global or septal) parameters. The incremental predictive ability of each model was assessed by comparing chi-square values at each stage. To determine the cumulative probabilities of all-cause death or HF hospitalization after CRT, we employed the Kaplan–Meier method, and between-group comparisons of cumulative event rates were calculated using the log-rank test. We evaluate the inter- and intra-observer agreement for CW and WW in 20 randomly chosen patients. A p-value of <0.05 was considered statistically significant. We conduced statistical analysis using a statistical package (SPSS ver. 22.0, IBM, Chicago, IL, USA).
Results
Table 1 summarizes the baseline characteristics of the 134 patients included in the study, with an average age of 69.0 ± 11.9 years, 54.5% of whom were male, and 37.3% had ischemic etiology. Five patients died before the six-month follow-up and were classified as non-responders. Of the remaining 129 patients, 92 achieved the primary endpoint of a reduction in LV ESV of ≥15%, resulting in a response rate of 69%. Responders exhibited a higher prevalence of non-ischemic etiology, less dilated LV, and a more preserved LV ejection fraction and global longitudinal strain than non-responders. Prior to CRT, there were significant differences in regional CW between responders and non-responders in the posterior, lateral, anterior, and anteroseptal walls. There were also significant differences in regional WW in the anteroseptal and septal walls. Figure 1 displays the segmental values of myocardial work, CW, and WW in a responder (Panel A) and non-responder (Panel B) before CRT and after six months. Prior to CRT, the responder had marked differences in myocardial work, CW, and WW between regional walls, with large septal WW, which was converted to large CW with CRT. On the other hand, the non-responder shows smaller variations in myocardial work, CW, and WW before CRT. After CRT, there was only a modest improvement of septal function with noticeable WW in the posterior wall (LV pacing site). Supplementary Table S1 shows the effects of CRT on LV function and myocardial work. At follow-up, responders showed a significant improvement in LV ejection fraction and global longitudinal strain, whereas non-responders did not experience any changes in these parameters. Responders also exhibited significant improvements in septal WW, global CW, global WW, and work difference after six months, whereas non-responders did not show any significant changes in LW CW, septal WW, and global WW at follow-up.
Table 1
| All patients (n = 134) | Responders (n = 92) | Non-responders (n = 42) | p-value | |
|---|---|---|---|---|
| Age, years | 69.0 ± 11.9 | 69.9 ± 11.4 | 67.1 ± 12.9 | 0.214 |
| Male | 73 (54.5) | 45 (48.9) | 28 (66.7) | 0.056 |
| Ischemic etiology | 50 (37.3) | 23 (25) | 27 (64.3) | <0.001 |
| Medications | ||||
| ACE-inhibitor/ARB | 105 (78.4) | 73 (79.3) | 32 (76.2) | 0.681 |
| ARNI | 12 (9) | 10 (10.9) | 2 (4.8) | 0.251 |
| Beta-blocker | 119 (88.8) | 84 (91.3) | 35 (83.3) | 0.175 |
| Aldosterone antagonist | 73 (54.5) | 53 (57.6) | 20 (47.6) | 0.281 |
| QRS duration, ms | 161.9 ± 19.3 | 162.2 ± 19.4 | 161.3 ± 19.3 | 0.812 |
| eGFR, ml/min/1.73 m2 | 63.3 ± 31.1 | 65.1 ± 31.3 | 59.2 ± 30.8 | 0.309 |
| QRS duration ≥150 ms | 94 (70.1) | 65 (70.7) | 29 (69) | 0.851 |
| Systolic blood pressure, mmHg | 120.1 ± 19.4 | 122.3 ± 19.4 | 115.4 ± 17.8 | 0.054 |
| Diastolic blood pressure, mmHg | 70.6 ± 12.0 | 71.2 ± 12.4 | 69.1 ± 10.8 | 0.343 |
| NYHA class | 2.8 ± 0.5 | 2.7 ± 0.5 | 2.9 ± 0.6 | 0.051 |
| Mitral regurgitation | 1.0 ± 0.7 | 1.0 ± 0.7 | 1.0 ± 0.7 | 0.787 |
| LV EDV, ml | 171.1 ± 67.6 | 160.0 ± 60.1 | 195.6 ± 76.8 | 0.004 |
| LV ESV, ml | 132.8 ± 62.6 | 122.4 ± 55.1 | 155.5 ± 72.0 | 0.004 |
| LV ejection fraction, % | 24.6 ± 7.5 | 25.6 ± 6.8 | 22.3 ± 8.5 | 0.020 |
| GLS, % | −6.5 ± 2.9 | −7.0 ± 2.9 | −5.3 ± 2.7 | 0.001 |
| Septal flash | 90 (67.2) | 75 (81.5) | 15 (35.7) | <0.001 |
| Apical rocking | 97 (72.4) | 80 (87.0) | 17 (40.5) | <0.001 |
| LBBB contraction pattern | 88 (65.7) | 75 (81.5) | 13 (31.0) | <0.001 |
| Work difference, mmHg% | 953 ± 530 | 1,115 ± 498 | 596 ± 415 | <0.001 |
| Global CW, mmHg% | 767 ± 346 | 846 ± 346 | 592 ± 277 | <0.001 |
| Global WW, mmHg% | 279 ± 148 | 301 ± 149 | 230 ± 135 | <0.001 |
| Regional CW, mmHg% | ||||
| Inferior wall | 636 ± 384 | 634 ± 383 | 642 ± 392 | 0.911 |
| Posterior wall | 1,103 ± 548 | 1,263 ± 525 | 752 ± 423 | <0.001 |
| Lateral wall | 1,026 ± 493 | 1,175 ± 467 | 701 ± 381 | <0.001 |
| Anterior wall | 853 ± 415 | 943 ± 406 | 655 ± 365 | <0.001 |
| Anteroseptum | 486 ± 337 | 527 ± 364 | 396 ± 250 | 0.017 |
| Septum | 407 ± 302 | 402 ± 324 | 418 ± 249 | 0.779 |
| Regional WW, mmHg% | ||||
| Inferior wall | 261 ± 204 | 283 ± 203 | 215 ± 201 | 0.076 |
| Posterior wall | 313 ± 204 | 332 ± 202 | 272 ± 207 | 0.115 |
| Lateral wall | 255 ± 164 | 246 ± 151 | 273 ± 190 | 0.379 |
| Anterior wall | 182 ± 136 | 175 ± 121 | 197 ± 164 | 0.383 |
| Anteroseptum | 298 ± 286 | 341 ± 306 | 204 ± 212 | 0.003 |
| Septum | 407 ± 280 | 474 ± 278 | 261 ± 226 | <0.001 |
Baseline characteristics of the entire population and based on CRT response.
ACE, angiotensin converting enzyme; ARB, angiotensin receptor blocker; ARNI, angiotensin receptor neprilysin inhibitor; CW, constructive work; EDV, end-diastolic volumn; eGFR, estimated glomerular filtration rate; ESV, end-systolic volumn; GLS, global longitudinal strain; LBBB, left bundle branch block; LV, left ventricular; NYHA, New York Heart Association; WW, wasted work.
Data are shown as n (%) or mean ± standard deviation.
Figure 1
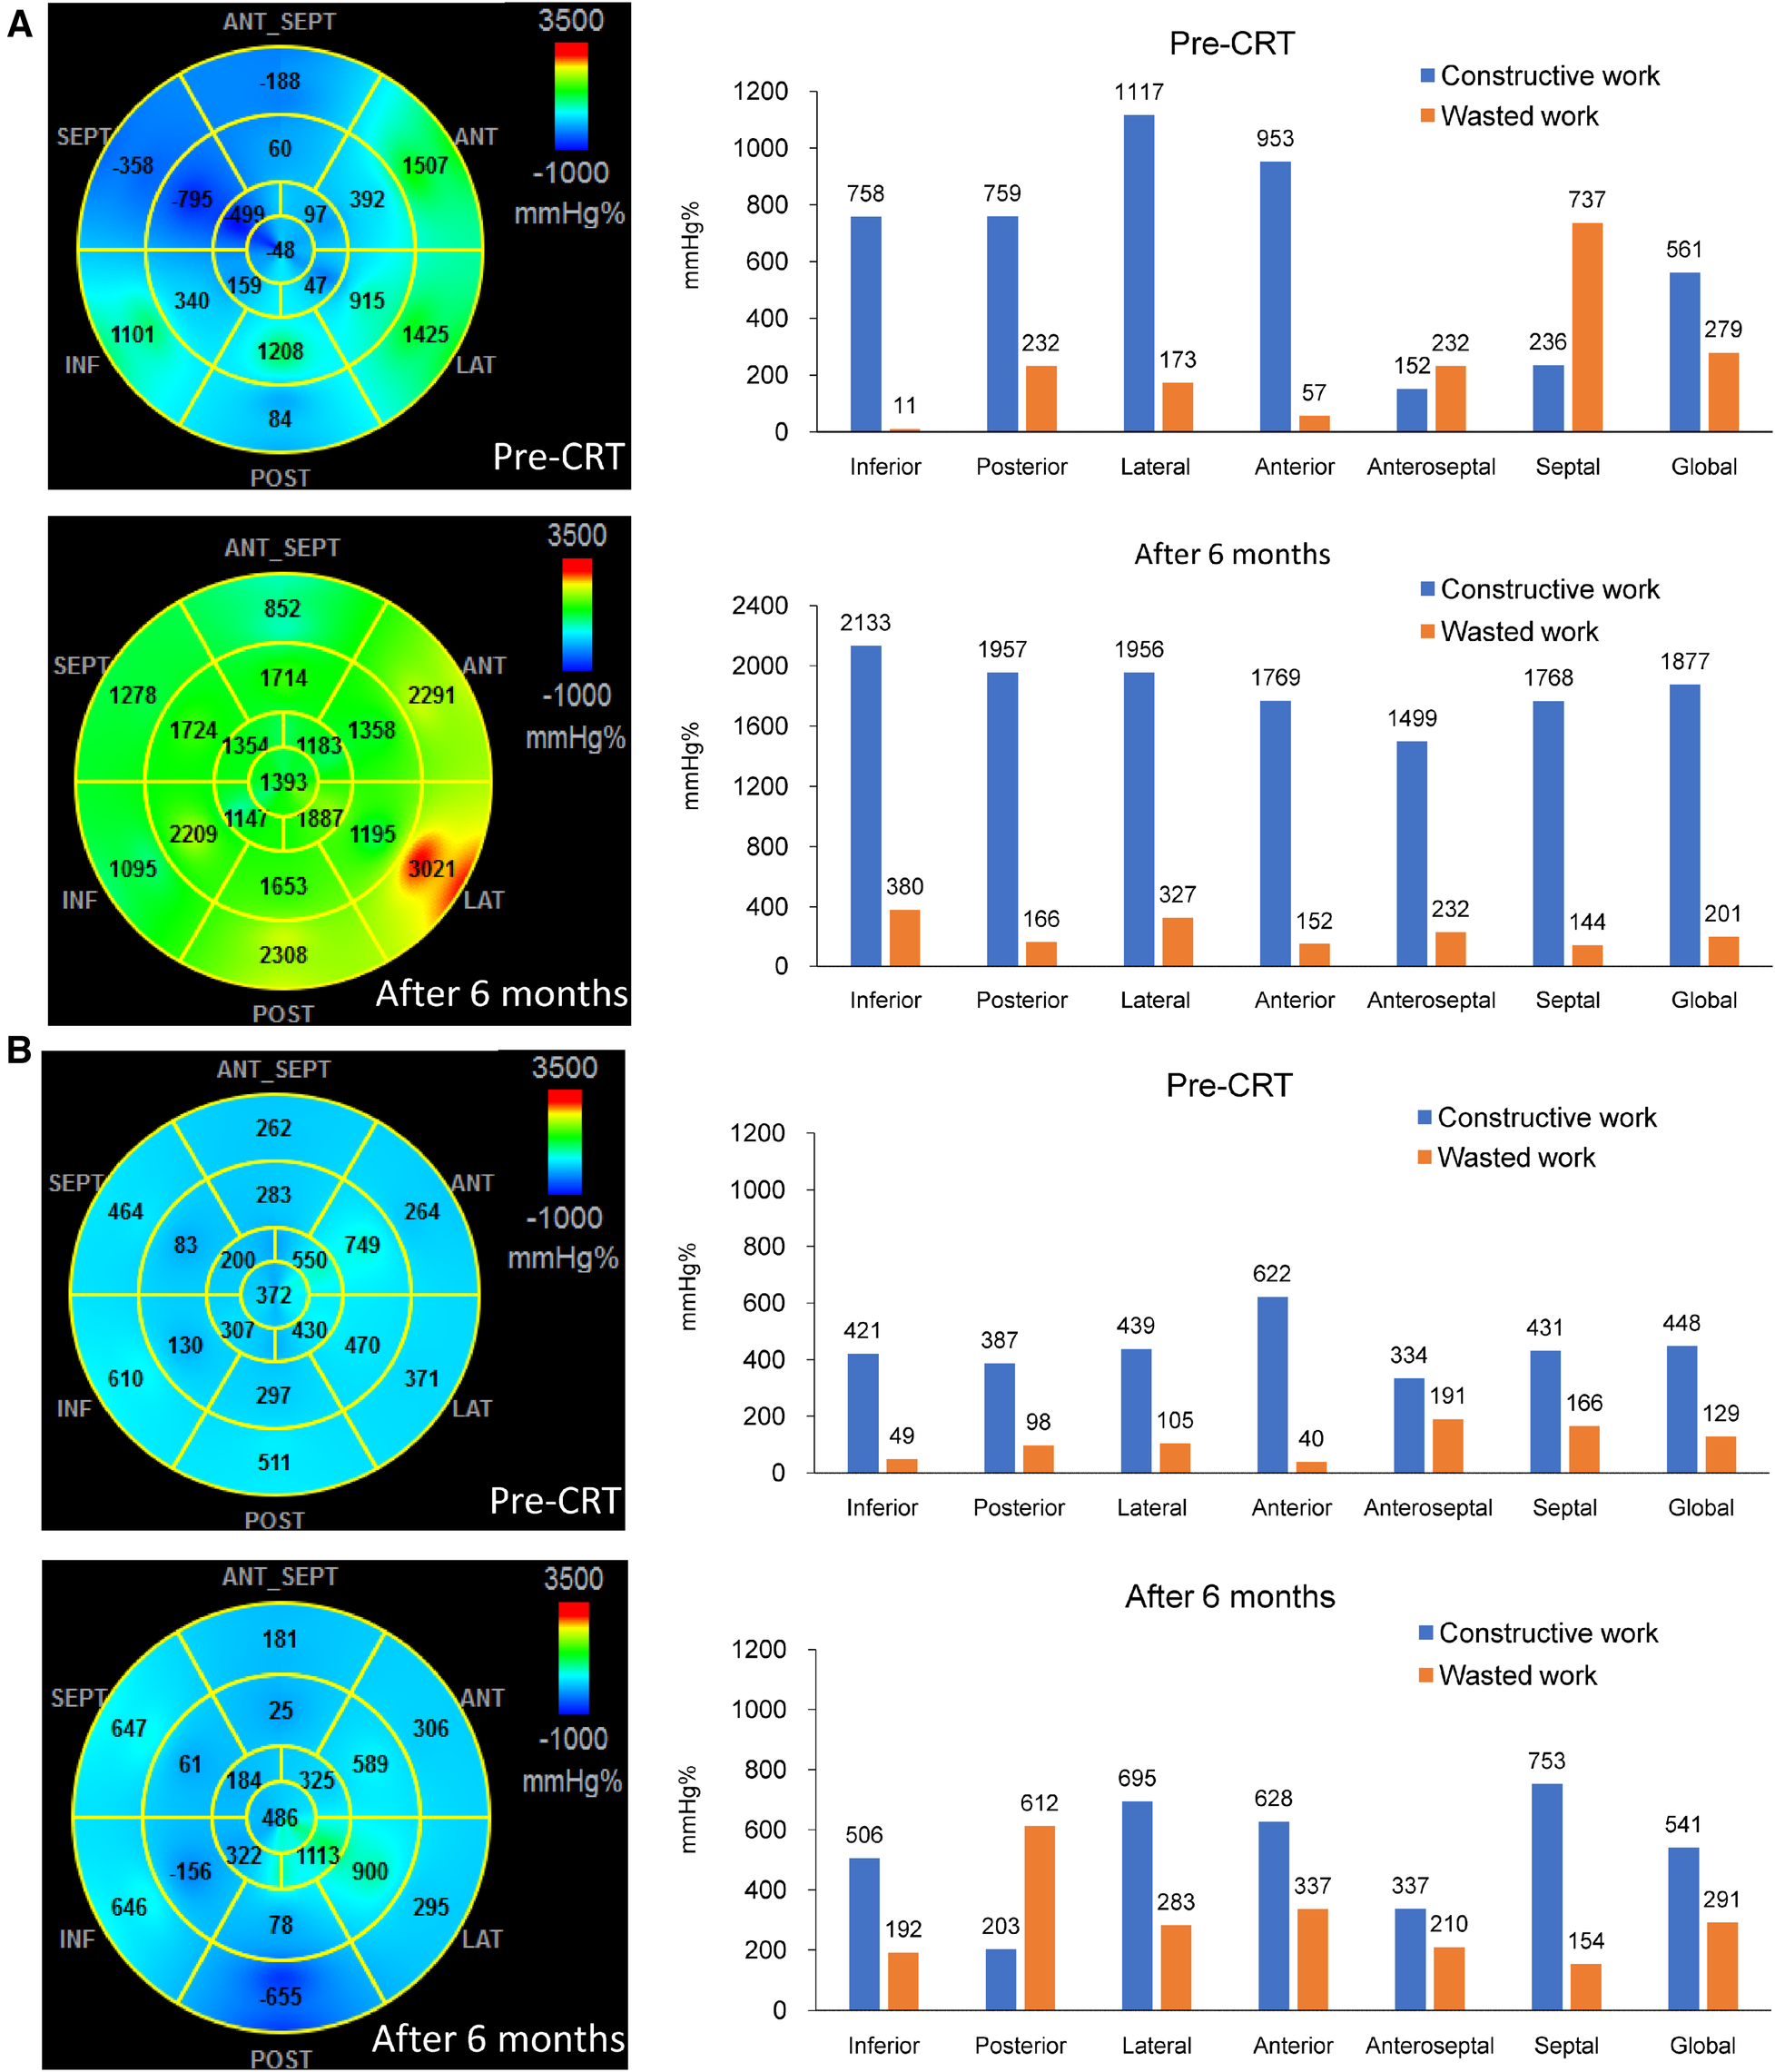
The bull-eye plots and bar charts showing the values of myocardial work, constructive work (CW) and wasted work (WW) before and 6 months after cardiac resynchronization therapy (CRT). In (Panel A), which represents a responder, high values of CW were observed in the lateral wall, while predominant WW was seen in the septum before CRT. Following CRT, there was a significant improvement in septal function, and the septal WW was converted to substantial CW. On the other hand, (Panel B), which represents a non-responder, showed lower values of lateral wall CW and septal WW compared to the responder. After CRT, there was only a moderate improvement in septal function, and noticeable WW was observed in the posterior wall.
Predictive characteristics for reverse remodeling after CRT
Based on the binary definition of reverse remodeling, posterior wall CW, LW CW, anterior wall CW, anteroseptal WW, and septal WW had an AUC greater than that under the line of no information (Table 2). Of the regional CW values, the LW CW varied the most between responders and non-responders [AUC: 0.783, 95% confidence interval (CI) 0.700–0.866, cut-off value 878 mmHg%, sensitivity 72%, specificity 74%]. Of the regional WW values, septal WW varied the most between responders and non-responders (AUC: 0.737, 95% CI: 0.644–0.831, cut-off value: 181 mmHg%, sensitivity 88%, specificity 55%). Combining LW CW and septal WW increased the AUC to 0.832 (95% CI: 0.755–0.908). Figure 2 displays the response rates of patients whose regional CW and WW values met (true-positive rate) or did not meet (false-negative rate) the cut-off values. The results show that LW CW was superior to the other regional CW measures and global CW, with a true-positive rate of 86% and a false-negative rate of 46%. Septal WW was superior to the other regional WW measures and global WW, with a true-positive rate of 81% and a false-negative rate of 32%. The AUCs for global CW and WW were 0.732 (95% CI: 0.639–0.825) and 0.692 (95% CI: 0.589–0.796), respectively. Combining the global CW and WW increased the AUC to 0.759 (95% CI: 0.669–0.850).
Table 2
| Versus ΔESV | Dichotomous reverse remodeling response | |||||
|---|---|---|---|---|---|---|
| CC | p-value | AUC (95% CI) | Cut-off, mmHg% | Sensitivity, % | Specificity, % | |
| Constructive work | ||||||
| Inferior wall | 0.01 | 0.950 | 0.507 (0.400–0.614) | 488 | 67 | 46 |
| Posterior wall | 0.38 | <0.001 | 0.774 (0.692–0.857) | 1,052 | 65 | 76 |
| Lateral wall | 0.35 | <0.001 | 0.783 (0.700–0.866) | 878 | 72 | 74 |
| Anterior wall | 0.23 | 0.009 | 0.720 (0.624–0.816) | 822 | 59 | 79 |
| Anteroseptum | 0.05 | 0.598 | 0.602 (0.502–0.702) | 559 | 44 | 79 |
| Septum | −0.14 | 0.118 | 0.557 (0.451–0.663) | 333 | 64 | 55 |
| Global LV | 0.24 | 0.007 | 0.732 (0.639–0.825) | 635 | 71 | 71 |
| Wasted work | ||||||
| Inferior wall | 0.07 | 0.397 | 0.617 (0.510–0.724) | 136 | 74 | 52 |
| Posterior wall | 0.11 | 0.206 | 0.619 (0.510–0.729) | 236 | 66 | 64 |
| Lateral wall | −0.11 | 0.196 | 0.529 (0.422–0.636) | 232 | 57 | 53 |
| Anterior wall | −0.06 | 0.532 | 0.514 (0.408–0.621) | 132 | 64 | 46 |
| Anteroseptum | 0.24 | 0.005 | 0.650 (0.552–0.748) | 172 | 64 | 67 |
| Septum | 0.33 | <0.001 | 0.737 (0.644–0.831) | 181 | 88 | 55 |
| Global LV | 0.18 | 0.039 | 0.692 (0.589–0.796) | 222 | 71 | 67 |
Predictive characteristics of regional constructive work and wasted work prior to cardiac resynchronization therapy.
AUC, area under the curve; CC, correlation coefficient; ESV, end-systolic volume; LV, left ventricle.
Figure 2
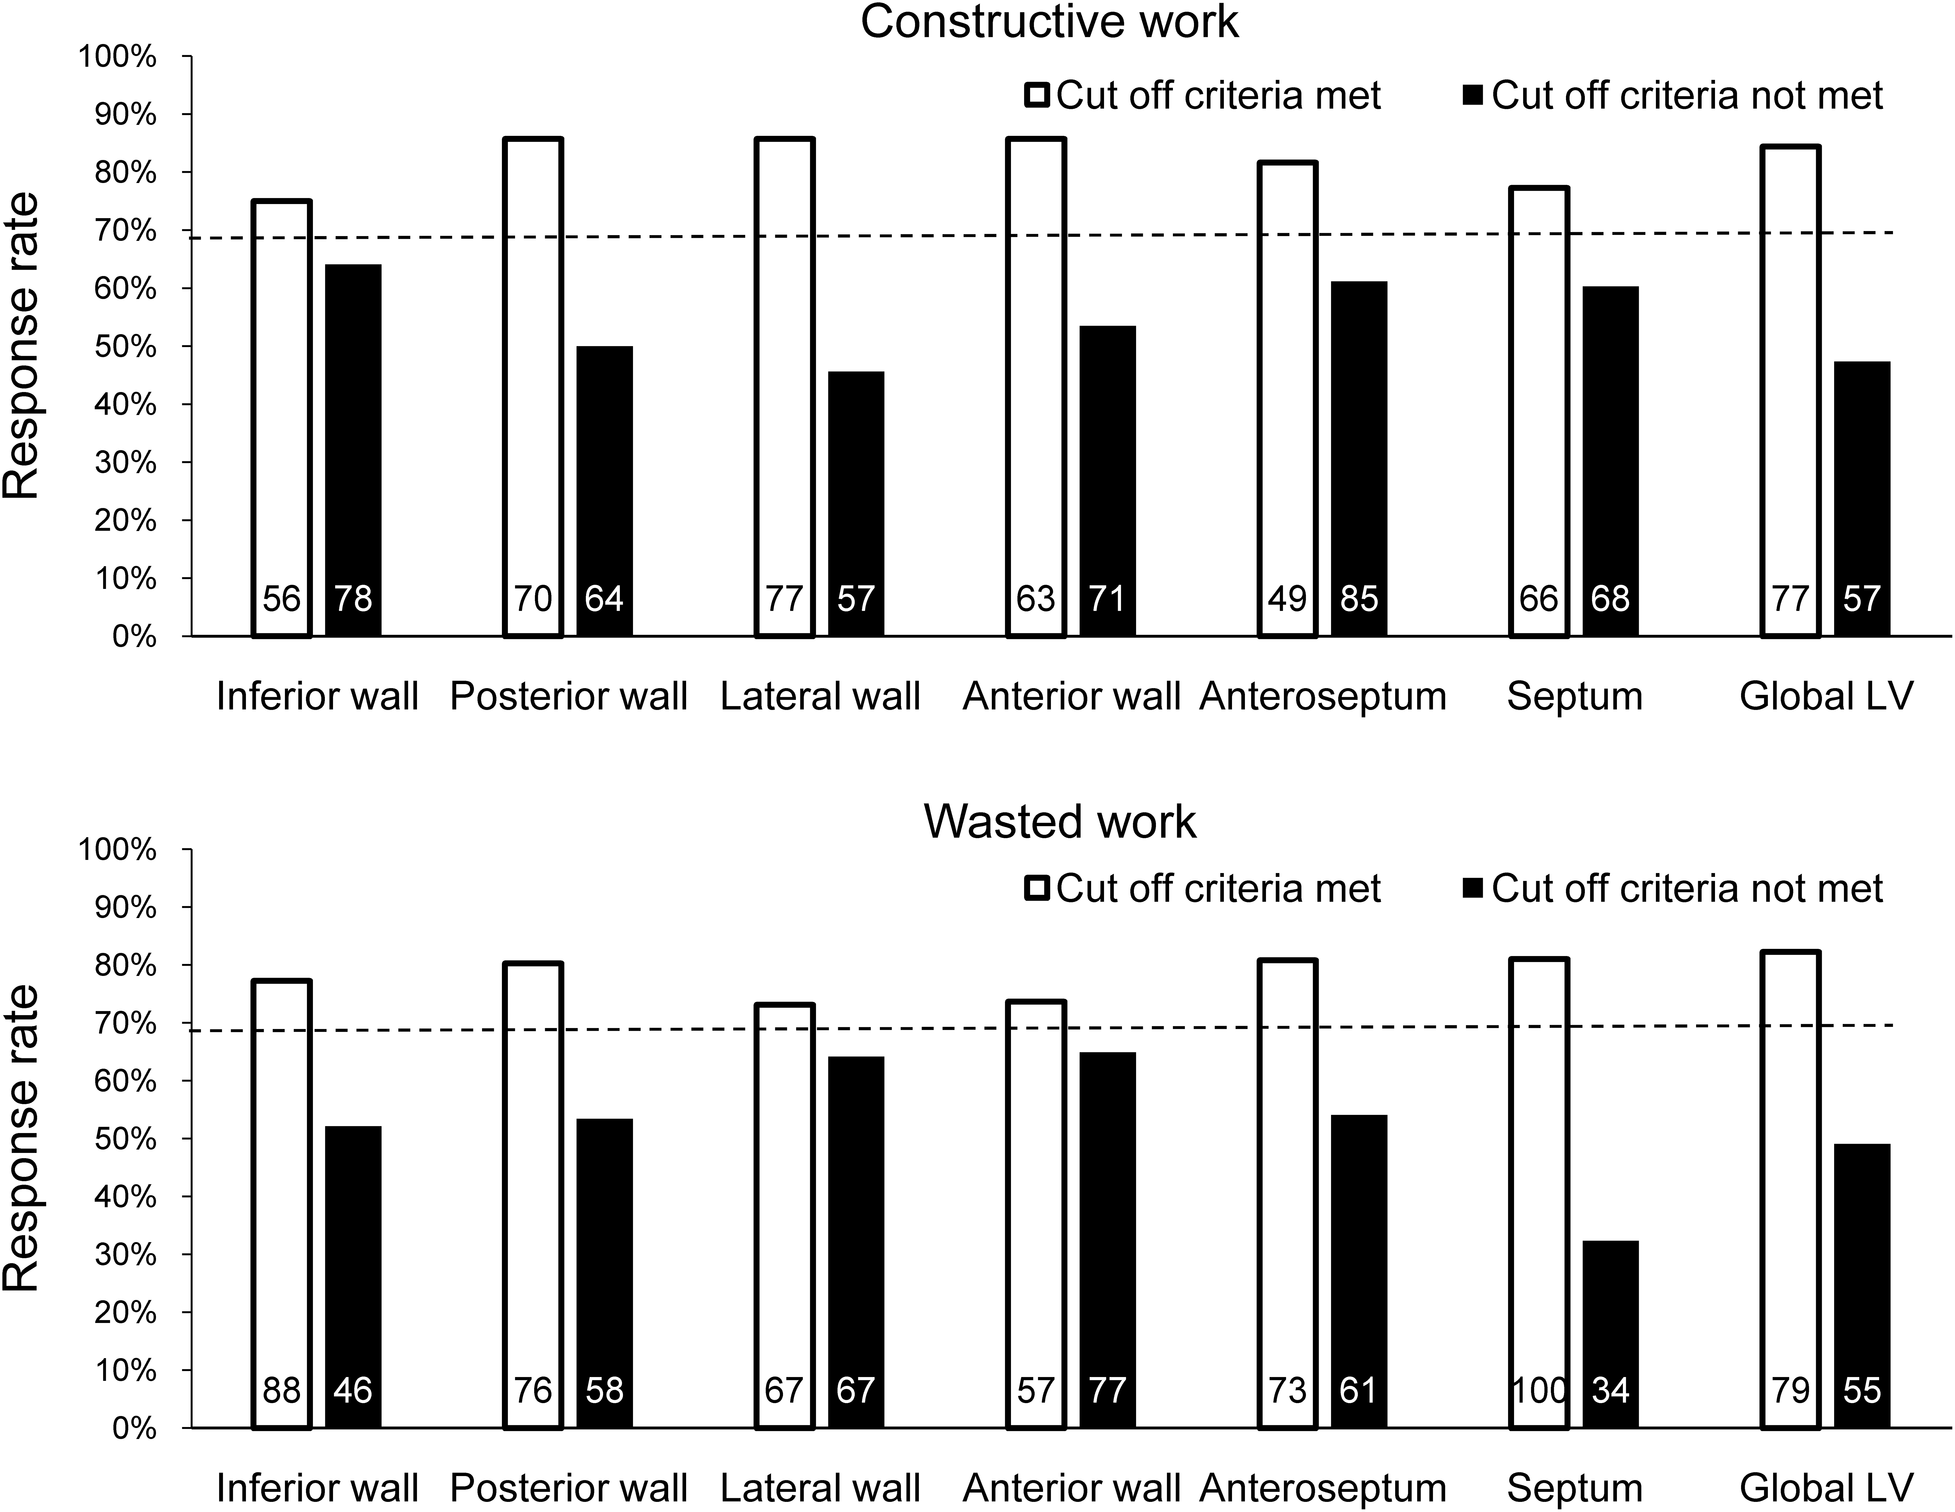
Response rate at 6 months after CRT by determining whether the cut-off value for each CW and WW parameter was met in all patients. The dashed line indicates the response rate observed when ignoring the parameter. The number of patients who met or did not meet the cut-off criterion for each parameter is shown inside each bar.
Variables associated with reverse remodeling
Multivariate analysis, using the significant variables from the univariate analysis (Supplementary Table S2) revealed that non-ischemic etiology and LV end-diastolic volume were independently associated with reverse remodeling, and they were thus included in the baseline model (χ2 = 26.7, Table 3). We then added the CW (lateral and global) and/or WW (septal and global) parameters to the model. The LW CW [odds ratio (OR) 1.26, 95% CI: 1.10–1.44 per 100-mmHg% increase] and septal WW (OR 1.33, 95% CI: 1.07–1.66 per 100-mmHg% increase) were both independently associated with reverse remodeling. Model power improved when LW CW (χ2 difference: 24.4, p < 0.001) and septal WW (χ2 difference 17.2, p < 0.001) were added to the model. In contrast, global CW and WW were not independently associated with reverse remodeling when LW CW or septal WW was included in the model. The addition of LW CW >878 mmHg% (OR 4.09; 95% CI: 1.44–11.62) and septal WW >181 mmHg% (OR 7.37; 95% CI: 2.64–20.63) to a baseline model including non-ischemic etiology and LV end-diastolic volume significantly increased model power (Figure 3). There were 66 patients (49%) with both LW CW >878 mmHg% and septal WW >181 mmHg%. Of this group, 29% (n = 19) showed ischemic cardiomyopathy, which was a significantly smaller proportion than was observed in the other group (p = 0.044). This presence of both LW CW >878 mmHg% and septal WW >181 mmHg% was associated with a high response rate (91%). There were 23 patients (17%) with both LW CW ≤878 mmHg% and septal WW ≤181 mmHg%. Their response rate was only 21%. The response rate in the 45 patients (34%) who had either LW CW >878 mmHg% or septal WW >181 mmHg% was 60%.
Table 3
| Baseline model | Baseline model + global CW + global WW | Baseline model + global CW + LW CW | Baseline model + global WW + septal WW | Baseline model + LW CW + septal WW | ||||||
|---|---|---|---|---|---|---|---|---|---|---|
| OR (95% CI) | p-value | OR (95% CI) | p-value | OR (95% CI) | p-value | OR (95% CI) | p-value | OR (95% CI) | p-value | |
| Non-ischemic etiology | 5.76 (2.52–13.15) | <0.001 | 6.62 (2.67–16.41) | <0.001 | 6.65 (2.61–16.94) | <0.001 | 4.99 (2.06–12.12) | <0.001 | 5.64 (2.16–14.73) | <0.001 |
| LVEDV, per 10 ml | 0.92 (0.86–0.98) | 0.008 | 0.97 (0.91–1.04) | 0.433 | 0.98 (0.91–1.05) | 0.486 | 0.91 (0.85–0.97) | 0.005 | 0.96 (0.90–1.03) | 0.293 |
| Global CW per 100-mmHg% | 1.32 (1.09–1.56) | 0.005 | 0.89 (0.67–1.18) | 0.399 | ||||||
| Global WW per 100-mmHg% | 1.46 (1.00–2.13) | 0.049 | 0.84 (0.50–1.42) | 0.518 | ||||||
| LW CW, per 100-mmHg% | 1.41 (1.15–1.72) | 0.001 | 1.26 (1.10–1.44) | 0.001 | ||||||
| Septal WW, per 100-mmHg% | 1.54 (1.17–2.04) | 0.002 | 1.33 (1.07–1.55) | 0.011 | ||||||
Variables associated with CRT response in the baseline model and after addition of constructive work and wasted work parameters.
CI, confidence interval; CW, constructive work; LVEDV, left ventricular end-diastolic volume; LW, lateral wall; OR, odds ratio; WW, wasted work.
Figure 3
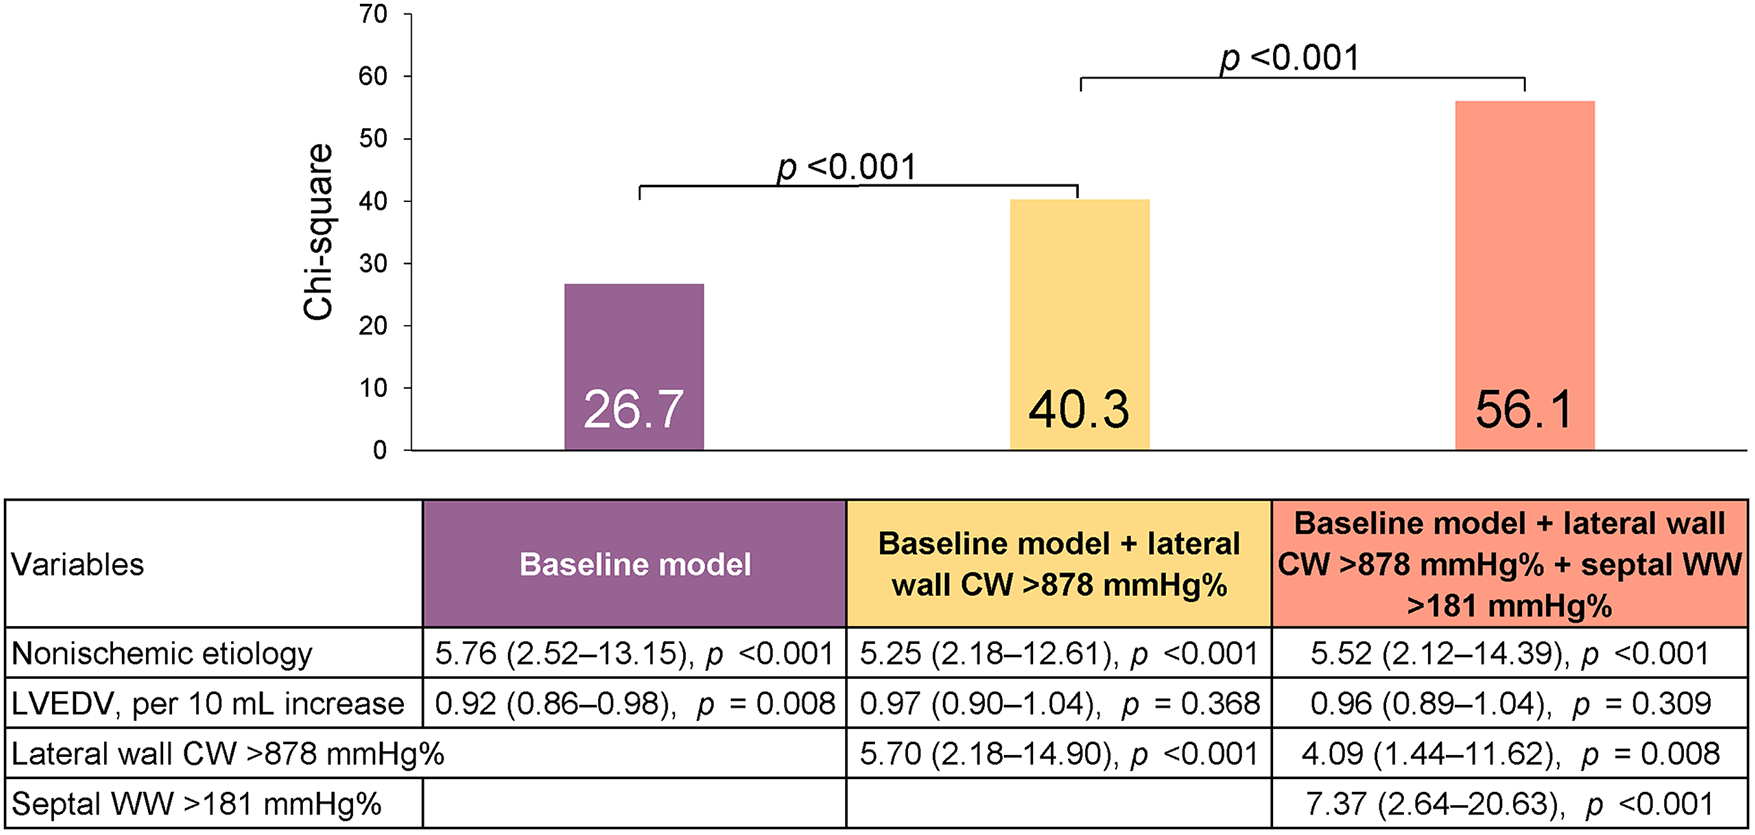
Predicting reverse remodeling after CRT. Model χ2 values are presented for a series of nested models. The baseline model included non-ischemic etiology and left ventricular end-diastolic volume (LVEDV).
Event-free survival
Figure 4 displays the Kaplan–Meier curves dichotomized according to LW CW ≤878 mmHg% (log-rank p = 0.024) and septal WW ≤181 mmHg% (log-rank p = 0.001). Both CW ≤878 mmHg% (HR 2.01; 95% CI: 1.07–3.79, p = 0.031) and septal WW ≤181 mmHg% (HR 2.60; 95% CI: 1.38–4.90; p = 0.003) were significant predictors of combined all-cause death and hospitalization due to HF at two-year follow-up. Figure 5 displays the Kaplan–Meier curves stratified by the combined LW CW and septal WW parameters. Patients categorized in the “both” group, characterized by both LW CW >878 mmHg% and septal WW >181 mmHg%, demonstrated the most favorable outcomes in terms of combined all-cause death and HF hospitalization. Conversely, individuals in the “neither” group, characterized by neither LW CW >878 mmHg% nor septal WW >181 mmHg %, exhibited the worst outcomes. Patients in the “either” group, with only one parameter meeting the criteria, were positioned between the “both” and “neither” groups in terms of their outcomes.
Figure 4
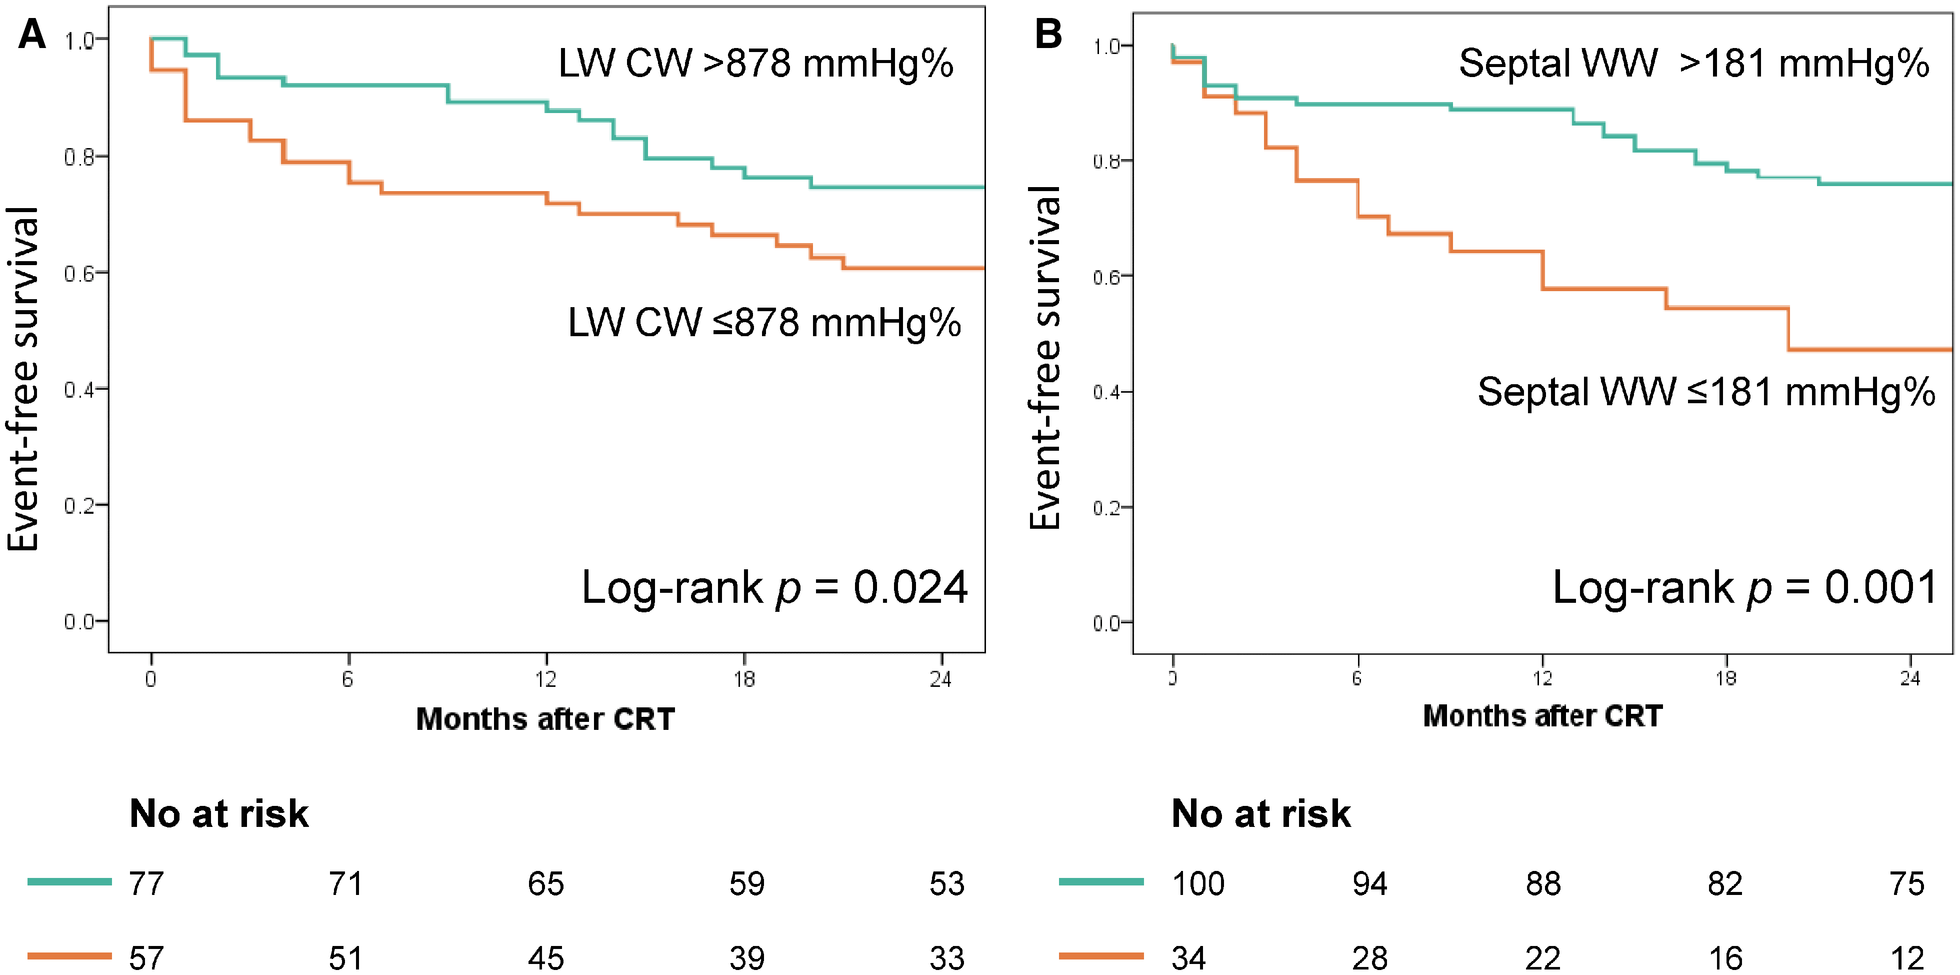
Association of lateral wall (LW) CW and septal WW with event-free survival. The Kaplan–Meier curves were stratified based on the cut-off values for LW CW (878 mmHg%, Panel A) and septal WW (181 mmHg%, Panel B).
Figure 5
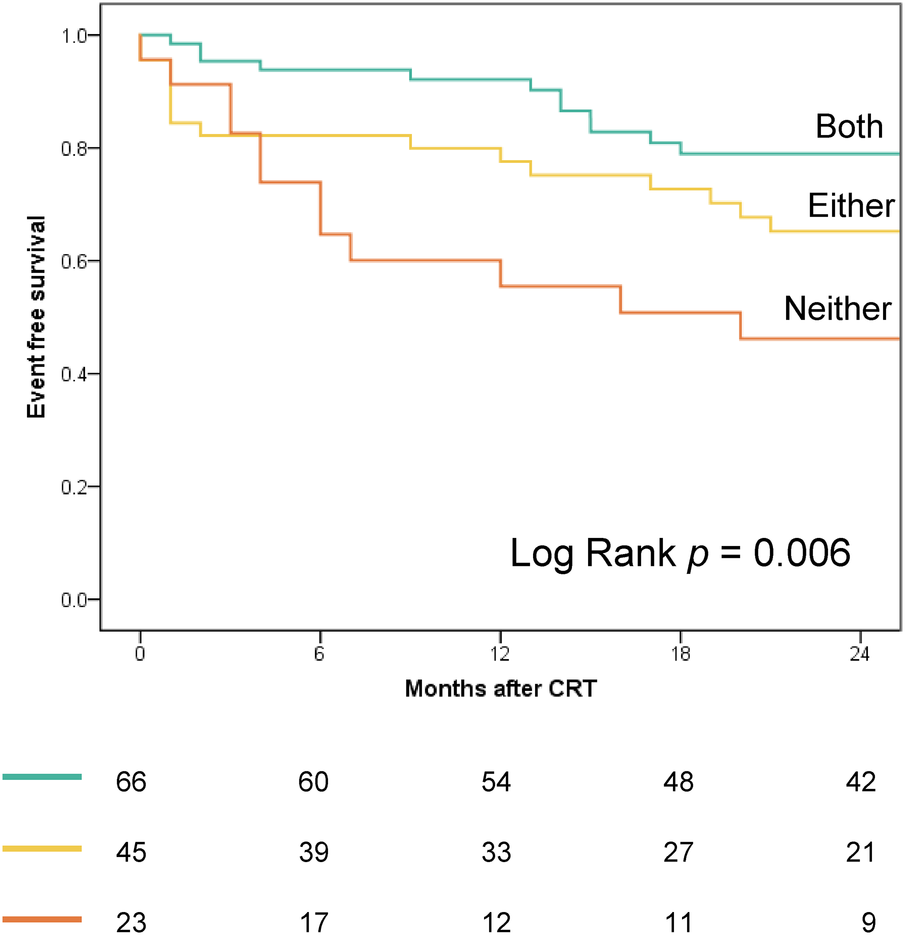
Kaplan–Meier curves, stratified by combined LW CW and septal WW parameters, depict outcomes for combined all-cause death and heart failure hospitalization. “Both” group: LW CW >878 mmHg% and septal WW >181 mmHg; “Either” group: LW CW >878 mmHg% or septal WW >181 mmHg (but not both); “Neither” group: Neither CW >878 mmHg% nor septal WW >181 mmHg.
Alternative approaches
Septal flash, apical rocking, and LBBB strain pattern predicted reverse remodeling with AUC values of 0.729 (95% CI: 0.632–0.826), 0.732 (95% CI: 0.633–0.832), and 0.753 (95% CI: 0.659–0.847), respectively (Table 4). There were no significant differences when comparing the AUC for work difference (0.780; 95% CI: 0.698–0.863) with septal flash (p = 0.291) or apical rocking (p = 0.386). In contrast, the combination of LW CW and septal WW (AUC: 0.832; 95% CI: 0.755–0.908) was superior to septal flash (p = 0.029) and apical rocking (p = 0.035) in predicting reverse remodeling. Furthermore, in multivariate logistic regression analysis, combining LW CW and septal WW (odds ratio 1.23; 95% CI: 1.02–1.49) but not work difference (odds ratio 0.90; 95% CI: 0.72–1.13) was an independent factor associated with reverse remodeling (Table 5).
Table 4
| Compared with work difference | Compared with lateral CW + 1.5 × septal WW | ||||
|---|---|---|---|---|---|
| AUC (95% CI) | Difference in AUC (95% CI) | p-value | Difference in AUC (95% CI) | p-value | |
| Septal flash | 0.729 (0.632–0.826) | 0.051 (−0.044 to 0.146) | 0.291 | 0.102 (0.011 to 0.194) | 0.029 |
| Apical rocking | 0.732 (0.633–0.832) | 0.048 (−0.060 to 0.156) | 0.386 | 0.099 (0.007 to 0.191) | 0.035 |
| LBBB strain pattern | 0.753 (0.659–0.847) | 0.027 (−0.060 to 0.115) | 0.541 | 0.079 (−0.008 to 0.165) | 0.075 |
| Work difference | 0.780 (0.698–0.863) | — | 0.051 (−0.006 to 0.108) | 0.077 | |
| LW CW + 1.5 × septal WW | 0.832 (0.755–0.908) | — | — | ||
Comparison of the area under the curves for predicting reverse remodeling after CRT.
LW, lateral wall; CW, constructive work; WW, wasted work.
Table 5
| Regression variable | OR | 95% CI | p-value |
|---|---|---|---|
| LV end-diastolic volume per 10-ml increase | 0.93 | 0.86–1.01 | 0.067 |
| Non-ischemic etiology | 3.88 | 1.30–11.59 | 0.015 |
| Septal flash | 1.76 | 0.56–5.55 | 0.337 |
| Apical rocking | 2.42 | 0.70–8.35 | 0.161 |
| LBBB strain pattern | 3.66 | 1.05–12.79 | 0.042 |
| Work difference, per 100-mmHg% increase | 0.90 | 0.72–1.13 | 0.364 |
| LW CW + 1.5 × septal WW, per 100-mmHg% increase | 1.23 | 1.02–1.49 | 0.033 |
Multivariate logistic regressiona analysis with LV reverse remodeling as dependent variable.
CI, confidence interval; CW, constructive work; LW, lateral wall; OR, odds ratio; WW, wasted work.
N = 134, Cox and Snell R2 = 0.415.
Signs of mechanical dyssynchrony and LW CW & septal WW
Patients with septal flash exhibited significantly elevated LW CW values (1,113 ± 459 mmHg% vs. 848 ± 517 mmHg%, p < 0.001) and septal WW values (486 ± 271 mmHg% vs. 245 ± 225 mmHg%, p = 0.003) compared to those without this characteristic. Similarly, patients with apical rocking displayed notably higher LW CW values (1,095 ± 459 mmHg% vs. 846 ± 537 mmHg%, p < 0.001) and septal WW values (488 ± 275 mmHg% vs. 193 ± 149 mmHg%, p = 0.008) than those without.
Non-ischemic and ischemic patient subgroups
There were no significant differences in LW CW (1,057 ± 471 mmHg% vs. 975 ± 527 mmHg%; p = 0.353) and septal WW (438 ± 278 mmHg% vs. 355 ± 280 mmHg%; p = 0.098) between non-ischemic and ischemic patients. In patients with non-ischemic etiology, LW CW and septal WW were correlated with the reductions in LV ESV and had high AUC values (LW CW: 0.827, 95% CI: 0.693–0.961; septal WW: 0.761, 95% CI: 0.627–0.896; Supplementary Table S3). Including both LW CW and septal WW in the model increased the AUC to 0.875 (95% CI: 0.753–0.998). In patients with ischemic etiology, LW CW rather than septal WW was correlated with reductions in LV ESV. LW CW (AUC: 0.749; 95% CI: 0.617–0.892) and septal WW (AUC: 0.704; 95% CI: 0.559–0.848) varied between responders and non-responders. Including both LW CW and septal WW in the model increased the AUC to 0.771 (95% CI: 0.642–0.901).
Inter- and intra-observer variability and reproducibility
Calculations of LW CW and septal WW in 20 patients by two independent observers differed on average by 109 mmHg% and 74 mmHg%, respectively. Repeat calculations these measures by the same observer differed on average by 95 mmHg% and 57 mmHg%, respectively. The intraclass correlation coefficient between the two observers was 0.96 (95% CI: 0.89–0.98) and 0.97 (95% CI: 0.92–0.99) for LW CW and septal WW, respectively. The intra-observer intraclass correlation coefficient was 0.98 (95% CI: 0.95–0.99) and 0.97 (95% CI: 0.94–0.99) for LW CW and septal WW, indicating good reproducibility.
Discussion
This study extends prior researches on myocardial work and presents the novel finding that the assessment of regional CW and WW via non-invasive pressure–strain loops can offer valuable prognostic insights for individuals who were being considered for CRT. Prior to CRT, LW CW and septal WW were significantly correlated with the reductions in LV ESV after CRT and independently predicted reverse remodeling and clinical outcomes after CRT. Global CW and WW were similarly correlated with the extent of reverse remodeling; however, they did not independently predict reverse remodeling when LW CW and septal WW were taken into account. The latter two measures were useful for predicting CRT response among both ischemic and non-ischemic patients.
The rationale for using LW CW and septal WW to predict CRT outcomes is that electrical conduction delay in the failing heart provokes discoordinate contraction between the early-activated septum and the late-activated LW. In patients with HF and LBBB, the ventricular septum contracts early during the isovolumic contraction phase, and during ejection, the out-of-phase septal relaxation counteracts LV free wall contraction. Regional CW quantifies the work performed during systolic shortening and negative work while lengthening during isovolumic relaxation, and reflects the contractile reserve. Regional WW computes the amount of negative work performed while lengthening during systole and work performed while shortening during isovolumic relaxation, and reflects energy waste caused by mechanical dyssynchrony. CRT can recruit myocardial work that is internally wasted by discoordinate contraction, and assessing the LW CW and septal WW facilitates identification of the contractile reserve and recruitable substrate that are amenable to CRT.
Previous studies have shown the prognostic value of global CW and WW in CRT candidates (12–15). In a study of 97 patients undergoing CRT, global CW was associated with CRT response and was significantly correlated with the reductions in LV ESV after CRT (12). Despite higher values of LW CW and septal WW in responders, neither measure was independently associated with CRT response after adjusting for global CW and septal flash (12). Two studies have shown the ability of global WW to predict response to CRT (14, 15). One study found that combining global CW greater than 1,057 mmHg% and global WW greater than 364 mmHg% had a high specificity but low sensitivity for predicting CRT response (14). Another study involving 249 patients with HF found that a pre-CRT GWW of less than 200 mmHg% was associated with a high risk of all-cause mortality and CRT non-response (15). In our study, higher values of global CW and WW before CRT were associated with CRT response. Of the regional CW and WW values, LW CW and septal WW best distinguished CRT responders from non-responders. LW CW and septal WW performed better than global CW and global WW, respectively, with respect to reverse remodeling. This finding differs from the aforementioned study by Galli et al. (12). One possible reason for this discrepancy is that global measures of CW and WW, derived from the average of all segments, may lose significant information that is embedded in the nonhomogeneous distribution of regional CW and WW in CRT candidates. Our results agree with the results of two other studies that separately showed the prognostic value of LW CW or septal WW in patients undergoing CRT (16, 19). In a brief report on 168 CRT candidates, LW CW rather than septal WW was independently associated with CRT response, and a LW CW >881 mmHg% was associated with a 2.2-fold increase in CRT response odds (16). In a small study of 21 patients receiving CRT, septal WW rather than global WW was the only myocardial work factor that predicted LV ESV reductions after CRT (19). However, the definition of septal WW, negative work in percentage of positive work, differs from ours (19).
In the present study, we found that septal WW was less related to reverse remodeling after CRT in patients with ischemic cardiomyopathy. Distinguishing between systolic lengthening of the septum due to transmural scar and septal systolic stretching resulting from LBBB, presents a challenge. Consequently, the similarity in septal WW between patients with myocardial scar and patients with electrical conduction delay may account for the weaker association of septal WW with reverse remodeling after CRT in patients with ischemic cardiomyopathy. The considerable variability in the extent of septal WW among patients with LBBB likely reflects, at least in part, this mixed etiology of systolic lengthening.
The use in clinical practice of myocardial work assessment derived from non-invasive pressure–strain loops for prognostic and clinical decision-making purposes is increasing (17, 20–26). The reliability of non-invasive measures of myocardial work in comparison to invasive measures has been validated in experimental evaluations and computer simulations (18, 27). In the present study, the combined approach of LW CW and septal WW offers a clinically feasible and relatively simple method for identifying CRT responders. Both parameters were measured from the basal- and mid-segments of the LW and septum in the apical four-chamber view, which can be obtained for all patients. Evaluating LW CW and septal WW incorporates the assessment of contractile reserve and energy waste, which are key factors determining the response to CRT.
Limitations
This study has some limitations. Firstly, it is a single-center study, which may limit the generalization of its findings to clinical practice. Secondly, the lack of a validation cohort to examine the results further limits its generalizability. Thirdly, to assess myocardial work, a vendor-specific module (EchoPAC, GE) that combines LV strain data with a non-invasive LV pressure curve is required. Lastly, the study did not evaluate septal viability, and it is unclear whether it provides additional valve over septal WW and LW CW. Further study may be needed to address this issue.
Conclusion
This study revealed that LW CW and septal WW before CRT, assessed based on pressure–strain loops, predicted reverse remodeling and clinical outcomes after CRT. These two measurements reliably identified potential CRT responders in both ischemic and non-ischemic patients, and may better identifying CRT responders than the work difference between septum and LW.
Statements
Data availability statement
The raw data supporting the conclusions of this article will be made available by the authors, without undue reservation.
Ethics statement
The studies involving humans were approved by Chang Gung Medical Foundation Institutional Review Board. The studies were conducted in accordance with the local legislation and institutional requirements. The participants provided their written informed consent to participate in this study.
Author contributions
CL-W: Writing – review & editing, Writing – original draft, Methodology, Investigation, Funding acquisition, Formal Analysis, Conceptualization. L-SW: Writing – review & editing, Methodology, Investigation, Data curation, Conceptualization. C-TW: Writing – review & editing, Methodology, Data curation. Y-HY: Writing – review & editing, Methodology, Data curation. Y-WC: Writing – review & editing, Methodology, Data curation. K-CY: Writing – review & editing, Methodology, Data curation. Y-HC: Writing – review & editing. CC: Writing – review & editing. C-TK: Writing – review & editing. P-HC: Writing – review & editing.
Funding
The author(s) declare financial support was received for the research, authorship, and/or publication of this article.
This research funding was supported by the research grants from the Chang Gung Memorial Hospital (CMRPG3H1811) and Ministry of Science and Technology of Taiwan (MOST 108-2314-B-182A-147-MY2).
Acknowledgments
We would like to thank Uni-edit (www.uni-edit.net) for editing and proofreading this manuscript.
Conflict of interest
The authors declare that the research was conducted in the absence of any commercial or financial relationships that could be construed as a potential conflict of interest.
Publisher’s note
All claims expressed in this article are solely those of the authors and do not necessarily represent those of their affiliated organizations, or those of the publisher, the editors and the reviewers. Any product that may be evaluated in this article, or claim that may be made by its manufacturer, is not guaranteed or endorsed by the publisher.
Supplementary material
The Supplementary Material for this article can be found online at: https://www.frontiersin.org/articles/10.3389/fcvm.2024.1301140/full#supplementary-material
References
1.
Cleland JG Abraham WT Linde C Gold MR Young JB Claude Daubert J et al An individual patient meta-analysis of five randomized trials assessing the effects of cardiac resynchronization therapy on morbidity and mortality in patients with symptomatic heart failure. Eur Heart J. (2013) 34(46):3547–56. 10.1093/eurheartj/eht290
2.
Prinzen FW Vernooy K Auricchio A . Cardiac resynchronization therapy: state-of-the-art of current applications, guidelines, ongoing trials, and areas of controversy. Circulation. (2013) 128(22):2407–18. 10.1161/circulationaha.112.000112
3.
Bax JJ Bleeker GB Marwick TH Molhoek SG Boersma E Steendijk P et al Left ventricular dyssynchrony predicts response and prognosis after cardiac resynchronization therapy. J Am Coll Cardiol. (2004) 44(9):1834–40. 10.1016/j.jacc.2004.08.016
4.
Pitzalis MV Iacoviello M Romito R Massari F Rizzon B Luzzi G et al Cardiac resynchronization therapy tailored by echocardiographic evaluation of ventricular asynchrony. J Am Coll Cardiol. (2002) 40(9):1615–22. 10.1016/s0735-1097(02)02337-9
5.
Suffoletto MS Dohi K Cannesson M Saba S Gorcsan J III . Novel speckle-tracking radial strain from routine black-and-white echocardiographic images to quantify dyssynchrony and predict response to cardiac resynchronization therapy. Circulation. (2006) 113(7):960–8. 10.1161/circulationaha.105.571455
6.
Chung ES Leon AR Tavazzi L Sun JP Nihoyannopoulos P Merlino J et al Results of the predictors of response to CRT (PROSPECT) trial. Circulation. (2008) 117(20):2608–16. 10.1161/circulationaha.107.743120
7.
Ruschitzka F Abraham WT Singh JP Bax JJ Borer JS Brugada J et al Cardiac-resynchronization therapy in heart failure with a narrow qrs complex. N Engl J Med. (2013) 369(15):1395–405. 10.1056/NEJMoa1306687
8.
Kass DA . An epidemic of dyssynchrony: but what does it mean?J Am Coll Cardiol. (2008) 51(1):12–7. 10.1016/j.jacc.2007.09.027
9.
Lumens J Leenders GE Cramer MJ De Boeck BW Doevendans PA Prinzen FW et al Mechanistic evaluation of echocardiographic dyssynchrony indices: patient data combined with multiscale computer simulations. Circ Cardiovasc Imaging. (2012) 5(4):491–9. 10.1161/circimaging.112.973446
10.
Stankovic I Prinz C Ciarka A Daraban AM Kotrc M Aarones M et al Relationship of visually assessed apical rocking and septal flash to response and long-term survival following cardiac resynchronization therapy (PREDICT-CRT). Eur Heart J Cardiovasc Imaging. (2016) 17(3):262–9. 10.1093/ehjci/jev288
11.
Risum N Tayal B Hansen TF Bruun NE Jensen MT Lauridsen TK et al Identification of typical left bundle branch block contraction by strain echocardiography is additive to electrocardiography in prediction of long-term outcome after cardiac resynchronization therapy. J Am Coll Cardiol. (2015) 66(6):631–41. 10.1016/j.jacc.2015.06.020
12.
Galli E Leclercq C Hubert A Bernard A Smiseth OA Mabo P et al Role of myocardial constructive work in the identification of responders to CRT. Eur Heart J Cardiovasc Imaging. (2018) 19(9):1010–8. 10.1093/ehjci/jex191
13.
Galli E Hubert A Le Rolle V Hernandez A Smiseth OA Mabo P et al Myocardial constructive work and cardiac mortality in resynchronization therapy candidates. Am Heart J. (2019) 212:53–63. 10.1016/j.ahj.2019.02.008
14.
Galli E Leclercq C Fournet M Hubert A Bernard A Smiseth OA et al Value of myocardial work estimation in the prediction of response to cardiac resynchronization therapy. J Am Soc Echocardiogr. (2018) 31(2):220–30. 10.1016/j.echo.2017.10.009
15.
Riolet C Menet A Mailliet A Binda C Altes A Appert L et al Clinical significance of global wasted work in patients with heart failure receiving cardiac resynchronization therapy. J Am Soc Echocardiogr. (2021) 34(9):976–86. 10.1016/j.echo.2021.06.008
16.
Kostyukevich MV van der Bijl P Vo NM Lustosa RP Pio SM Bootsma M et al Regional left vntricular myocardial work indices and response to cardiac resynchronization therapy. JACC Cardiovasc Imaging. (2020) 13(8):1852–4. 10.1016/j.jcmg.2020.03.006
17.
Aalen JM Donal E Larsen CK Duchenne J Lederlin M Cvijic M et al Imaging predictors of response to cardiac resynchronization therapy: left ventricular work asymmetry by echocardiography and septal viability by cardiac magnetic resonance. Eur Heart J. (2020) 41(39):3813–23. 10.1093/eurheartj/ehaa603
18.
Russell K Eriksen M Aaberge L Wilhelmsen N Skulstad H Remme EW et al A novel clinical method for quantification of regional left ventricular pressure-strain loop area: a non-invasive index of myocardial work. Eur Heart J. (2012) 33(6):724–33. 10.1093/eurheartj/ehs016
19.
Vecera J Penicka M Eriksen M Russell K Bartunek J Vanderheyden M et al Wasted septal work in left ventricular dyssynchrony: a novel principle to predict response to cardiac resynchronization therapy. Eur Heart J Cardiovasc Imaging. (2016) 17(6):624–32. 10.1093/ehjci/jew019
20.
Wang CL Chan YH Wu VC Lee HF Hsiao FC Chu PH . Incremental prognostic value of global myocardial work over ejection fraction and global longitudinal strain in patients with heart failure and reduced ejection fraction. Eur Heart J Cardiovasc Imaging. (2021) 22(3):348–56. 10.1093/ehjci/jeaa162
21.
van der Bijl P Vo NM Kostyukevich MV Mertens B Ajmone Marsan N Delgado V et al Prognostic implications of global, left ventricular myocardial work efficiency before cardiac resynchronization therapy. Eur Heart J Cardiovasc Imaging. (2019) 20(12):1388–94. 10.1093/ehjci/jez095
22.
Duchenne J Aalen JM Cvijic M Larsen CK Galli E Bézy S et al Acute redistribution of regional left ventricular work by cardiac resynchronization therapy determines long-term remodelling. Eur Heart J Cardiovasc Imaging. (2020) 21(6):619–28. 10.1093/ehjci/jeaa003
23.
Clemmensen TS Eiskjær H Ladefoged B Mikkelsen F Sørensen J Granstam SO et al Prognostic implications of left ventricular myocardial work indices in cardiac amyloidosis. Eur Heart J Cardiovasc Imaging. (2021) 22(6):695–704. 10.1093/ehjci/jeaa097
24.
Wang J Ni C Yang M Zhang X Ruan B Sun L et al Apply pressure-strain loop to quantify myocardial work in pulmonary hypertension: a prospective cohort study. Front Cardiovasc Med. (2022) 9:1022987. 10.3389/fcvm.2022.1022987
25.
Chen YL Xu TY Xu JZ Zhu LM Li Y Wang JG . A non-invasive left ventricular pressure-strain loop study on myocardial work in primary aldosteronism. Hypertens Res. (2021) 44(11):1462–70. 10.1038/s41440-021-00725-y
26.
Meng Q Li Y Wang S Feng T Xu H Liu J et al Speckle tracking imaging evaluation of left ventricular myocardial work comparing right ventricular septal pacing with his-purkinje system area pacing. Front Cardiovasc Med. (2022) 9:949841. 10.3389/fcvm.2022.949841
27.
Hubert A Le Rolle V Leclercq C Galli E Samset E Casset C et al Estimation of myocardial work from pressure-strain loops analysis: an experimental evaluation. Eur Heart J Cardiovasc Imaging. (2018) 19(12):1372–9. 10.1093/ehjci/jey024
Summary
Keywords
cardiac resynchronization therapy, myocardial work, constructive work, wasted work, reverse remodeling, survival, heart failure
Citation
Wang C-L, Wu L-S, Wu C-T, Yeh Y-H, Cheng Y-W, Yen K-C, Chan Y-H, Chuang C, Kuo C-T and Chu P-H (2024) Clinical significance of regional constructive and wasted work in patients receiving cardiac resynchronization therapy. Front. Cardiovasc. Med. 11:1301140. doi: 10.3389/fcvm.2024.1301140
Received
24 September 2023
Accepted
22 February 2024
Published
06 March 2024
Volume
11 - 2024
Edited by
Michael Brunner, Artemed Kliniken Freiburg, Germany
Reviewed by
Donna Shu-Han Lin, Shin Kong Wu Ho-Su Memorial Hospital, Taiwan
Jean-benoît Le Polain de Waroux, AZ Sint-Jan Brugge-Oostende AV, Belgium
Updates
Copyright
© 2024 Wang, Wu, Wu, Yeh, Cheng, Yen, Chan, Chuang, Kuo and Chu.
This is an open-access article distributed under the terms of the Creative Commons Attribution License (CC BY). The use, distribution or reproduction in other forums is permitted, provided the original author(s) and the copyright owner(s) are credited and that the original publication in this journal is cited, in accordance with accepted academic practice. No use, distribution or reproduction is permitted which does not comply with these terms.
* Correspondence: Chun-Li Wang wang3015@cgmh.org.tw; wang3015001@gmail.com
Disclaimer
All claims expressed in this article are solely those of the authors and do not necessarily represent those of their affiliated organizations, or those of the publisher, the editors and the reviewers. Any product that may be evaluated in this article or claim that may be made by its manufacturer is not guaranteed or endorsed by the publisher.